
Abstract
Background
Metal implants may introduce severe artifacts in computed tomography (CT) images. Over the last few years dedicated algorithms have been developed in order to reduce metal artifacts in CT images.
Purpose
To investigate and compare metal artifact reduction algorithms (MARs) from four different CT vendors when imaging three different orthopedic metal implants.
Material and Methods
Three clinical metal implants were attached to the leg of an anthropomorphic phantom: cobalt-chrome; stainless steel; and titanium. Four commercial MARs were investigated: SmartMAR (GE); O-MAR (Philips); iMAR (Siemens); and SEMAR (Toshiba). The images were evaluated subjectively by three observers and analyzed objectively by calculating the fraction of pixels with CT number above 500 HU in a region of interest around the metal. The average CT number and image noise were also measured.
Results
Both subjective evaluation and objective analysis showed that MARs reduced metal artifacts and improved the image quality for CT images containing metal implants of steel and cobalt-chrome. When using MARs on titanium, all MARs introduced new visible artifacts.
Conclusion
The effect of MARs varied between CT vendors and different metal implants used in orthopedic surgery. Both in subjective evaluation and objective analysis the effect of applying MARs was most obvious on steel and cobalt-chrome implants when using SEMAR from Toshiba followed by SmartMAR from GE. However, MARs may also introduce new image artifacts especially when used on titanium implants. Therefore, it is important to reconstruct all CT images containing metal with and without MARs.
Keywords
Introduction
Many patients undergoing a computed tomography (CT) scan have orthopedic metal implants as fixation devices or joint prosthesis. The metal implants have a high density resulting in an increased mean energy transferred, photon starvation, and increased scattered radiation. The degradation of image quality caused by the metal can make it difficult or even impossible to evaluate the interface between implant and bone or adjacent soft tissues. In musculoskeletal imaging findings close to the implant like bone resorption, fissures, fluid collections, and periosteal reactions can indicate loosening, infection, localized reaction to metal debris, or fracture. Metal artifacts can both simulate or hide such findings leading to misdiagnosis. The degree of image degradation depends on the size and orientation of the implant and the material of which it is made (1). There are some techniques that may reduce the artifacts resulting from metal implants, e.g. increased tube voltage (kV) and tube current (mA). However, these approaches result in increased radiation dose to the patient and only limited improvement of image quality. It is also possible to use softer reconstruction kernels or iterative reconstruction algorithms in order to reduce the noise in the image. These approaches may result in reduced spatial resolution and only limited reduction of the artifacts caused by the metal (2–4).
Several vendors have developed dedicated metal artifact reduction algorithms (MARs) aiming to reduce the effect of beam hardening and photon starvation. These methods can generally be categorized into two major groups: (i) sinogram completion methods; and (ii) model-based iterative algorithms. Methods to reduce metal artifacts in CT are summarized in a recent review on metal artifact reduction by Giantsoudi et al. (5). The methods are somewhat similar in the sense that they segment the metal from the raw-data space (sinogram) and replace it with approximated or interpolated data using various algorithms (6–9). In some cases, the algorithms introduce new artifacts near the metal edge due to data loss which may limit their clinical utility (6). Nevertheless, recent commercial MARs have shown promising results (10–13).
The aim of our study was to investigate how the different MARs affect different orthopedic implants, using a consistent set-up scanning an anthropomorphic phantom on all CT scanners. We evaluated and compared four commercially available MARs (listed alphabetically by vendor name): SmartMAR (GE Healthcare); O-MAR (Philips Healthcare System); iMAR (Siemens Healthcare); and SEMAR (Toshiba Medical System). The orthopedic implants chosen were cobalt-chrome, stainless steel, and titanium. The images were evaluated subjectively by three observers and analyzed objectively by calculating the fraction of pixels with CT number above 500 HU in a region of interest (ROI) around the metal. The average CT number and image noise caused by the metal implants were also measured.
Material and Methods
In order to obtain a consistent and comparable set-up, the leg of an anthropomorphic phantom, Kyoto Kagaku PBU-50 (Kyoto Kagaku Co., Kyoto, Japan), was scanned on all CT scanners. Three relevant orthopedic surgical materials were used: cobalt-chrome; stainless steel; and titanium. All metals were attached to the leg. To obtain the most severe artifacts, each metal type was laid crosswise (Fig. 1). A 10–20-mm thick tissue equivalent material (Elastogel-pads) was placed on top of the metal implants to simulate overlying soft tissue.
Photo and topogram of the phantom leg illustrating the location of the different metals. The line illustrates the z-location of the three images selected for analysis, one image for each metal.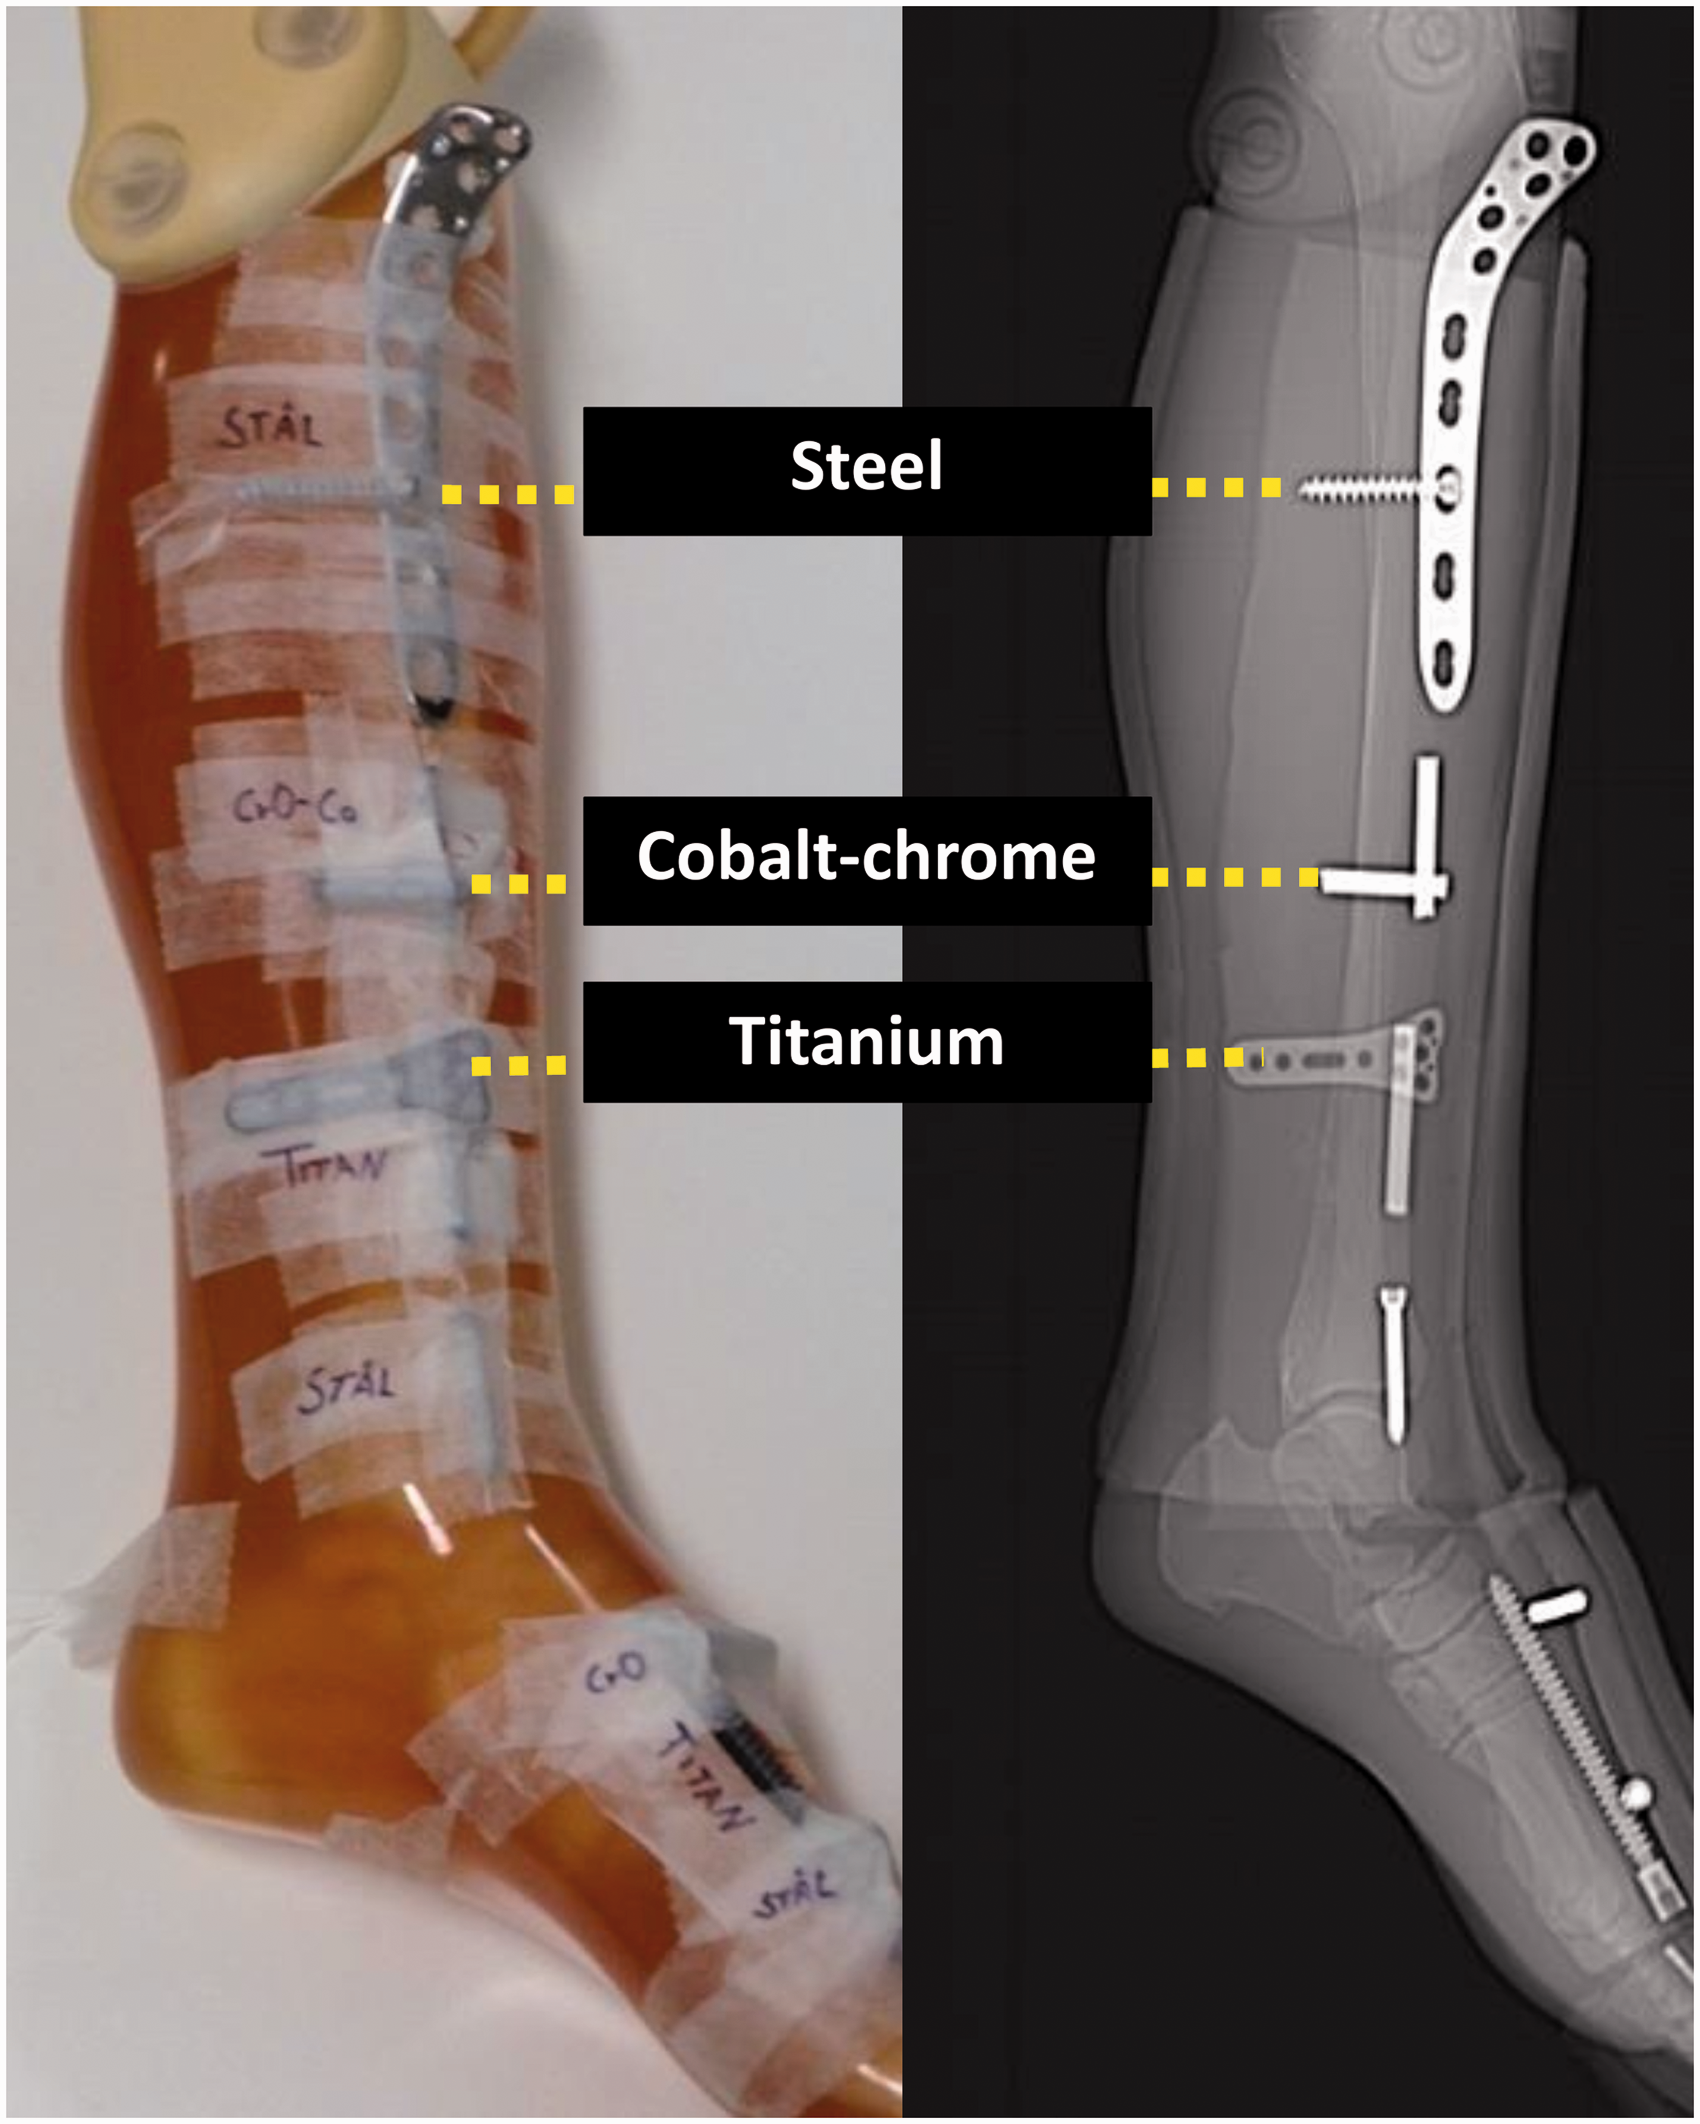
Vendor, scanner model, scan parameters, and MAR algorithm investigated in this study.

For each metal, the image containing the most intense artifacts was selected for analysis, i.e. where the metals laid crosswise (Fig. 1). A total number of 24 images were selected: three metals; four vendors; and two images per vendor (with and without MARs). There is no standardized way to describe and grade the extension and severity of a metal artifact, neither subjectively nor objectively.
For our subjective evaluation, all 24 images were anonymized, randomized, and presented to three observers: two radiologists and one radiographer with 13, 30, and seven years of experience, respectively. The observers evaluated the images and compared the images relatively for each metal. Two evaluation criterions were used: (i) select the images with the best possible visualization of the tissue surrounding the metal; and (ii) select the images with the best possible visualization of the metal object.
The best image was given 3 points, the second best image was given 2 points, while the third and fourth best ones were given 1 point each. The remaining four images were given 0 points. One observer also re-evaluated the images three months after the first evaluation yielding an intra-observer comparison.
Our results were analyzed using descriptive statistics. To illustrate the inter- and intra-observer agreement on an individual level, a parallel coordinate plot was used (14). The parallel coordinate plot illustrates the score (0–3 points) given to each image by each observer (observer 1–3). Each line represents one criterion for one image. A horizontal line means that all observers agreed on the same score. A diagonal line means that the observers gave the image a different score.
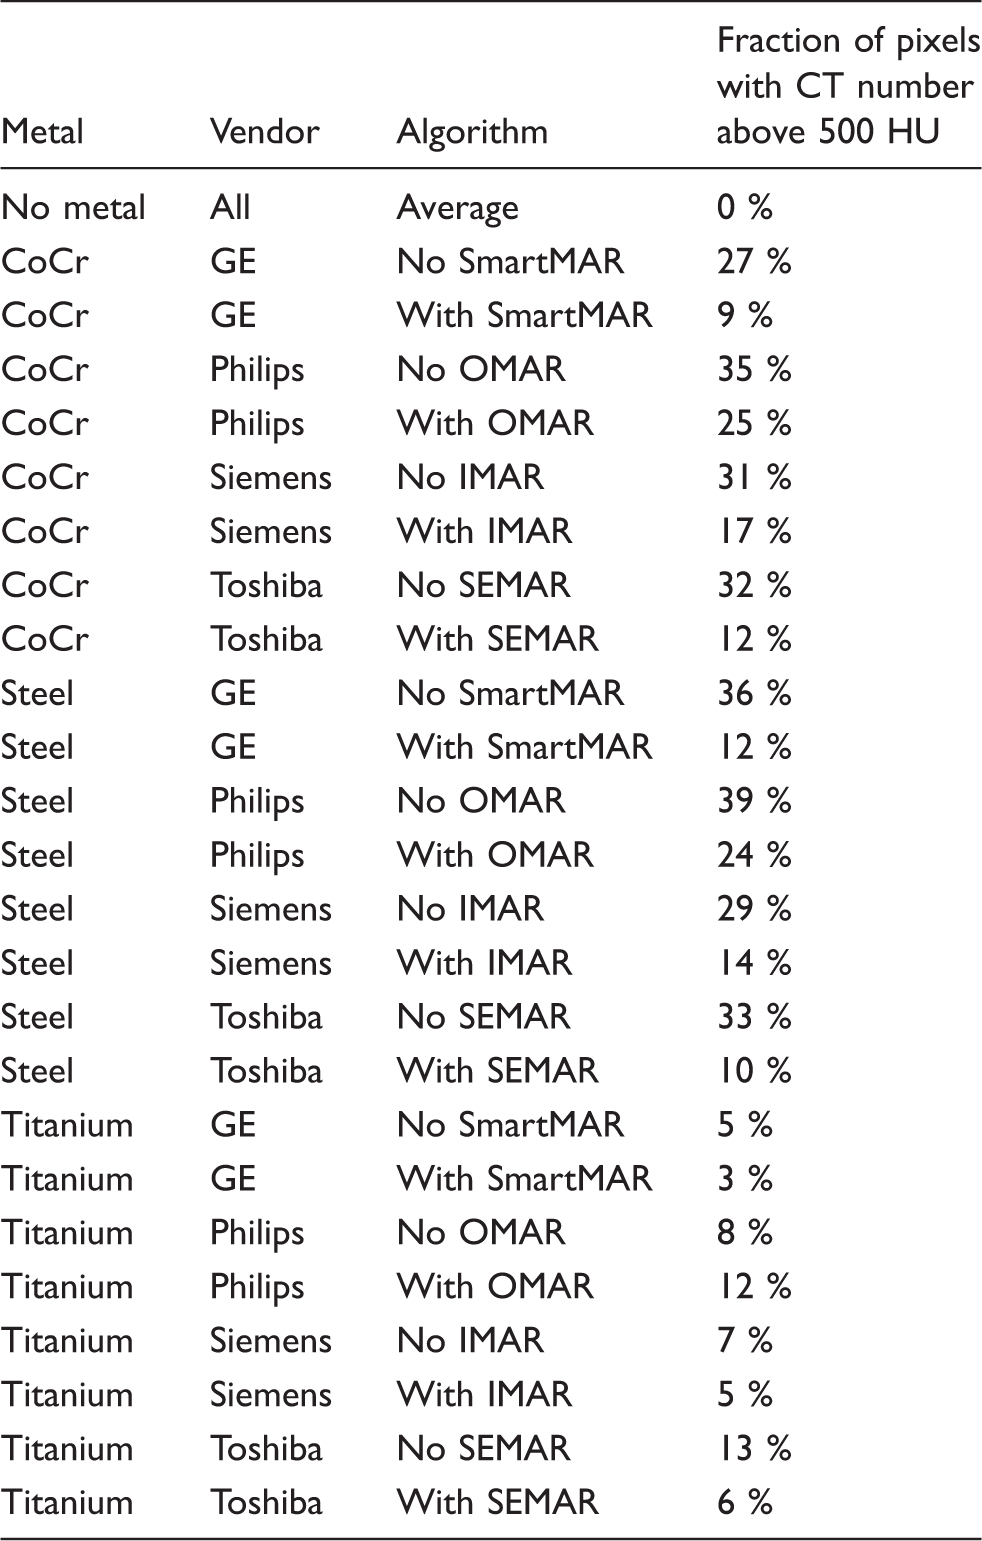
The CT images were analyzed objectively in ImageJ (Rasband National Institutes of Health (15)). A total of three ROIs were selected and analyzed. To evaluate the relative impact of metal artifact and metal artifact reduction algorithm, an image without metal was used as a reference. The first ROI of 37 cm2, ROI_METAL, was placed around the metal (Fig. 2). The bone of the leg was avoided. In ROI_METAL, the fraction of pixels with CT number above 500 HU (number of pixels with CT number above 500 HU divided by the total number of pixels) was calculated. The mean CT number and standard deviation (SD) in two ROIs were also measured and analyzed. ROI_BONE was placed in the “bone” region of the phantom leg and ROI_TISSUE, was placed in the “soft tissue” of the phantom leg (Fig. 2).
Illustration of the different ROIs. ROI_METAL, ROI_BONE, and ROI_TISSUE in the reference image without metal (left) and ROI_METAL, ROI_BONE, and ROI_TISSUE in an image containing metal (right).
Results
All vendors and MARs reconstructed the images differently for the various metals. Fig. 3 illustrates some of the strengths and weaknesses with the different MARs. All figures for all vendors and all metals are available as Supplementary Figures 1–3.
The figures illustrate strengths and weaknesses with the different MAR algorithms on different metals. All figures for all vendors and all metals are available as supplementary figures. For cobalt-chrome, the black and white artifacts are reduced when using MARs. Stainless steel with and without MARs is shown for two different vendors. The artifacts surrounding the steel screw is reduced. The steel screw looks quite different for the two different vendors. The titanium itself does not introduce a lot of artifacts. The MAR actually introduces new and more severe artifacts than when not using MAR.
The subjective evaluation of the surrounding tissue and metal object performed by all observers is presented as the total score given to each image in Fig. 4. For cobalt-chrome, all observers gave the maximum score to SEMAR from Toshiba for both criteria. For stainless steel, all observers gave the maximum score to SEMAR for best visualization of the metal object. Observers 1 and 3 gave the maximum score to SEMAR for best visualization of surrounding tissue, while observer 2 gave the maximum score to SmartMAR from GE. The two MARs with the highest score were SEMAR from Toshiba followed by SmartMAR from GE.
Total score given by all observers when evaluating the best visualization of the tissue surrounding the metal and the best visualization of metal object.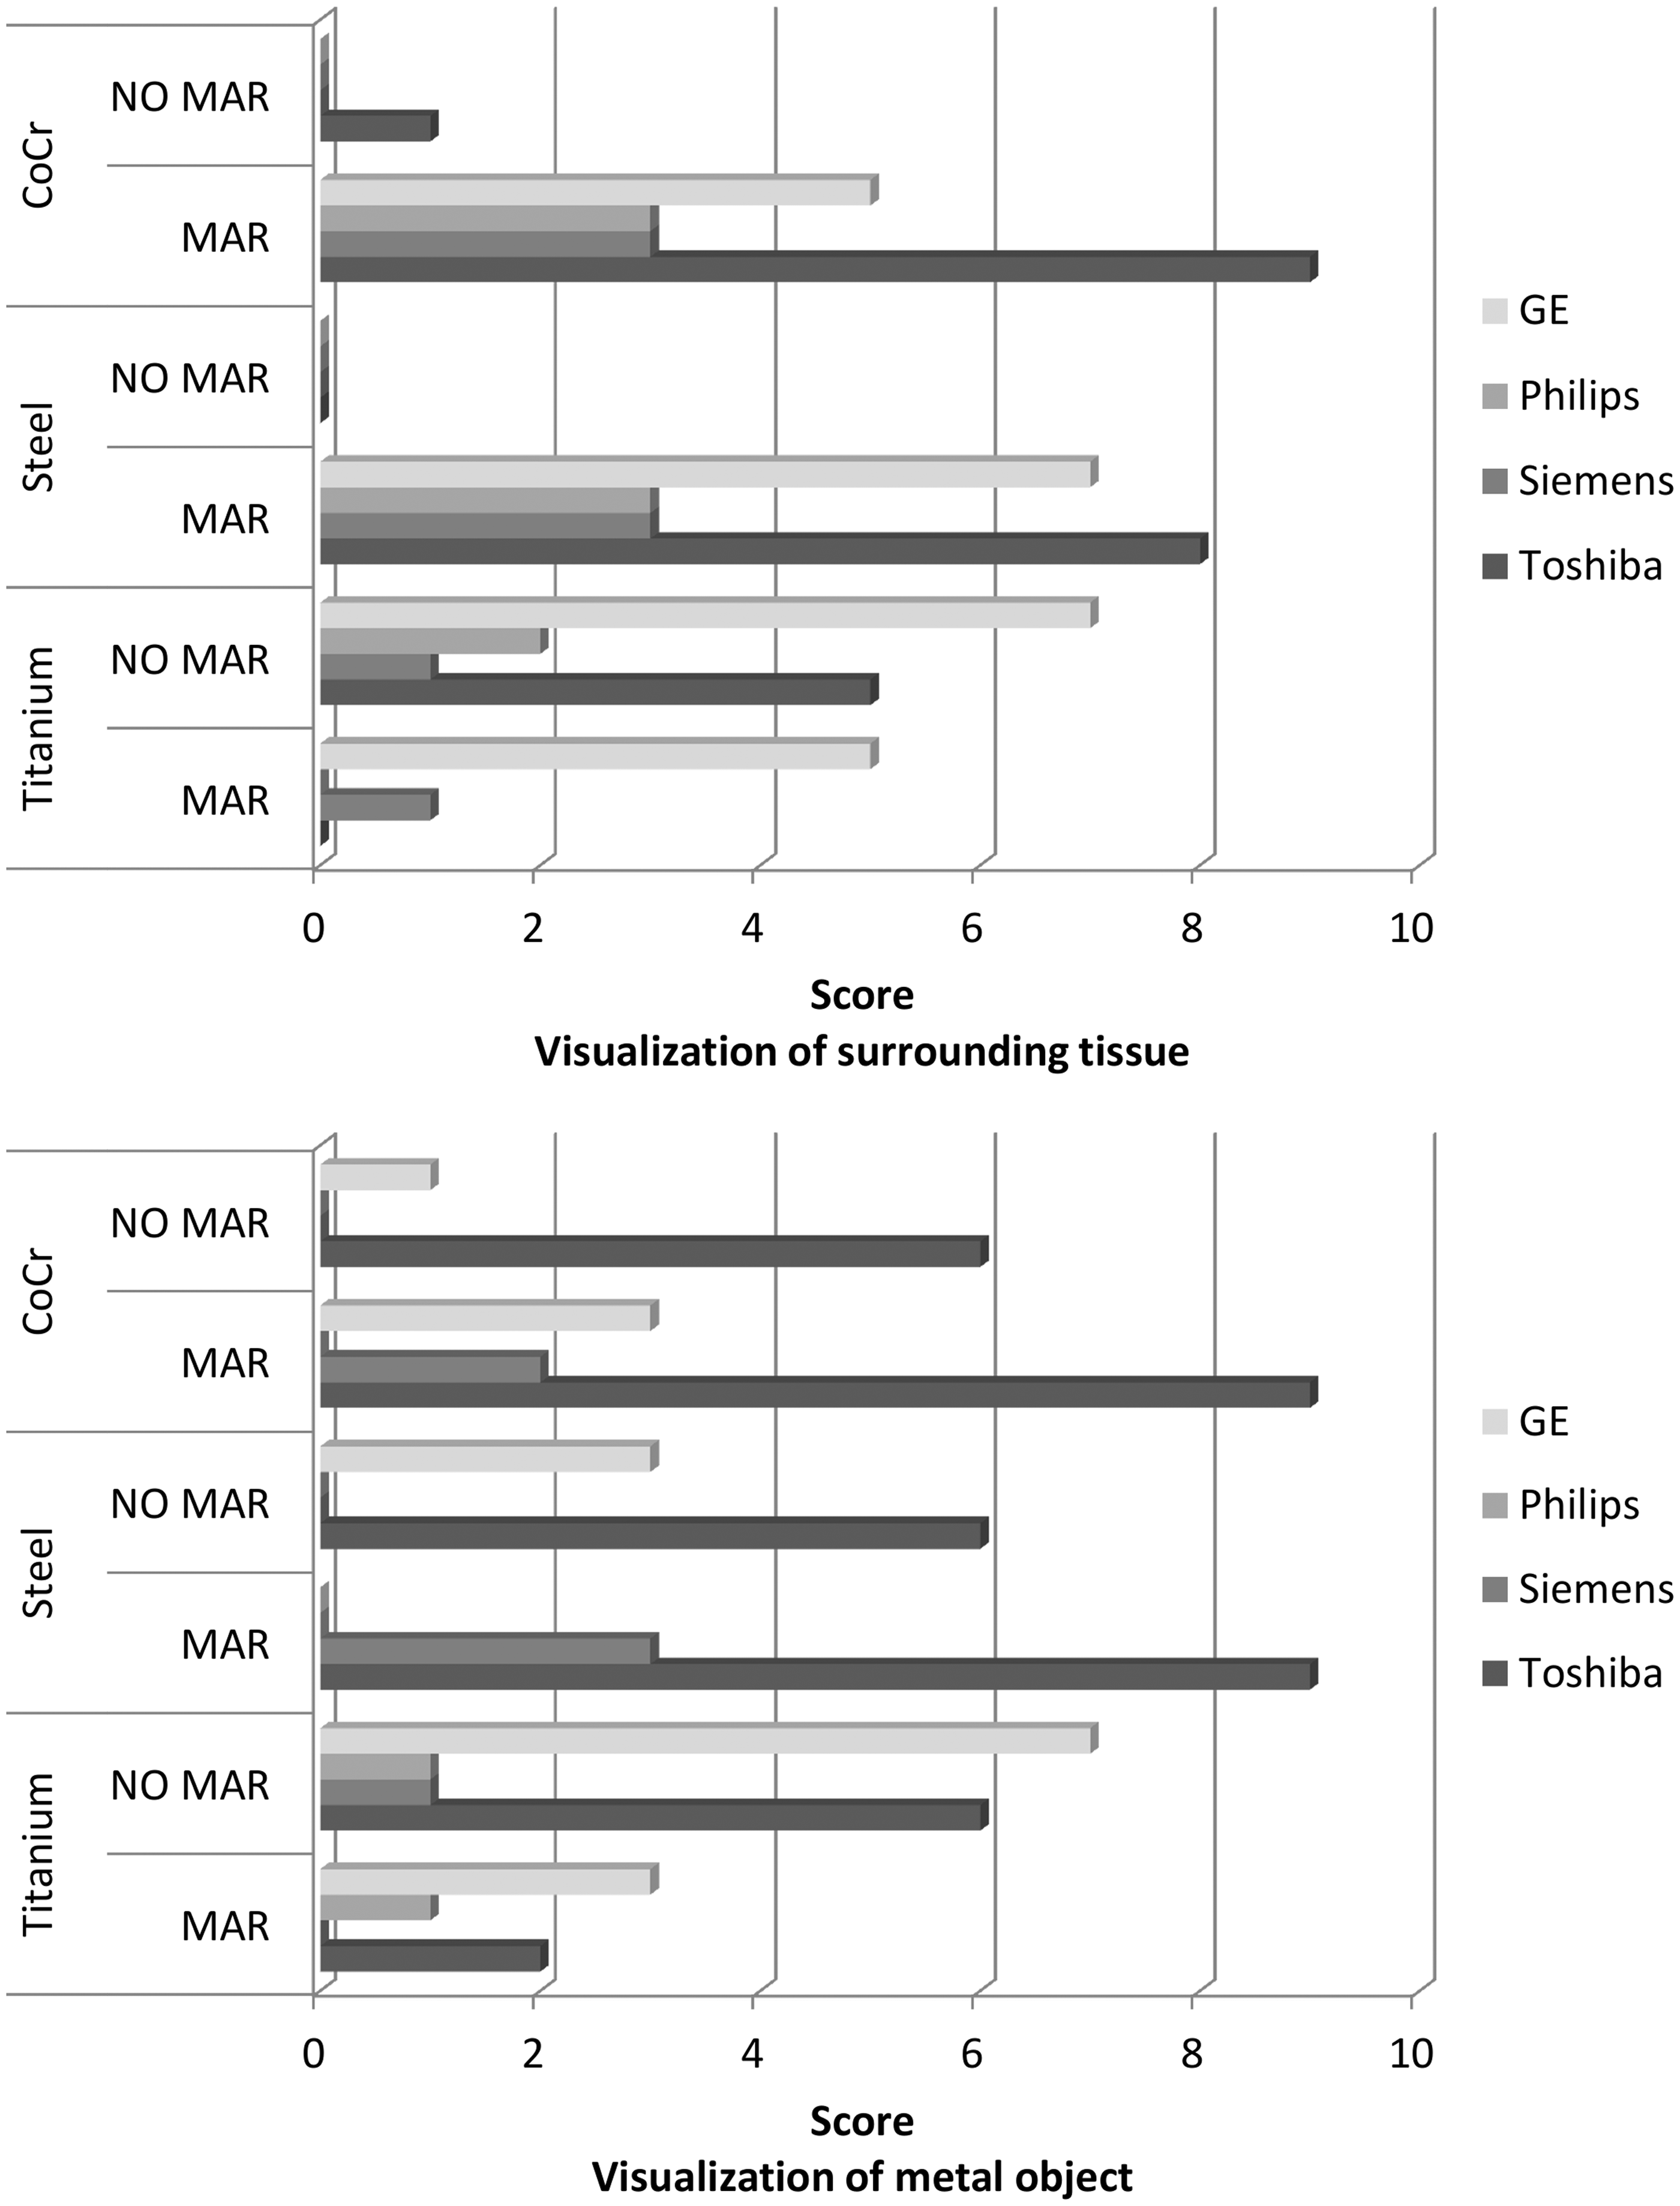
The intra- and inter-observer agreements are shown in Fig. 5. One parallel coordinate plot is drawn for each metal, both criteria are included. Parallel lines mean perfect agreement between the observers. A good inter-observer agreement was found for cobalt-chrome and stainless steel, i.e. perfect agreement between all observers for 11/16 images and 14/16 images, respectively. For titanium, the inter-observer agreement was poor, i.e. primarily diagonal lines. The intra-observer agreement was good, i.e. primarily parallel lines, for all metals.
Inter- and intra-observer agreement between observers 1, 2, and 3 for the different metals. Both criteria are included for each metal. Each line represents one criterion for one image. A horizontal line means that all observers agreed on the same score. A diagonal line means that the observers gave the image a different score.
Calculated fraction of pixels with CT number above 500 HU in the selected ROI around the metal for all scanners and reconstruction methods for all metals
Using MARs on an image containing no metal had no impact on the measured CT number and noise (SD). The mean CT number in the ROI_BONE measured in an image without metal was measured to 430 HU. Generally, the HU value measured in ROI_BONE decreased for all metals when using MARs, except for O-MAR on cobalt-chrome and stainless steel (Fig. 6). The mean CT number for ROI_TISSUE measured in an image without metal was measured to –1 HU. Generally, the CT number measured in soft tissue decreased and got closer to the reference CT number when using MARs, except when using O-MAR on titanium where the CT number increased. Also, the noise measured in soft tissue decreased for all metals when using MARs, except for O-MAR, iMAR, and SEMAR on titanium.
Diagram showing change in mean CT number in the selected ROI_TISSUE and ROI_BONE and corresponding noise shown as standard deviation for all scanners reconstructed with and without MARs on all metals.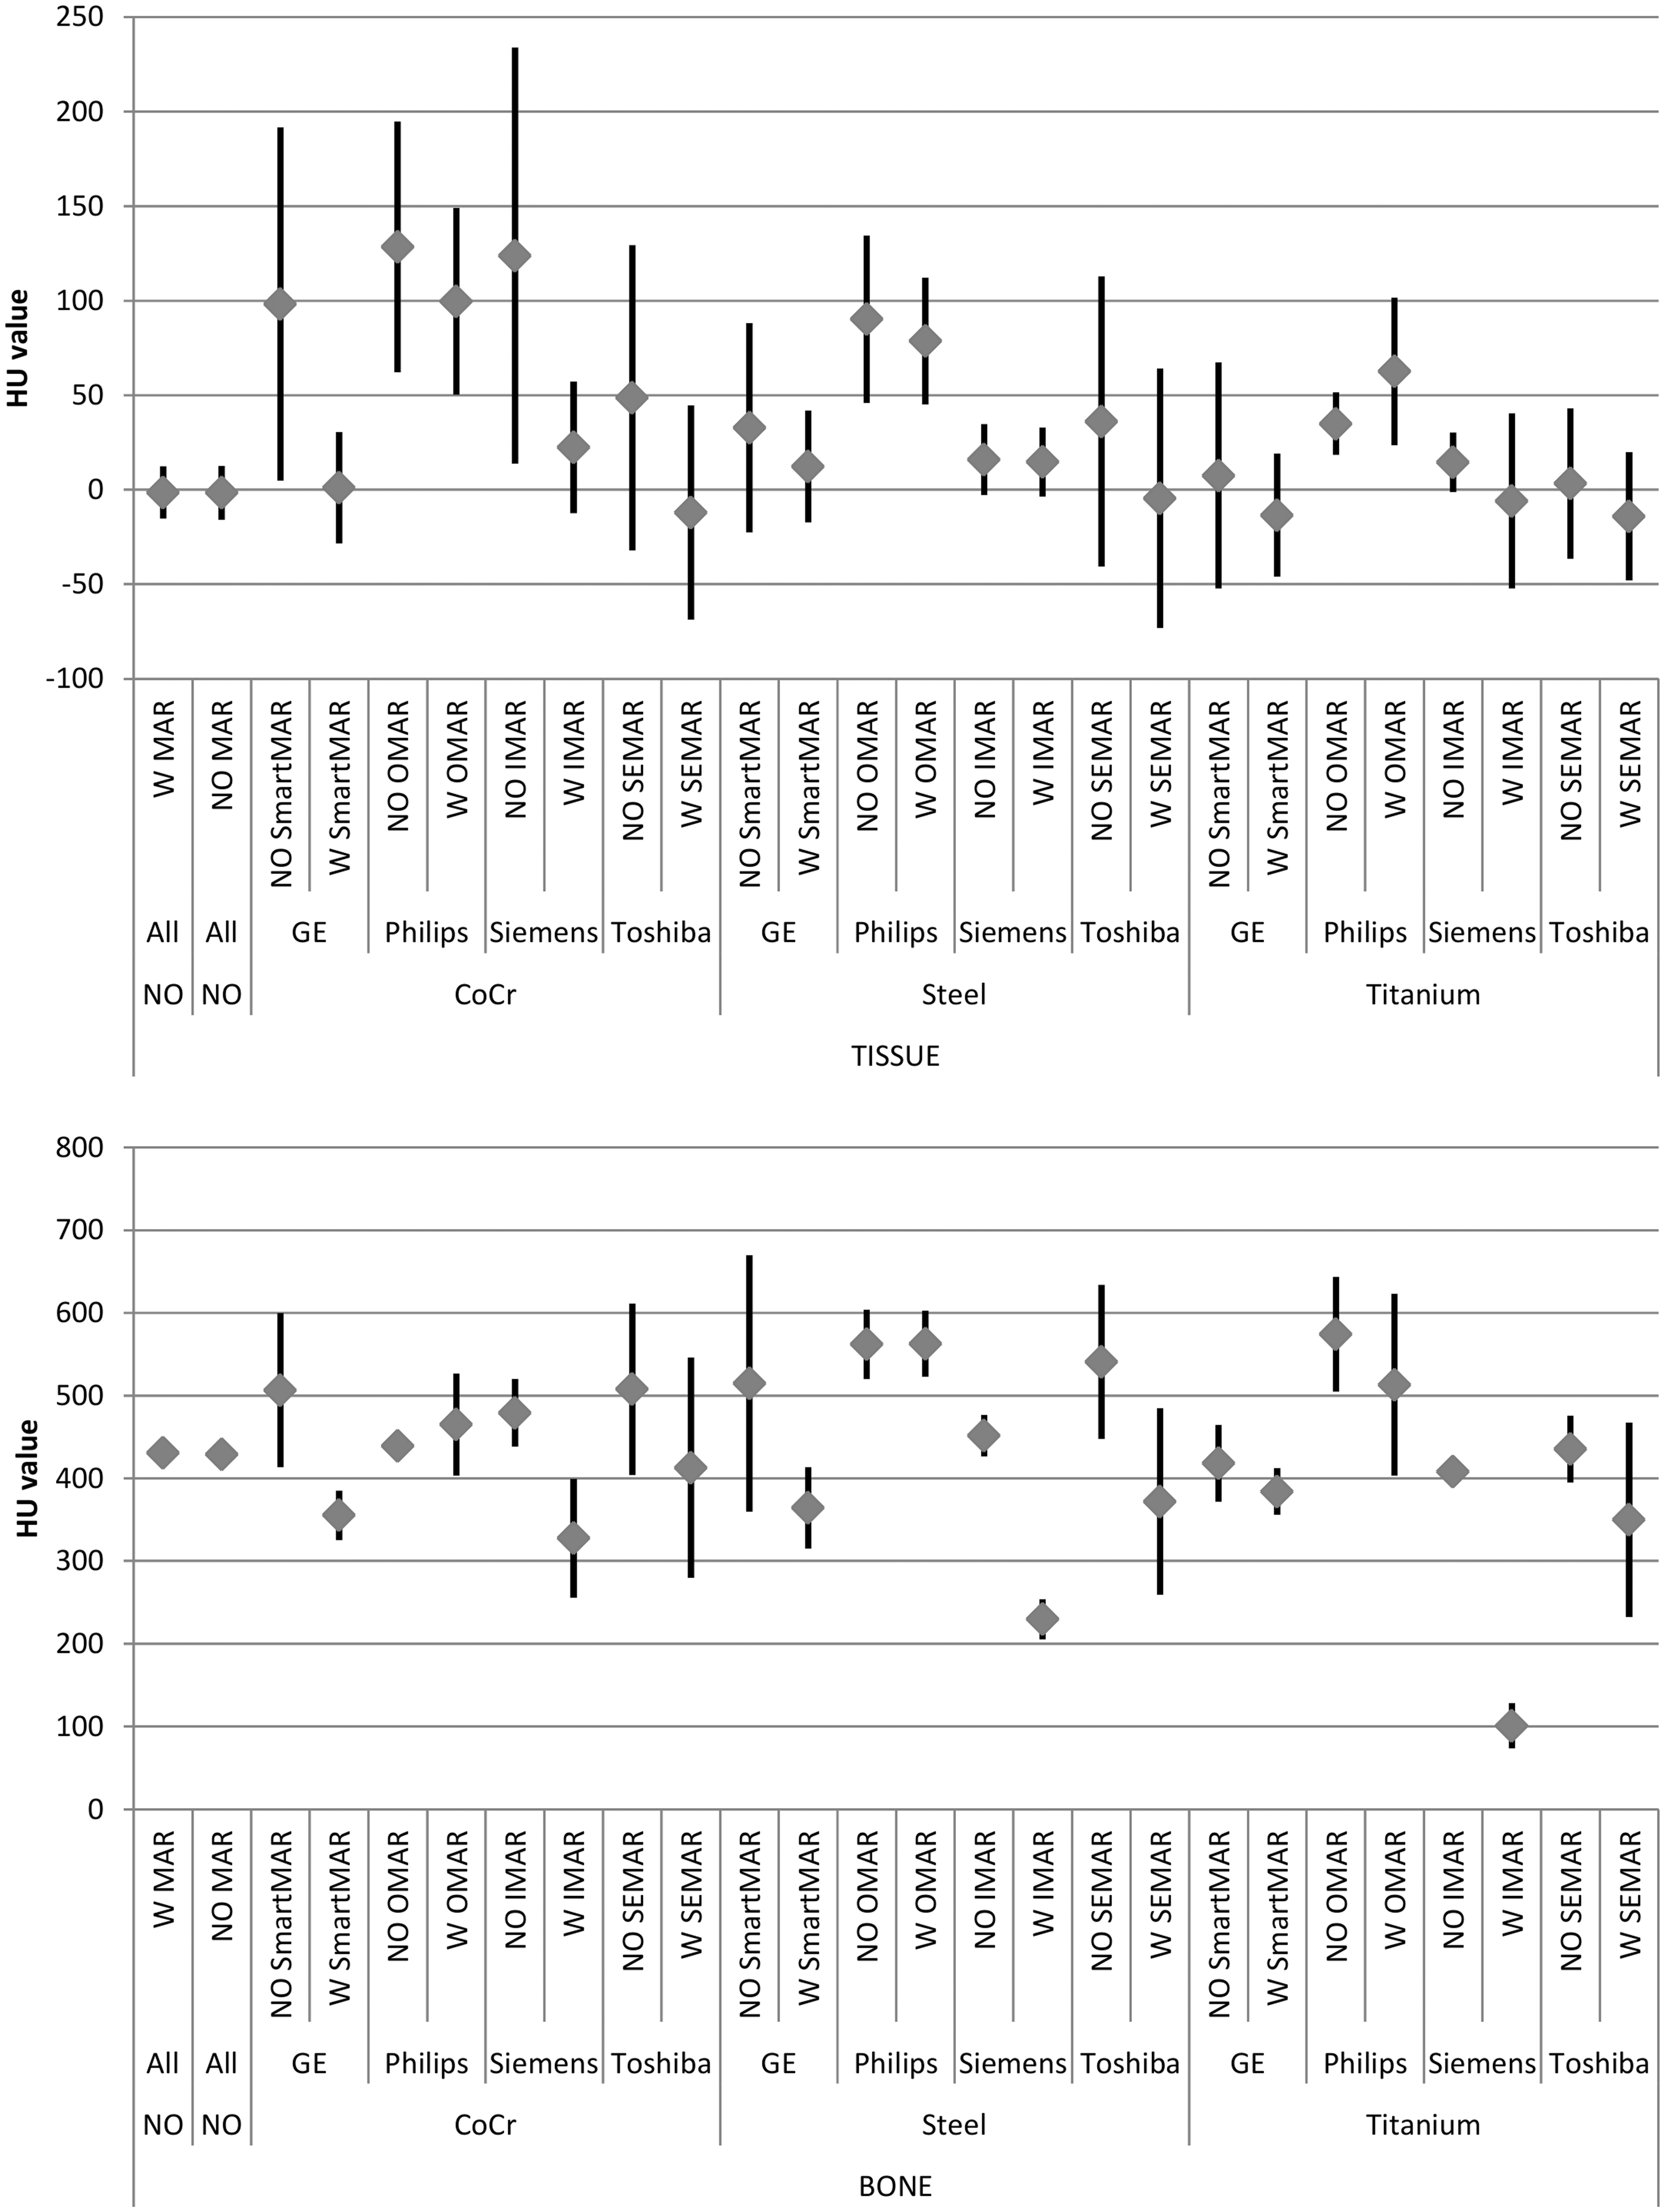
Discussion
There is no standardized way to describe and grade the extension and severity of metal artifacts, neither subjectively nor objectively. Andersson et al. performed a side-by-side visual grading comparison with criterions based on European Guidelines for Multislice CT for pelvic area and added in-house developed criterions to fit the purpose of their study (11). As mentioned, the degradation of image quality caused by the metal can make it difficult or even impossible to evaluate the interface between implant and bone or adjacent soft tissues. Therefore, we asked the observers to evaluate the visualization of the metal object and the surrounding tissue.
All observers agreed that the best MAR was SEMAR from Toshiba followed by SmartMAR from GE. The good inter- and intra-observer agreement when evaluating cobalt-chrome and stainless steel indicates reliable results. For titanium, however, the inter-observer agreement was poor indicating that MAR has less impact on artifacts resulting from a titanium implant.
Some authors compare a known metal size to the size measured of the same metal object in the CT image (11,12,16). Several authors refer to objective measurements of CT number and noise measurements (13,17). The noise measurements, however, do not tell the entire story about the image quality. A reduction of metal artifacts will result in more constant CT values and lower noise values. In some cases, the noise may actually increase even though the artifacts are reduced, because the partial absence of signal due to photon starvation is replaced by interpolated data with statistical uncertainty. Changes in noise values are therefore not the best indication of improved image quality in this case.
We have suggested calculating the fraction of pixels with a CT number over 500 HU which corresponds to the metal and white high intensity artifacts and compare this fraction on images reconstructed with and without MARs. Even if this calculation does not include the black low intensity artifacts, the objective analysis corresponded well with the subjective evaluation.
Our results show that the measured CT number and the measured noise in soft tissue were generally reduced when using MARs on cobalt-chrome and stainless steel implants as shown in previous studies (13). Titanium implants do not induce severe artifacts (4). When applying MARs on images containing titanium, the score remained the same and in some cases reduced the impression of image quality. This was due to the fact that the MAR algorithm actually introduced new and more severe artifacts than the metal itself. The air gap between the phantom leg and the bolus material itself may have introduced artifacts as the air gap seems to have been misinterpreted as an artifact by all four MARs. When the CT series containing titanium were reconstructed using MARs, the pixels containing the air gap was filled with tissue equivalent HU values.
Different scan and reconstruction parameters such as slice thickness and reconstruction kernel affect the image quality. We used the vendors’ recommended protocol and dose levels were kept similar. The phantom leg was positioned as identically as possible on all CT scanners. However, these limitations are also true when scanning real patients. Some MARs have limitations. For example, early versions of iMAR can only be used in combination with a softer kernel (B41) and not a sharp bone filter. This limits the use of the iMAR since bone trabecula is not visible when using a softer kernel. The SEMAR version available on our scanner at the time of our study cannot be used in spiral mode, limiting the scan length.
Scanning a phantom has its limitations and advantages. The metal was placed on the surface of the leg and not fixed to the bone as in patients. However, placing tissue equivalent material on top ensured that the artifacts could be evaluated all around the metal. The artifacts generated by the metals and the artifacts produced by the MAR on titanium in clinical images were clearly reproduced in our phantom leg model. Our phantom study design enabled scanning the same leg under the same standardized conditions and yielded a systematic approach to compare the different MARs.
Metal artifact reduction is important in orthopedic imaging for evaluation of the implant itself but also to assess the adjacent bone and soft tissue. Normally the radiation technologist does not know what material the metal implant is made of prior to scanning. Our results indicate that information on type of metal used in implants is vital when planning an optimal CT examination, and clinicians should be encouraged to provide such information in referral letters.
In conclusion, both subjective evaluation and objective analysis showed that the effect of applying MARs was most obvious on stainless steel and cobalt-chrome implants. The MAR considered to best visualize the metal object and surrounding tissue for steel and cobalt-chrome was SEMAR from Toshiba followed by SmartMAR from GE. It is important to be aware of possible differences between the different MARs especially in centers holding multiple scanners. Reduced artifacts yield improved visibility of clinical findings close to the implant such as signs of infection and micro-fractures. However, it is important to be aware that MARs may introduce new image artifacts, especially when used on titanium implants. Therefore, images reconstructed without MARs should always be included in the clinical scanning protocol to reveal possible artifacts introduced by the algorithm.
Footnotes
Acknowledgements
The authors thank Ansgar Espeland, Per Martin Kristoffersen, Audun Grimstad Selvåg, Eivind Aas Nilsen, Kristin Audestad Wolff Sørlie, and Helge Pettersen for their contribution to this study.
Declaration of Conflicting Interests
The author(s) declared no potential conflicts of interest with respect to the research, authorship, and/or publication of this article.
Funding
The author(s) received no financial support for the research, authorship, and/or publication of this article.