
Abstract
OBJECTIVE:
To demonstrate the value of optimizing non-contrast head imaging tasks by using the multiple virtual monochromatic spectral imaging (VMSI) sets in dual-energy spectral computed tomography (CT) and determine the optimal energy levels for various tasks in imaging head.
MATERIALS AND METHODS:
This retrospective study includes 55 patients (29 women and 26 men, average age of 54.5±12.3years) who underwent non-contrast head CT in spectral imaging mode. For each patient, 21 VMSI sets from 40 to 140 keV at 5 keV intervals and 120 kVp-like image were reconstructed. Signal-to-noise ratio (SNR) for gray matter (GM) and white matter (WM), contrast-to-noise ratio (CNR) between GM and WM, subcalvarial artifact index (SAI) and posterior fossa artifact index (PFAI) were measured by placing regions-of-interest (ROIs) in nine areas of the brain. Two radiologists subjectively rated the image quality in terms of GM-WM differentiation, beam hardening artifacts in the subcalvarial space, and posterior fossa. The overall image noise was evaluated using a 5-point Likert scale. Measurement data were then statistically analyzed.
RESULTS:
The optimal energy level for viewing the supratentorial brain and reducing beam hardening artifacts in the subcalvarial space and posterior fossa was 65 keV and 75 keV, respectively. All corresponding measurements at these energy levels were significantly better than those measured at other energy levels (all P < 0.05).
CONCLUSIONS:
Dual-energy spectral CT imaging provides a set of virtual monochromatic spectral imaging and can be selected on-demand to optimize the imaging tasks in non-contrast head CT. VMSI reconstruction of dual-energy unenhanced head CT scans at 65–75 keV enables to maximize image quality.
Introduction
Non-contrast head CT is a routine examination used in clinical, especially for rapid diagnosis of acute ischemic stroke, intracranial hemorrhage, neurological trauma, and conditions that are contra-indications to MRI [1–4]. However, imaging can be impaired by low signal and low contrast. Conventional kVp CT images can be somewhat difficult to assess due to low gray-white matter differentiation, as well as beam hardening artifacts that mainly caused by the thick and irregular contours of the petrous bones and skull [5, 6].
Dual-Energy computed tomography (DECT) was proposed as early as the 1970s, although it has only recently become available on clinical scanners which widely used in clinical for imaging the head to improve lesion characterization and decrease beam hardening artifacts and has shown promising results [7–10]. DECT utilizes two different energy spectra to allow the analysis of energy-dependent changes in the attenuation of different materials. High-energy and low-energy data sets for DECT imaging can be generated using different approaches, basically focused on either x-ray tube output or x-ray detection. Currently, there are four tube-based physical concepts available with high and low mean energy x-ray spectra, which are obtained from (1) Dual-Source: dual-energy CT utilizes two distinct high and low-energy x-ray source-detector combinations aligned at 90°angles; (2) Dual-Spin: two consecutive rotations at different tube potentials; (3) Dual-Layer: DECT utilizes a single x-ray source with a detector composed of two scintillation layers, resulting in high- and low-energy spectral separation; (4) Fast Kilovoltage Switching: rapid switching of the tube potential of a single x-ray source during a single rotation.
In this study, we evaluated Dual-Energy Spectral CT (DESCT) that utilizes a single-source, single-detector with fast kilovoltage switching, projection-based beam hardening correction with two materials can be performed because of the availability that two different kilovoltages have for the same projection angle [8, 10].Virtual monochromatic spectral imaging (VMSI) at a specified photon energy level can be generated during the processing of material-density image data by calculating the linear attenuation coefficient. Because of higher attenuation of soft x-rays, low-energy monoenergetic images have an improved soft tissue contrast resolution. Hard x-rays are attenuated less than soft x-rays. Thus, when using high-kiloelectron volt images, dense materials, such as bone, cause less artifacts. These images are less affected by the beam-hardening effect, and thus provide more accurate Hounsfield unit values than conventional CT scanners with a polychromatic energy beam [10–13]. Through sophisticated reconstruction algorithms, image sets from the two polychromatic exposures are generated that reflect the properties of a single scan performed in a monochromatic x-ray beam. Beam-hardening artifacts are reduced compared with that of conventional polychromatic exposure reconstructions, and reduced streak artifacts and better soft tissue contrast can be achieved (depending on energy-level selection) [10], although often at the expense of lower signal-to-noise ratio (SNR) [10, 15]. Images reconstructed at different virtual monochromatic energy levels (kiloelectron volts) result in different SNR and contrast-to-noise ratio (CNR) characteristics [10].
The purpose of this study was to demonstrate the value of optimizing non-contrast head imaging tasks by using the multiple sets of virtual monochromatic spectral imaging (VMSI) reconstructed from DESCT, and to determine the optimal energy levels for viewing supratentorial brain and reducing beam hardening artifacts in the non-contrast head CT imaging.
Materials and methods
This study received approval from the Ethics Committee of our hospital for retrospective review of existing clinical data.
Patients
We included patients (age older than 18 years) with routine clinical indications (e.g., headache, stroke, trauma, or hemorrhage) who had undergone non-contrast dual-energy spectral CT of the head. The exclusion criteria were: patients with neurosurgical treatment (aneurysm clips, craniotomy-related hardware, and neurostimulator device etc.), images affected by severe motion artifacts and mass effect (severe intracranial hemorrhage, vast cytotoxic edema, etc.), as well as by artifacts from foreign bodies, surgery and severe disturbances in brain morphology. Examinations from 55 patients were included into the study; of these patients, 29 were women and 26 were men. The average patient age was 54.5±12.3 years, ranging from 24–86 years.
Image acquisition
All CT examinations were performed using the same Dual-Energy Spectral CT scanner (Revolution CT; GE Healthcare). Scans were conducted using the dual-energy spectral imaging mode with rapid tube voltage switching between 140 kVp and 80 kVp. The gemstone spectral imaging (GSI) protocol was selected as follows: medium scan field of view, 20 mm beam collimation, 400 mA tube current, 0.8-second rotation time, and 0.508 : 1 helical pitch for a volumetric CT dose index (CTDIvol) of 30.31 mGy. Images were reconstructed at 5 mm slice thickness with a standard filtered back projection (FBP) algorithm. 21 sets of VMSI at 5 keV intervals from 40 to 140 keV and 120 kVp-like image were generated from the same scan. The 21 sets of virtual monochromatic images had energy spans of 40 keV to 140 keV at an interval of 5 keV. However, any set within the 21 sets will have only one energy. For example, for the 70 keV set, the photon energy would be 70 keV.
For each of the 22 image sets, 9 regions of interest (ROIs) were manually selected to measure CT attenuation (in Hounsfield units) and standard deviation (SD) on the same workstation (Advantage workstation 4.7, GE healthcare). The ROI measurements were performed by one radiologist and reviewed by Two experienced radiologists (10 and 6 years of experience in neuroradiology). The size of ROIs for grey matter (GM) and white matter (WM) was kept at 25 mm2 and 215 mm2 for posterior fossa and the region in the corona, respectively. These ROIs were only slightly adjusted to avoid volume averaging with adjacent tissues of different attenuations. The ROIs were placed at the following anatomic locations on the basal ganglia: two in the cortical GM, the other two in the juxtacortical WM, one in the thalamic deep GM, one in the WM of the posterior limb of the internal capsule, and the seventh ROI was drawn close to the calvarium. An additional ROI was placed in the medulla oblongata of the posterior fossa with the highest degree of artifact. And a region in the corona with relatively homogeneous density was selected as the 9th region for measuring the background image noise of the brain (Fig. 1). Two experienced radiologists rated the 120kVp-like image and reconstructed 21 sets of VMSI head DESCT images in consensus. Images from the same patient were rated simultaneously, but raters were blinded to the reconstruction settings. The images were presented in random order. The raters were allowed to window, level, and magnify the images. Before statistical analysis, quantitative measurements were reviewed by a senior neuroradiologist.
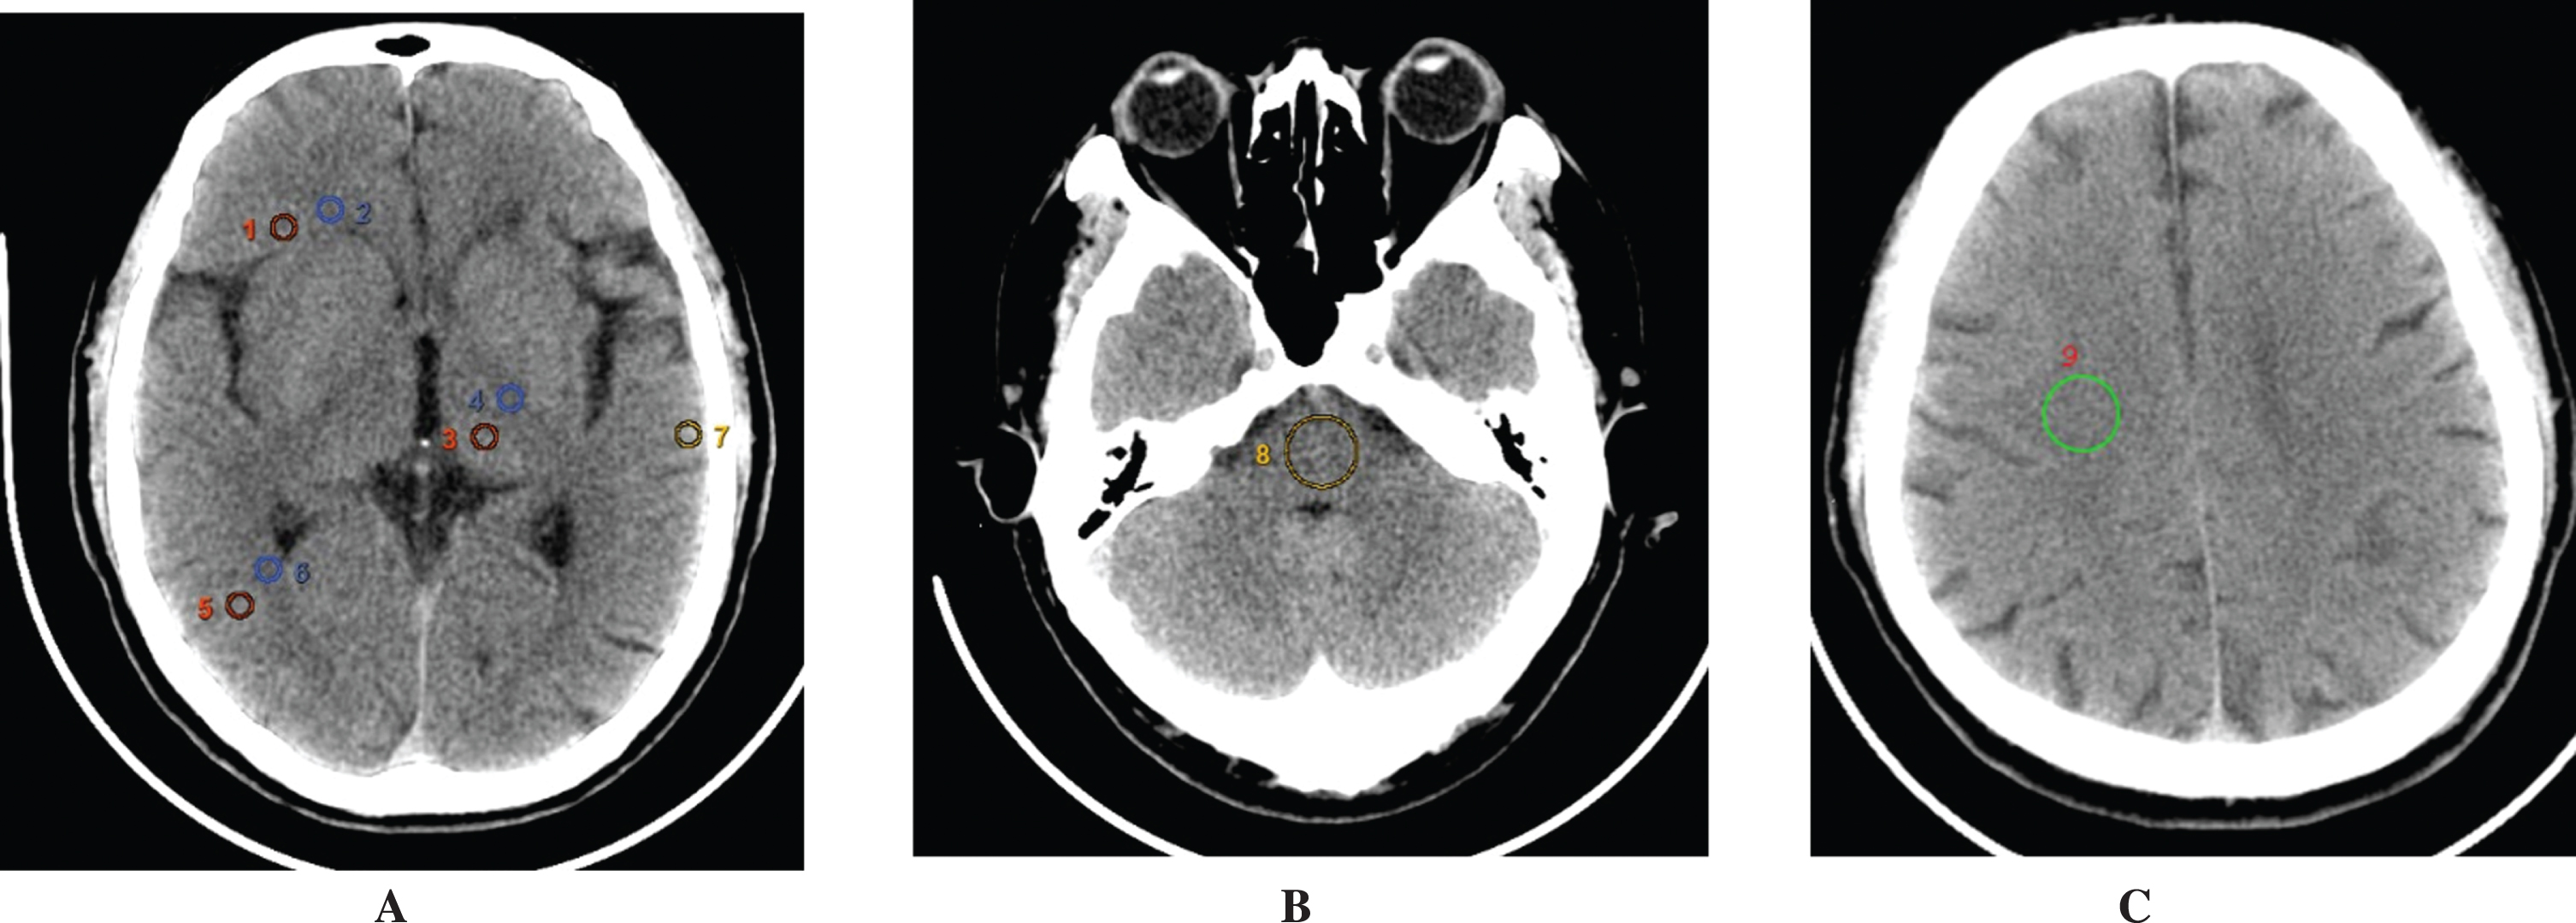
ROI placement at the following anatomic locations: two in the cortical gray matter (GM) (red circle, ROI 1,5), the other two in the juxtacortical white matter (WM) (blue circle, ROI 2,6), one in the thalamic deep GM (red circle, ROI 3), one in the WM of the posterior limb of the internal capsule (blue circle, ROI 4), and the seventh ROI (yellow circle, ROI 7) was drawn close to the calvarium on the basal ganglia (A), as well as an additional ROI (yellow circle, ROI 8) in the interpetrous region of the posterior fossa with the highest degree of beam hardening artifact at midlevel of axial CT image (B). And a region (green circle, ROI 9) in the corona with relatively homogeneous density was selected as the background of the brain (C).
Quantitative image parameters were calculated in line with previously published assessments [10, 16–20]. Signal was considered as CT density in Hounsfield units (HU), image noise as standard deviation (SD) of attenuation within an ROI. Image quality indexes of SNR and contrast-to-noise ratios (CNR), which is an important sign of early ischemia (cytotoxic edema), were calculated using the following standard equations:
The SD values of ROIs placed in the region of posterior fossa and close to calvarium were used to calculate the posterior fossa artifact index (PFAI) and subcalvarial artifact index (SAI), respectively. PFAI was defined as the square root of the squared noise difference between the ROI of posterior fossa and background; and SAI was defined as the square root of the squared noise difference between the ROI close to calvarium and background, both representing the amount of perturbance of attenuation values from beam hardening artifacts with background noise removed. If the difference was negative, it was set to 0. The virtual monochromatic images with the highest SNR or CNR, lowest SAI and PFAI values were selected for the corresponding task of achieving the best contrast between GM and WM, lowest beam hardening artifacts between bone and soft tissue and in posterior fossa.
We use signal-to-noise ratio (SNR) for gray matter (GM), white matter (WM), contrast-to-noise ratio (CNR) between GM and WM, subcalvarial artifact index (SAI) and posterior fossa artifact index (PFAI) which listed measurement indices together to determine optimal energy levels in clinical practice.
Subjective analysis
The 22 sets of images were rated independently by two radiologists with 10 and 6 years of experience in neuroradiology by following a 5-point Likert scale. The evaluation included the differentiation of gray-white matter (1 = difficult, uncertain diagnosis; 2 = poor, limited diagnosis; 3 = decent, diagnostic; 4 = good, diagnostic; 5 = excellent, fully diagnostic), the assessment of the subcalvarial space (ranging from 1 = not assessable/uncertain diagnosis to 5 = unrestricted assessment/ fully diagnostic), the beam hardening artifacts caused by the skull (ranging from 1 = massive to 5 = none), and the image noise (ranging from 1 = excessive noise to 5 = absence of noise). Representative images in the axial plane showing basal ganglia and posterior fossa were displayed in the brain window with window width and level adjusted based on the mean CT value in the white matter at different energy levels.
Statistical analysis
All statistical analysis procedures were performed using SPSS 20.0 software kit. Quantitative variables of SNR, CNR, SAI and PFAI measurements, which showed a normal distribution, were determined the significance of differences between each of the 22 sets and the best VMSI set for a certain imaging task by means of Student t test. Wilcoxon test was used to describe statistical differences between results of subjective assessments. All values were summarized as means±SD. Statistical significance was defined as P≤0.05.
Results
The combined average of the ROI size manually drawn for GM and WM attenuation measurements was 25.03 mm2±2.80 (SD), the ROI size of the petrous parts of the temporal bones was kept the same as the ROI size of GM and WM, approximately 100 mm2 in the corona with relatively homogeneous density was selected as the background of the brain, and for measuring PFAI, the mean ROI size was 216.01 mm2±26.30 (SD).
Objective analysis
Comparison between the optimal VMSI Levels and the 120 kVp-like images
Values of SNR, CNR, SAI and PFAI obtained at the optimal VMSI levels from the 21 image sets were compared with the respective mean values from the 120 kVp-like images (Figs. 2, 3). An unpaired t test was performed that demonstrated significant improvement in all measures, except the PFAI value. The comparison results are summarized in Table 1.
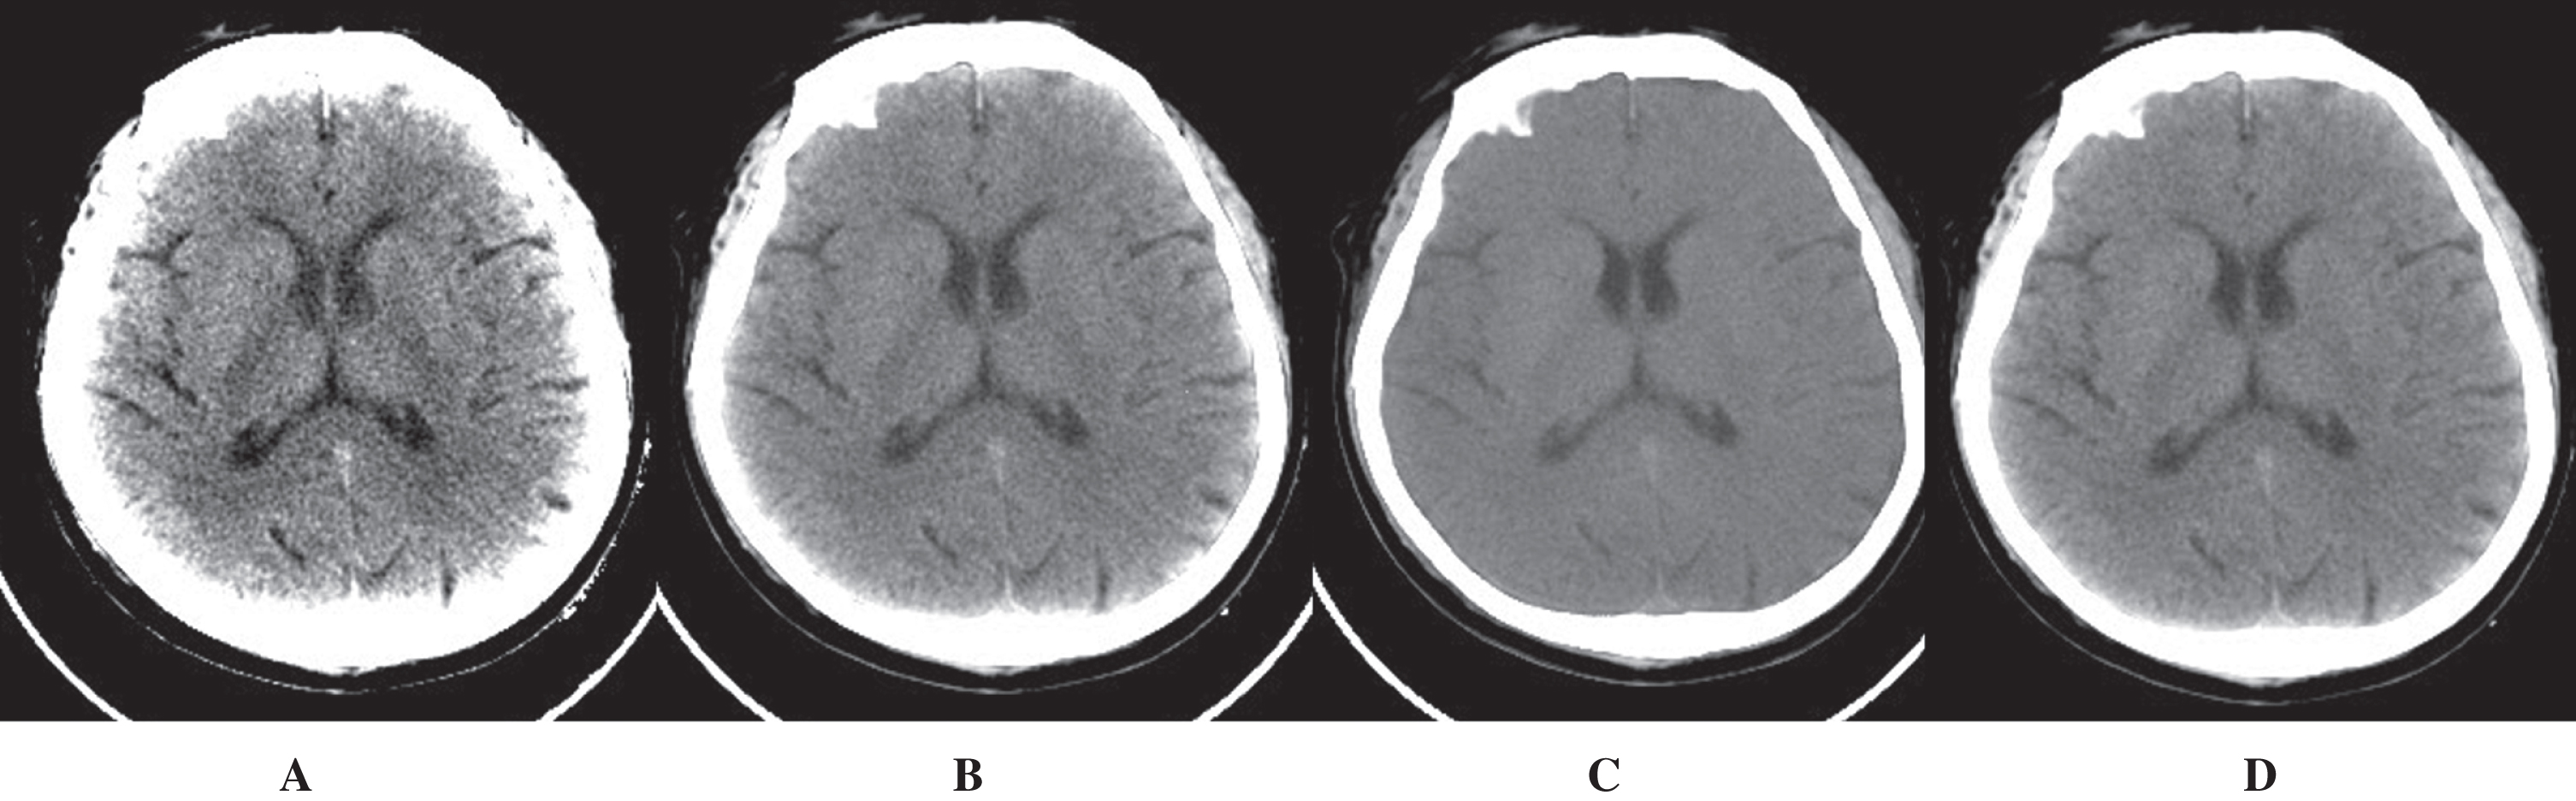
The non-contrast head images in a 73-year-old man, obtained with multiple sets of virtual monochromatic images (VMSI) in dual-energy spectral CT, Comparison of image quality (supratentorial brain) in virtual monochromatic images at 40 keV (A), 65 keV (B), 140 keV (C), and the 120 kVp-like image (D). The greatest difference between mean GM and WM attenuation occurred at 40 keV image, although accompanied by greatest noise. The lowest noise occurred at 140 keV, although simultaneously with lower CNR. A greater differentiation of gray-white matter occurred at 65 keV comparing to 120 kVp-like image
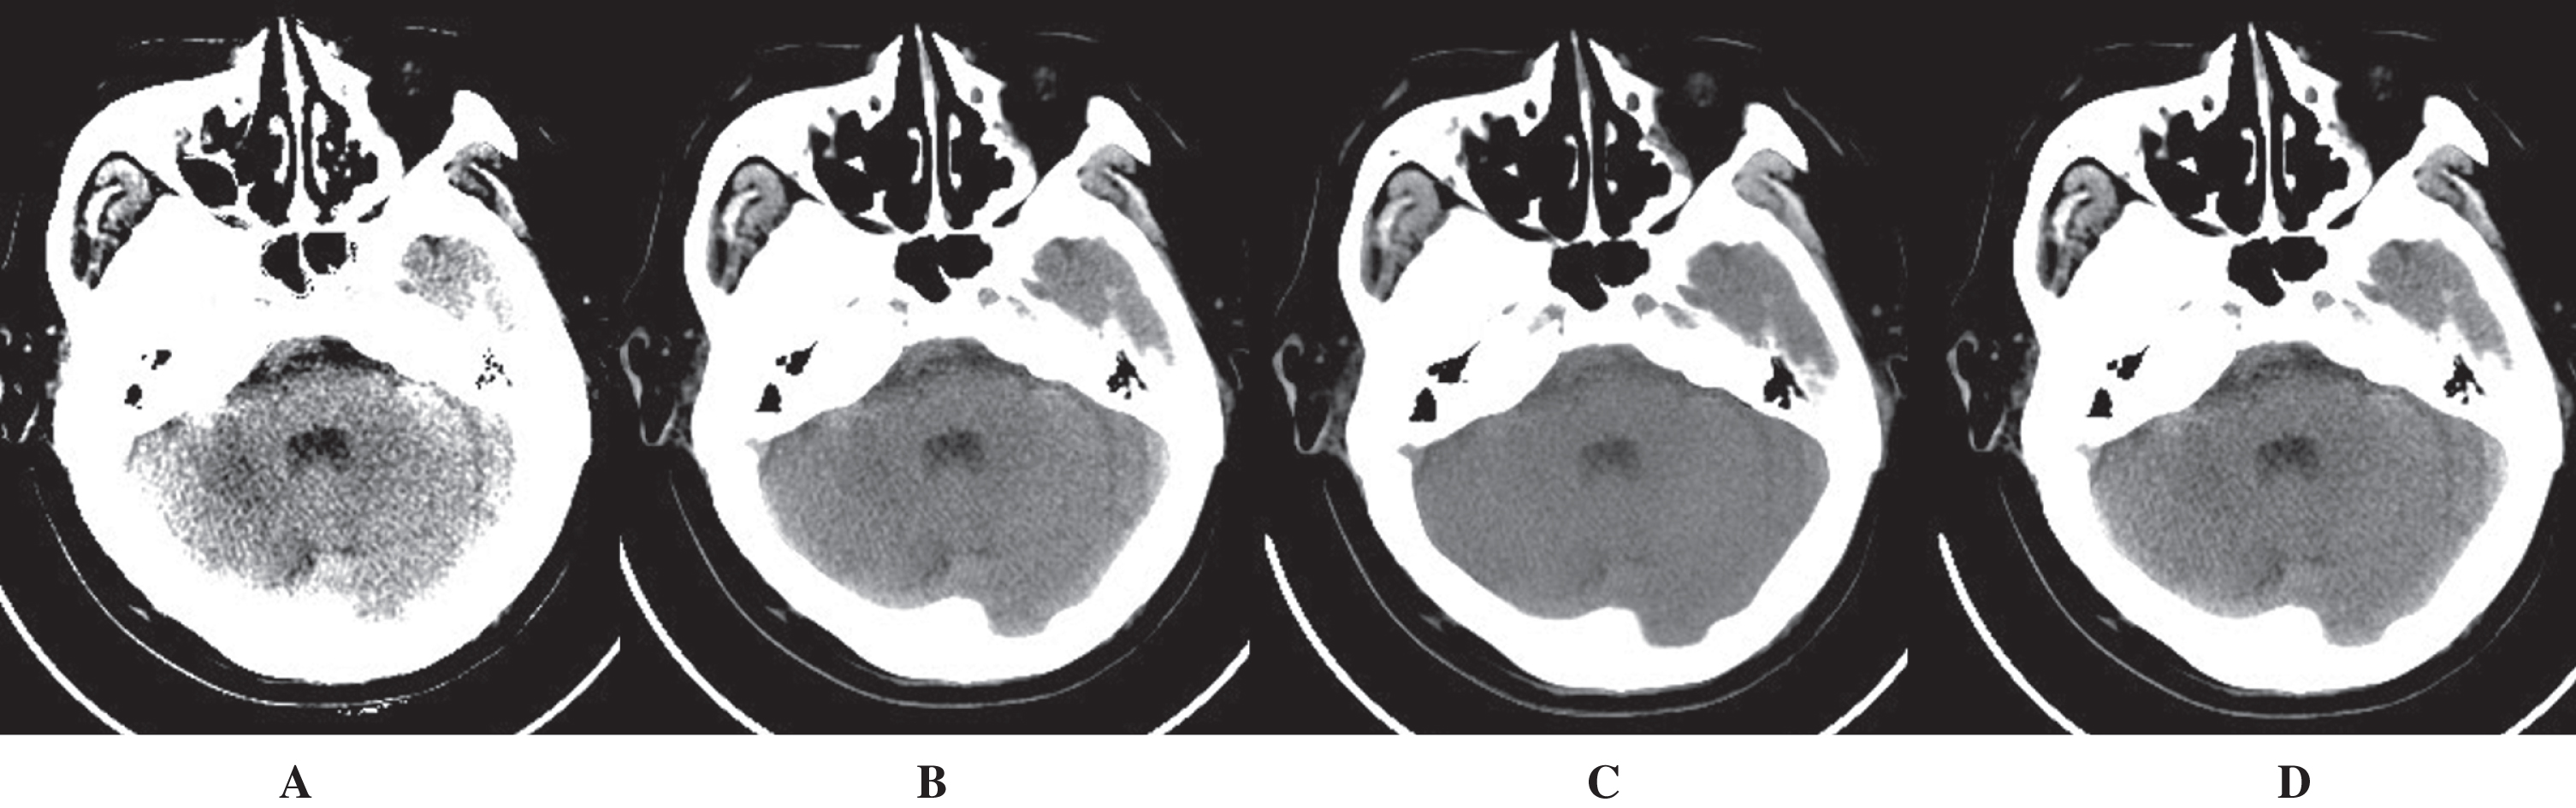
The non-contrast head images in a 47-year-old woman, obtained with multiple sets of virtual monochromatic images (VMSI) in dual-energy spectral CT. Comparison of image quality (infratentorial brain, posterior fossa) in virtual monoenergetic images at 40 keV (A), 75 keV (B), 140 keV (C) and the 120 kVp-like image (D). The lowest PFAI occurred at 140 keV image, but with lower contrast between the gray-white matter. Statistically the 75 keV image has lower PFAI than 40 keV image and 120 kVp-like image. However, PFAI values were not statistically different between the 75 keV image and 120 kVp-like image.
Comparison of objective image quality index measured in the multiple sets of virtual monochromatic images
*Data are presented as mean±SD. GM indicates gray matter; WM, white matter; SNR, signal-to-noise ratio; CNR, contrast-to-noise ratio; SAI, subcalvarial artifact index; PFAI, posterior fossa artifact index; NS, not significant.
The attenuation of both gray and white matter showed a progressive increase from high to low photon energy levels in virtual monochromatic images. Mean gray matter attenuation increased from 25.00 HU±3.75 HU at 140 keV to 60.41 HU±5.42 HU at 40 keV. Mean white matter attenuation increased from 21.96 HU±3.69 HU at 140 keV to 41.34 HU±5.46 HU at 40 keV (Fig. 4A). The maximum gray and white attenuations obtained at 40 keV represented a significant increase relative to all other energy levels (P < 0.05). The percentage increase was much greater in GM relative to WM (142% [35.41 of 25] vs 89% [19.47 of 21.96]), resulting in a greater difference between mean GM and WM attenuation at lower energy levels, albeit accompanied by greater noise, as detailed in the next section.
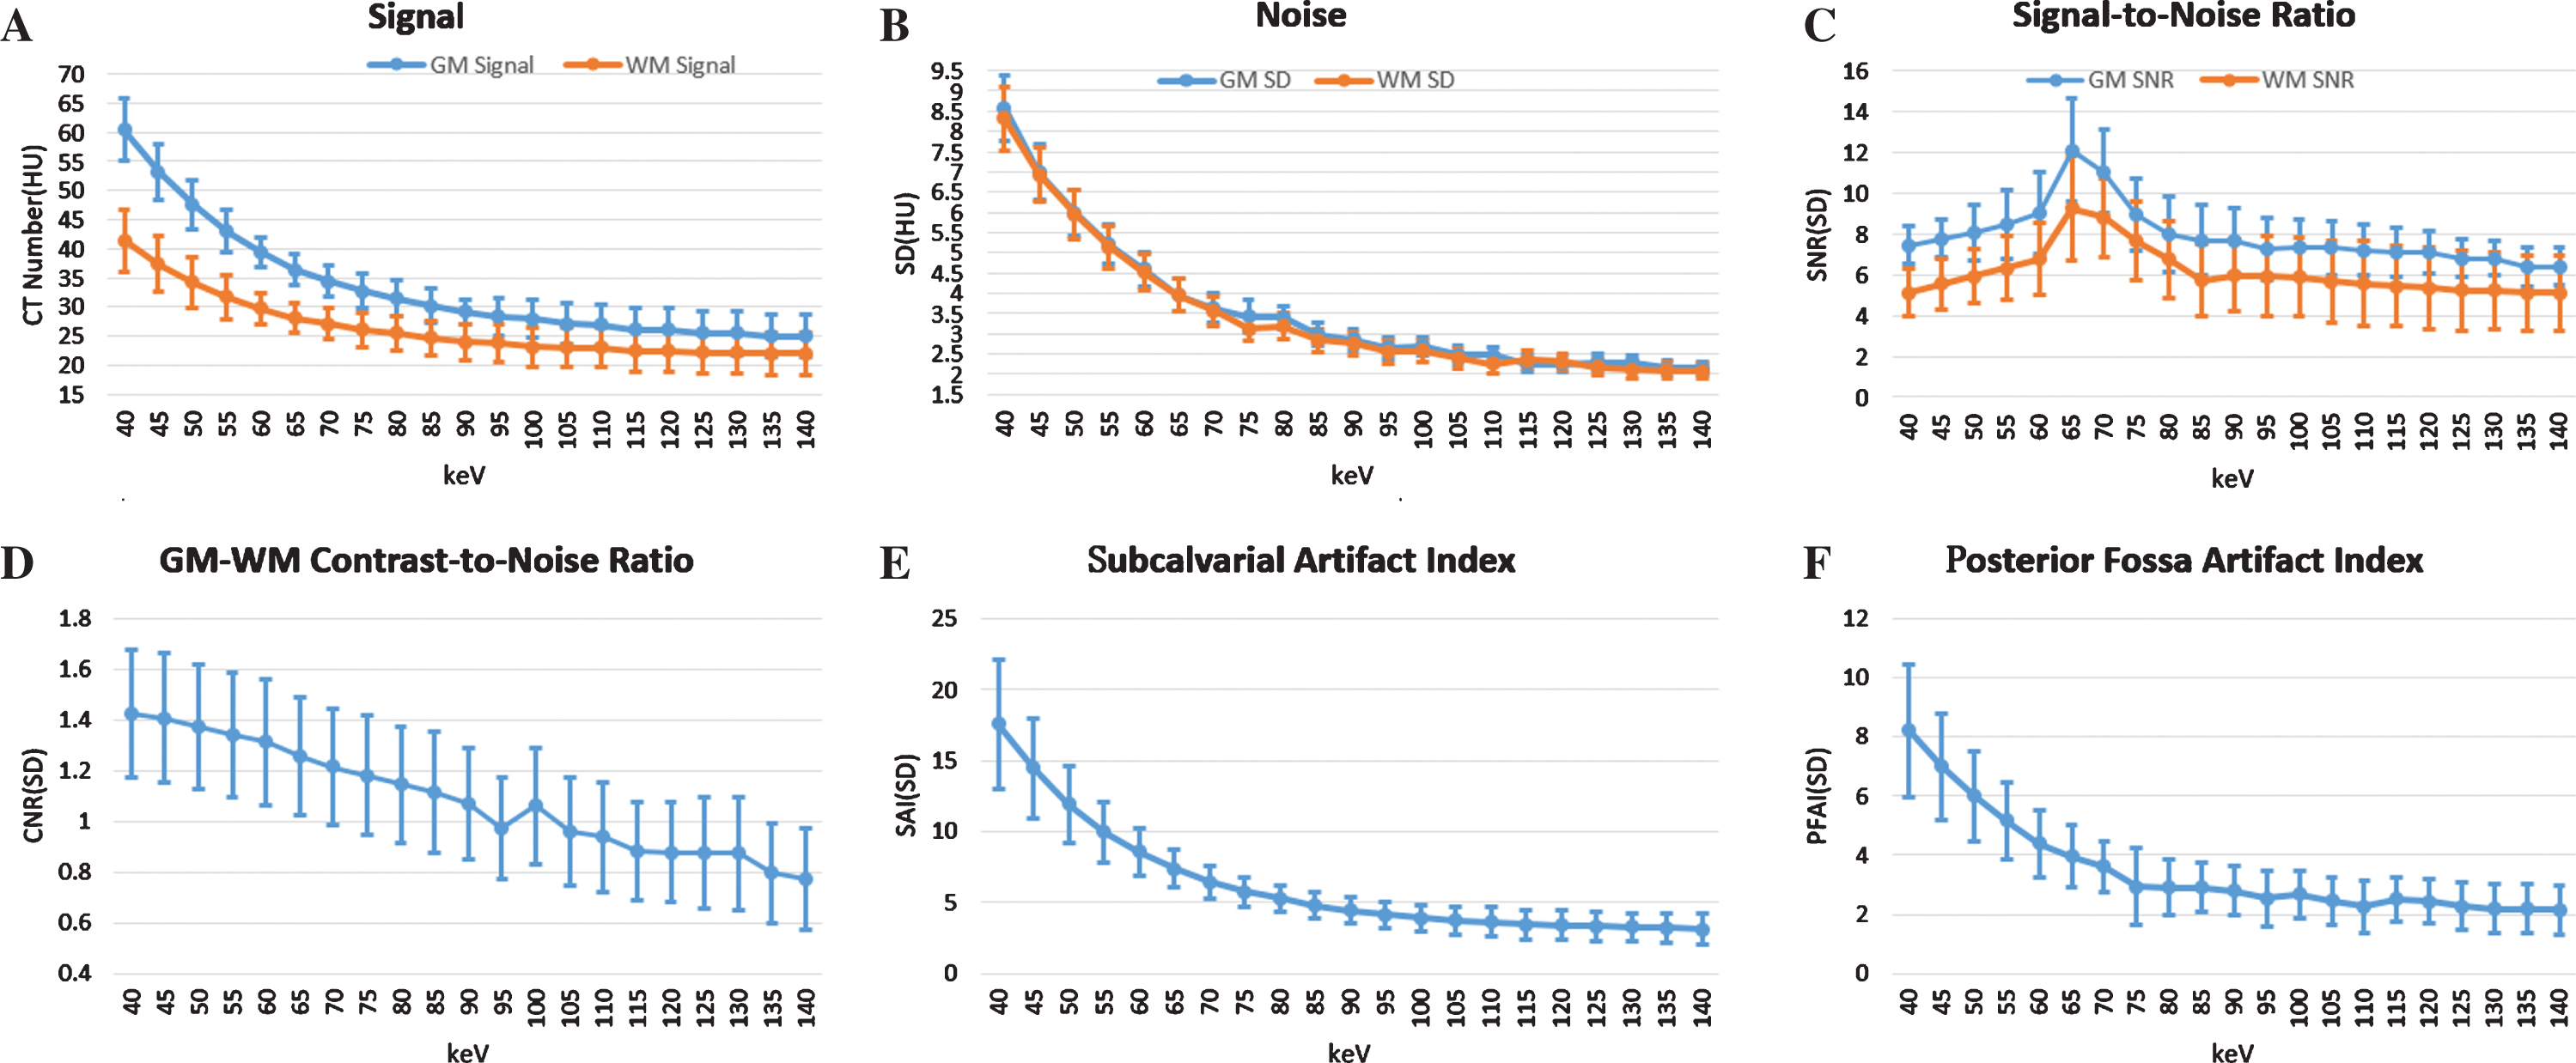
(A–F), Measurements across the range of virtual monochromatic energy levels (40–140 keV) for images reconstructed from non-contrast dual-energy head CT data. A, CT number measurements for the gray matter (GM) and white matter (WM); B, Standard deviation measurements for the GM and WM; C, Signal-to-noise measurements for GM and WM; D, Contrast-to-noise measurements between GM and WM; E, Subcalvarial artifact index (SAI) measurements; and F, Posterior fossa artifact index (PFAI) measurement. For GM and WM, maximal signal and CNR occurred at 40 keV, maximal SNR occurred at 65 keV, and minimal noise occurred at 140 keV. Both SAI and PFAI decreased with increased energy level and tapered off after 75 keV.
Mean gray matter noise decreased from 8.58 HU±0.82 HU at 40 keV to 2.14 HU±0.17 HU at 140 keV, an approximately fourfold decrease. Mean white matter noise decreased from 8.32 HU±0.78 HU at 40 keV to 2.08 HU±0.19 HU at 140 keV, also an approximately fourfold decrease (Fig. 4B).
Gray matter SNR were observed at all energy levels ranging from 6.4±0.94 to 12.10±2.51 with the peak value at 65 keV (Fig. 4C). Significant differences were detected between the peak value and the values at all other VMSI levels (all P < 0.05). White matter SNR ranged from a mean of 5.10±1.83 to 9.25±2.59 with the peak value at 65 keV. The values at all other VMSI levels were significantly lower than the peak value at 65 keV (all P < 0.05), except at 70 keV (mean, 8.81±1.94).
Contrast-to-noise ratio showed a gradual increase with decreasing energy level (Fig. 4D). CNR values between gray and white matter ranged from a mean of 0.78±0.20 to 1.42±0.25, with peak at 40 keV. Statistical significance was found in comparison to all other energy levels (all P < 0.05).
Subcalvarial artifacts close to the skull decreased from 17.57±4.53 at 40 keV to 3.12±1.06 at 140 keV, with peak at 40 keV. The subcalvarial artifacts close to the skull gradually decreased with increasing energy levels (Fig. 4E). The artifacts measured at 40 keV to 70 keV were significantly higher than at 140 keV (P < 0.05).
Artifacts in the posterior fossa ranged from a mean of 2.16±0.83 to 8.22±2.24, with a minimum (representing least posterior fossa artifact) occurring at 140 keV (Fig. 4F). Artifacts increased with decreasing kiloelectron volts. The relative improvement in PFAI at 140 keV was significant (P < 0.05) compared with energy levels at 120 keV and less.
The optimal virtual monochromatic images received superior Likert scores in all 4 criteria compared with the 120 kVp-like images (Table 2). The best assessment of the gray-white matter differentiation was observed at 65 keV (mean score of 4.34±0.80) followed by 60 keV (mean score of 4.28±0.71) (Fig. 5A). No significant difference was found between these two scores (P = 0.34), which were superior compared with the scores of the remaining energy levels (all P < 0.05). Regarding the assessment of the subcalvarial space, virtual monochromatic images at 75 keV (mean score of 4.64±0.38) were rated best followed by 70 keV without statistically significant differences detected (P = 0.47, Fig. 5B). The other energy levels all received significantly lower scores than 75 keV (P < 0.05).
Comparison of subjective image quality criteria rated in the multiple sets of virtual monochromatic images
Comparison of subjective image quality criteria rated in the multiple sets of virtual monochromatic images
*Data are presented as mean±SD. GWMA, indicates assessment of gray-white matter differentiation; SSA, assessment of subcalvarial space.

Mean±SD scores of the subjective analysis in the assessment of the gray-white matter differentiation (A), the assessment of the subcalvarial space (B), artifacts caused by the skull (C), and image noise (D) across the range of kiloelectron volt levels (40–140 keV).
The most severe subcalvarial and posterior fossa artifacts were observed at 40 keV (1.50±0.65) and 45 keV (1.63±0.71); no significant difference was observed between these two scores (P = 0.40). And the best score occurred at 75 keV (Fig. 5C). The lowest supratentorial brain parenchymal image noise and overall image noise were also found at 75 keV with scores of 4.83±0.34 (Fig. 5D).
In this study, we compared the image quality of using multiple sets of virtual monochromatic images reconstructed from non-contrast Dual energy spectral CT scans of the head and assessed the optimal energy levels of VMSI for increasing gray-white matter contrast and reducing beam hardening artifacts caused by posterior fossa and the skull. Although we observed the greatest differences between mean attenuation of gray and white matter at 40 keV, the amount of image noise also increased at this end of the selectable energy spectrum, resulting in lower SNR. Thus, subjective image analysis found virtual monochromatic images at 65 keV best for the assessment of the supratentorial brain, which represents a midspectral energy range, reflecting a balance of these opposing effects on image quality.
Dual-energy (DE) relies on energy dependent photon attenuation by different elements to allow decomposition of materials. VMSI at a specified photon energy level can be generated during the processing of material-density image data by calculating the linear attenuation coefficient. These images are less affected by the beam-hardening effect, and thus provide more accurate Hounsfield unit values than conventional CT scanners with a polychromatic energy beam [21, 22]. Regarding the assessment of subcalvarial space and posterior fossa, the conventional polychromatic beam-hardening and streak artifacts related to the dense surrounding bone of the skull base can significantly degrade CT evaluation [15, 23]. Subjective and objective image analysis found the lowest SAI and PFAI in virtual monochromatic images at 75 keV reconstructions, which could be relevant for the evaluation of subdural and subarachnoid hemorrhages.
The image quality indexes we chose to evaluate are highly relevant to critical neuroimaging tasks, and it is important to understand how they vary through the selectable range of VMSI energy levels. For example, for improving delineation of hypodense parenchymal lesions of the brain as well as reducing subcalvarial artifacts, higher energy levels were better compared with both VMSI at lower energy levels and 120 kVp-like energy level (Fig. 6A, B). While for intraparenchymal hemorrhage of the brain, the radiologist must carefully assess the cortical ribbon to detect any loss of gray and white matter differentiation, thus lower energy levels were better compared with both VMSI at higher energy levels and the 120 kVp-like energy level (Fig. 6C, D, E, F). Simulated 120 kVp images (120 kVp-like images) were postprocessed from the dual-energy spectral CT acquisition and used as a surrogate for conventional single-energy CT to avoid repeat imaging and unnecessary radiation exposure, which has been proved to be suitable in the clinical work. Virtual monochromatic spectral imaging performed with an optimal energy level has the potential to replace 120 kVp CT because of the high-contrast images that it yields without increased image noise [10, 21].
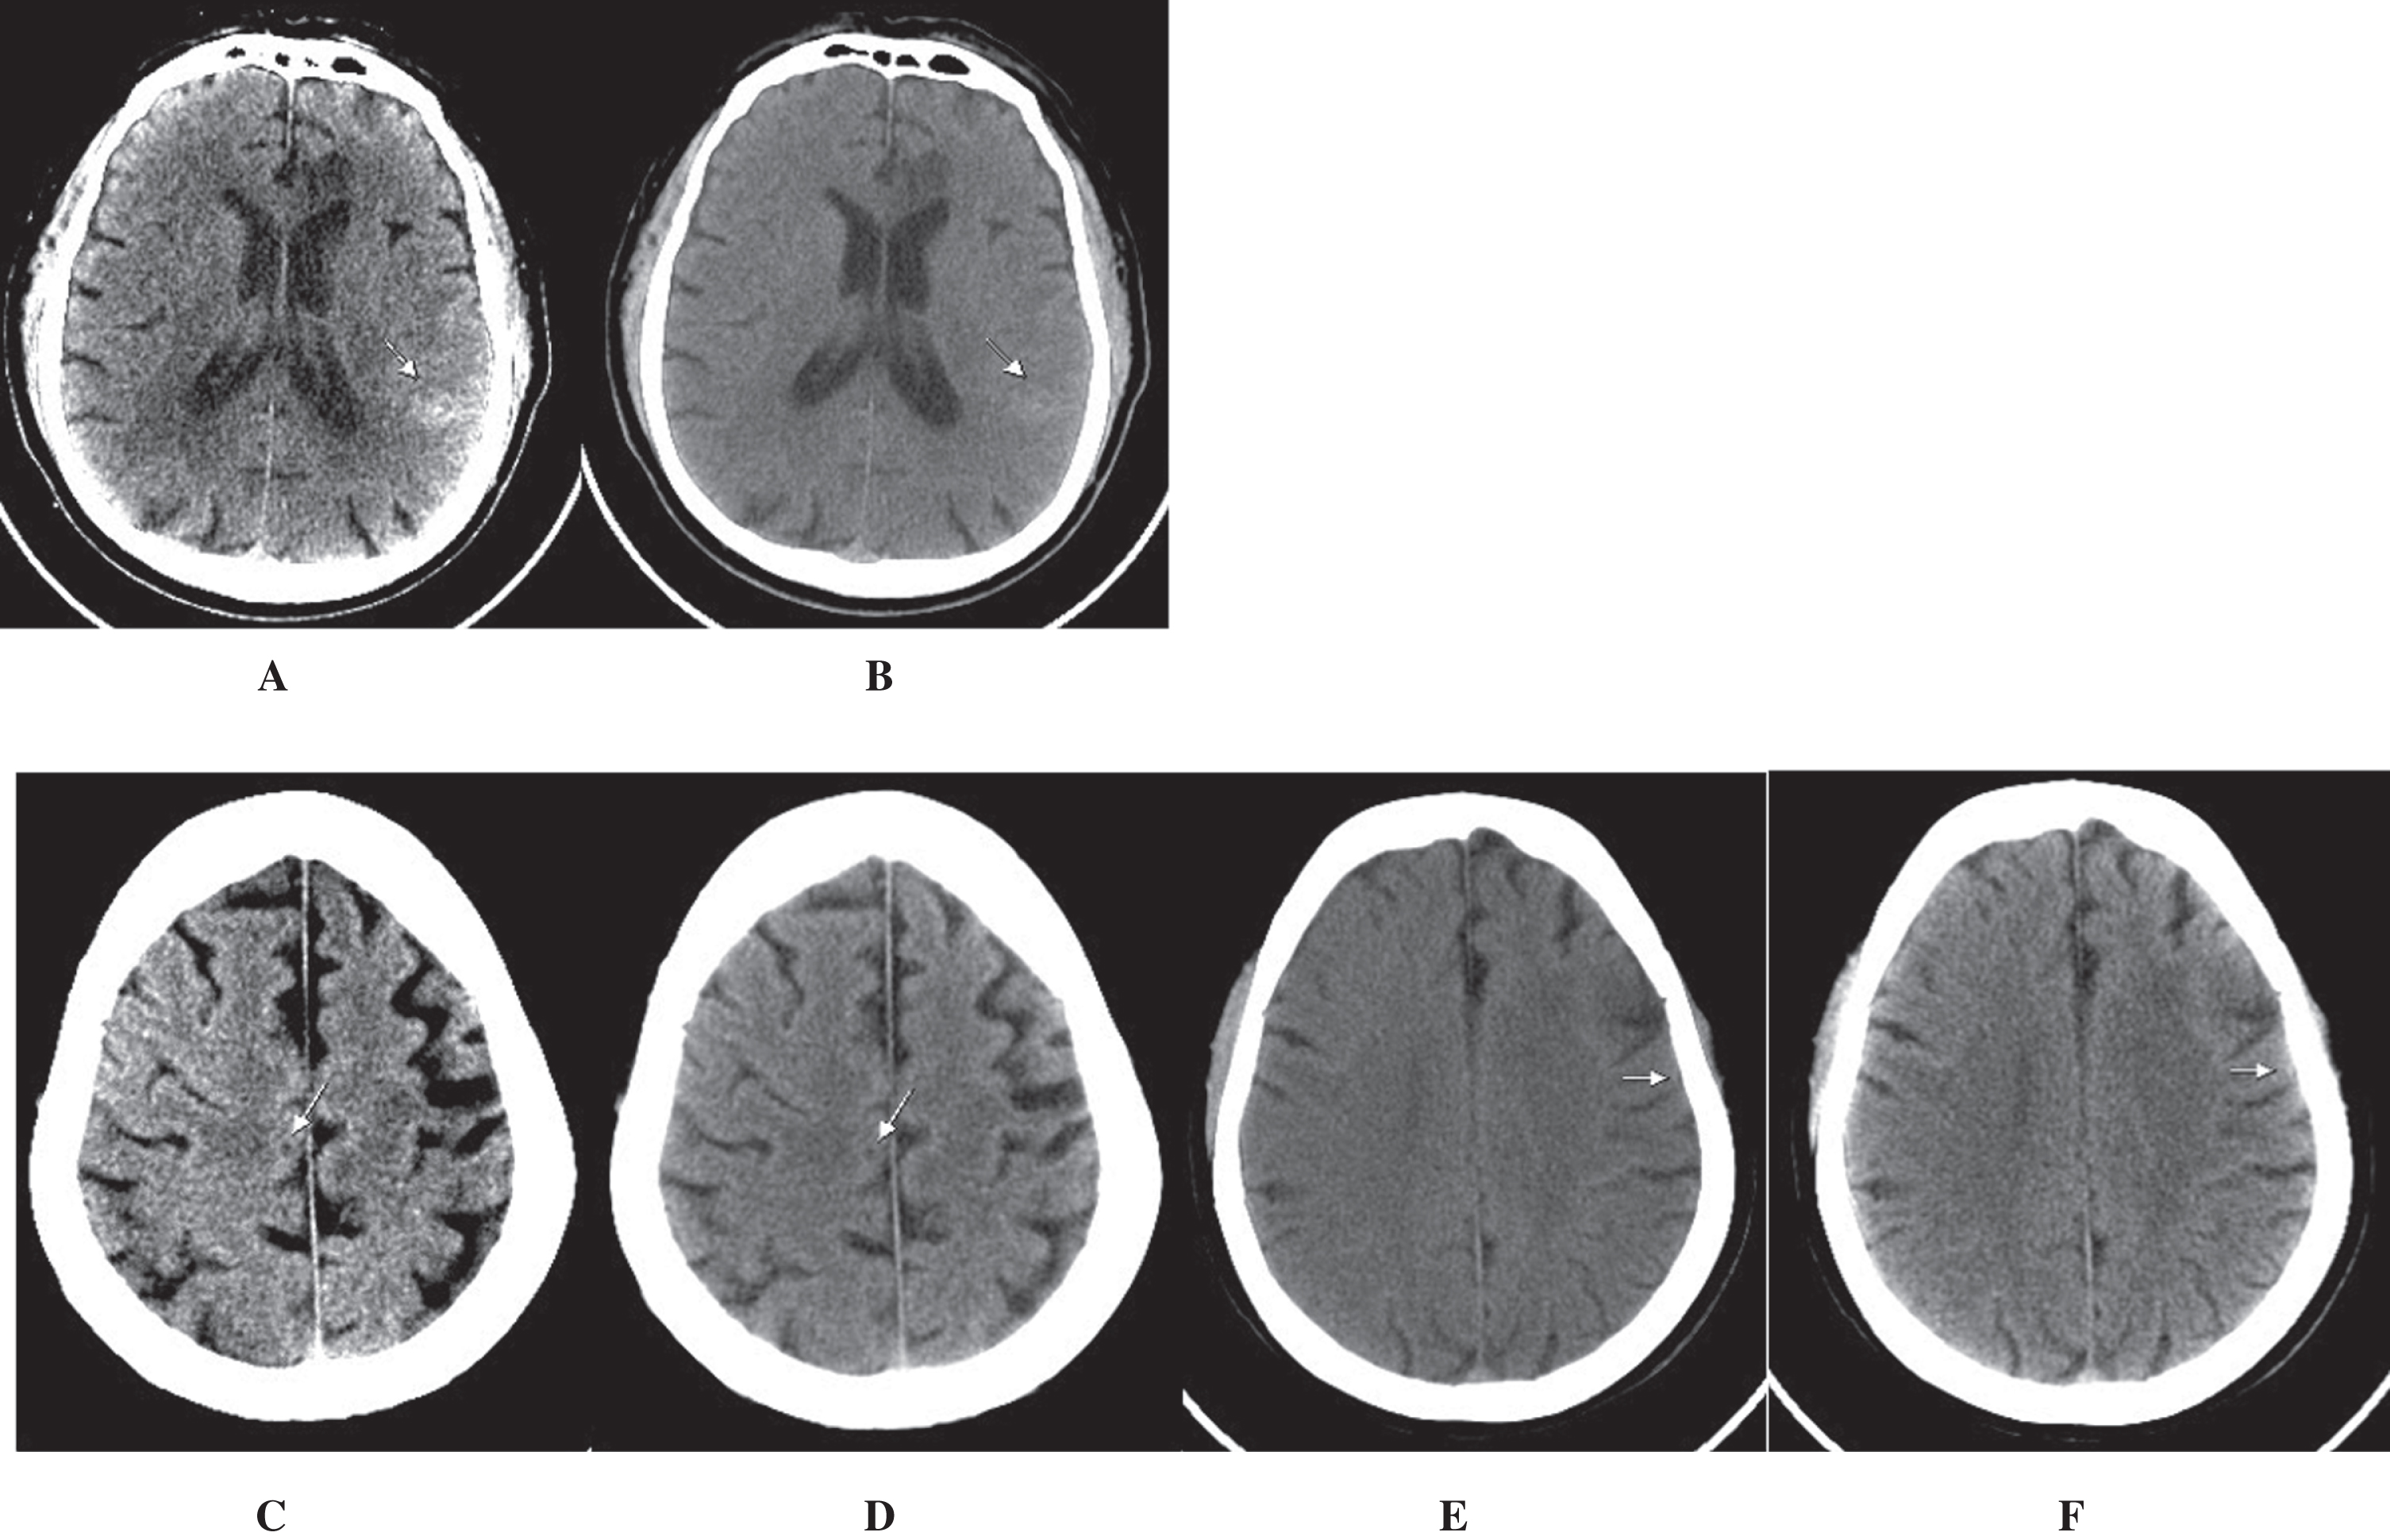
A 77-year-old man with intracranial hemmorrhage. Image examples for better visualizing hyperdense lesions (arrows) in VIM at lower keV (A: 40 keV) that showed in the 120 kVp-like image (B). A 24-year-old male after trauma. Dual-energy unenhanced head CT images with automatic tube current modulation at levels of posterior fossa (C) and midlevel of basal ganglia (D) show no intracranial hemorrhage.Image examples for improved delineation of hypodense parenchymal lesions in VMSI at higher energy levels (C: 140 keV) compared to the 120 kVp-like images (D) as well as reduction of subcalvarial artifacts (E/F) in VMSI.
The VMSI depicts how the imaged object would look if the x-ray source produced x-ray photons at only a single energy level. The unit of measurement for one x-ray photon is kiloelectronvolts and specifies the photon energy for a monochromatic x-ray source. Calculation of the monochromatic image is a linear operation performed on the basis material images. Once a spectral acquisition is completed, postprocessing is applied to generate conventional low- and high-kilovolt-peak attenuation, material density, and synthesized monochromatic 40–140 keV images with use of dedicated software (Gemstone Spectral Imaging Viewer 2.00 and GE Advantage workstation 4.7) [21]. In general, low-kiloelectron volt images (40–70 keV) increase iodine contrast and they also increase noise. Conversely, high-kiloelectron volt images (100–140 keV) decrease noise and provide less contrast. High-kiloelectron volt images are helpful in reducing beam hardening and metal artifacts.
KVp is the peak kilo voltage at which an x-ray tube is operated. keV is the energy that an electron gains when it travels through a potential of one thousand volts. In theory, to obtain an image with 65 keV, a monochromatic x-ray source with 65 keV is required. However, it is very hard to do so in clinical settings. So, the common approach is to generate virtual monochromatic (keV) images by analyzing two sets of energy spectra that comprise the desired photon energy (i.e., 65 keV). In our study, spectral CT imaging was realized by using the fast switching between the 80 kVp (with photon energies from 40 keV to 80 keV) and 140 kVp (with photon energies from 40 keV to 140 keV) tube voltages, and the virtual monochromatic images were generated with photon energies from 40 keV to 140 keV. With the use of a dedicated software (GSI Viewer). A virtual monochromatic image depicts how the imaged object would look if the x-ray source produced only X-ray photons at a single energy. The 65 keV images can be selected from the set of images with energies from 40 keV to 140 keV [10, 21].
Previous studies showed that the improvement of gray-white matter contrast and the recession of beam hardening artifacts in virtual monochromatic images compared with conventional polychromatic images reconstructed from non-contrast DESCT of the head with different technical approaches [10, 19]. For instance, in a few studies using the same image parameters, Pomerantz et al [10] stated that the lowest image noise occurs in the 65–70 keV range and the maximum SNR and GM-WM CNR occurs at 65 keV for the supratentorial brain, and the lowest PFAI for posterior fossa evaluation occurs at 75 keV; Neuhaus et al [18] stated that virtual monochromatic image reconstructed from unenhanced head CT at 65 keV and 120 keV allow to optimize GM-WM CNR and reduce beam hardening artifacts caused by the skull, respectively. Our study results indicated that compared with the 120 kVp-like images, the virtual monochromatic images at optimal energy levels decreased gray and white matter image noise by 3% and 5%; improved the signal-to-noise ratio of gray and white matter by 27% and 15% and the GM-WM contrast-to-noise ratio by 18%; decreased skull-induced beam hardening artifacts by 15%; beam hardening artifacts in the posterior fossa also decreased but without significant difference (P = 0.2). This could have relevant implications for clinical diagnostics, as non-contrast head DESCT is an important predictor of clinical outcome [24, 25].
Beyond the retrospective study design, this study has certain limitations that need to be considered. We solely assessed image quality parameters (subjective and objective); thus, no conclusions on the diagnostic accuracy in detection of pathologies such as cytotoxic edema and subarachnoid or subdural hemorrhage can be drawn from the data presented. Further studies should focus on investigating the diagnostic accuracy of virtual monoenergetic images in CT of the head. Second, due to clinical protection and ethical issues for patients, we did not scan the same patient twice using the conventional 120 kVp tube voltage to obtain the regular polychromatic images. Instead, we used the 120 kVp-like images to represent images that would be normally obtained in conventional imaging setting in terms of average photon energy.
In summary, the optimal energy level for viewing the supratentorial brain and reducing beam hardening artifacts in the subcalvarial space and posterior fossa was 65–75 keV, respectively. Dual-energy spectral CT imaging can be selected on-demand to optimize the imaging tasks in non-contrast head CT.
Conflict of interest
All authors have declared no actual or potential conflict of interest.
Footnotes
Acknowledgments
This study was supported by the grant from National Natural Science Foundation of China (81970446, 81600286) and the China Postdoctoral Science Foundation (2019M652216, 2017M612090) and the Intercollegiate Key Projects of Nature Science of Anhui Province (KJ2018A0197) and the Anhui Natural Science Foundation (201904a07020060)