
Abstract
Background
The high requirements for mammography image quality necessitate a systematic quality assurance process. Digital imaging allows automation of the image quality analysis, which can potentially improve repeatability and objectivity compared to a visual evaluation made by the users.
Purpose
To develop an automatic image quality analysis software for daily mammography quality control in a multi-unit imaging center.
Material and Methods
An automated image quality analysis software using the discrete wavelet transform and multiresolution analysis was developed for the American College of Radiology accreditation phantom. The software was validated by analyzing 60 randomly selected phantom images from six mammography systems and 20 phantom images with different dose levels from one mammography system. The results were compared to a visual analysis made by four reviewers. Additionally, long-term image quality trends of a full-field digital mammography system and a computed radiography mammography system were investigated.
Results
The automated software produced feature detection levels comparable to visual analysis. The agreement was good in the case of fibers, while the software detected somewhat more microcalcifications and characteristic masses. Long-term follow-up via a quality assurance web portal demonstrated the feasibility of using the software for monitoring the performance of mammography systems in a multi-unit imaging center.
Conclusion
Automated image quality analysis enables monitoring the performance of digital mammography systems in an efficient, centralized manner.
Introduction
Breast cancer is the most common cancer among women worldwide, accounting for approximately 25% of all female cancers (1). Early diagnosis of breast cancer is essential for patient survival and it is typically detected using mammography. This demanding radiographic imaging modality requires excellent low-contrast visibility, high spatial resolution, and a wide dynamic range. The high image quality requirements for detecting changes in breast tissue necessitate systematic quality assurance. For quality control purposes there are commercially available phantoms containing target features that simulate typical breast structures: fibers, microcalcifications, and characteristic masses (2–4).
A systematically performed quality control routine aids in ensuring that the mammography system performance remains consistent and the system produces sufficient image quality for diagnostic purposes. Systematic testing can help to detect slow changes (e.g. increased image noise) that may remain unnoticed in clinical images. Traditionally, in an image quality test a user counts the embedded targets seen in a single phantom image. However, visual analysis is subjective and time-consuming, and therefore not optimal for longitudinal performance monitoring. As most contemporary mammography systems are digital, it is now possible to automate the image quality analysis.
Several methods have previously been used for automatic image quality analysis in mammography, including the Fourier transform (5), the discrete wavelet transform (DWT) (6), cross-correlation coefficients between the observed image and a reference (7,8), and Mahalanobis distance-based methods (7). Smithbower et al. (9) have developed an automated and centralized quality assurance platform built around a specifically designed contrast phantom.
The aim of this study was to develop a software for an automated daily mammography quality control procedure in a geographically sparse multi-unit imaging center. The automated image quality analysis was verified against visually rated images. Furthermore, long-term image quality trends of a full-field digital mammography (FFDM) system and a computed radiography (CR) mammography system were investigated.
Material and Methods
Phantoms and image acquisition
At the time of data collection, our hospital district had eight mammography systems from three vendors (four FFDM and four CR systems) located in seven hospitals. Every day before the first patient study, a single image of the American College of Radiology (ACR) accreditation phantom is acquired, with imaging parameters corresponding to clinical protocols and using the same automatic exposure control settings. The phantoms come from two vendors: Gammex (Gammex, Inc., Middleton, WI, USA) and CIRS (Computerized Imaging Reference Systems, Inc., Norfolk, VA, USA). Each acrylic phantom contains a wax block embedded with six fibers, five groups of six microcalcifications, and five masses (2). Figure 1 shows the wax area of the ACR phantom.
An average of 30 ACR phantom images showing six fibers of different thicknesses, five microcalcification groups, and five masses of different diameters and thicknesses. Not all targets are usually visible in a typical quality assurance image.
Image analysis software
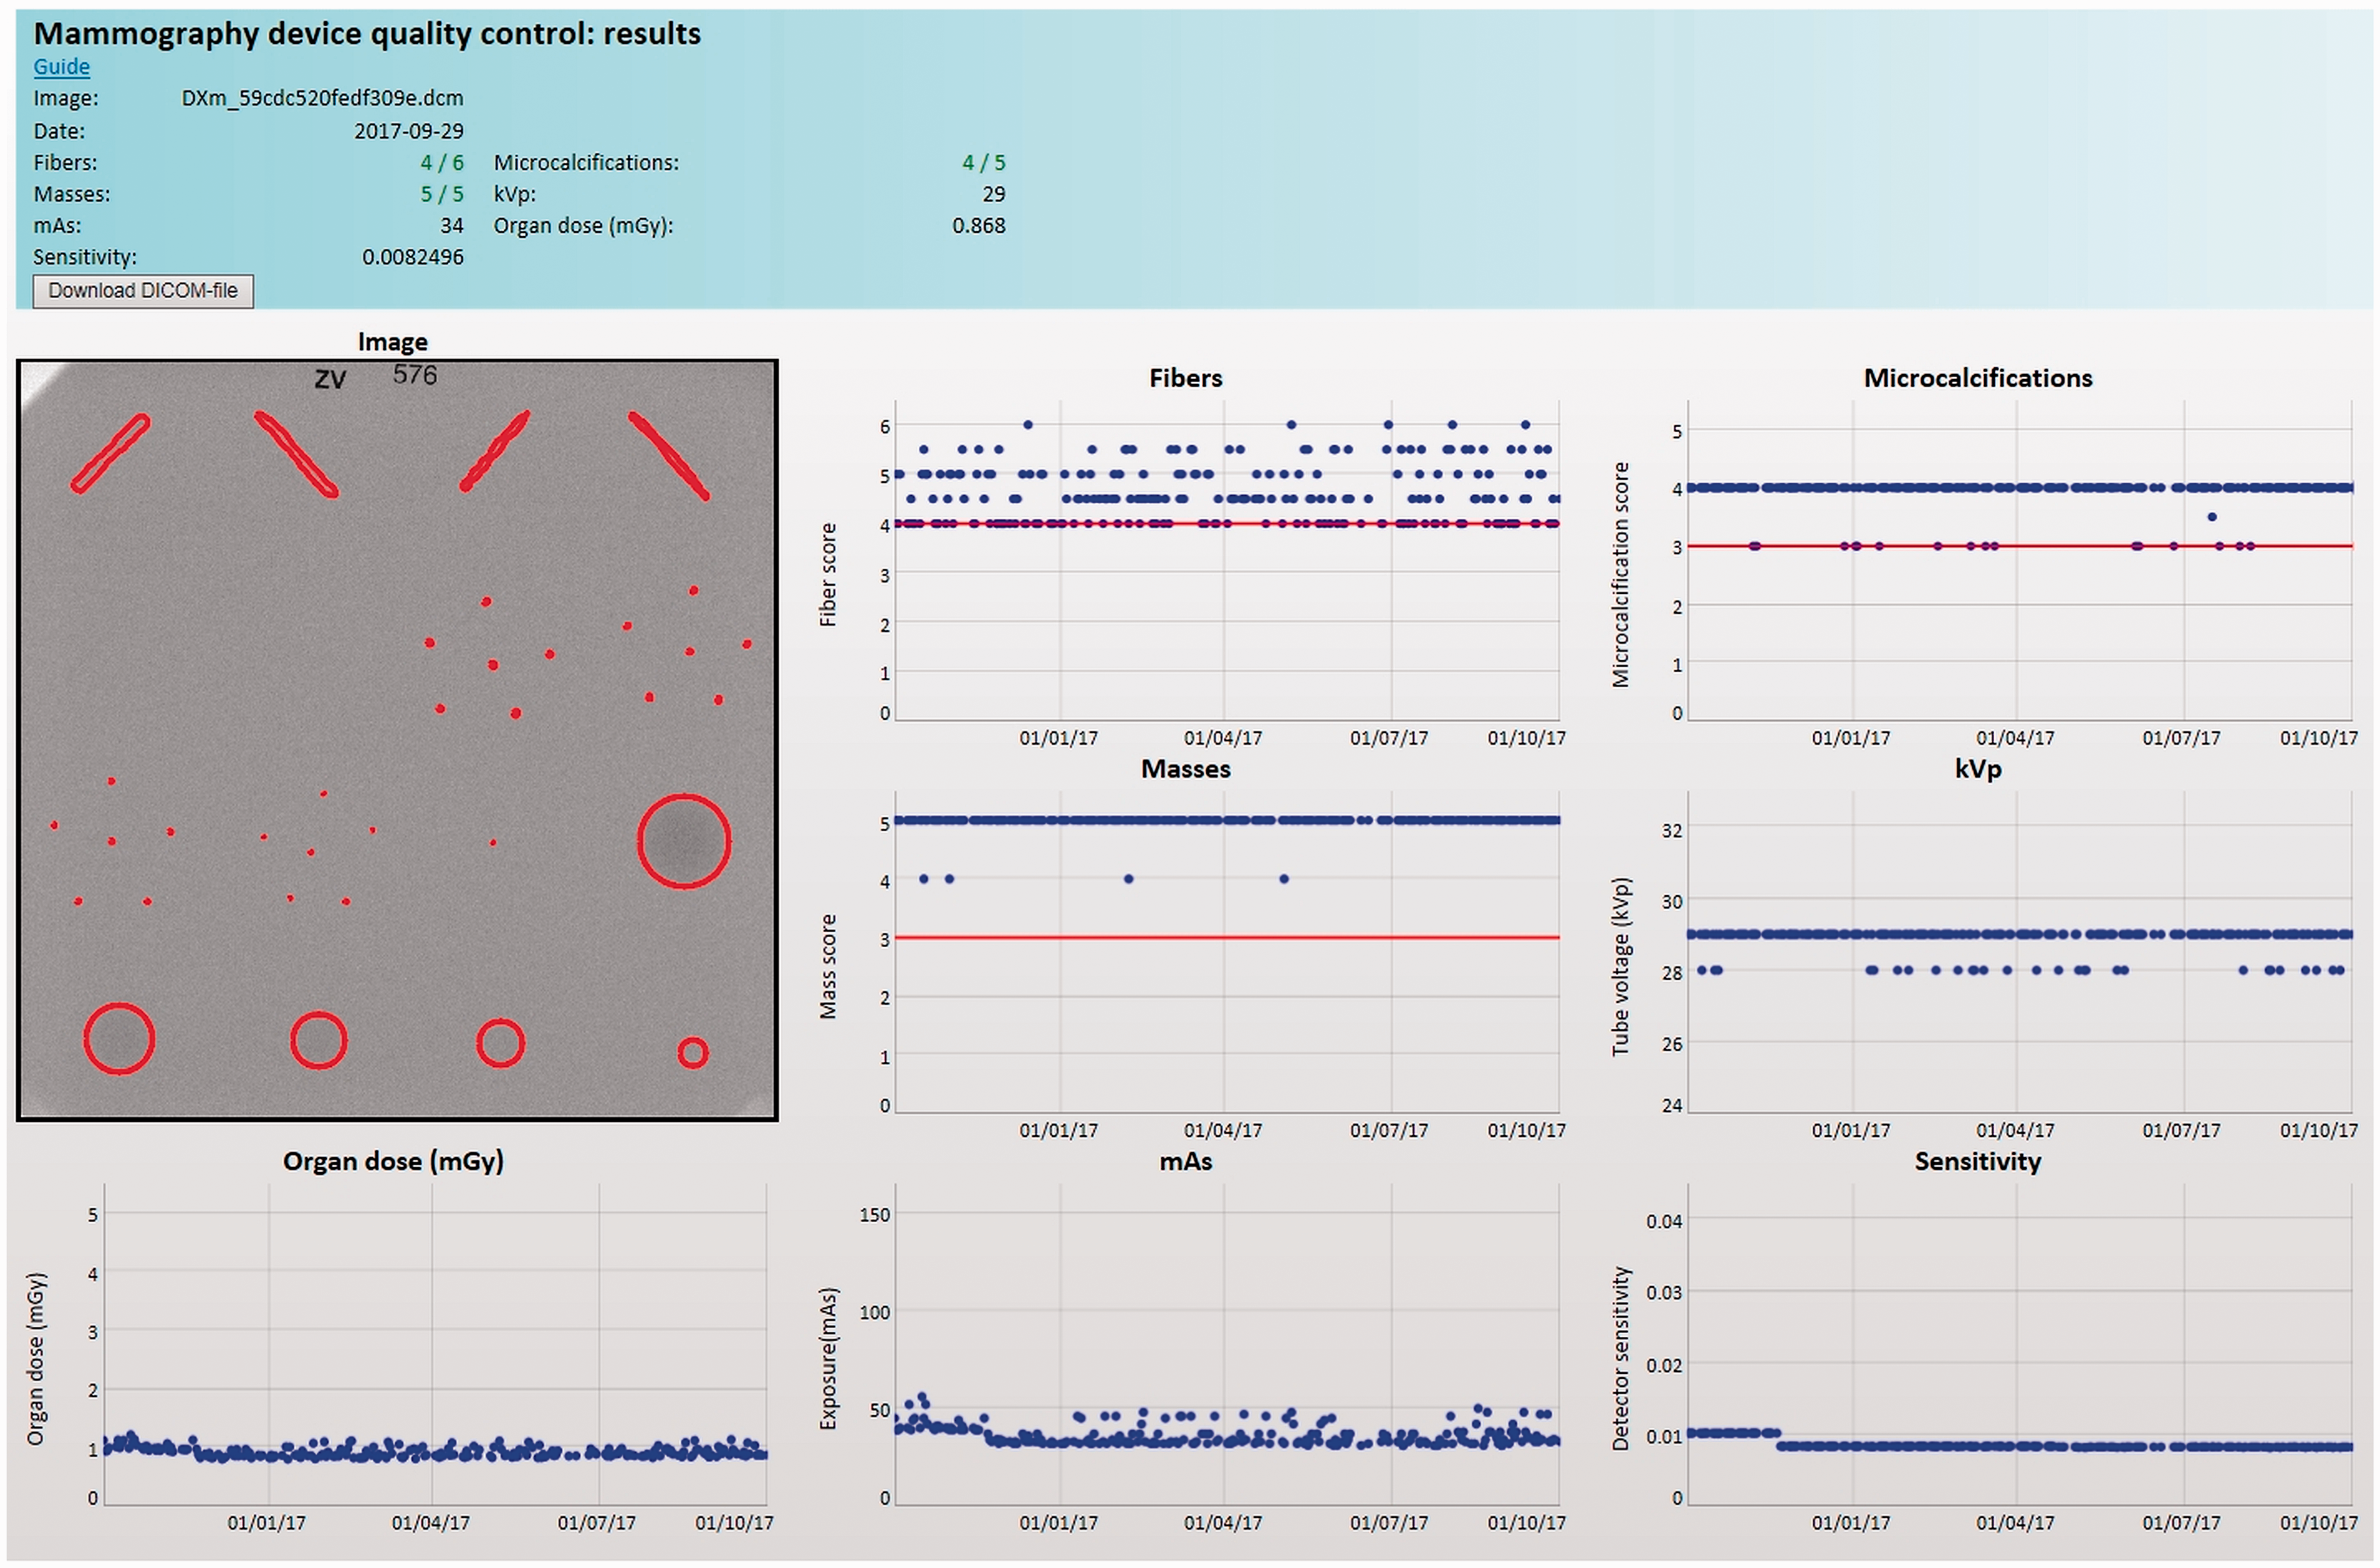
The phantom images are sent to a Linux (Debian 8.5) server and analyzed automatically with a program developed in-house using MATLAB (MathWorks, Natick, MA, USA). The results are made available on an interactive web page available to users and technical staff (Fig. 2). In addition to the image analysis itself, the software gathers relevant metadata from the DICOM header, such as tube voltage, exposure, organ dose, and detector sensitivity. The metadata and analysis results are appended into device-specific database files. The data are then visualized as device-specific time series on a web page available in the hospital district intraweb (Fig. 3). The browser-side visualization is performed using the open source JavaScript charting library dygraphs (10). Clicking on a single data point brings up extra information on that particular analysis, including an image of the detected features and their borders. The image analysis process is described below.
Data flow in the automated quality assurance (QA) process. Users send the phantom images to the dedicated QA server. On the server, the images are analyzed and the results stored and hosted on an interactive webpage. The same interface can also be adapted to other modalities and viewed by their users or QA specialists. A screen capture from the quality control webpage showing the image quality analysis results and relevant image metadata. Individual tests can be selected for viewing by clicking the corresponding point in the time series. The original DICOM file can be downloaded for further inspection.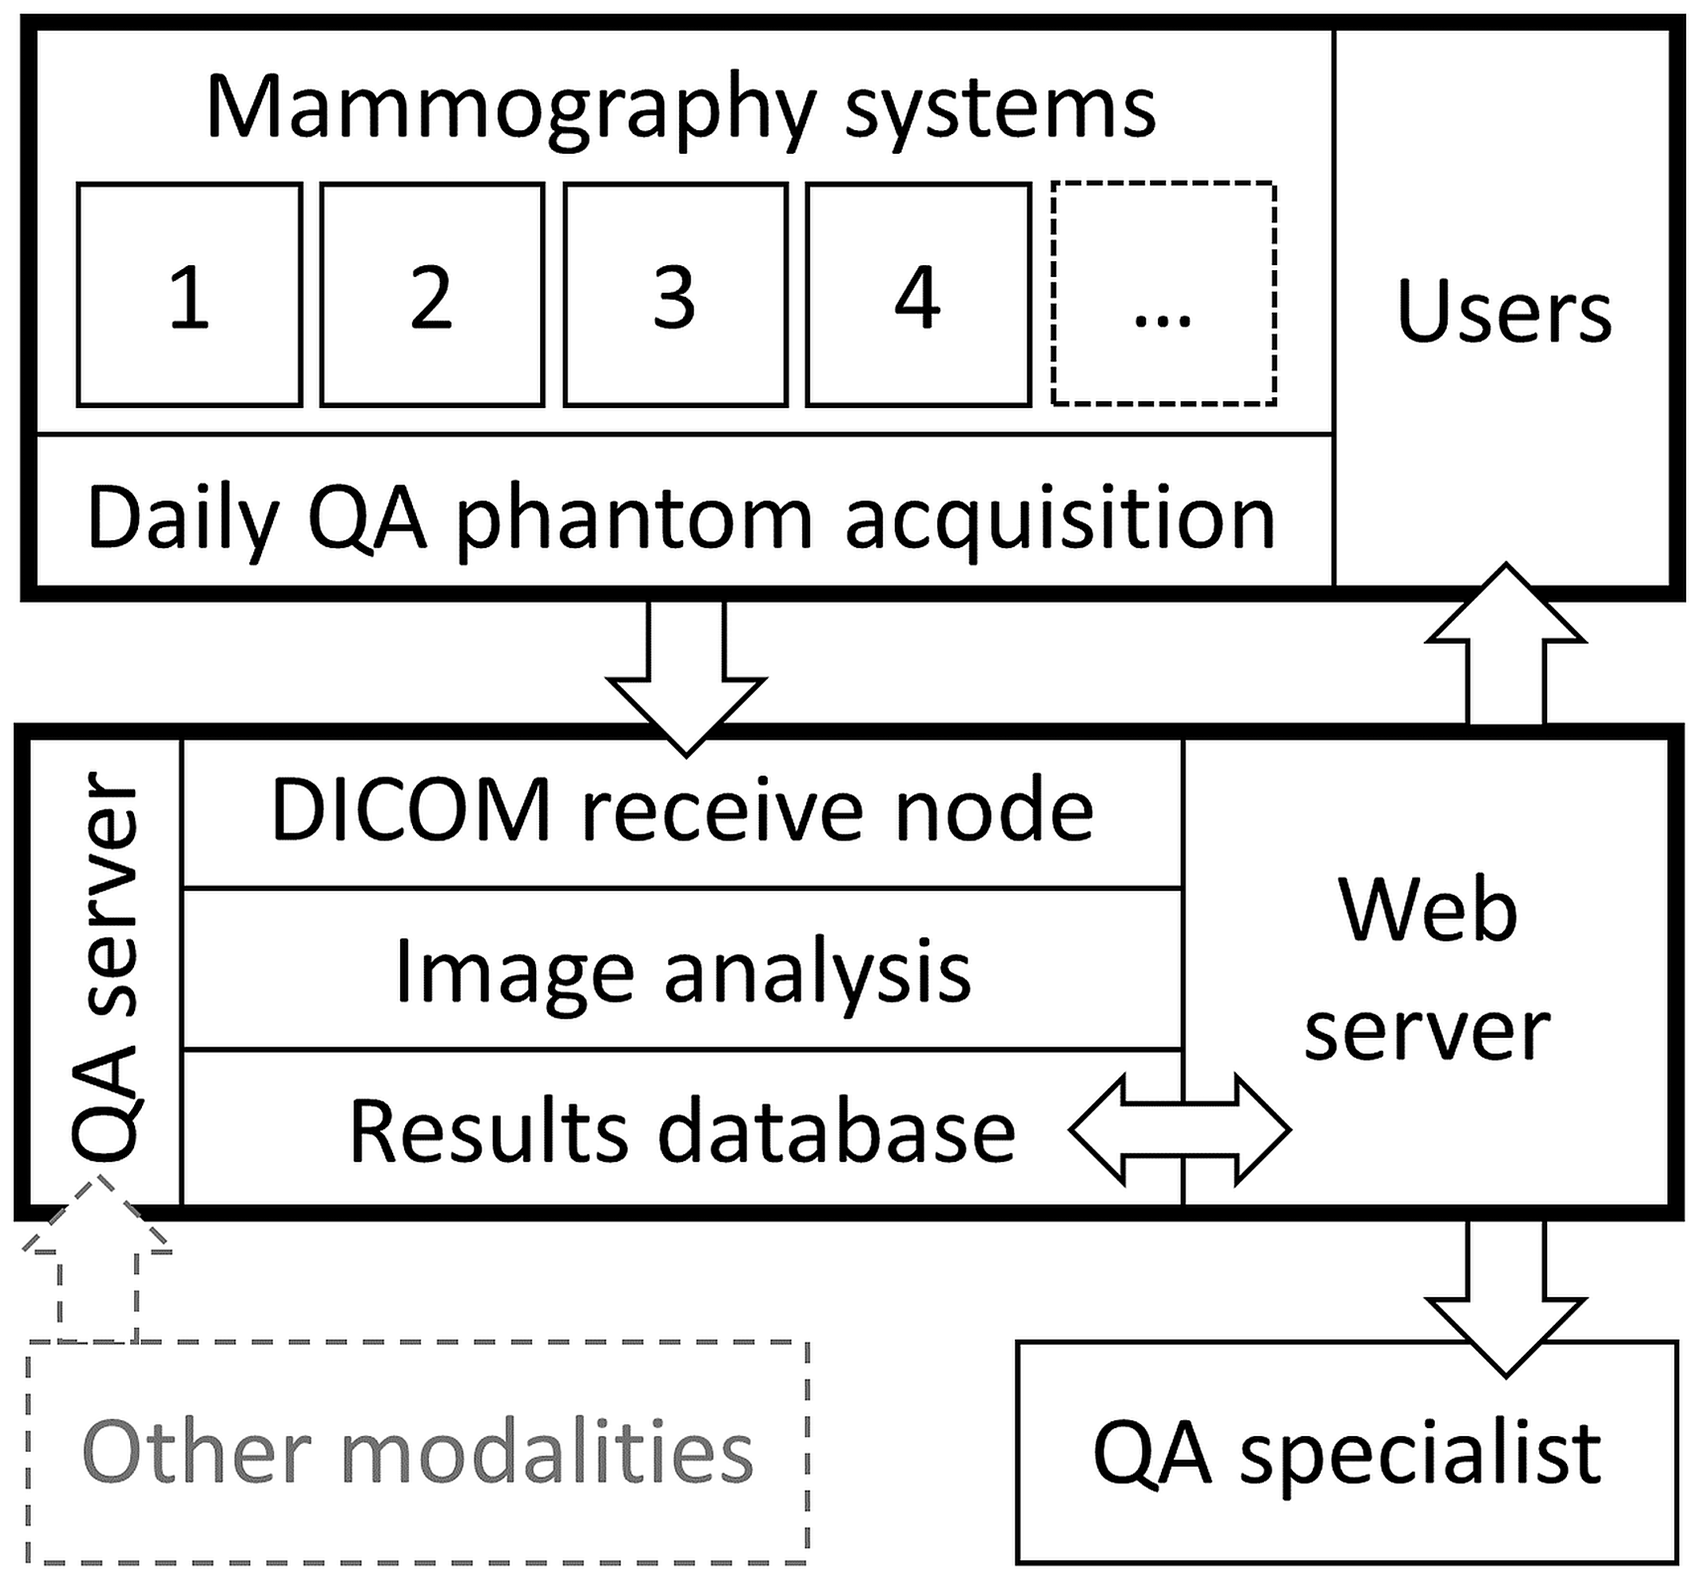
First, the phantom’s wax area is located and isolated, and the image is rotated to the right orientation. Each target (masses, fibers, and microcalcification groups) is extracted from the image and analyzed separately. The discrete wavelet transform (described in Appendix 1) and multiresolution analysis are used to enhance target visibility similarly to Alvarez et al. (6). In our implementation, decomposition is done using Daubechies 45 base functions (11). After multiresolution analysis the image is binarized. To accept a fiber as being detected, the measured length has to be in the range of 0.5–1.5 cm. In addition, the measured fiber angle is used as a detection requirement. A score of 0.5 points is given to a detected fiber <0.75 cm and 1.0 points if it is ≥0.75 cm. For microcalcification groups, three separate calcifications have to be found to be scored 0.5 points, and four to six calcifications to be scored 1.0 points. A characteristic mass is accepted as detected if the computed radius is in the range of 50–100% of the physical radius. For detected masses half points are given for a radius of <75% and 1.0 points for ≥75%. The roundness of the mass is applied as an additional requirement for detection.
Software validation and long-term trends
Sixty anonymized ACR phantom images acquired using clinical settings were randomly selected for software validation. Of these images, 56 were “processed” and four from a single device were “unprocessed” (or “raw” images). Each mammography system had its own phantom. Additionally, 20 ACR phantom images were acquired with a single FFDM device (Mammomat Inspiration, Siemens Healthineers, Erlangen, Germany) using ten different dose levels (two acquisitions per dose level). These images were used to validate the software with different noise contents. The mean glandular doses were in the range of 0.1–4.1 mGy. Tube voltage was 28 kVp and exposures were 8, 11, 14, 25, 40, 64, 80, 125, 220, and 320 mAs.
The images were viewed on a radiological workstation (two 3MP gray level radiologic displays, Agfa Impax 6.5 PACS client, Agfa Healthcare, Greenville, SC, USA). Before the visual image analysis, monitor quality assurance measurements in line with the American Association of Physicists in Medicine Task Group 18 report (12) were performed. Four reviewers (two medical physicists and two physics residents) examined the images independently in a blinded manner and rated the visibility of the targets. Each fiber and mass was evaluated using the following grades: 1 point = visible; 0.5 points = barely visible; and 0 points = non-visible. The individual microcalcifications were evaluated as either visible (1 point) or non-visible (0 points), and the scoring of each microcalcification group was evaluated using the same standards as in the automated analysis. The subjective image analyses were performed using 1:1 zoom (one pixel of the image represents one pixel on the monitor) and the reviewers were allowed to adjust the windowing freely. The averages of the visual scoring performed by the four reviewers were compared to the scoring given by the automated analysis software.
Finally, the validated QA software was applied to time-series from two mammography systems: a Siemens Mammomat Inspiration FFDM system and a Planmed Nuance Classic (Planmed Oy, Helsinki, Finland) with a Fujifilm CR system (Fujifilm Corporation, Tokyo, Japan). The image quality and mean glandular dose were studied over a three-year period.
Statistical analysis
The Wilcoxon signed rank test was used to carry out pairwise comparisons of the observed targets seen by the visual and automated analyses. The inter-rater agreement was measured using the Fleiss Kappa measure (k) between the four readers. SPSS statistical software version 22 (SPSS Inc, Chicago, IL, USA) was used to perform all tests at a 5% significance level.
Results
Visual analysis and software validation
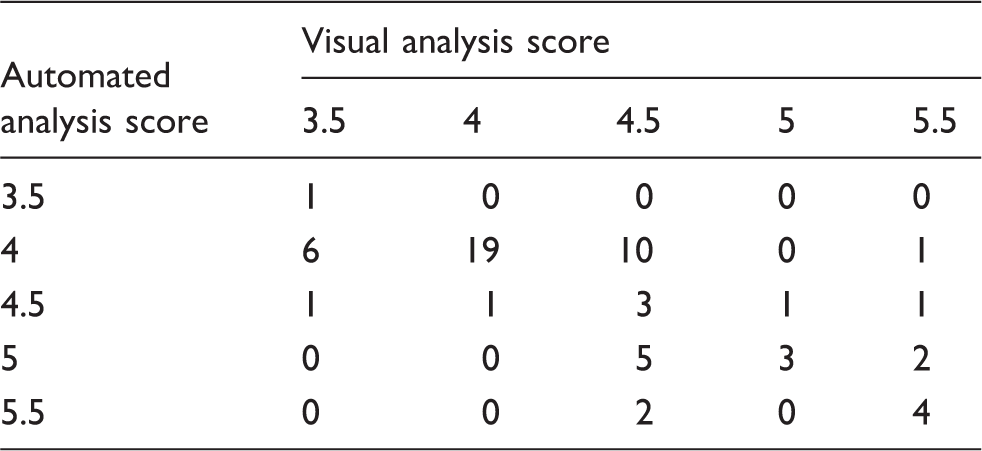
The number of detected fibers in the automated analysis and visual analysis.
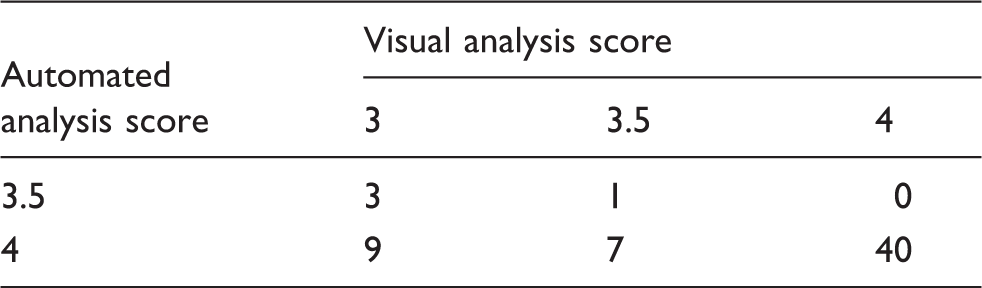
The number of detected microcalcification groups in the automated analysis and visual analysis.
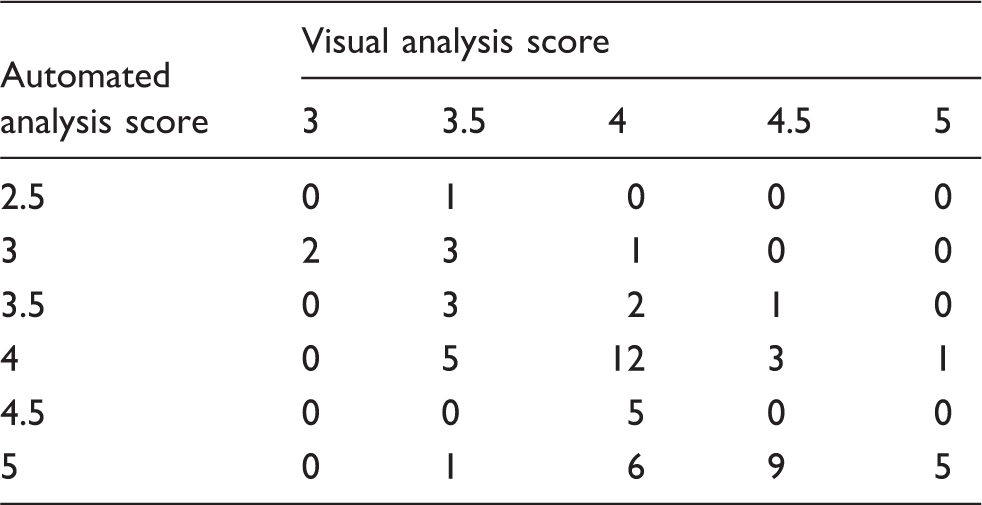
The number of detected characteristic masses in the automated analysis and visual analysis.
Reviewers’ mean scores for detecting targets from the 60 validation images.

SD, standard deviation.
The mean number of detected fibers per image was 4.4 ± 0.5 and 4.4 ± 0.6 for the automated and visual analyses, respectively. There was no statistically significant difference between the total scores (P = 0.89) or in a pairwise comparison of individual fibers (P = 0.37). The inter-rater agreement in detecting individual fibers was substantial between the four raters (k = 0.75).
The mean number of detected microcalcification groups per image was 4.0 ± 0.1 and 3.7 ± 0.4 for the automated and visual analyses, respectively. The automated analysis software detected more microcalcification groups than the visual observers (P < 0.001). Similarly, the pairwise comparison of individual microcalcifications showed a statistically significant difference (P < 0.001). However, the detectability of microcalcification groups 1, 2, 3 and 5 was rated to be comparable between the methods (P = 1.00) whereas the pairwise comparison of the detected microcalcifications in group 4 showed statistically significant differences between the methods (P < 0.001), with the automated analysis yielding higher scores. The inter-rater agreement in detecting individual microcalcifications was almost perfect between the four observers (k = 0.91), and substantial (k = 0.60) in detecting the microcalcification groups.
The mean number of detected masses per image was 4.2 ± 0.7 and 4.1 ± 0.5 for the automated and visual analyses, respectively. There was no statistically significant difference between the total scores (P = 0.051). However, the pairwise comparison of individual masses showed statistically significant differences between the methods (P = 0.04). There were no statistically significant differences between the methods for detection of masses with regard to size (0.32 ≤ P ≤ 1.00), except for the smallest mass (P < 0.002). The inter-rater agreement in detecting individual masses was moderate (k = 0.57) between the four raters and low in rating the number of detected masses (k = 0.18).
Figure 4 shows the mean number of detected fibers, microcalcifications, and masses in the automated and visual analyses at different mean glandular dose levels for the 20 processed images. The mean absolute differences between visual analysis and automatic software were 0.4 ± 0.5 for fibers, 0.2 ± 0.3 for microcalcifications, and 0.6 ± 0.5 for masses in this dataset. The inter-rater agreement between the four raters in detecting individual objects was almost perfect for fibers (k = 0.90) and microcalcifications (k = 0.92), and substantial for masses (k = 0.71), and the agreement in rating the number of detected objects was substantial for fibers (k = 0.64) and microcalcifications (k = 0.75), and fair for masses (k = 0.26). The detection trends of the objects followed each other with different dose levels between the automated analysis and visual analysis.
Mean number of detected fibers (a), microcalcifications (b), and masses (c) for the automated and visual analyses with different mean glandular dose (MGD) levels for the 20-image dataset.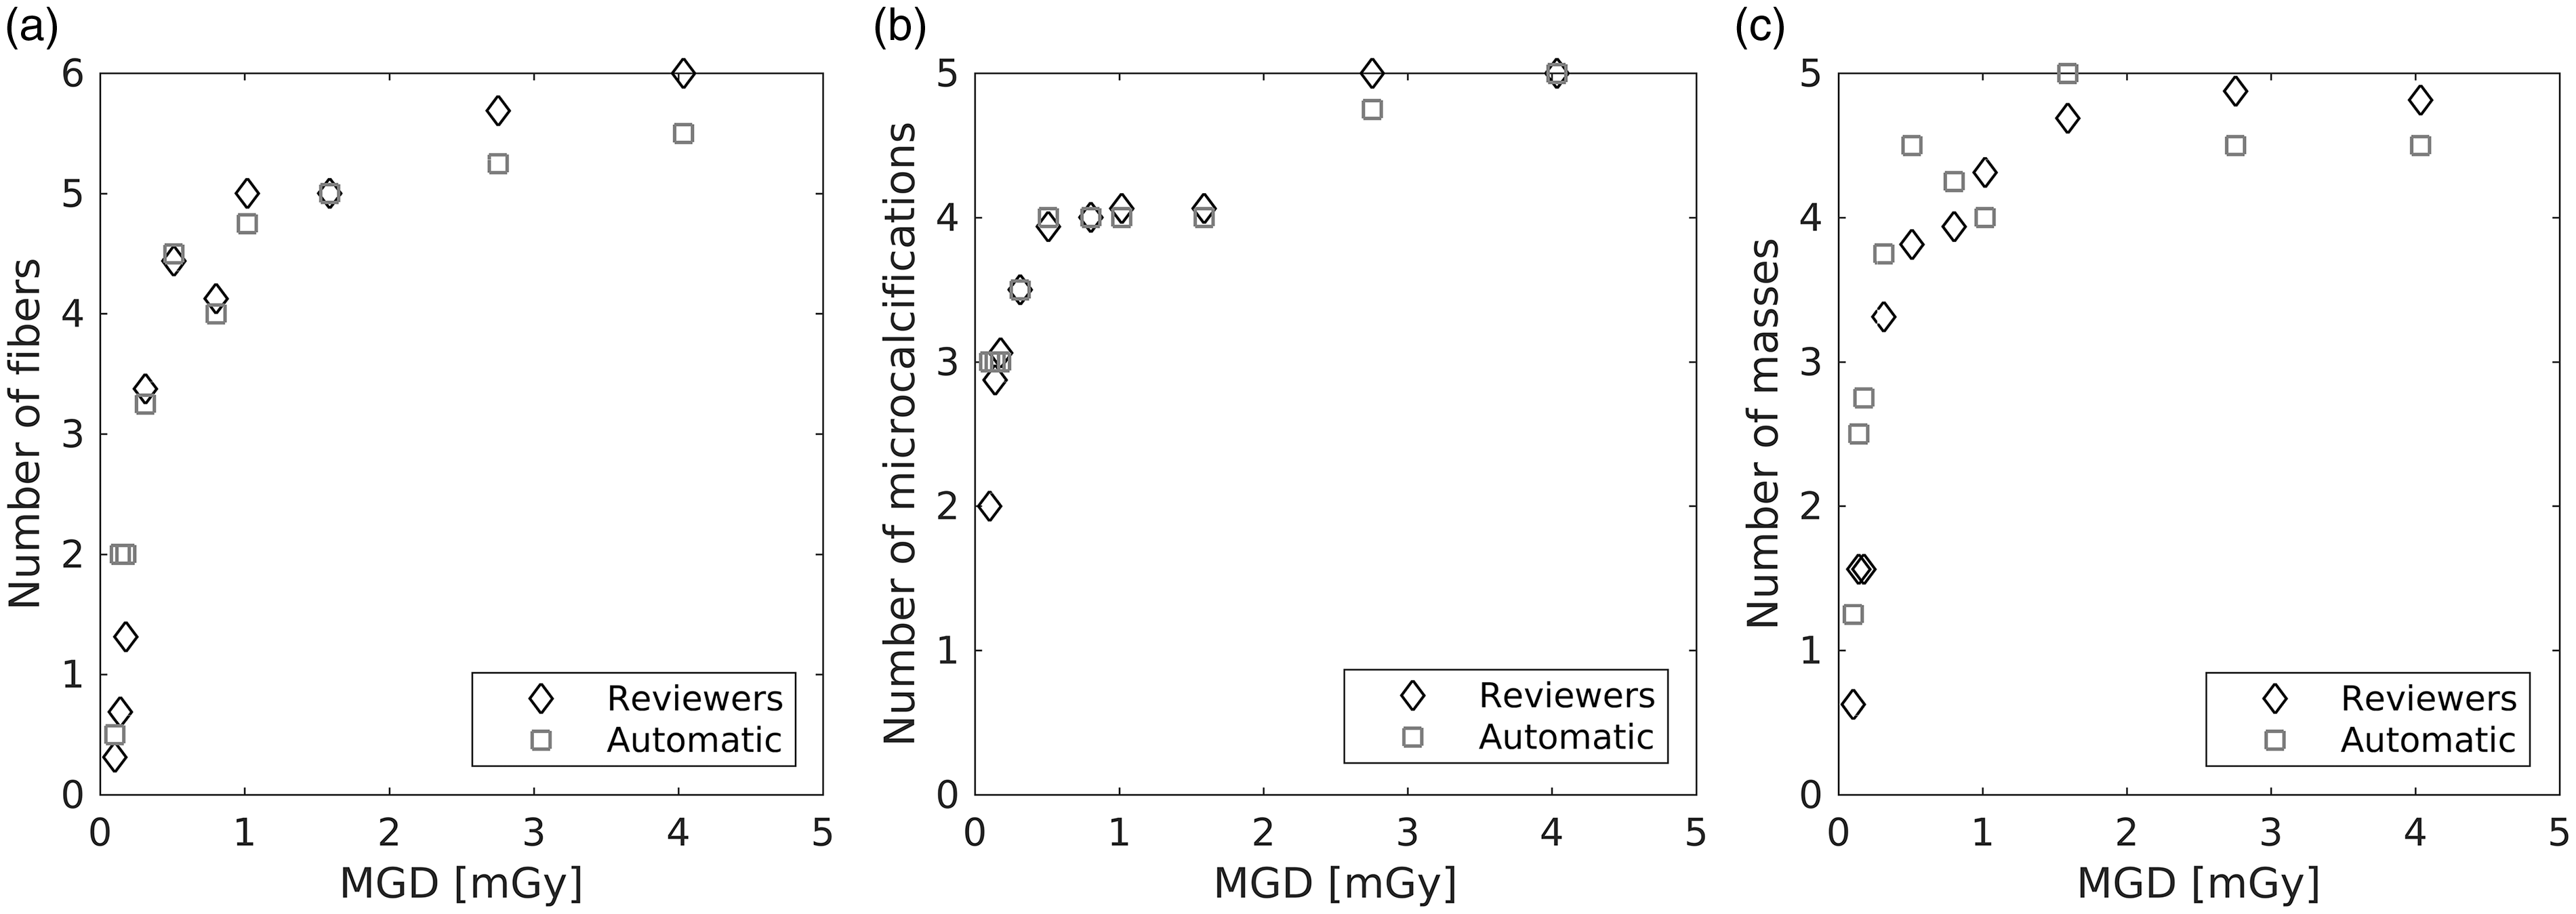
Long-term image quality trends
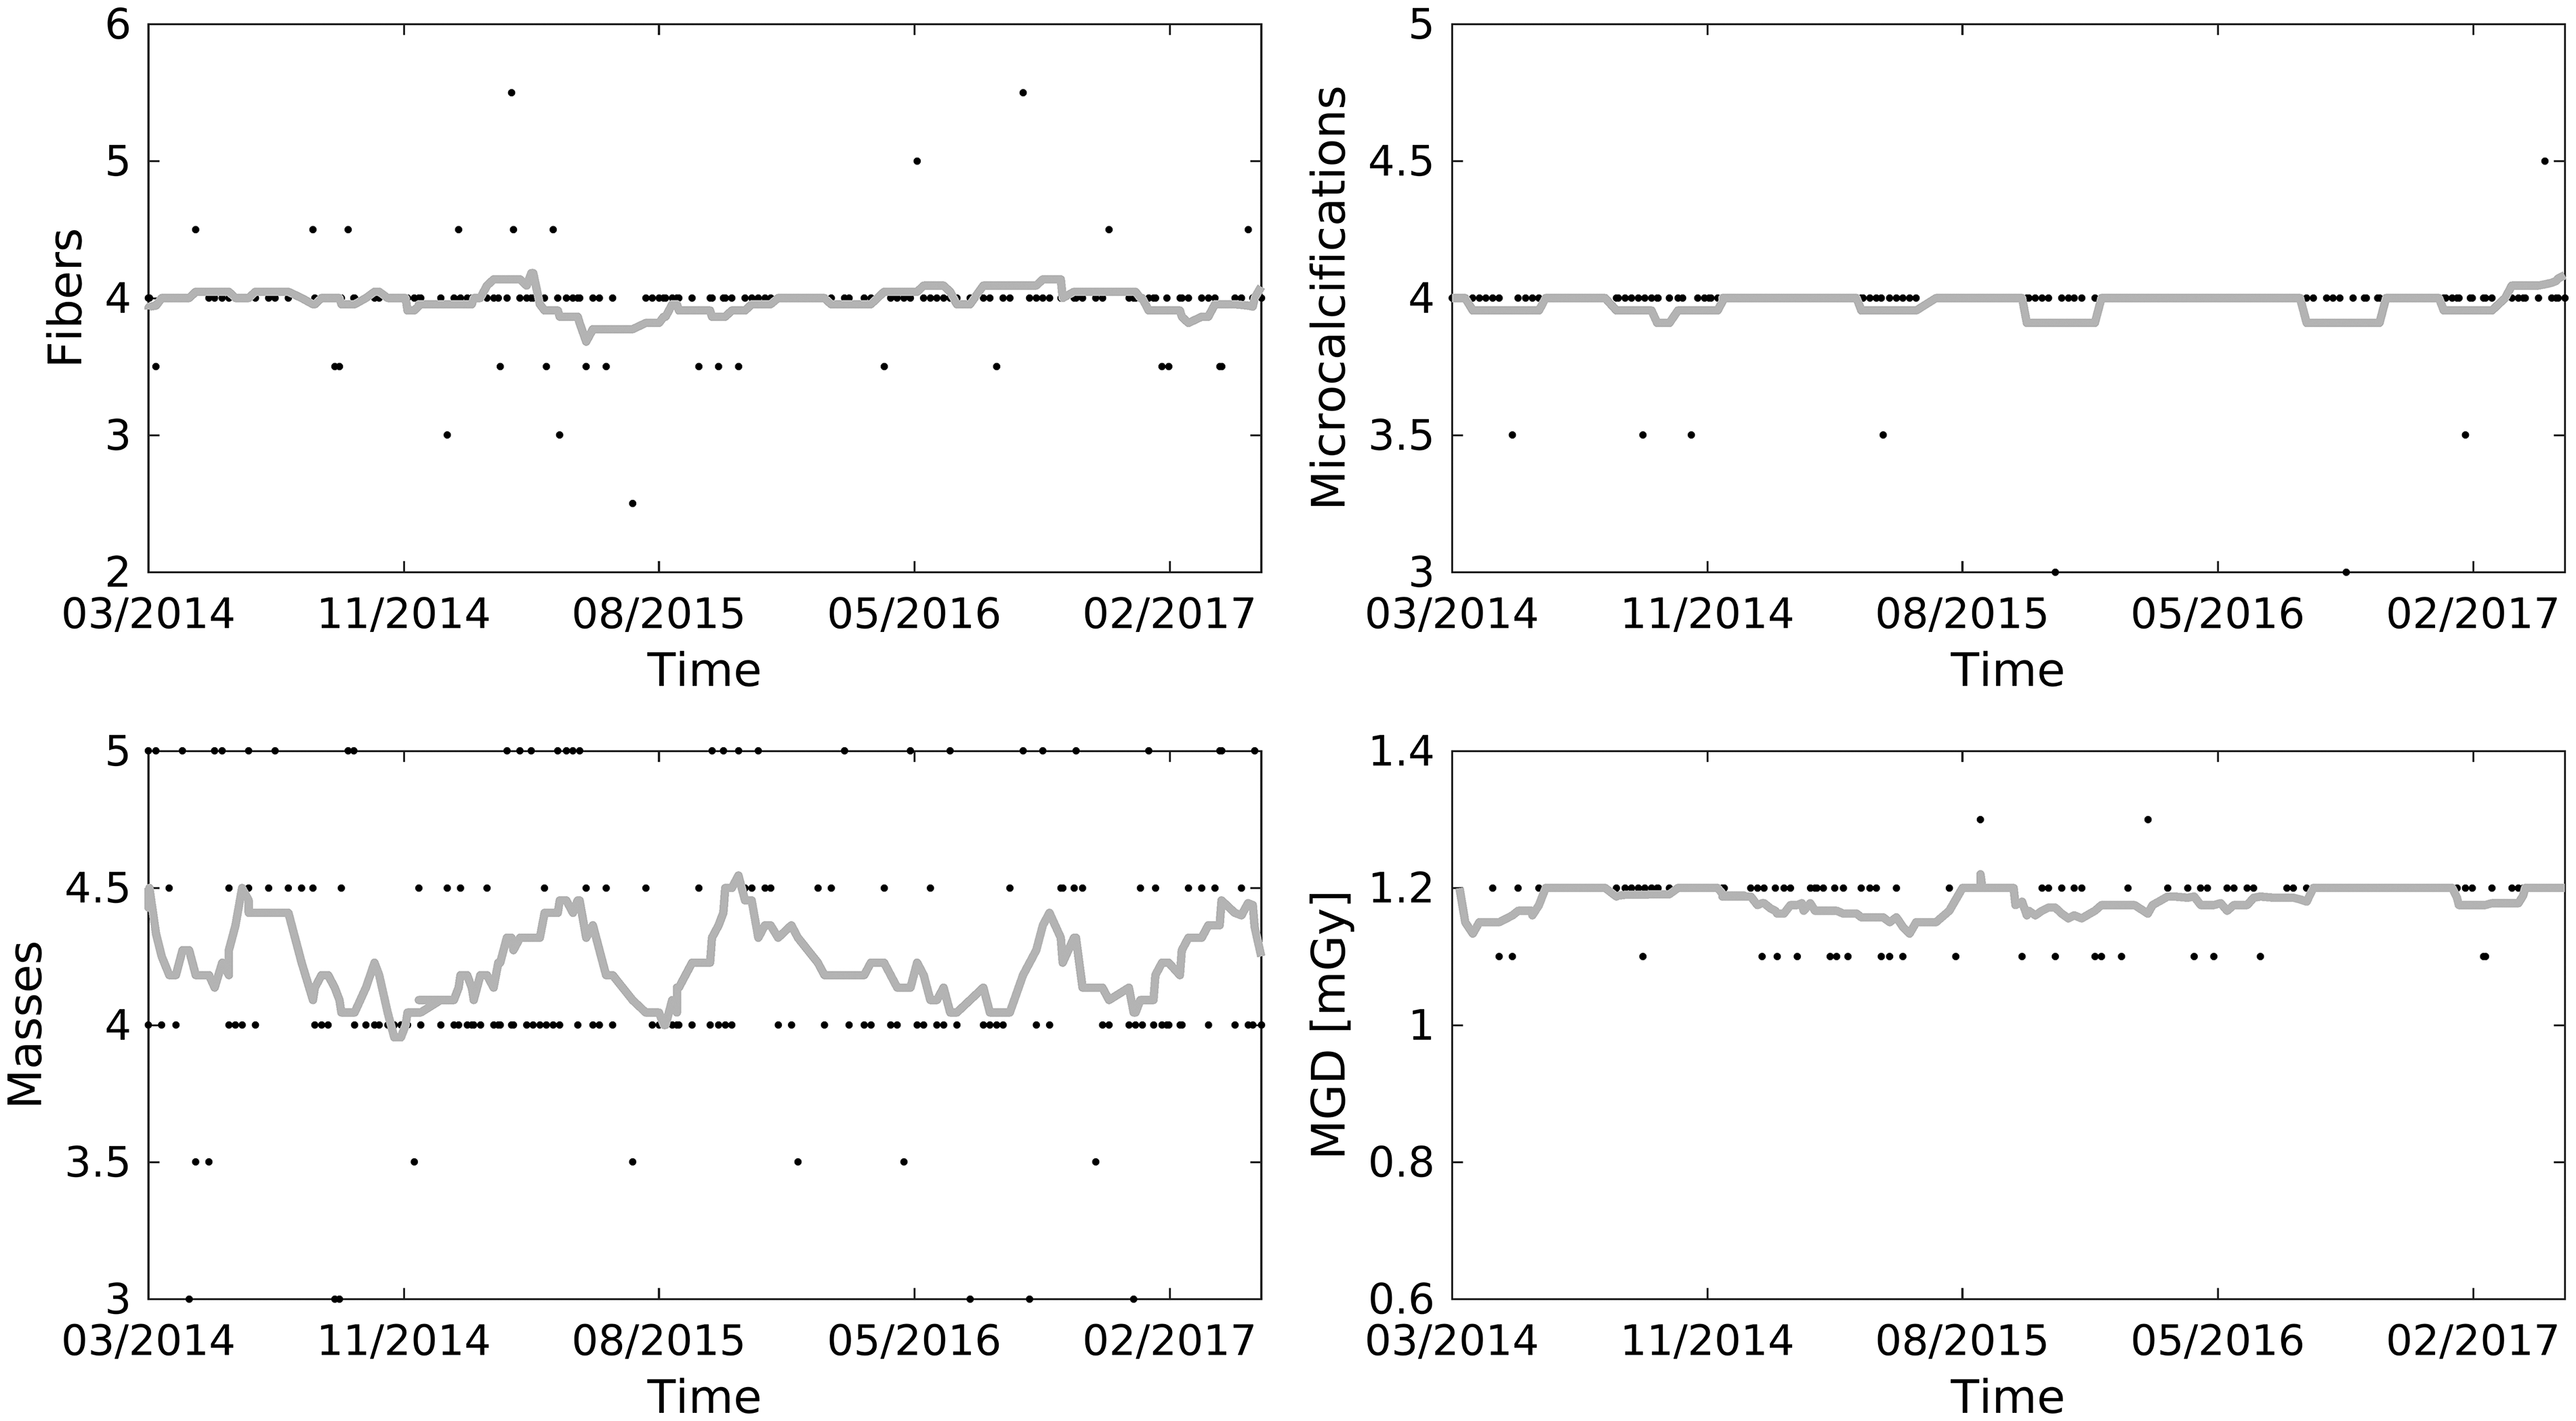
Figures 5 and 6 show the trend curves of the detected fibers, microcalcifications, masses, and mean glandular doses for the Siemens and Planmed systems. Two changes were made to the Siemens imaging protocol during the time period. First, the reconstruction in phantom acquisitions was changed from “raw” to “processed” to match the setting used for clinical images (February 2015). Second, the radiation dose was increased by 17% (in two steps, first from 0.76 mGy to 0.82 mGy, and then to 0.89 mGy) to optimize microcalcification delineation in the clinical images (August 2015 to November 2015). No changes can be seen for fiber or microcalcification detection. The mean ± SD scores for masses were initially 4.7 ± 0.4, then 4.2 ± 0.5 for “processed” images, and 4.2 ± 0.5 after the dose increase. The change from “raw” to “processed” creates a darker area near the wax area edges that we cannot detect in unprocessed images (Fig. 7). The reason for decreased mass detection is that the darker area near the masses disturbs their detection. After the change in dose level no clear difference in target detectability was seen. In the Planmed system, no changes were made or trends observed. The mean glandular dose was 1.18 ± 0.04 mGy, the fiber score was 4.0 ± 0.3, the microcalcification score was 4.0 ± 0.1, and the mass score was 4.2 ± 0.5.
Time series over a three-year period for the detected fibers, microcalcifications, and masses, and mean glandular dose (MGD) for Siemens Mammomat Inspiration. Black dots represent results and gray lines represent an 11-point centered moving average. Time series over a three-year period for the detected fibers, microcalcifications, and masses, and mean glandular dose (MGD) for Planmed Nuance Classic. Black dots represent results and gray lines represent an 11-point centered moving average. “Raw” and “processed” images for Siemens Mammomat Inspiration.

Discussion
The high image quality requirements of mammography systems necessitate systematic quality assurance procedures. Technical tests include, among others, image quality evaluations using standardized test objects. These have traditionally been conducted through visual evaluation, which is subjective and time-consuming. Digital mammography allows automating phantom image analysis. This allows better standardization between vendors, users, and sites. The aim of the study was to develop and validate an analysis software for daily mammography quality control in a multi-unit imaging center. The long-term image quality trends of two mammography systems were also studied.
In an imaging center with a large variety of mammography systems, technical and clinical image quality should fulfill the same standards. Therefore, uniform and consistent technical quality assurance is essential. An automated image quality analysis aids in making comparisons between the systems. Trend curves may also help in the early detection of possible drifts in system performance. Moreover, automated image quality analysis provides several benefits (e.g. objectivity and efficiency) compared to visual analysis made by the users. It also allows more specific tests (e.g. measuring modulation transfer function and noise power spectra) (13). Additional information, such as imaging parameters and doses, can be obtained from the DICOM file headers.
The automated image quality analysis software developed in this study resulted in detection levels comparable to visual analysis performed by four reviewers. The agreement was good in the case of fibers. However, the software detected somewhat more microcalcifications and characteristic masses than the visual observers did. The higher detection rate, especially in the fourth microcalcification group, originates from the difficulty of distinguishing image noise from calcifications. All images with larger discrepancies in microcalcification detection rate were taken with CR systems. The image noise properties were noticeably different (i.e. grainier) in the CR systems compared to the FFDM systems, most likely contributing to the discrepancy. In the case of characteristic masses, the higher detection rate by the software may be explained partly by the poor inter-rater agreement. The poor agreement underlines the importance of objective automated analysis. The general problem with visual analysis is its subjective nature. Observers may interpret image quality in remarkably different ways, whereas an automated software is consistent with its decision making. The exact correspondence to human observers is less important in longitudinal quality control (e.g. detecting changes in the system) than keeping the scoring criteria constant.
Sensitivity to changes in target visibility is vital to a QA analysis. The developed software resulted in similar changes in detection rates to the human observers when varying the radiation exposure. Both visual and automated scores followed the dose as expected: detection levels were significantly lower in the low-dose images than with the clinically used or higher radiation dose levels.
In the automated analysis implementation, fiber and mass scores showed greater variations than microcalcification scores. There are multiple contributing factors to these variations, most prominently phantom orientation and positioning, and image noise. Running averages can be used to visualize changes in the detectability distributions. As can be seen in Fig. 5, changes in imaging parameters may affect the detectability of fibers, microcalcifications, and masses differently. On the other hand, a clear increase in dose yielded no clear difference in the detection of targets. This is primarily due to relatively large difference between target sizes in the ACR phantom. A previous study by Huda et al. (14) found that the conventional ACR phantom design may be unsatisfactory for evaluating image quality in digital mammography. A new ACR digital mammography phantom with smaller differences in target sizes has been designed (15). Alternatively, new analysis methods for the old phantom could be developed to increase sensitivity to small changes in the image quality.
The DWT and multiresolution analysis were used to enhance the visibility of test objects. In multiresolution analysis, an image is divided into different resolution levels for further processing. The strength of the method is that different sized image characteristics appear differently at various resolution levels, meaning that features which are hard to detect in one resolution level may be detected better at another level. For example, at a high resolution, the image noise may disturb the delineation of larger features in the image. However, when examining the image at a suitable lower resolution level, these larger-sized objects may be detected better. The DWT approach is similar to that of Alvarez et al. (6). There were differences in base functions (they used Daubechies 10 base functions), binarization, object segmentation process, and scoring criteria. They reported smaller absolute differences between human readers and automatic analysis than what was seen in this study. However, they had a different scoring range, hindering the comparability of the results.
This study has certain limitations. Only four human readers were used with notable inter-rater differences. This highlights the subjective nature of the task and a greater number of observers could mitigate the effect of individual preferences. The effect of varying dose levels was studied only on a single FFDM system. No comparisons were made against other automated analysis algorithms. Also, the developed software works only for ACR phantoms images and, as such, is not readily suitable for other phantoms.
In conclusion, the developed automated image quality analysis software provides a robust, systematic, and efficient method for monitoring the function and performance of digital mammography systems. This is especially beneficial in a multi-unit center with devices from many vendors and different generations. With long-term trend graphs of the technical image quality and dose, users are able to detect possible drifts in the system.
Footnotes
Declaration of Conflicting Interests
The author(s) declared no potential conflicts of interest with respect to the research, authorship, and/or publication of this article.
Funding
The author(s) disclosed receipt of the following financial support for the research, authorship, and/or publication of this article: This study was supported by Helsinki University Hospital research and development funding.