



Abstract
Background
Dynamic contrast-enhanced magnetic resonance imaging (DCE-MRI) is widely used for the diagnosis and prognostic assessment of head and neck squamous cell carcinoma (HNSCC). However, no research on grading HNSCC using DCE-MRI has been found. We hypothesize that DCE-MRI can grade the HNSCC non-invasively.
Purpose
To verify the hypothesis that DCE-MRI can grade the HNSCC non-invasively.
Material and Methods
Forty-two patients with histopathologically proved HNSCC from September 2013 to February 2016 were retrospectively analyzed. Chi-square test was used to compare patterns of time intensity curves (TICs) between well and poorly differentiated HNSCC. Two-sample t-test was performed to calculate the difference of volume transfer constant (Ktrans), extravascular extracellular volume fraction (Ve), and initial area under the curve (iAUC) between groups. The diagnostic ability and cut-off value were assessed by receiver operator characteristic analysis.
Results
Most TICs of HNSCC are type III; no difference between well and poorly differentiated HNSCC has been found (P > 0.05). The value of Ktrans, Ve, and iAUC for well and poorly differentiated HNSCC are (0.218 ± 0.048; 0.383 ± 0.074) min−1, (0.605 ± 0.108; 0.712 ± 0.150), and (27.552 ± 6.238; 43.157 ± 9.148), respectively. Ktrans, Ve, and iAUC are higher in poorly differentiated HNSCC, compared with well differentiated HNSCC (P < 0.001, 0.013, and < 0.001, respectively). Ktrans has the greatest diagnostic significance with Youden’s index being 0.859 by cut-off value 0.270 min−1. The diagnostic sensitivity and specificity were 95.0% and 90.9%, respectively.
Conclusion
The Ktrans, Ve, and iAUC of HNSCC can be reliable quantitative parameters for evaluating well and poorly differentiated HNSCC where Ktrans has the highest value.
Keywords
Introduction
Squamous cell carcinoma (SCC) is the most common primary malignant tumor in the head and neck, accounting for >3.2% of all malignancies (1). Of patients diagnosed with head and neck squamous cell carcinoma (HNSCC), ≤50% can survive for >5 years (2–4). Though histologic grade is not included in the current staging criteria, histologic grade has a correlation with survival rate. An early study of 2007 cases of HNSCC by Roland et al. (5) advocated that poorly differentiated HNSCC correlated with a higher rate of nodal and distant metastasis and the recurrence rates increased 1.6–18% in poorly differentiated tumors compared to well differentiated HNSCC. The study claimed that the overall survival rate could decrease 6% in patients with poorly differentiated tumors. Piffko et al. (6) further demonstrated that histopathological malignancy was the most powerful prognostic indicator for cancer-specific mortality in patients with oral SCCs. Brandwein et al. (7) suggested that histologic risk assessment is a better prognosticator than margin status for predicting both local recurrence and overall survival of oral SCC. A more recent study by Thomas et al. (8) found that high histologic grade in early stage oral cavity cancer was associated with poorer survival and carried independent prognostic value in addition to tumor size, node status, and presence of distant metastasis (TNM) stage. Currently ultra-sonographic-guided fine-needle aspiration is often used for determining tumor differentiation. However, it is invasive, operator-dependent, and the results might be affected by the location of lesion and needle localization. Magnetic resonance imaging (MRI) provides more comprehensive information on the tumor including staging, margin, and lymph nodes status at the same time. Dynamic contrast-enhanced MRI (DCE-MRI) can provide hemodynamic information non-invasively (9–11). It turns out that wash-in and wash-out patterns and quantitative parameters of DCE-MRI, such as volume transfer constant (Ktrans), extravascular extracellular volume fraction (Ve), and initial area under the curve (iAUC), are useful in the analysis of the microcirculation of tissues (10,12–14). DCE-MRI is widely used for the diagnosis and prognostic assessment of head and neck cancers (15–17), as well as for the evaluation of differentiation of glioma (18,19) and evaluation of microcirculation of extraocular muscle (13). However, to the best of our knowledge, few studies or not enough data in the literature about the grading of HNSCC by DCE-MRI parameters have been carried out.
We hypothesize that DCE-MRI can grade the HNSCC non-invasively. The purpose of our study is to compare: (i) the patterns of time intensity curves (TICs) between the poorly and well differentiated HNSCC; and (ii) the difference of quantitative parameters of DCE-MRI between the poorly and well differentiated HNSCC.
Material and Methods
Patients
This retrospective study was approved by the ethics committee of the hospital. The database was searched for all patients with microscopically proved HNSCC and all of the cases had available DCE-MRI in the hospital between September 2013 and February 2016. Grades I and II of the traditional grading system (20) were grouped as well-differentiated tumors, and Grades III and IV were grouped as poorly differentiated, based on a previous study by Piffko et al. (6). The patients were divided into two groups with well and poorly differentiated HNSCC according to the classification from the literature. Patients were excluded if: (i) the patient underwent therapy, operation, or biopsy before MRI; (ii) the time interval between MRI and histopathological examination was > 1 week; or (iii) image quality was heavily affected by motion artifact. Forty-two eligible cases were included in this study (30 men, 12 women). Basic information about the cases was listed in Suppl. Table 1.
MRI protocols.

MRI
MRI was performed on a 3.0-T unit (Trio Tim, Siemens AG, Erlangen, Germany) with an eight-channel head coil and eight-channel neck coil. Conventional sequences without enhancement were acquired before contrast-medium injection. Coronal T1 maps were acquired with volumetric interpolated breath-hold (VIBE) sequence. Coronal DCE images were acquired by time-resolved angiography with interleaved stochastic trajectories (TWIST) sequence. Fifty consecutive scans were acquired with one scan taking about 6.4 s. The total scan time was about 5 min 23 s. Magnevist (Bayer, Berlin, Germany) was injected with a dose of 0.1 mmol/kg of the patient’s weight at the beginning of the fourth scan. The injection rate was 2 mL/s, followed by 20-mL saline flushing. Image acquisition protocols were summarized in Table 1.
DCE-MRI process
All DCE-MR images of HNSCC were evaluated by a qualified radiologist with five years of experience. The DCE data were analyzed using Tissue 4D of Syngo, provided by Siemens Company. Regions of interest (ROI) were manually hand-drawn on the DCE images under the guidance of non-enhanced images. The whole volume of the tumors was included by placing freehand ROIs slice by slice, with an exclusion of areas of necrosis, hemorrhage, and vessels (Fig. 1). VOI analysis on Tissue 4D was selected to extracted whole tumors TIC and quantitative parameters.
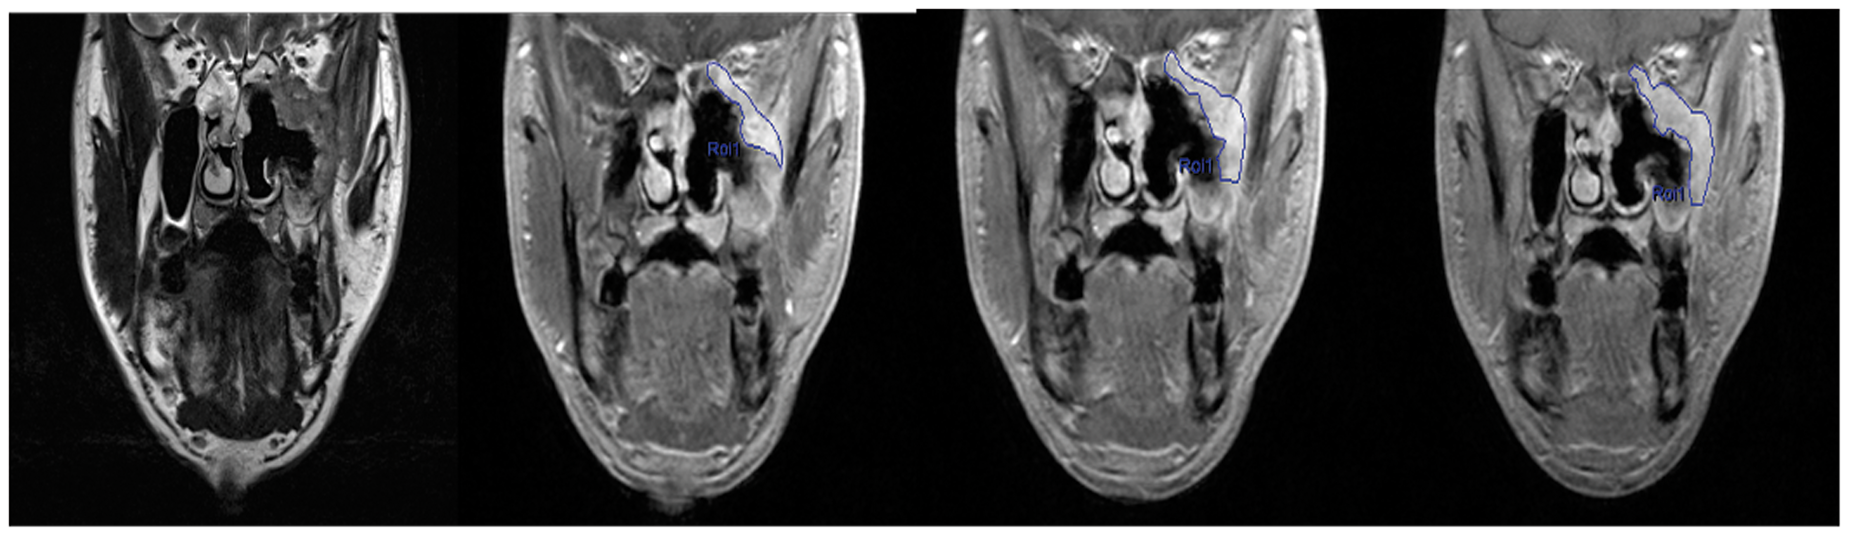
Under the guidance of the coronal T2-weighted images, the whole volume of the tumor was included during the analysis by drawing slice by slice, with an exclusion of areas of necrosis and vessels.
Motion correction was performed before further analysis. The TICs of HNSCC exhibited three types: type I (Fig. 2a), TICs with gradual washing-in and without washing-out; type II (Fig. 2b), TICs with rapid and continuous washing-in and with little washing-out; type III (Fig. 2c), TICs with rapid early washing-in and obvious washing-out.
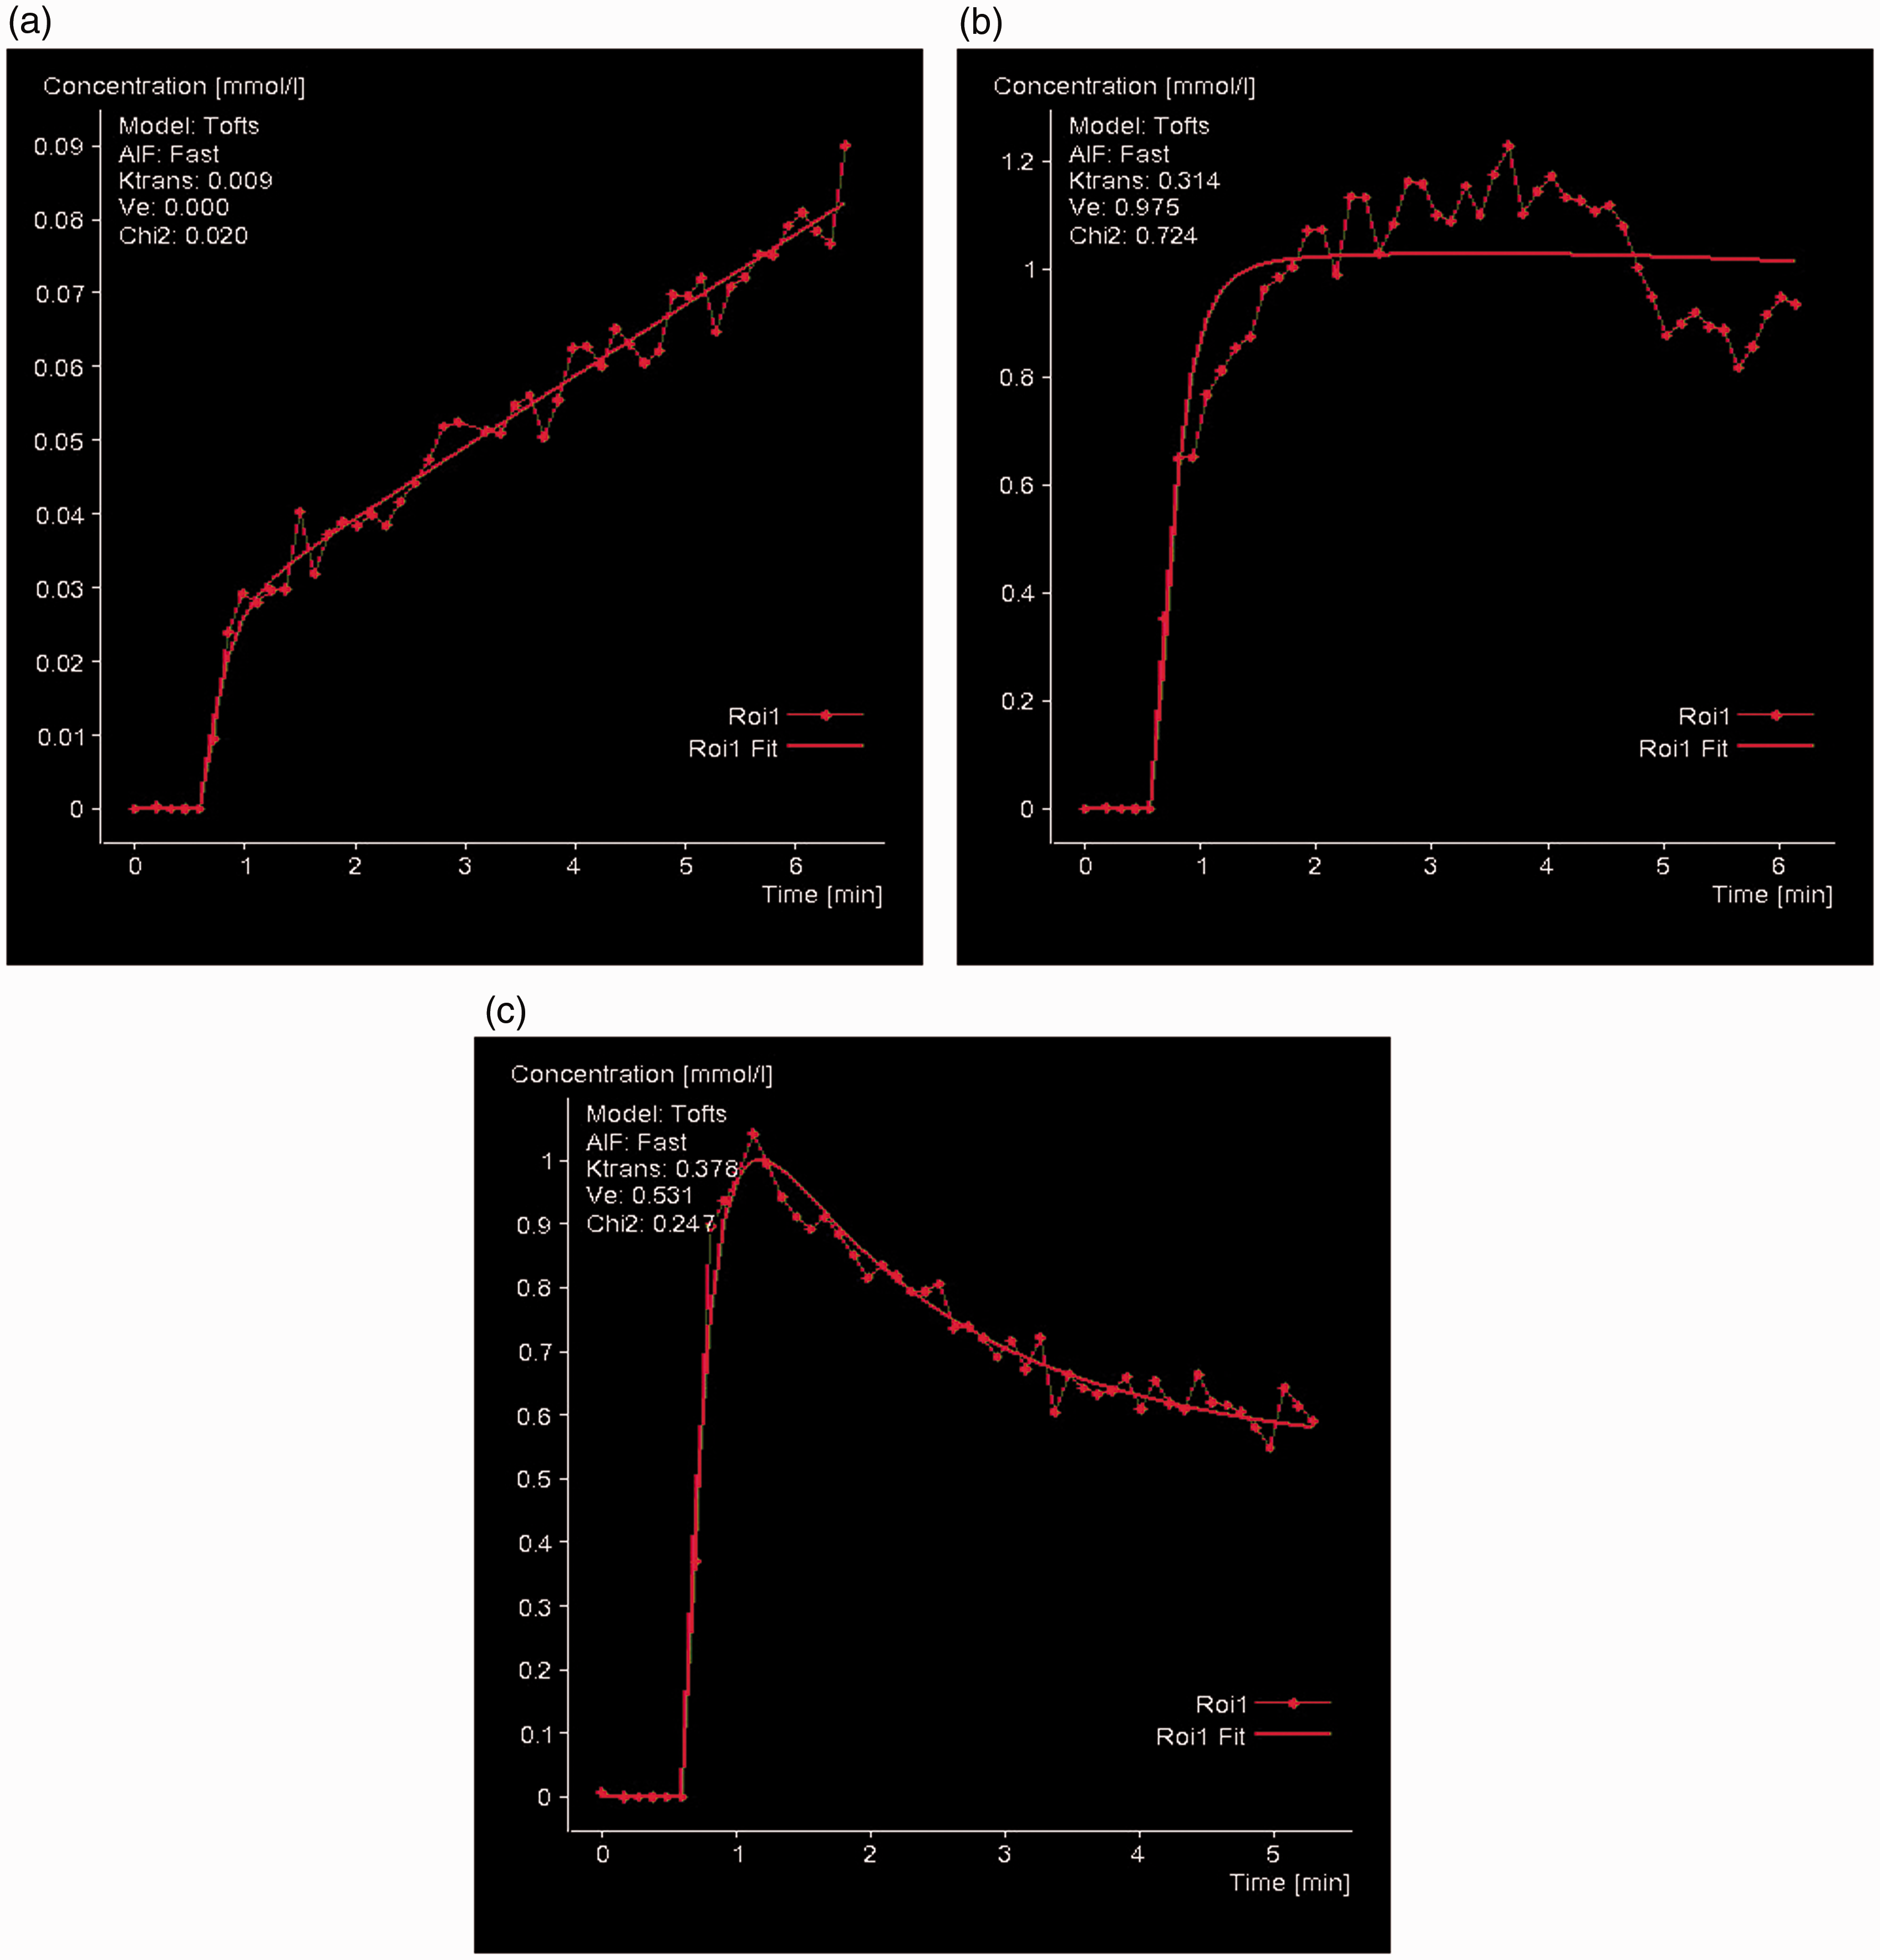
Types of TICs: (a) type I; (b) type II; and (c) type III.
The values of Ktrans, Ve, and iAUC of the selected ROI were calculated using Tofts Model, based on population-averaged AIF (21).
Statistical analysis
All analysis was performed using the SPSS 17.0 software, with P < 0.05 being regarded as significant. All measurement parameters were expressed as mean ± standard deviation (SD). Kolomgorov–Smirnov test was used to check the normality of Ktrans, Ve, and iAUC. Chi-square test was used to compare patterns of TICs between well and poorly differentiated HNSCC. Two-sample t-test was performed to calculate the difference of Ktrans, Ve, and iAUC between two groups. Receiver operator characteristic (ROC) analysis was conducted to assess the diagnostic ability and the cut-off value with the highest Youden's index (Youden’s index = sensitivity + specificity – 1) was selected.
Results
Clinical data
A total of 42 patients were included in the study, while 22 patients (52.4%) had well differentiated HNSCC and 20 patients (47.6%) had poorly differentiated HNSCC. No significant differences of the age and gender distribution was noted between the groups with well and poorly differentiated HNSCC (P = 0.863 for age and P = 0.845 for gender).
Comparison of patterns of TICs
Over 66% of TICs of HNSCC were type III. Type I TIC was observed only in one patient with well differentiated HNSCC. No statistical difference was found between well and poorly differentiated HNSCC. The detailed information was shown in Table 2.
TICs of SCC.
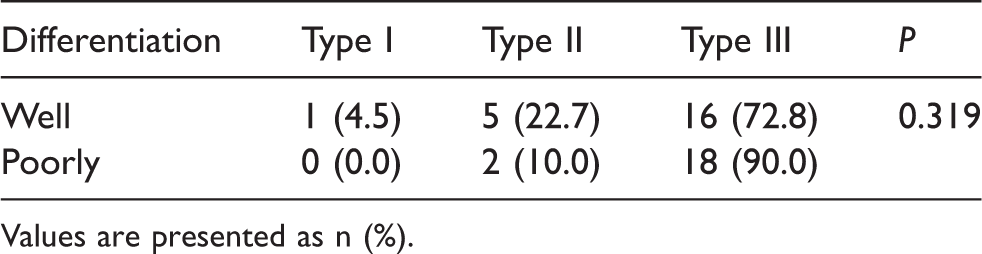
Values are presented as n (%).
Comparison of quantitative parameters
Ktrans was significantly higher in poorly differentiated tumors (0.383 ± 0.074 min−1) than in well differentiated tumors (0.218 ± 0.048 min−1) (T = –7.032, P < 0.001). Ve was significantly higher in poorly differentiated tumors (0.712 ± 0.150) than in well differentiated tumors (0.605 ± 0.108) (T = –2.938, P = 0.008). And iAUC was also significantly higher in poorly differentiated tumors (43.157 ± 9.148) than in well differentiated tumors (27.552 ± 6.238) (T = –17.015, P < 0.001). Detailed comparisons of value of Ktrans, Ve, and iAUC between groups were presented in Table 3.
Values of Ktrans, Ve, and iAUC of HNSCC, and ROC analysis results.
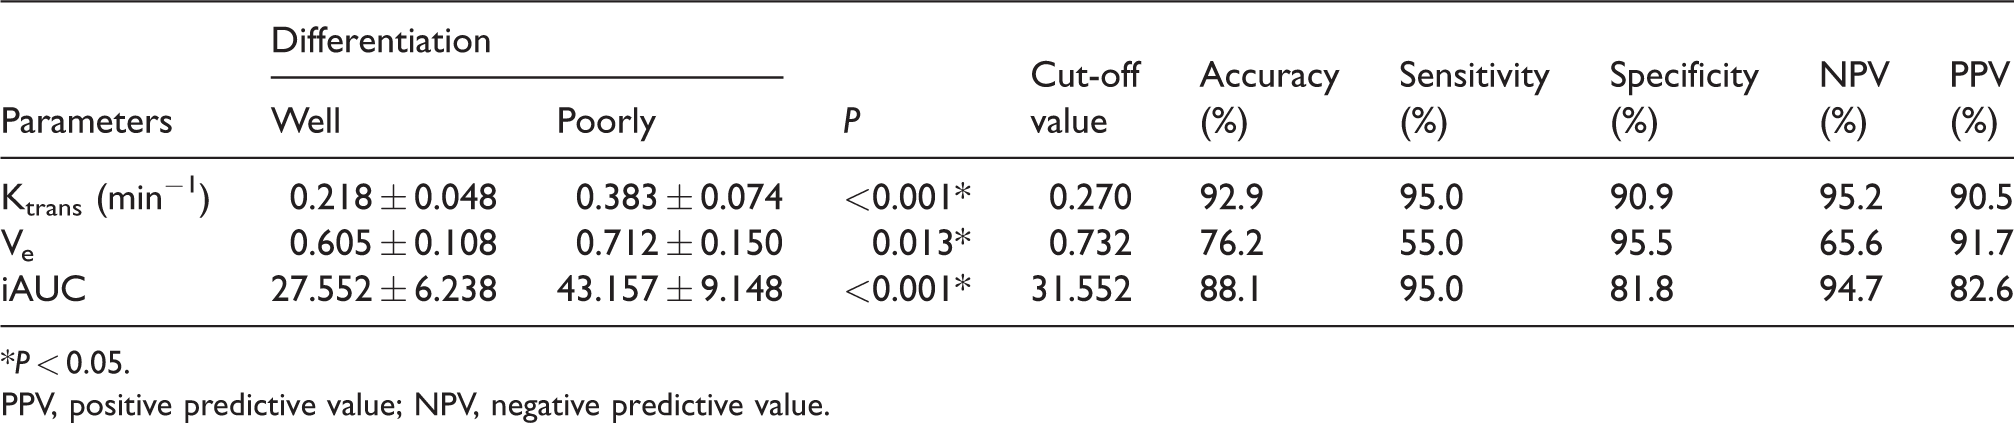
*P < 0.05.
PPV, positive predictive value; NPV, negative predictive value.
The cut-off values and diagnostic criteria of parameters were present in Table 3. Area under the ROC curve (AUC) of Ktrans, Ve, and iAUC were 0.964, 0.717, and 0.950, respectively (Fig. 3). Ktrans was proved to be the parameter with greatest diagnostic ability with Youden’s index 0.895 by cut-off value 0.270 min−1. The diagnostic accuracy, sensitivity, and specificity were 92.9%, 95.0%, and 90.9%, respectively.

Results of ROC analysis of quantitative parameters. AUCs of Ktrans, Ve, and iAUC were 0.964, 0.717, and 0.950, respectively.
Discussion
There are two important findings reported in this paper. First, most TICs of HNSCC are type III, especially for poorly differentiated HNSCC. Second, the values of Ktrans, Ve, and iAUC are higher in poorly differentiated HNSCC compared to those of well differentiated HNSCC. Ktrans is the most sensitive parameter to discriminate well and poorly differentiated HNSCC.
In this study, the majority of TICs of HNSCC are type III. The result agrees with previous studies that revealed malignant head and neck tumors had faster wash-in and wash-out times (22,23), indicating microvascular circulation of malignant tumors were highly permeable. The permeability increases in accordance with the decrease of differentiation of HNSCC. However, the comparison of the TIC type between groups of cases stratified by HNSCC grade showed no statistical difference. The reason might be related to the locations of primary tumors. Individual conditions such as blood pressure and heart rate might influence the occurrences of wash-in and wash-out (24). Another possibility is that the classification of TICs is too generalized to provide more detailed information on microcirculation. Further studies are expected to find the exact cause for the discrepancy.
In the present study, we find that values of Ktrans, Ve, and iAUC are statistically higher in poorly differentiated HNSCC compared to well differentiated HNSCC. To our knowledge, this is the only study on grading of HNSCC with DCE-MRI, whereas the DCE-MRI on grading of other solid tumors has been proven valuable by several researches (18,19,25). Choi et al. analyzed DCE-MRI of 33 patients diagnosed with pathologically confirmed gliomas (17). In their study, high-grade gliomas showed significant higher Ktrans than low-grade gliomas. Jia et al. (19) got consistent results through research on 65 patients with oligodendrogliomas. They proved that mean Ktrans was significantly lower for low-grade oligodendrogliomas than those for anaplastic oligodendrogliomas. Another study by Ma et al. (25) on breast cancer has also demonstrated that the Ktrans value is a biomarker for grading breast cancer. It has been confirmed that the Ktrans value from DCE-MRI could be used to estimate the permeability of pathological proliferated microvacuoles. Research by Lee et al. (26) has suggested that value of Ktrans is positively correlated to expression of vascular endothelial growth factor in head and neck cancers. Similar results in HNSCC have been proved by Surov et al. in a recent study (22). Significant correlations were observed between Ve and mean vessel diameter and cell count. In addition, an inverse correlation between Ktrans and Ki 67 was identified in primary HNSCC. Additionally, a study by Chawla et al. (27) proved that the Ktrans parameter reflects a combination of tumor blood flow and microvascular permeability. It has been suggested that higher tumor blood flow results in better oxygenation and drug delivery to the target site, while hypoxia and decreased blood flow enhance chemo-resistance and impedes delivery of therapeutic agents. This indicates that higher Ktrans values may predict prolonged survival, while lower Ktrans values indicate a heterogeneous blood supply and poor survival (17,27). The result therefore may provide more information on the treatment plans and prognosis and is worth further study. The iAUC integrates the area under the kinetic curve during the first 90 s and is related to the increased permeability and angiogenesis. Endothelial cells of poorly differentiated HNSCC are often more immature than those of well differentiated HNSCC, lacking in pericyte and smooth muscle coverage, resulting in the increase in the permeability of new vessel in poorly differentiated HNSCC. The increased values of Ktrans and iAUC of poorly differentiated HNSCC correspond to the histopathological changes. Ve, as a symbol of the extravascular volume fraction (11,28), is also analyzed to be significantly higher in poorly differentiated than that in well differentiated HNSCC. It is similar to the studies on glioma and breast cancer (18,19,25).
There are some limitations in this retrospective study that can be improved in further research. The sample size is relatively small; expending the sample size can improve the statistical significance of this work. Due to the small sample size, the location of HNSCC is not specified either. Therefore, a large cohort study is also expected to give diagnosis guidelines of the HNSCC according to the location. Additionally, the present study does not correlate the quantitative parameters obtained with the recurrence and survival rates of the patients. Although it proved to be robust on quantitative parameters based on whole tumor ROI analysis in head and neck cancer, this study lacks a second reader and statistical studying of inter-observer agreement for studied groups.
In conclusion, this study shows that the quantitative parameters are higher in poorly differentiated HNSCC. Ktrans is of high accuracy for differentiation between well and poorly differentiated HNSCC. TICs play an unclear roll on grading HNSCC.
Footnotes
Declaration of Conflicting Interests
The author(s) declared no potential conflicts of interest with respect to the research, authorship, and/or publication of this article.
Funding
The author(s) received no financial support for the research, authorship, and/or publication of this article.