
Abstract
Background
Computed tomography (CT) has the potential to acquire the data needed for migration studies of orthopedic joint implants of patients who have had tantalum beads implanted at the time of joint replacement surgery. This can be accomplished with the same precision as radiostereometric analysis (RSA). Switching to CT would increase availability without the need for the specific facilities required for RSA. However, higher effective dose is a concern.
Purpose
To investigate if migration measurements can be done with CT with an accuracy and effective dose comparable to that of conventional RSA.
Material and Methods
Fourteen scanning protocols were tested in a hip phantom that incorporated tantalum beads and an uncemented femoral stem. The protocols were graded for clinical practice according to the three parameters of image quality, effective dose, and robustness of numerical data. After grading, the two protocols that graded best overall were applied to a pilot patient.
Results
All protocols produced scans in which the numerical data were sufficient for a migration analysis at least as precise as would be expected using RSA. A protocol with an effective dose of 0.70 mSv was shown to be applicable in a pilot patient.
Conclusion
Low-dose CT scans with an effective dose comparable to a set of routine plain radiographs can be used for precise migration measurements.
Keywords
Introduction
Radiostereometric analysis (RSA) is the gold standard for measurement of prosthetic migration relative to bone (1,2). However, the method requires dual radiation sources, special calibration cages, and specially trained staff. At least in our hospitals (that have done RSA), when the radiographic departments are modernizing their architecture to facilitate current digital techniques, it is logistically and economically challenging to maintain labs with dual radiation sources for simultaneous image acquisition. This might lead to discontinuation of ongoing clinical trials utilizing RSA. These trials are very important, especially for the acceptance of new, improved prosthetic devices which would benefit patients.
There are indications that computed tomography (CT) could be an alternative to RSA without significant loss of accuracy or precision (3–6). Migration models using CT have been presented and report the same accuracy as would be expected using RSA (7). However, a concern when using CT is the higher effective dose (ED). Several studies have indicated the possibility of significantly lowering the ED without significant loss of precision (8,9). Our group has previously reported on a migration model using CT for patients who have had tantalum markers implanted at the time of prosthetic joint replacement. This study included seven patients with scans acquired at an ED estimated to be comparable with standard pelvic CT (10).
The aim of this study was to find a protocol resulting in CT scans with a quality matching that of RSA for precise migration measurements in clinical studies of patients with tantalum markers. Ideally, this protocol would also minimize ED to reach the current ED of RSA which is generally evaluated at ≤ 1 mSv (depending upon the technique and equipment used) (2).
Material and Methods
A non-anthropomorphic phantom with a femoral hip prosthesis component was examined in a 128-detector row CT scanner (Somatom Definition Flash, Siemens, Forchheim, Germany). Fourteen scanning protocols were tested in order to determine the optimal settings for the highest possible image quality with an estimated ED < 1 mSv.
Phantom
The hip phantom (Fig. 1), consisting of a femoral component of a hip prosthesis (CoCr PROTASUL-20, Zimmer Inc., Warsaw, IN, USA), was mounted between two parallel wooden boards with fixed tantalum beads embedded in the wooden boards at different locations. The marking pattern, simulating a normal marking pattern of the femoral bone for RSA, comprised nine tantalum beads 1 mm in diameter. The phantom was mounted on a Plexiglass plate where the femoral component could be moved in relation to the wooden boards to simulate the three-dimensional (3D) displacement of the stem along the x-axis, using a 2-mm Plexiglass inserts. A 20-mL syringe filled with physiologic saline solution was placed in the middle of the phantom, close to the femoral component, as a measurement for image noise.
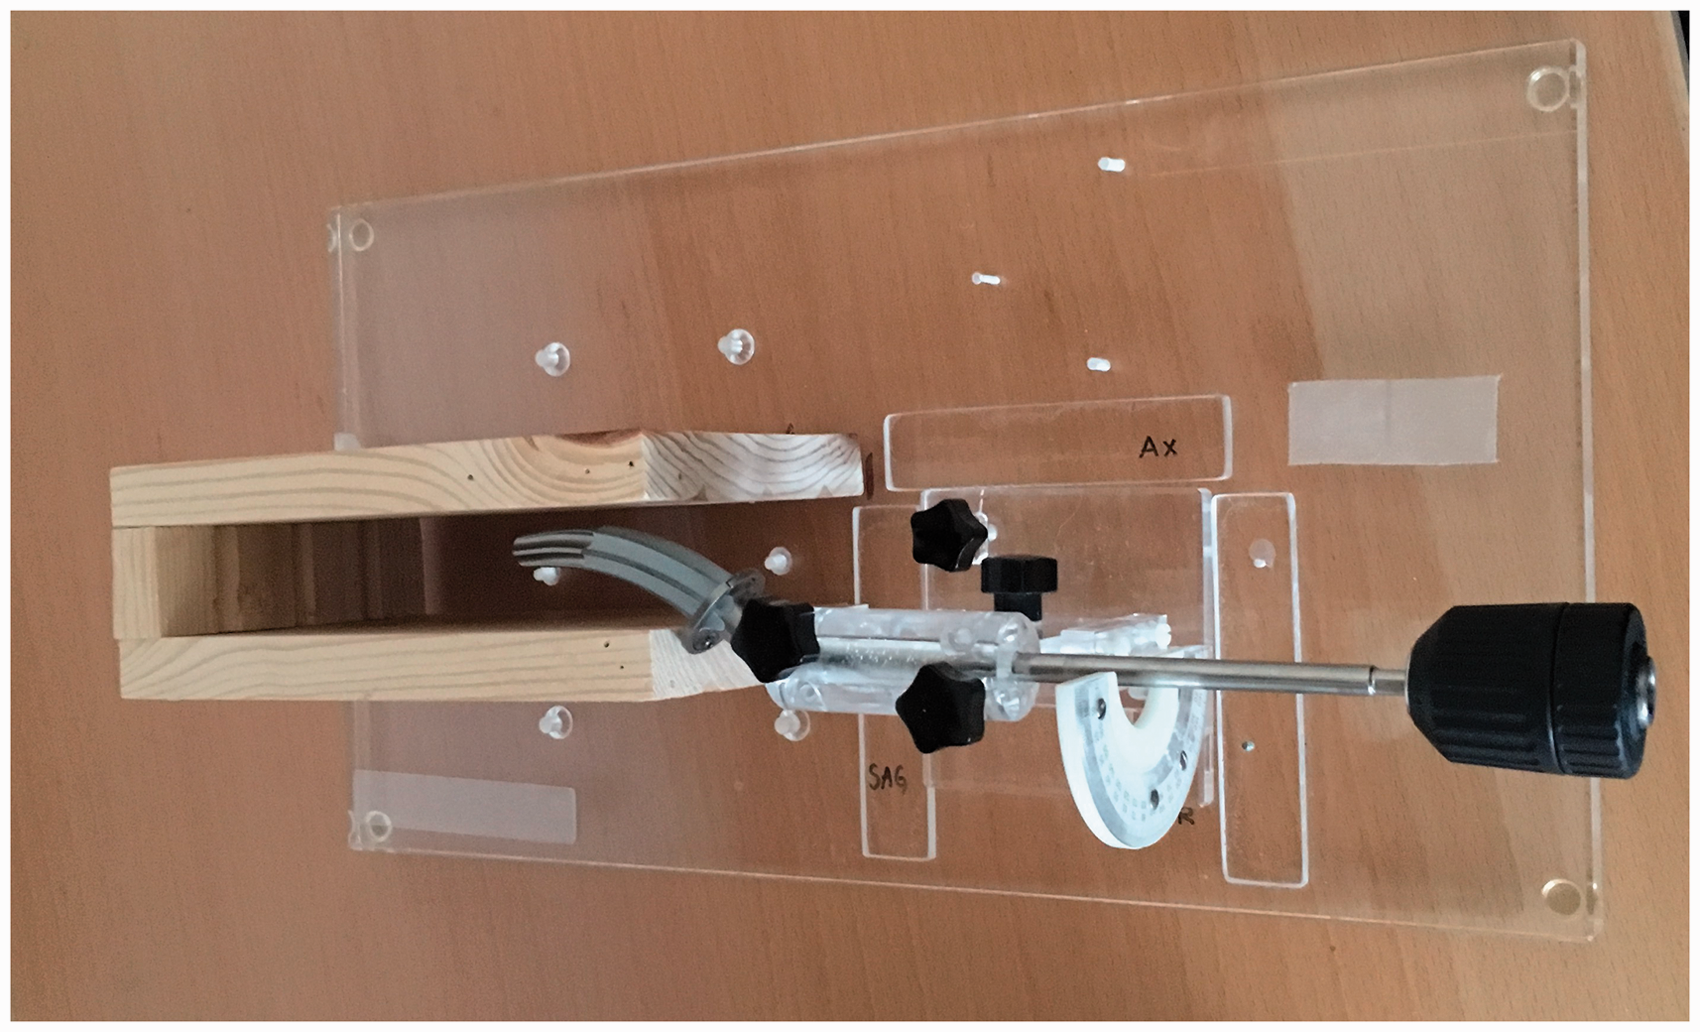
The hip phantom, with a femoral component of a hip prosthesis.
CT protocols
The phantom was placed on the CT table and scanned using 14 different protocols with 0 mm x-axis (lateral) offset of the femoral component. The phantom was then scanned again using the same 14 different protocols but with a fixed 2-mm x-axis offset. After changing the position of the phantom on the CT table, the process was repeated. This resulted in the phantom being scanned four times with each of the 14 different scanning protocols for a total of 56 scans. The scan parameters were based on existing standard and low-dose protocols in the Department of Radiology, Uppsala University Hospital and other hospitals, as well as from a previous low dose CT phantom study (11). We also applied protocols with the lowest possible tube current for each different tube potential, pitch, and rotation time (Table 1). No tube current modulation was used. One of the sets of scans utilized a dual-energy protocol from which two sets of images were reconstructed, the first being based on a fixed mixed ratio between the two different tube voltages, and the second using a virtual monoenergetic level of 140 keV. This resulted in a total of 15 sets of images for each of the four scanning sessions, although only 14 different scanning protocols were used. Imaging was done with a scan length of 25 cm, encompassing the entire femoral component, with a collimation width of 0.6 mm for all protocols. Axial reconstructions with 0.6-mm thickness and 0.6-mm increment and soft convolution filter (B30). The 15 different image sets were evaluated and the two protocols most suited for clinical use were tested in a pilot patient.
CT protocols.
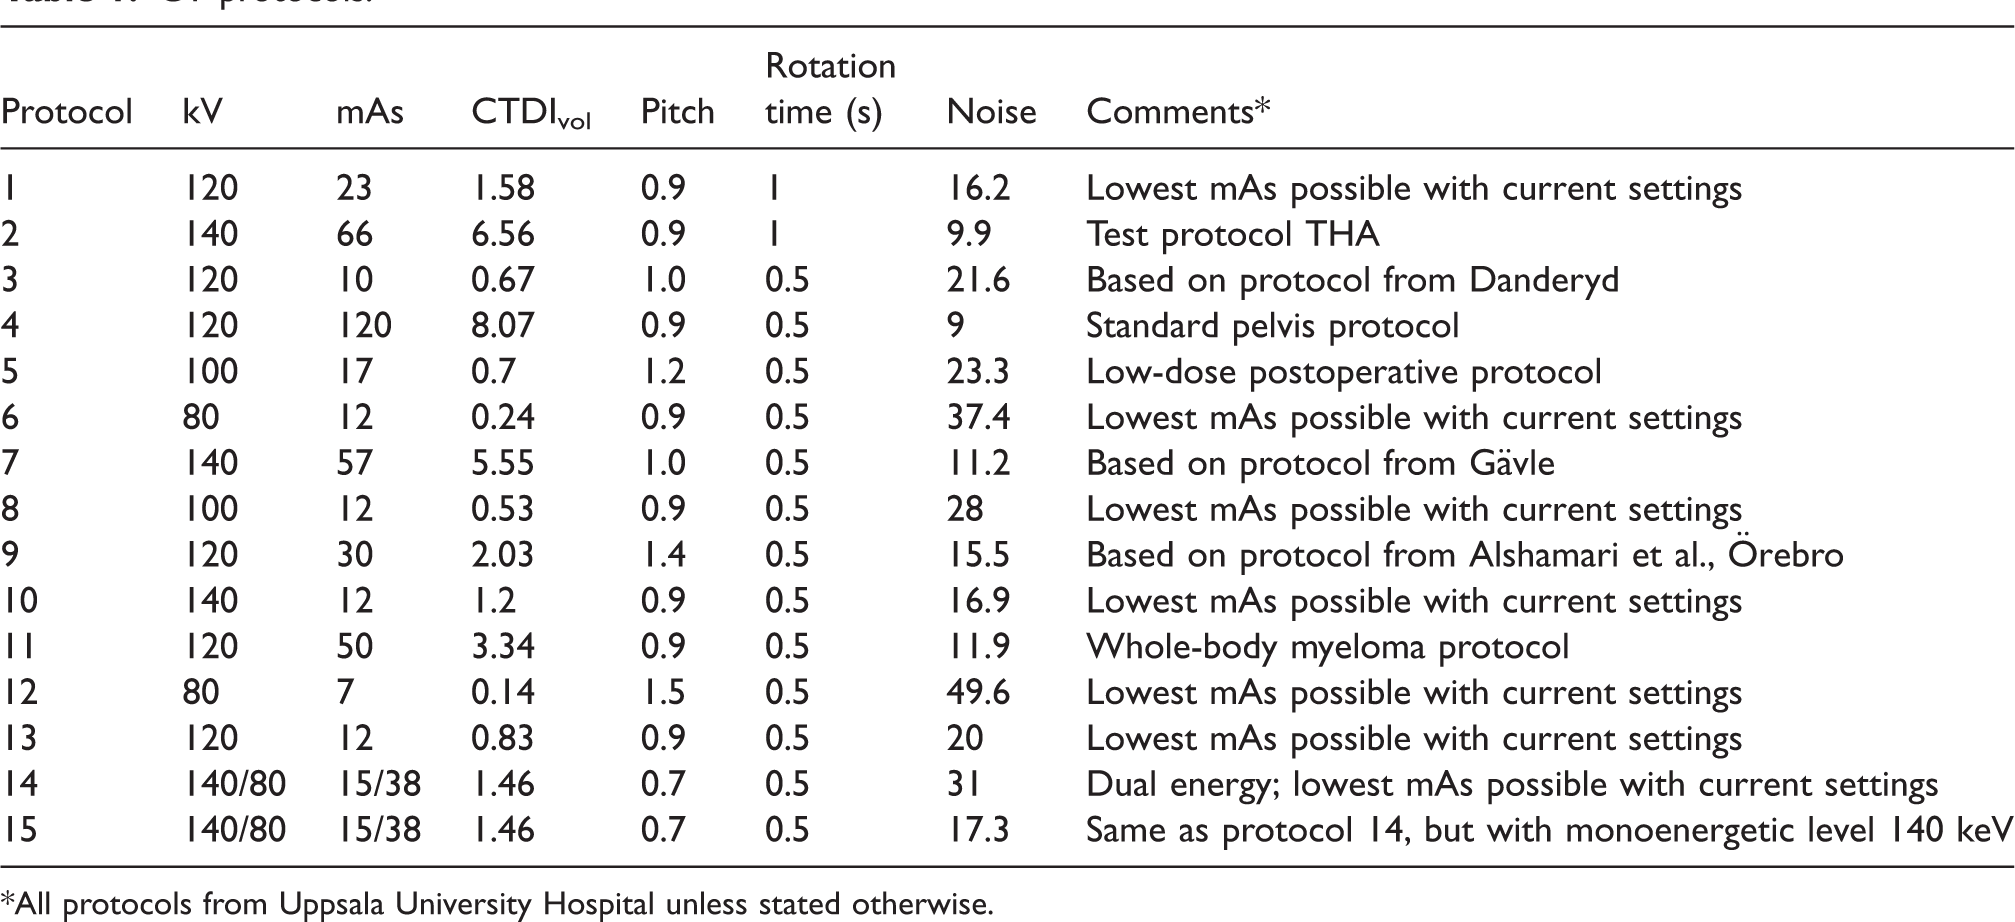
*All protocols from Uppsala University Hospital unless stated otherwise.
Image analysis
The 15 different image sets with four scans each were randomized and coded. Each scan was assessed by a senior consultant radiologist and radiologist (MH and TE with 20 years and 10 years of experience in musculoskeletal radiology, respectively). Image quality, geometry of tantalum beads, and degree of metal artifacts from tantalum beads and prosthesis stem were noted using multiplanar reconstructions (Fig. 2).
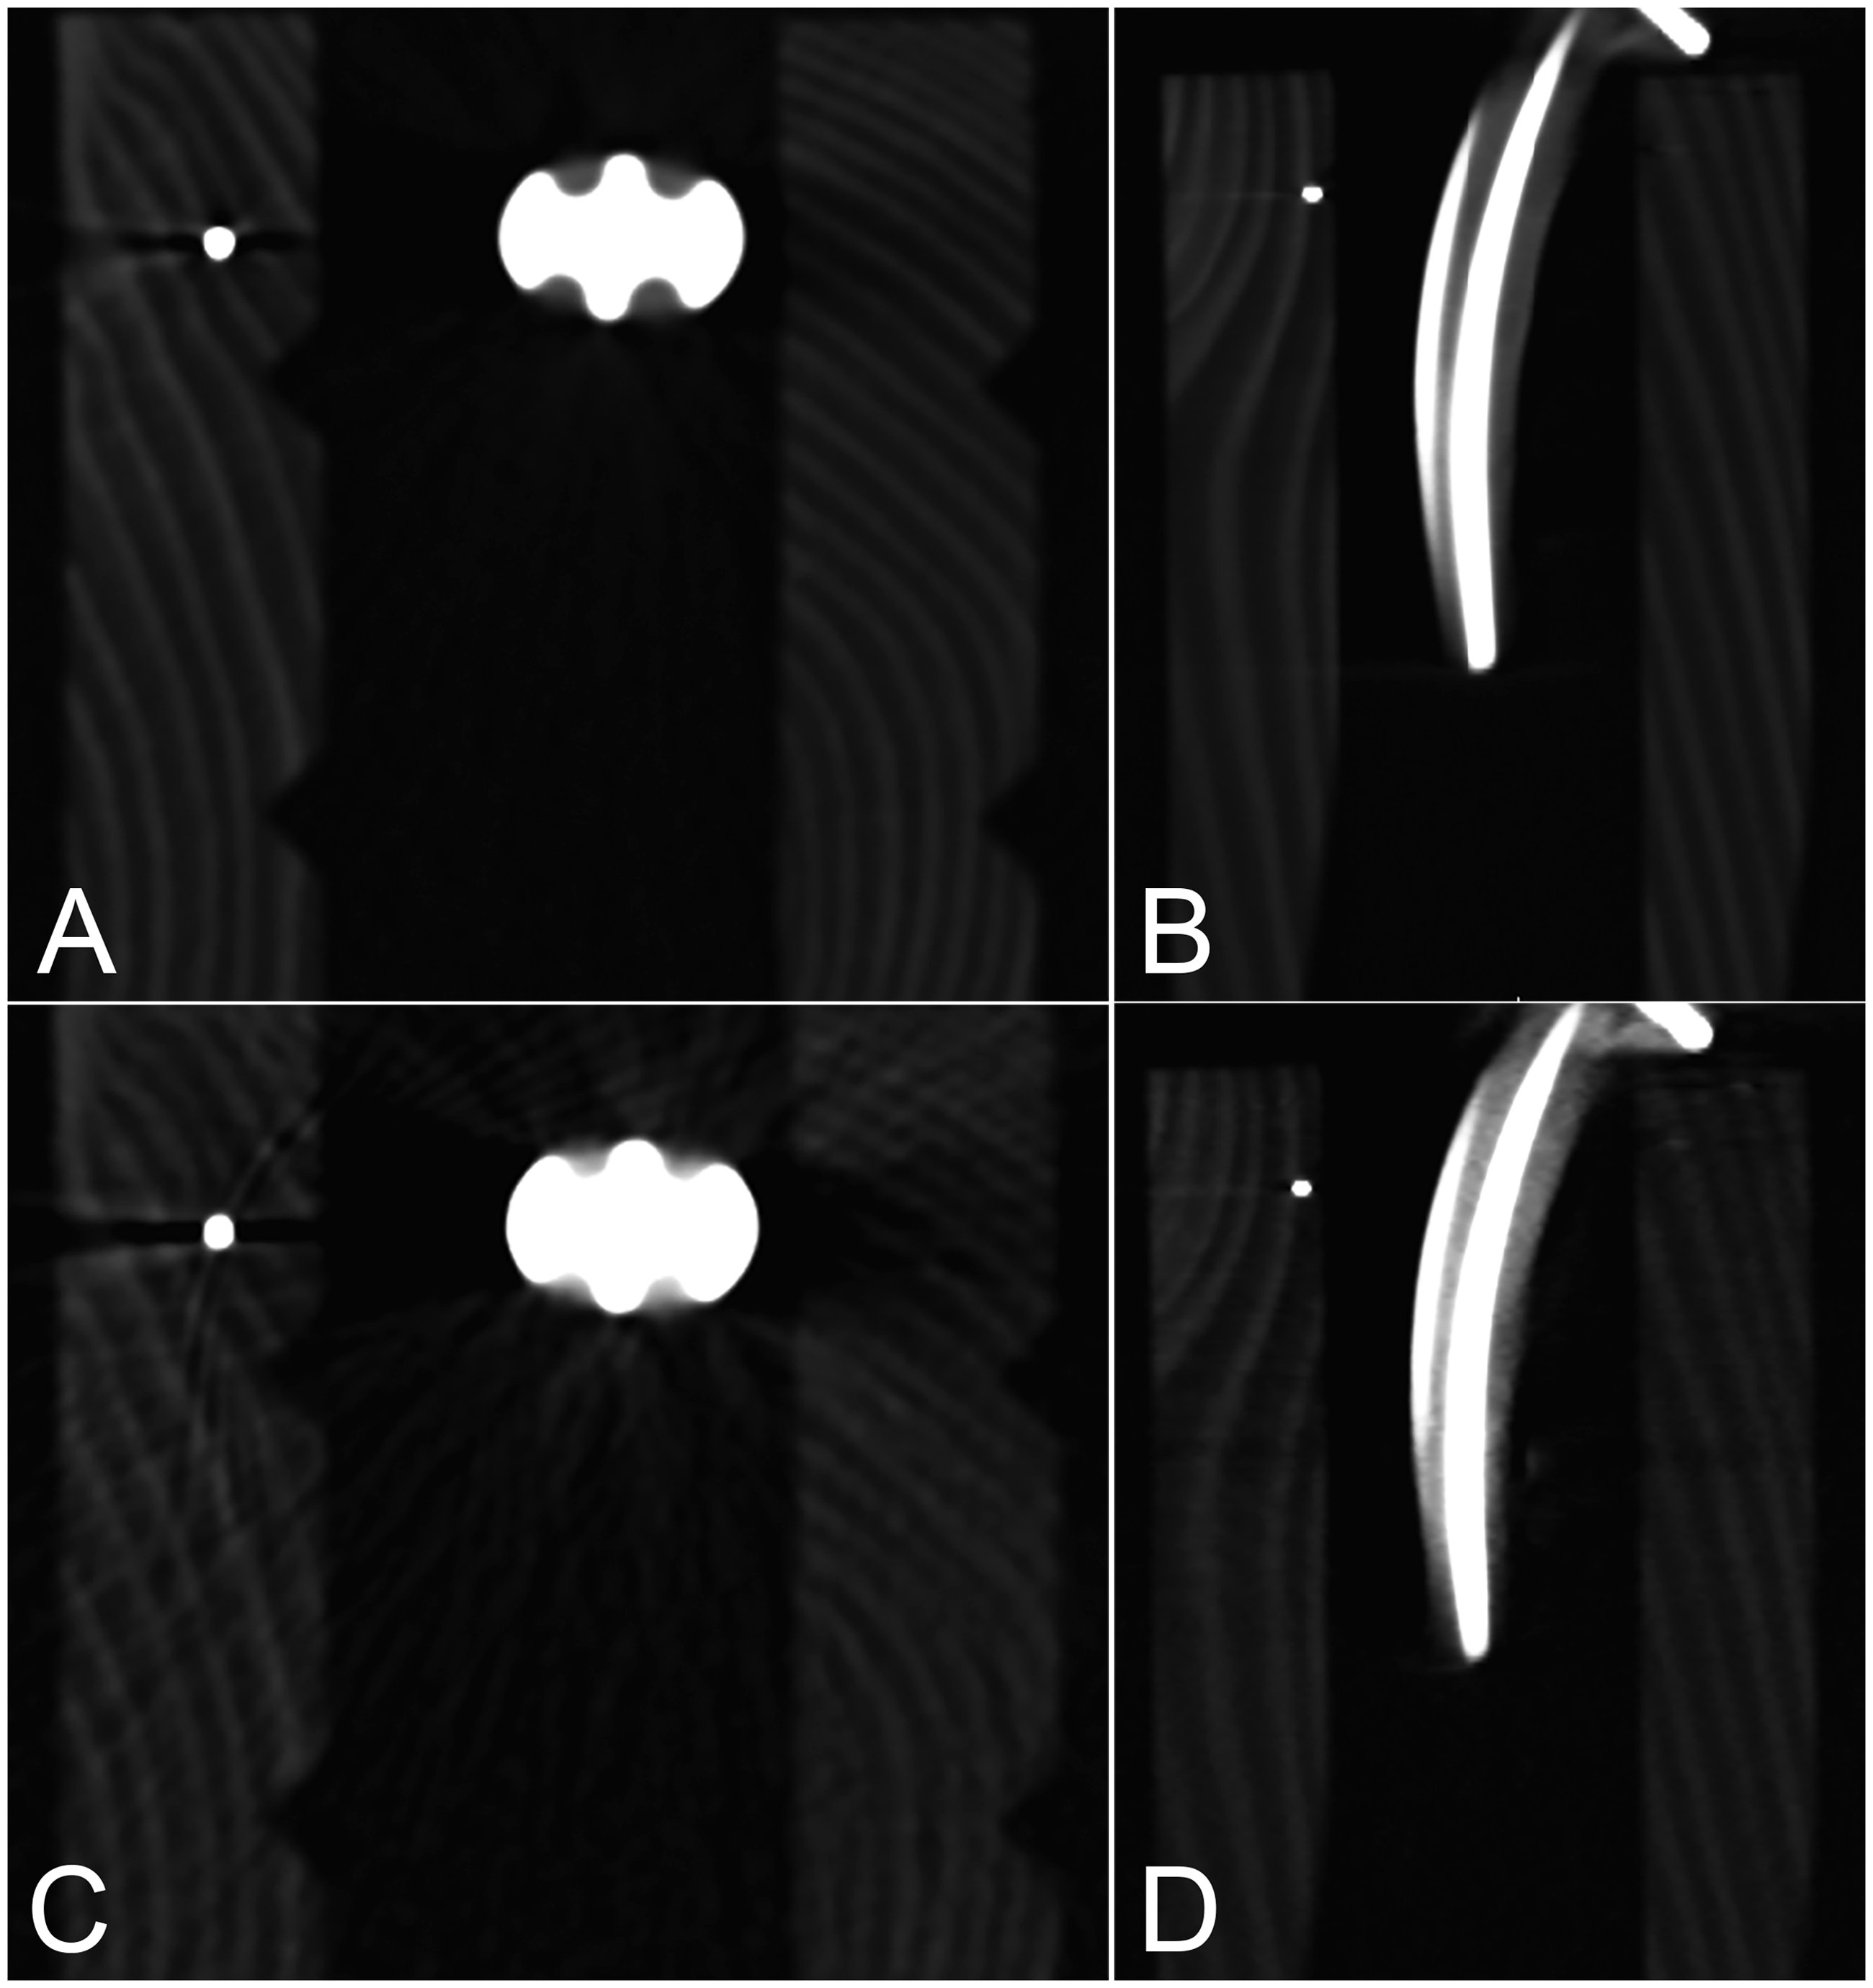
Imaging of tantalum beads and femoral stem. (a, b) Protocol 1 in transverse and coronal plane. (c, d) Protocol 12 in transverse and coronal plane.
Subjective image quality for each scan was scored using an ordinal scale of 1–4, based on European guidelines: 1 = very low; 2 = low; 3 = moderate; and 4 = good (12). This assessment of image quality focused on the ability to separate different materials and parts of the phantom, such as separating tantalum beads and wooden boards.
The geometry of tantalum beads was scored for each scan using an ordinal scale of 1–4, assessing the degree of geometric deviation from the expected view of a spherical marker (where the view is two-dimensional): 1 = marked change of shape, balls are nearing cuboid shape; 2 = moderate change of shape, balls appear ellipsoid; 3 = slight change of shape, balls appear somewhat ovoid; and 4 = no shape change, balls appear spherical.
The degree of metal artifacts (beam-hardening and streak artifacts) was scored for each scan using an ordinal scale of 1–4, assessing the impact of artifacts on surrounding materials such as air and wood: 1 = extensive artifacts, affecting the entire scan and the ability to assess adjacent materials; 2 = quite extensive artifacts, somewhat influencing assessment of adjacent materials; 3 = moderate artifacts, without major influence on assessment; and 4 = slight artifacts, no influence on assessment. In the assessment of the degree of metal artifacts, both tantalum beads and prosthesis stems were included.
The scores for image quality, geometry of tantalum beads, and degree of metal artifacts for each scanning protocol and for both observers were additively combined (Fig. 3) into a score with a maximum possible value of 24.

Rating of different image sets.
Image noise was measured manually by selecting five different regions of interest (ROI), 2 cm2, in the center of the water-filled syringe in five different slices. Given the 0.6-mm slice thickness, the ROI is actually a 3D volume of interest (VOI). The same ROI positions in the different axial slices were used in the 15 different protocols. Noise was calculated as the mean value of the standard deviation of the voxels within the different ROIs, in Hounsfield units (HU).
Radiation dose calculation
For each protocol the volume computed tomography dose index (CTDIvol) in mGy and dose length product (DLP) in mGy cm were recorded. The scan length was fixed at 25 cm for the phantom protocols. The ED, in mSv, of the CT scans was calculated according to ED=EDLP * DLP. EDLP is a conversion factor depending on which tissue has absorbed the ED and varies for different body regions. EDLP for the pelvic region is 0.0143 mSv mGy−1 cm−1 (13). Each study protocol was cross-referenced with ED using the first scan of each protocol. For the scans of the pilot patient, the DLP of the scout image (topogram) was recorded and the ED was calculated using the same method as above and added to the final dose estimation.
Selection of patient protocol
To validate the phantom study, the protocol with the lowest ED, was first used to scan a volunteer patient who had had a total hip arthroplasty (THA) with tantalum beads inserted at the time of the operation. Second, the patient was scanned using the protocol that fulfilled the criteria of highest image quality, lowest noise, and an ED < 1 mSv. This second examination was performed as a double examination comprising two scans with a repositioning of the patient between scans.
Numerical evaluation of quality of marker pattern
The positions of the nine tantalum beads in the CT datasets were calculated and evaluated using a previously described and validated 3D volume fusion (spatial registration) tool (14–16). This semi-automated tool provides landmark-based fusion of two volumes, registering a “target” volume to a “reference” volume by exploiting co-homologous landmarks in each volume. Technical descriptions are available in previous publications (15,17). In this study, the beads were designated in the CT data sets and pairs of datasets were registered using an automated, non-deforming, rigid body transformation. Using the computer’s pointing device, the tantalum beads in the “bone” (wooden frame) were designated, the fusion tool automatically used this as a starting point for calculating a best fit center and recorded this as a 3D landmark (18). Thereafter, the CT volume datasets were registered pair-wise using the six possible permutations within each parameter specific set of four scans. Along with bringing the datasets into spatial alignment with respect to the tantalum beads, the program generated a multitude of statistical information. The 3D distance between the position of each landmark in the registered volume and the corresponding position in the reference volume (the distance difference) was calculated for all the landmarks in each the paired examination. This represented the error in each landmark placement and the mean landmark error was calculated from this distance difference.
Statistical analysis of marker pattern
The mean error of rigid body fitting is the mean of the relative distance between the corresponding RSA markers in the rigid body after registration. The mean landmark error in our case corresponds to this error. Histograms together with box, density, and normal Q-Q plots were used to determine if the distance differences after registration were close to normally distributed. All statistical analyses were done with R version 3.3.1 (19).
Preliminary numerical evaluation of migration between stem and markers
Using a commercially available image post-processing tool for graphical and numerical evaluation of rigid body motion using CT (CTMA, Sectra, Linköping), the phantom scans with the highest combined quality score of 18 and an expected radiation dose <1 mSv, and the final scans of the patient were analyzed. For each of the four phantom protocols selected, two scan pairs were selected, one with no migration and one with a migration between stem and Tantalum markers of −2 mm in x direction. The
Results
Selection of patient protocol
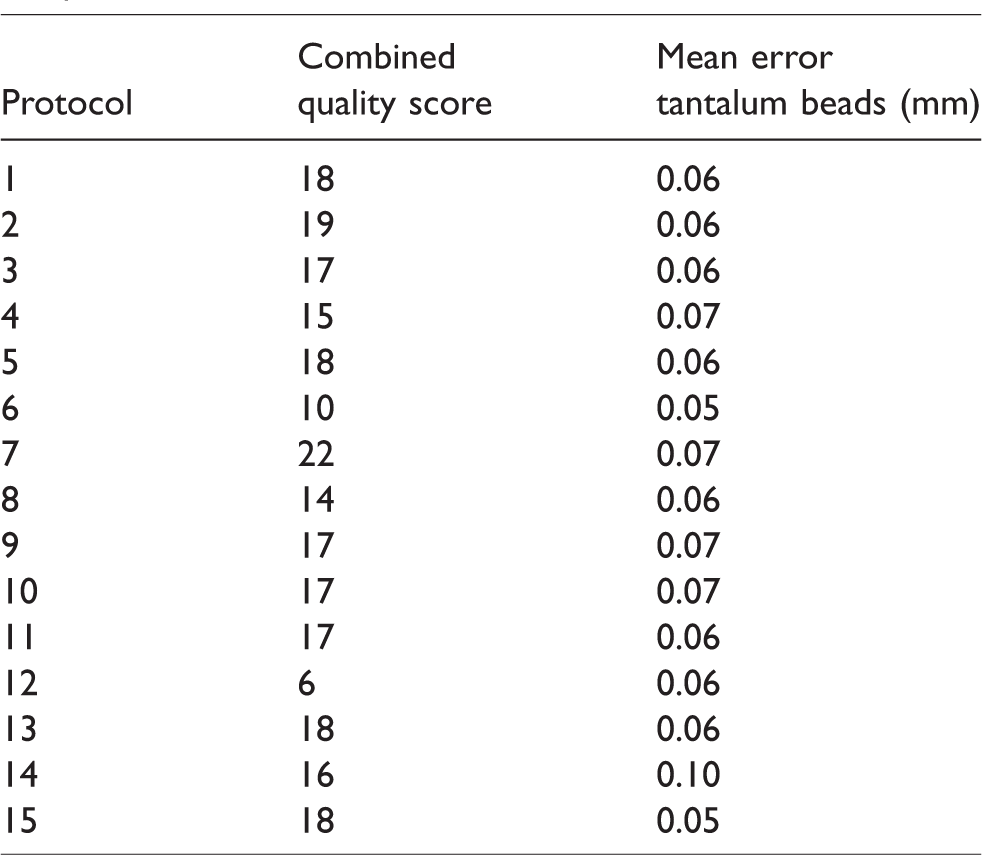
The protocol with the lowest ED was number 12. The highest combined quality score of the protocols with a CTDIvol < 2.2 was 18. These four protocols were numbers 1, 5, 13, and 15 (Fig. 3). Of these four, the protocol with the highest CTDIvol and lowest noise was protocol number 1, with a tube potential of 120 kV, a tube current of 23 mAs, a CTDIvol of 1.58 and a noise level of 16.8HU (Fig. 4). The combined quality scores for phantom protocols are given in Table 2.
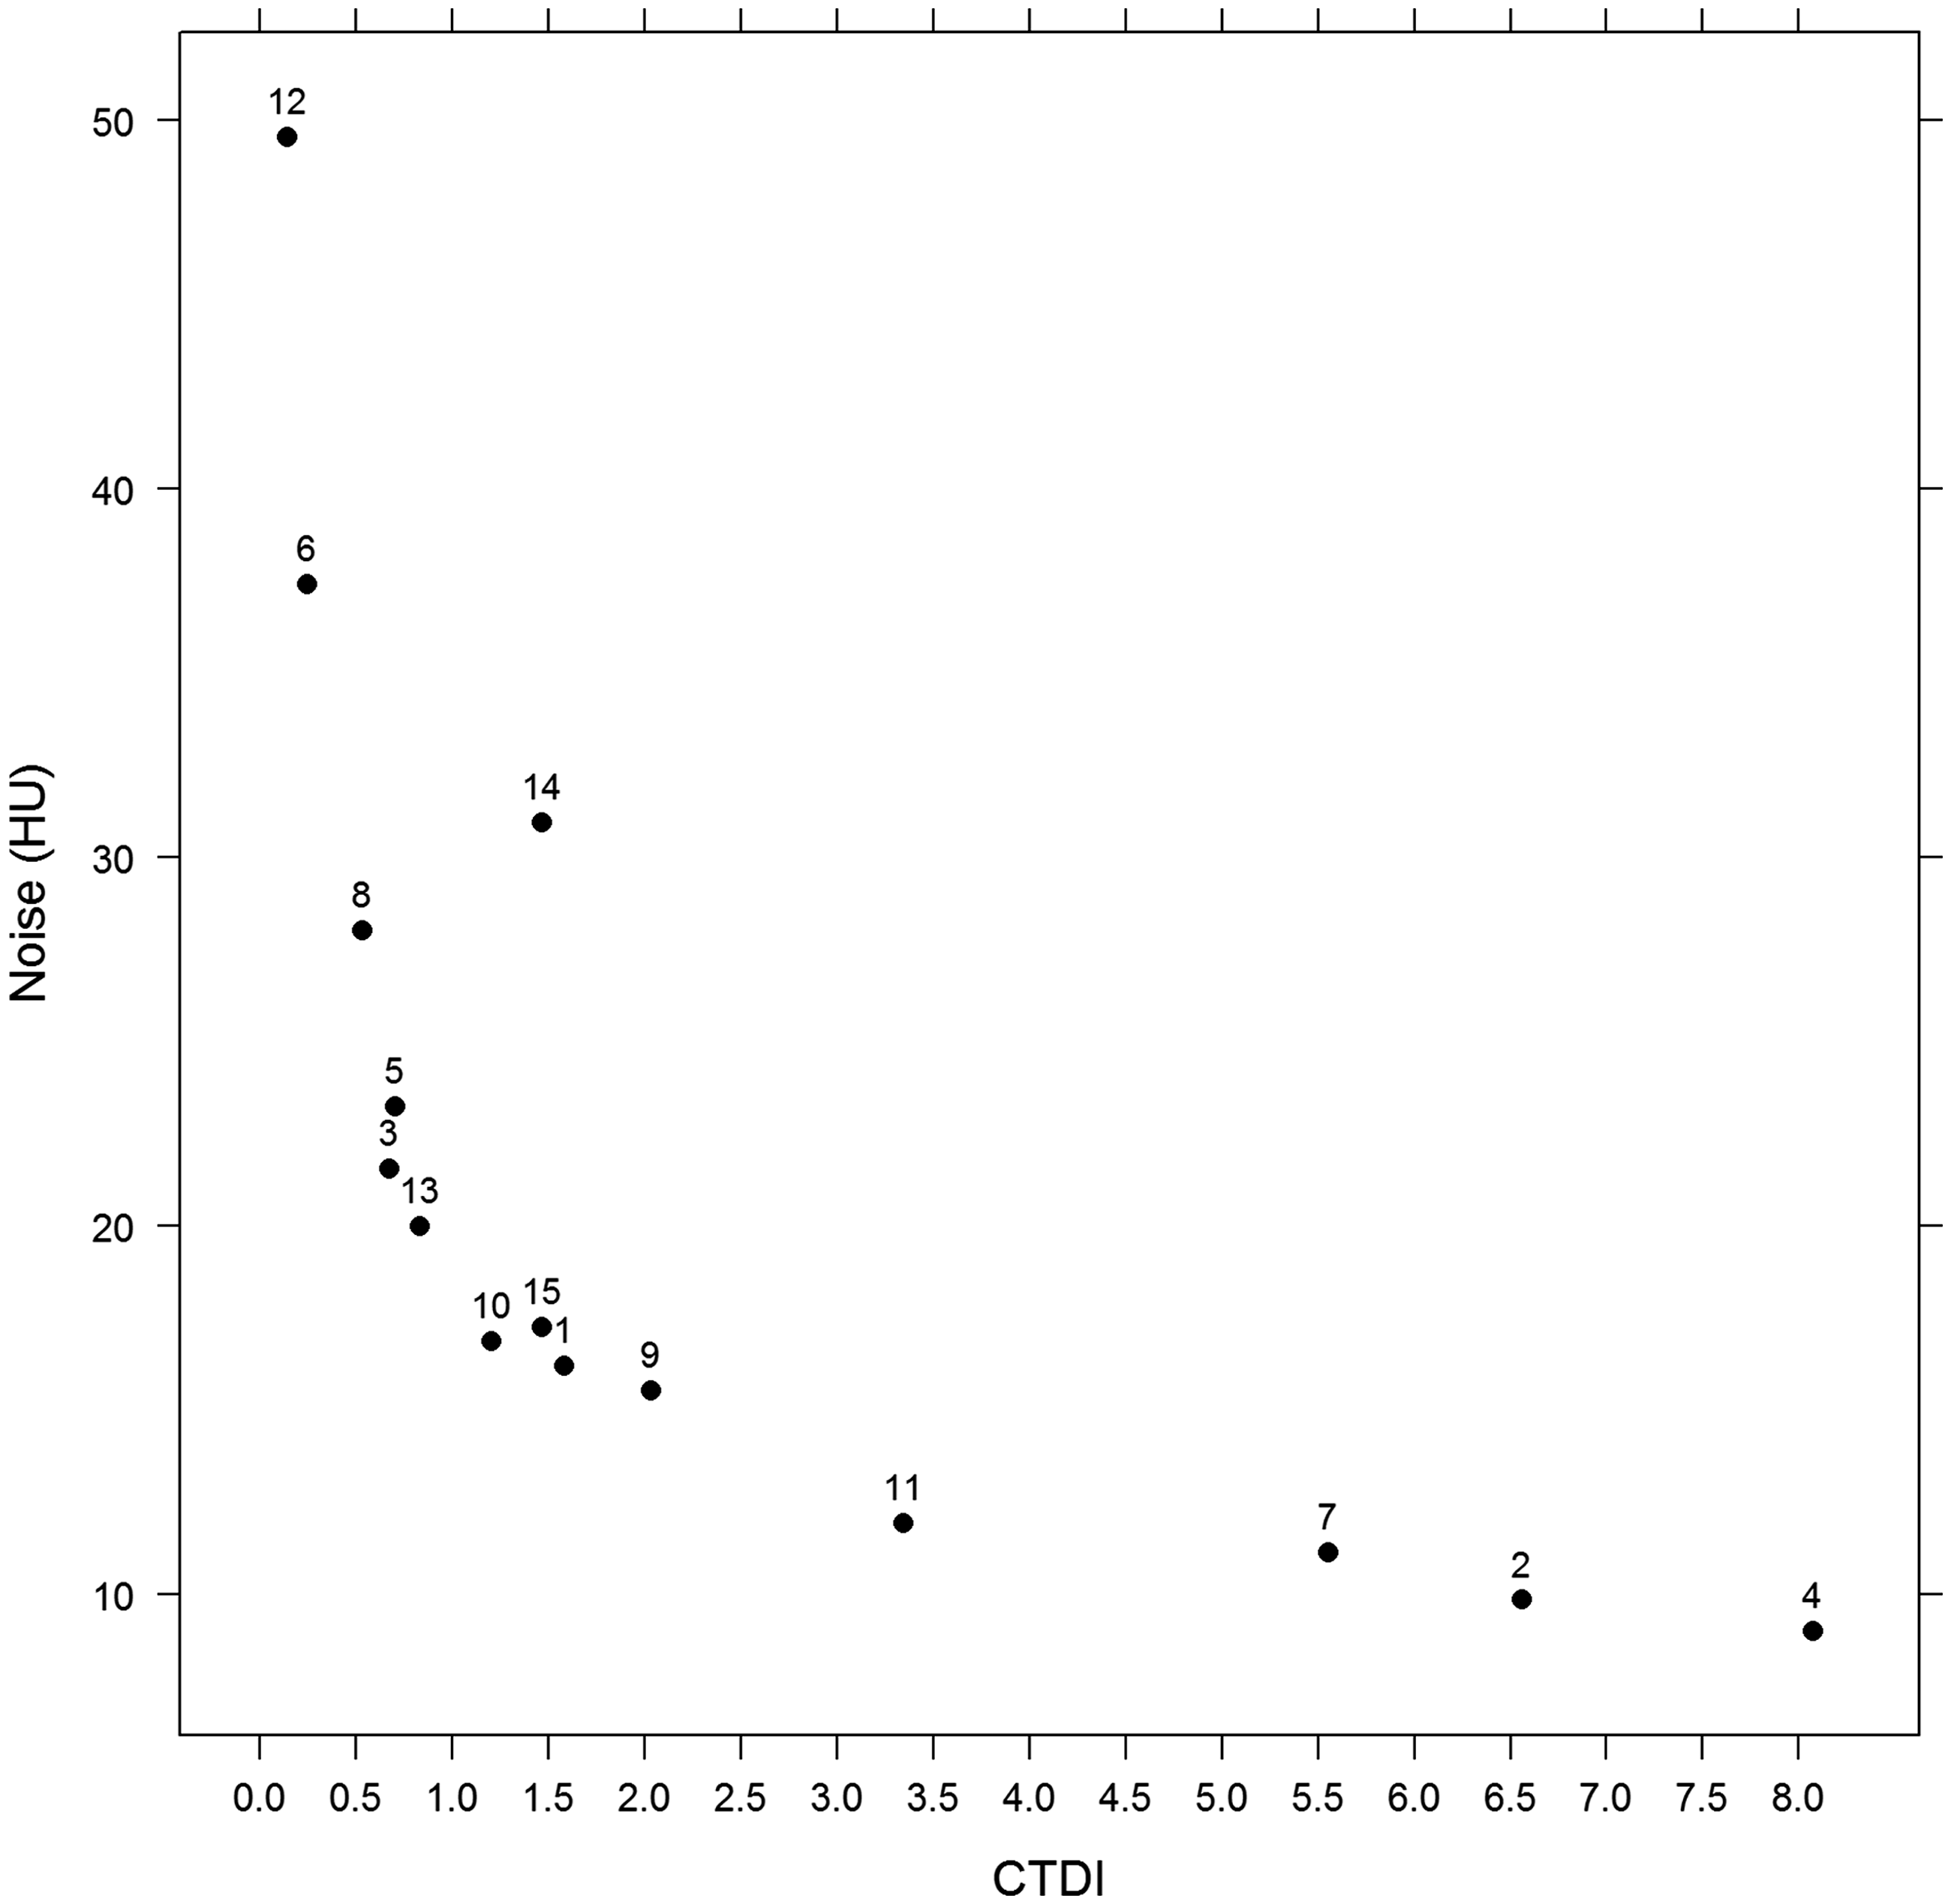
Noise in relation to CTDIvol for different image sets.
Combined quality score and mean error for CT protocols.
Patient results
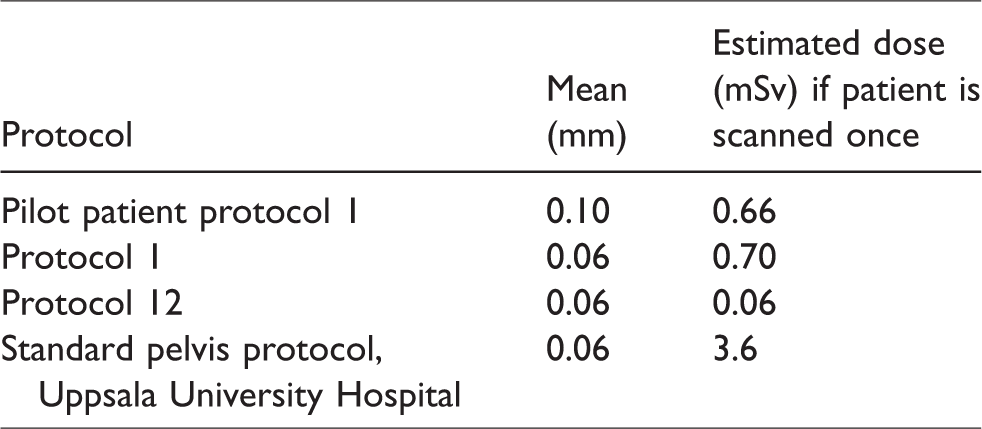
The first scan of the patient, with protocol 12, with a combined quality score of 6, resulted in insufficient image quality to assess mean landmark error (Fig. 3). The patient was re-scanned using protocol number 1 as it had the highest CTDIvol and lowest noise (Fig. 5). With this scan, it was possible to assess mean landmark error. The patient was scanned twice with this protocol in order to measure precision. The ED of this scan was 0.616 mSv. Together with the ED of the topogram, 0.044 mSv, this resulted in a total ED of 2 × 0.66 mSv (Table 3).

Pilot patient with femoral THA and tantalum beads scanned with two different protocols to assess mean landmark error. (a, b) Protocol 1 (adequate) in transverse and coronal plane. (c, d) Protocol 12 (inadequate) in transverse and coronal plane.
Errors of rigid body fitting of tantalum beads using the two scanner parameters settings chosen for clinical tests contrasted to the standard protocol used in our institution.
Numerical results
Mean errors of rigid body fitting of tantalum beads were in the range of 0.05–0.10 mm (Table 2). The largest individual landmark distance difference after registration in any of the pairs was 0.23 mm. The errors when acquiring data using the scan parameters selected for clinical testing, and when using the institution’s standard protocols, are contrasted in Table 3. Data on migration are presented in Table 4.
Precision of migration analysis using the four protocols with the highest combined quality score with two separate scans of the phantom; translation and rotation in three planes as well as MES for tantalum beads and stem were measured.
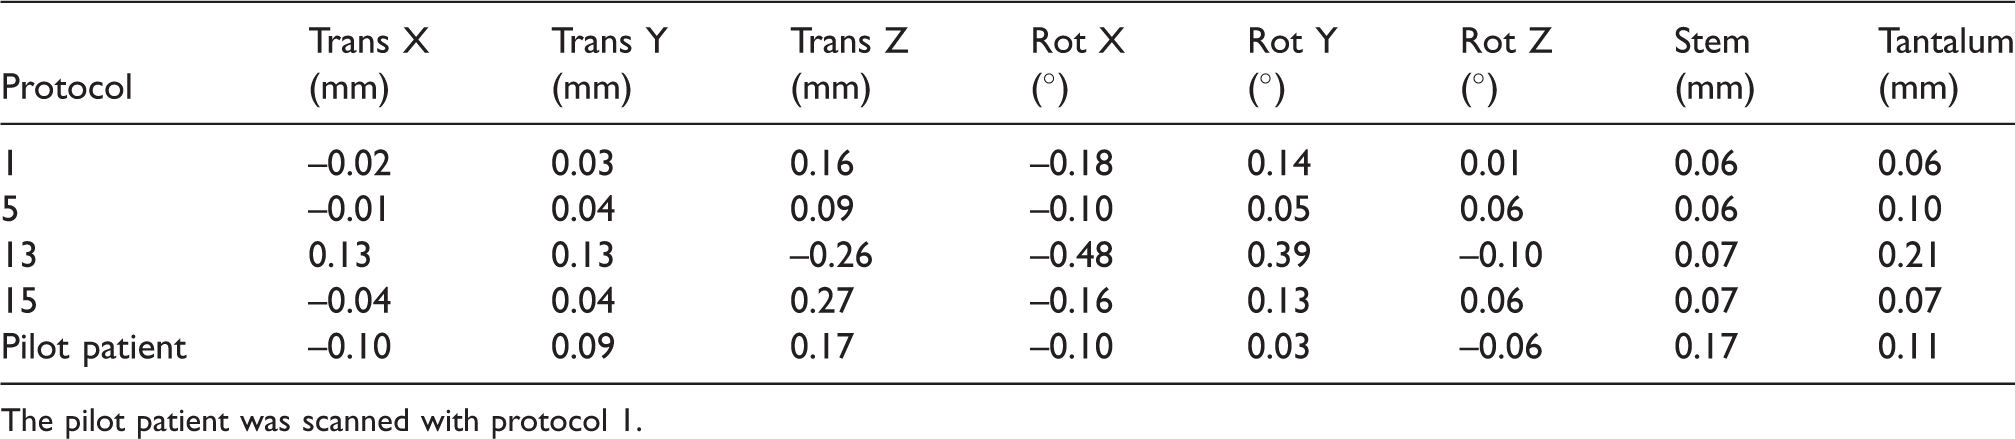
The pilot patient was scanned with protocol 1.
Discussion
The overall aim of this study was to find an imaging protocol with a low effective radiation dose to the patient and an acceptable image quality to provide accurate migration measurements for use in clinical studies of patients with tantalum markers.
This study showed that the selected protocol fulfills both requirements of low ED and adequate image quality for precise migration measurements.
The fact that even small objects can be correctly imaged spatially using CT is obvious from everyday clinical practice. However, for the modality to be useful in research settings, ED cumulated over multiple examinations of healthy individuals becomes an issue. Medical imaging with the use of ionizing radiation is performed according to the ALARA principle, which states that diagnostic information should be obtained with the radiation exposure “as low as reasonably achievable” below the effective dose limits. There is concern that the increasing number of CT studies will increase the estimated risk of cancer development, due to the higher ED compared to conventional radiography. This is especially true when scanning biologically sensitive organs such as the pelvis (20).
The estimated annual background radiation levels for a normal Swedish citizen, excluding medical radiation, is about 1.5 mSv, compared to 3.6 mSv from a single conventional CT scan of the pelvis at our department (21,22).
RSA imaging has low image quality due to the large field of view and low radiation dose but is sufficient for visualizing tantalum beads and hip prosthesis. However, it is not conclusive for diagnostic assessment of bone and prosthesis.
Imaging of orthopedic hardware with CT is well-known to be fraught with metal artifacts, such as photon starvation and beam-hardening, leading to streak artifacts, and scatter, affecting image quality and sometimes obscuring clinically important findings (23,24). Different approaches have been recommended to reduce the degree of metal artifacts, such as using higher tube peak kilovoltage and increasing tube current, using soft-tissue reconstruction algorithms or extending the CT Hounsfield unit scale. The drawback with lowering the ED in CT scanning is a decrease in image quality and low-contrast detectability as well as an increase in image noise (25). There is also an increase in artifacts from metallic hardware with a lowered tube current and tube potential (26).
Dual-energy CT (DECT) is a development in CT technology which uses two energy sources, or one energy source with two different tube potentials, to create image reconstructions. This allows for displaying presence as well as separation of different materials, based on their different absorption spectra. Acquisition data with two energy levels can be extrapolated to create monoenergetic images with a wide spread of energy levels, defined by the user. The main objective with reducing metal artifacts with DECT is to limit the impact of beam-hardening and photon starvation on image quality. This has shown a significant improvement in image quality and reduction in metal artifacts when compared to single-energy CT (27).
In our study, one of the protocols used a dual-energy technique with an estimated ED < 1 mSv, with two different reconstruction algorithms. One image set was reconstructed with a virtual monoenergetic level of 140 keV, to reduce metal artifacts. This lessened image noise and improved image quality compared to the mixed dual-energy image set, but it proved inferior, with regard to image quality and noise, to the protocol that was selected.
Since the phantom in our study was not anthropomorphic, the ED was significantly lower for all scans than it would have been in an actual patient. With a fixed scan length, CTDIvol represents the potential difference in ED between the different protocols. The mean ED for 10 randomly chosen standard pelvic CT scans in our department between 28 May 2012 and 18 of June 2012 was 3.6 mSv. To have an ED < 1 mSv, the CTDIvol had to be, for the same DLP, 3.6 times below that of the standard pelvic protocol at our department. When scanning the phantom, CTDIvol for the standard protocol was 8.07 mGy. Therefore, scan protocols with a higher CTDIvol than 2.2 mGy were excluded. The remaining protocols were ranked individually. The aim was to identify the protocol with an estimated ED closest to 1 mSv, with the highest rating in image quality and lowest image noise. The protocol with the lowest ED, number 12, also had the lowest image quality and highest noise, making it unsuitable for assessment of mean landmark error.
Some studies have explored the possibility of ED reduction in the pelvic CT examination without specifically trying to image tantalum markers. Low-dose CT has proven effective in postoperative evaluation after spine surgery (28). One recent in vitro study demonstrated that non-marker-based measurements of migration of a cemented femoral stem could have an accuracy and precision comparable to that of RSA without implantation of markers (6). Such a method could potentially enable monitoring small migrations of implants in any patient.
Boettner et al. implanted two total hip replacements and tantalum beads in the femur of two human cadavers and created a model for migration of the femoral component head and repeated CT scans with EDs in the range of 0.7–3.8 mSv. The accuracy was reported to be comparable to RSA. Moreover, reduction of the radiation exposure did not affect the accuracy (5).
Our research group has previously described a method for following patients with both prosthetic replacement and implanted tantalum beads (10). In our hospitals, maintaining the facilities for acquiring RSA stereographs are logistically challenging due to the requirement of double radiation sources, especially with the modernization and changing architecture of radiographic departments. The higher availability of CT has to be considered in relation to its higher ED.
As part of a follow-up study on uncemented cup fixation, two pairs of stereo radiographs and a CT scan of 46 hips were compared. Tantalum beads in the CT volume and the stereo radiographs were used to register the RSA data to the CT data and to calculate the precision of RSA using double exams. The differences between CT and RSA was close to the described (2) normal 99% confidence interval for precision in RSA (29,30).
Typical ME values found in clinical RSA trials are in the range of 0.10–0.25 mm (30). Values in or below this range derived from patient CT scans would be adequate for migration analysis based on tantalum markers. Clearly, any of the phantom scans fulfills this requirement. This is also the case for the pilot patient scans acquired using the finally selected protocol. The difference in ME between the protocols is 0.05–0.10, with the majority being in the range of 0.05–0.07. This is probably due to the non-anthropomorphic nature of the phantom. The required level of effective dose in order to achieve acceptable ME values is therefore very low when scanning this particular phantom. The level of noise, ED, and combined quality score were used to distinguish between different protocols.
When assessing the degree of metal artifacts, both tantalum beads and stem were included. The stem was generally assessed as having no deformation and a low degree of metal artifacts. Therefore, ME values were measured only for the tantalum beads in the phantom scans, since they were considered the main contributor to any potential problem with ME measurement. In the clinical setting, both tantalum beads and stem were measured in the pilot patient.
A limitation of this study was that we did not perform RSA of neither the hip phantom nor the pilot patient in the research setting. However, RSA of the patient was later performed in the clinical setting.
In conclusion, in this unique patient, the final selected protocol fulfills both requirements of low ED and adequate image quality for precise migration measurements. Future technological advancements in DECT and detector resolution could bring about further reductions in ED. This protocol is now being used for further studies of patient series, including double examinations for precision measurements.
Footnotes
Acknowledgements
The authors thank the staff at the Radiology Department at Uppsala University Hospital, with special thanks to M Segelsjö.
Declaration of conflicting interests
The author(s) declared the following potential conflicts of interest with respect to the research, authorship, and/or publication of this article: Henrik Olivecrona has a consultancy agreement with Sectra AB.
Funding
The author(s) received no financial support for the research, authorship, and/or publication of this article.