
Abstract
Background
Hypovascular pancreatic neuroendocrine tumor is usually misdiagnosed as pancreatic ductal adenocarcinoma.
Purpose
To investigate the value of texture analysis in differentiating hypovascular pancreatic neuroendocrine tumors from pancreatic ductal adenocarcinoma on contrast-enhanced computed tomography (CT) images.
Material and Methods
Twenty-one patients with hypovascular pancreatic neuroendocrine tumors and 63 patients with pancreatic ductal adenocarcinomas were included in this study. All patients underwent preoperative unenhanced and dynamic contrast-enhanced CT examinations. Two radiologists independently and manually contoured the region of interest of each lesion using texture analysis software on pancreatic parenchymal and portal phase CT images. Multivariate logistic regression analysis was performed to identify significant features to differentiate hypovascular pancreatic neuroendocrine tumors from pancreatic ductal adenocarcinomas. Receiver operating characteristic curve analysis was performed to ascertain diagnostic ability.
Results
The following CT texture features were obtained to differentiate hypovascular pancreatic neuroendocrine tumors from pancreatic ductal adenocarcinomas: RMS (root mean square) (odds ratio [OR] = 0.50, P<0.001), Quantile50 (OR = 1.83, P<0.001), and sumAverage (OR = 0.92, P=0.007) in parenchymal images and “contrast” in portal phase images (OR = 6.08, P<0.001). The areas under the curves were 0.76 for RMS (sensitivity = 0.75, specificity = 0.67), 0.73 for Quantile50 (sensitivity = 0.60, specificity = 0.77), 0.70 for sumAverage (sensitivity = 0.65, specificity = 0.82), 0.85 for the combined texture features (sensitivity = 0.77, specificity = 0.85).
Conclusion
CT texture analysis may be helpful to differentiate hypovascular pancreatic neuroendocrine tumors from pancreatic ductal adenocarcinomas. The three combined texture features showed acceptable diagnostic performance.
Keywords
Introduction
Pancreatic neuroendocrine tumors (PNETs) arise from pluripotent stem cells in ductal epithelium, accounting for < 3% of all pancreatic neoplasms (1). In recent decades, the incidence of PNETs has increased (2,3). According to the 2017 World Health Organization (WHO) classification of neuroendocrine tumors, the PNETs are separated into grade 1 (G1), grade 2 (G2), well-differentiated grade 3 (G3) NETs, and poorly differentiated pancreatic neuroendocrine carcinoma (PNEC) based on mitotic count and Ki-67 proliferation index (4).
The most common characteristics of PNETs include a well-defined margin and marked hyperenhancement on dynamic contrast-enhanced computed tomography (CE-CT) or magnetic resonance imaging (MRI). However, recent studies showed that G2/3 PNETs also exhibit ill-defined margins and iso-to-hypo enhancement on arterial and portal phases (3,5,6), which was similar to the imaging findings of pancreatic ductal adenocarcinoma (PDAC). Kimura et al. (7) reported a PNEC case with a hypo-enhanced pattern on CE-CT which was misdiagnosed as PDAC. The treatment options and prognosis of PNETs and PDAC are substantially different. For PNETs, surgery is the only curative resection option. If there is local recurrence or metastasis in G1/2 PNETs, surgical resection and targeted molecular therapy (everolimus or sunitinib) are recommended (2,6,8). PNEC is generally highly aggressive. However, the five-year survival rate of PNEC was approximately 30% (3), which was better than PDAC. PDAC is one kind of highly aggressive tumors with low resection rates compared to PNET. For locally advanced unresectable PDAC, chemotherapy and/or radiation are considered major treatment. The treatment goals include controlling the spread of tumor and reducing metastatic potential (9). Therefore, accurate preoperative identification of hypovascular PNETs (hypo-PNETs; hypo-enhancement on multiphase CE-CT examinations) from PDAC is of great clinical significance in guiding the patients’ treatment strategies.
Several studies have shown the values of CT and MRI findings in differentiating hypo-PNETs or PNEC from PDAC (10–12). However, those imaging findings are usually qualitative data and are easily affected by radiologists. Texture analysis (TA) is an emerging area of “radiomics” that extracts, analyzes, and interprets quantitative imaging features; it has shown promise in tumor characterization, treatment, and prognosis evaluation in several tumor types (13). To the best of our knowledge, few studies have shown the differences in TA parameters between hypo-PNETs and PDAC. Two studies showed the differences of CT TA parameters between PNEC or hypo-PNETs and PDAC (14,15). However, only several TA parameters (≤10) were analyzed. Usually, hundreds of TA parameters can be extracted from the images. Therefore, the purpose of this study was to investigate the values of TA in identifying hypo-PNETs from PDAC based on pancreatic parenchymal and portal phase CT images.
Material and Methods
Patient selection
This study was approved by the Review Board of our institution. Written informed consent was waived because this was a retrospective study. During the whole study, the Declaration of Helsinki was followed.
In total, 86 patients with pathologically proven PNETs between January 2012 and November 2018 were identified from the two-institutional database. Exclusion criteria were as follows: (i) absence of preoperative dynamic CE-CT images (n = 10); (ii) hyperenhancement on CE-CT images (n = 46); (iii) tumor predominantly presented as cystic (n = 6) (cystic tumor was defined as having a uniform thin [≤3 mm] peripheral rim of enhancement without an enhancing mural nodule) (6); and (iv) section thickness < 2 mm and reconstruction interval (n = 3). Finally, 21 patients (10 men, 11 women; mean age = 50.7 ± 15.3 years; age range = 24–71 years) with hypo-PNETs were included into our study (Fig. 1).
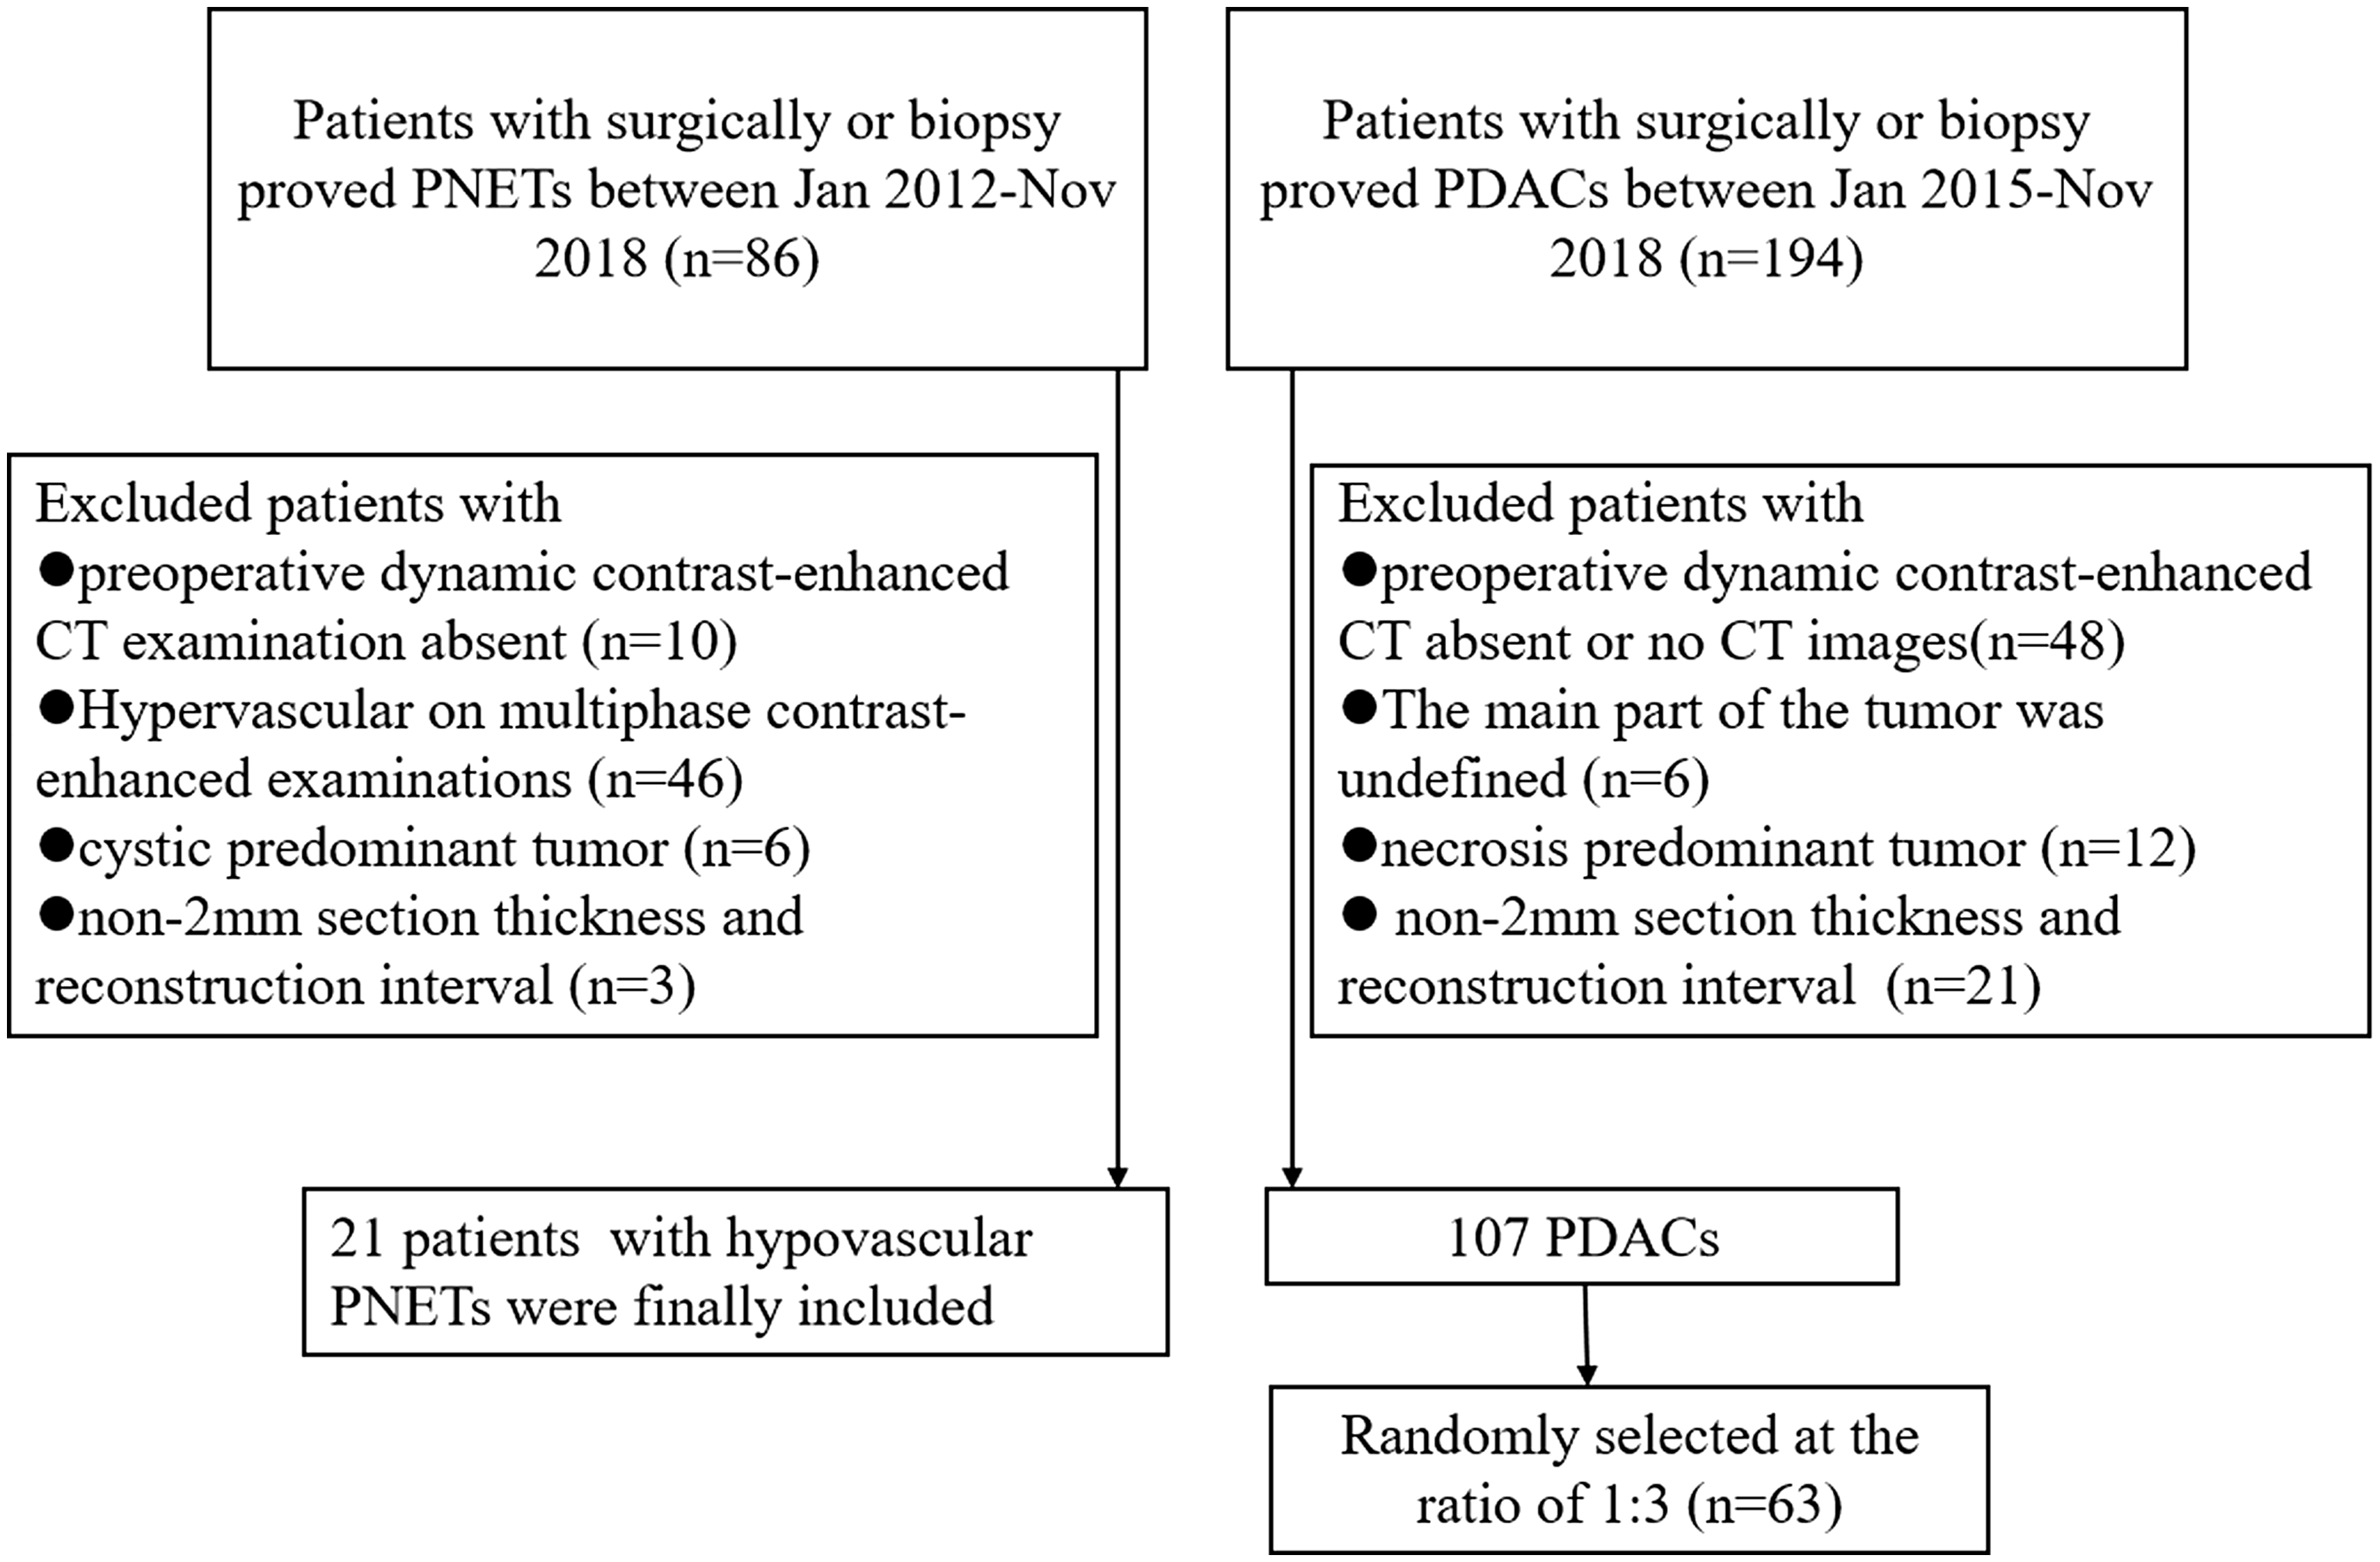
Flow diagram of the study patients with hypovascular pancreatic neuroendocrine tumors (hypo-PNETs) and pancreatic ductal adenocarcinomas (PDACs).
We also identified 194 patients with pathologically confirmed PDAC between January 2015 and November 2018 from the two-institutional database. Forty-eight patients were excluded due to absence of preoperative dynamic CE-CT images; six patients were excluded because the main part of tumor was undefined by the naked eye due to diffuse dilatation of the main pancreatic duct; 12 patients were excluded because the tumor presented as necrotic dominantly (cystic tissue in > 90% of the tumor); 21 patients were excluded due to section thickness < 2 mm and reconstruction interval. Among the remaining 107 patients, we randomly selected 63 patients at the proportion of 1:3, including 42 men and 21 women (mean age = 64.1 ± 9.10 years; age range = 39–80 years). The flow chart of patient selection is shown in Fig. 1.
CT technique
All the patients in this retrospective study underwent preoperative dynamic CE-CT. Of them, 58 underwent CT examinations with 64-row multi-slice spiral CT (Philips Brilliance 64; Philips Healthcare, DA Best, The Netherlands), while 26 patients underwent CE-CT examination with the GE Discovery CT750HD scanner. Pancreatic parenchymal phase and portal venous phase images were acquired at 35–45 s and 60–65 s after intravenous administration of non-ionic iodinated contrast material (350 mg I/mL) at a rate of 3.0 mL/s via a pump injector. CT scanning parameters were as follows: tube voltage = 120 kVp; automatic tube current modulation = 250–400 mAs; section thickness = 2.0 mm; and reconstruction intervals = 2.0 mm.
CT texture analysis
Pancreatic parenchymal phase images are better for detecting of PNET and PDAC. Therefore, we focus on the TA on images obtained at pancreatic parenchymal phase. CT texture features based on portal phase images were also determined. Two radiologists (with > 10 years of experience in abdominal CT imaging diagnosis) who were blinded to the patients’ pathologic results reviewed the CT images. For each patient, we selected three consecutive axial images of the lesion as regions of interest (ROI). The first axial image was obtained at the largest cross-section image; the second and the third images were obtained on the upper and lower level of the largest cross-section image, respectively. The CT images were exported in DICOM format from the picture archiving and communication system (PACS) to a workstation (Omni-Kinetics Version V2.0.10, GE) for texture analysis. The two radiologists manually drew the ROIs along the margin of the tumor. For each patient, after the three ROIs were segmented, we merged them into a three-dimensional (3D) ROI, then clicked the “CalcTextureParam” button, and a total of 68 features were automatically extracted. They were separated into five categories: (i) first-order statistics; (ii) histogram; (iii) gray-level cooccurrence matrix (GLCM); (iv) Haralick; and (v) run-length matrix (RLM). A simplified flow chart of texture analysis is summarized in Fig. 2.

Simplified flowchart of texture analysis used in this study. PNET, pancreatic neuroendocrine tumor; PDAC, pancreatic ductal adenocarcinoma; ROI, region of interest; TA, texture analysis; GLCM, gray-level co-occurrence matrix; RLM, run-length matrix; RMS, root mean square; ROC, receiver operating characteristics; AUC, area under the curve.
Statistical analysis
For the texture features with normal distribution, the dependent sample t-test was used to identify the differences between hypo-PNETs and PDAC. The Mann–Whitney U test was used for these abnormal distributed parameters. Univariate regression analysis was performed; variables with P < 0.01 were then selected as input variables for multivariate analysis to identify the significant differentiator of hypo-PNETs from PDAC. Receiver operating characteristics (ROC) curve analysis was performed and the area under the curve (AUC), sensitivity, and specificity were calculated to ascertain diagnostic ability. Inter-observer agreement for CT texture features was calculated using intraclass correlation coefficient (ICC). ICC values ≤0.4 indicated poor agreement, 0.41–0.60 indicated moderate agreement, 0.61–0.80 indicated substantial agreement, and > 0.8 indicated perfect agreement. An internal validation was performed to confirm our model by analyzing the texture features of nine hypo-PNETs and 25 PDACs from the same institution. All statistical analyses were performed using SPSS v.20.0 (IBM SPSS, Chicago, IL, USA). P < 0.05 was considered statistically significant.
Results
Patient characteristics and CT findings
The demographic features of the 84 patients (21 hypo-PNETs and 63 PDACs) are summarized in Table 1. No differences were found in gender or clinical symptoms between those two groups. PDACs usually occurred in old people. Yellow urine or icterus was more common in patients with PDACs compared with hypo-PNET patients (50.8% vs. 23.8%). CA19-9 and CA125 levels were higher in patients with PDACs compared with hypo-PNET patients (P < 0.001 or 0.05). In hypo-PNETs, 4 (19%) tumors were G1, 6 (29%) tumors were G2, and 11 (52%) tumors were G3. The tumor size of hypo-PNETs was larger than that of PDACs (4.42 cm vs. 3.72 cm; P = 0.048). There was no significant difference in sex and tumor location between hypo-PNETs and PDACs. In addition, G2/3 PNETs were more likely to show hypo-enhancement on multiphase CT images. The CT images of hypo-PNETs and PDACs are shown in Fig. 3. The two lesions showed similar imaging findings.
Demographic characteristic of patients with hypo-PNETs and PDACs.
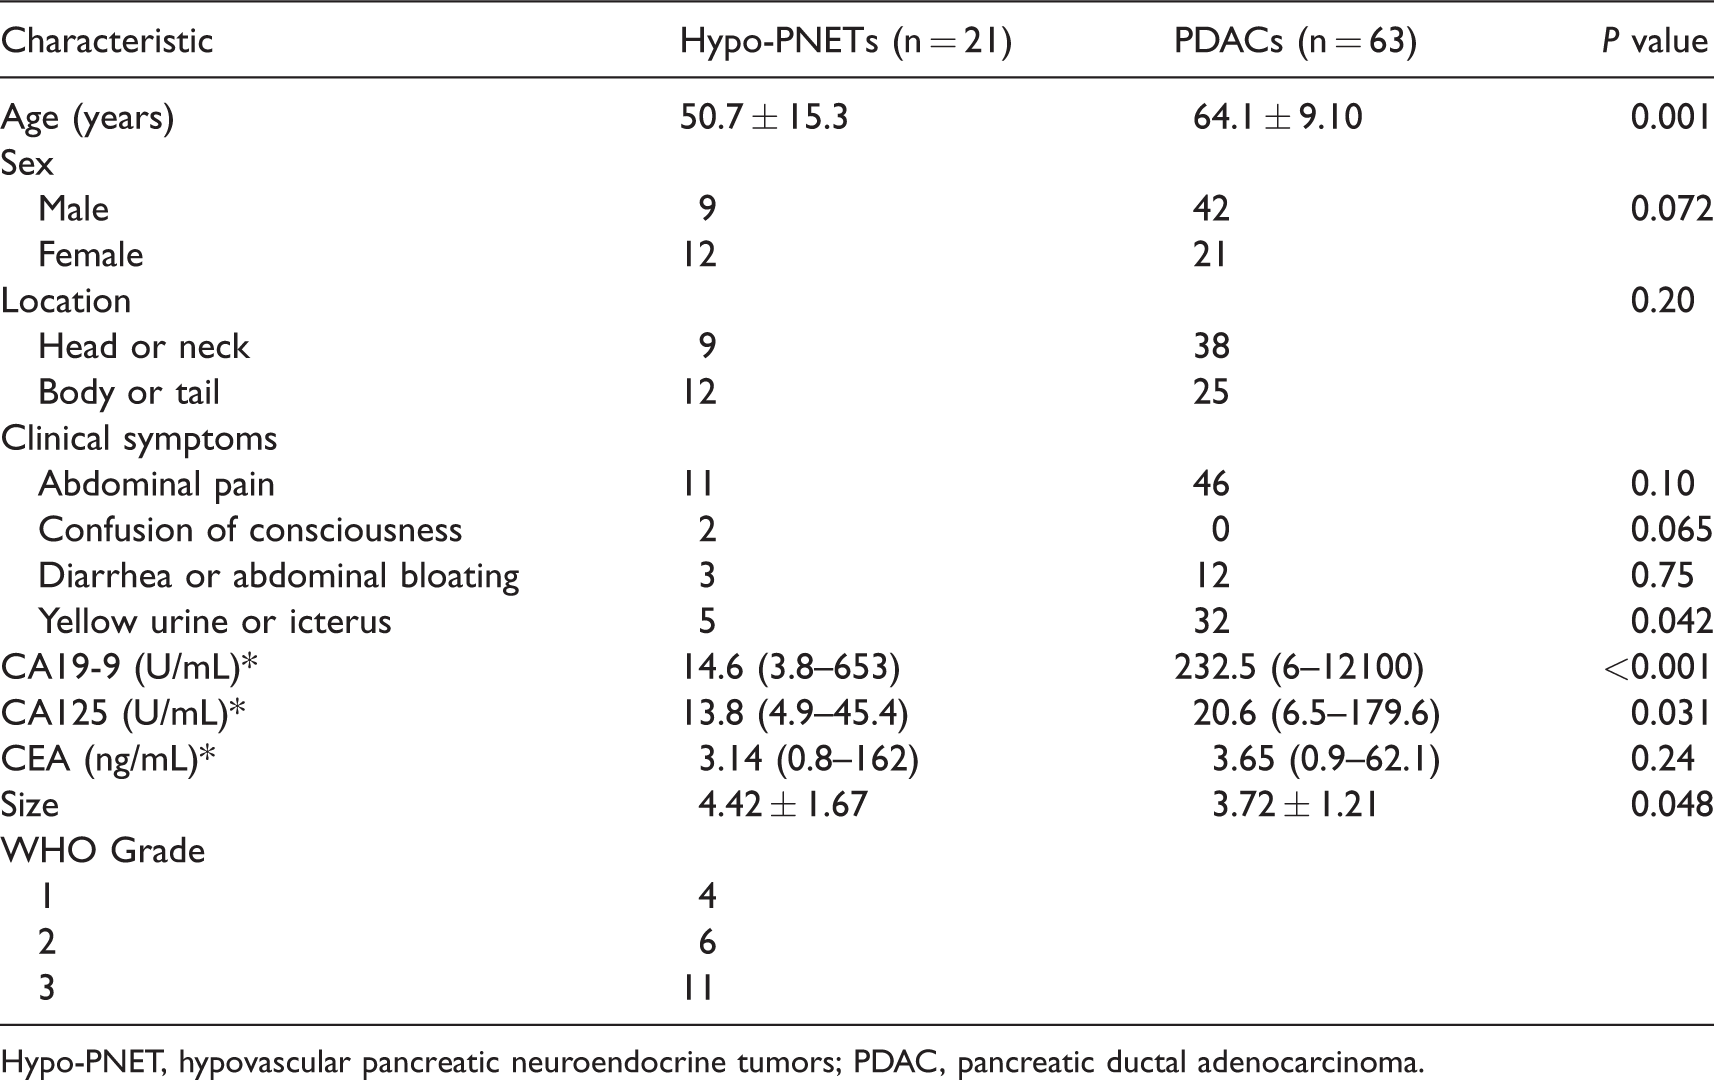
Hypo-PNET, hypovascular pancreatic neuroendocrine tumors; PDAC, pancreatic ductal adenocarcinoma.
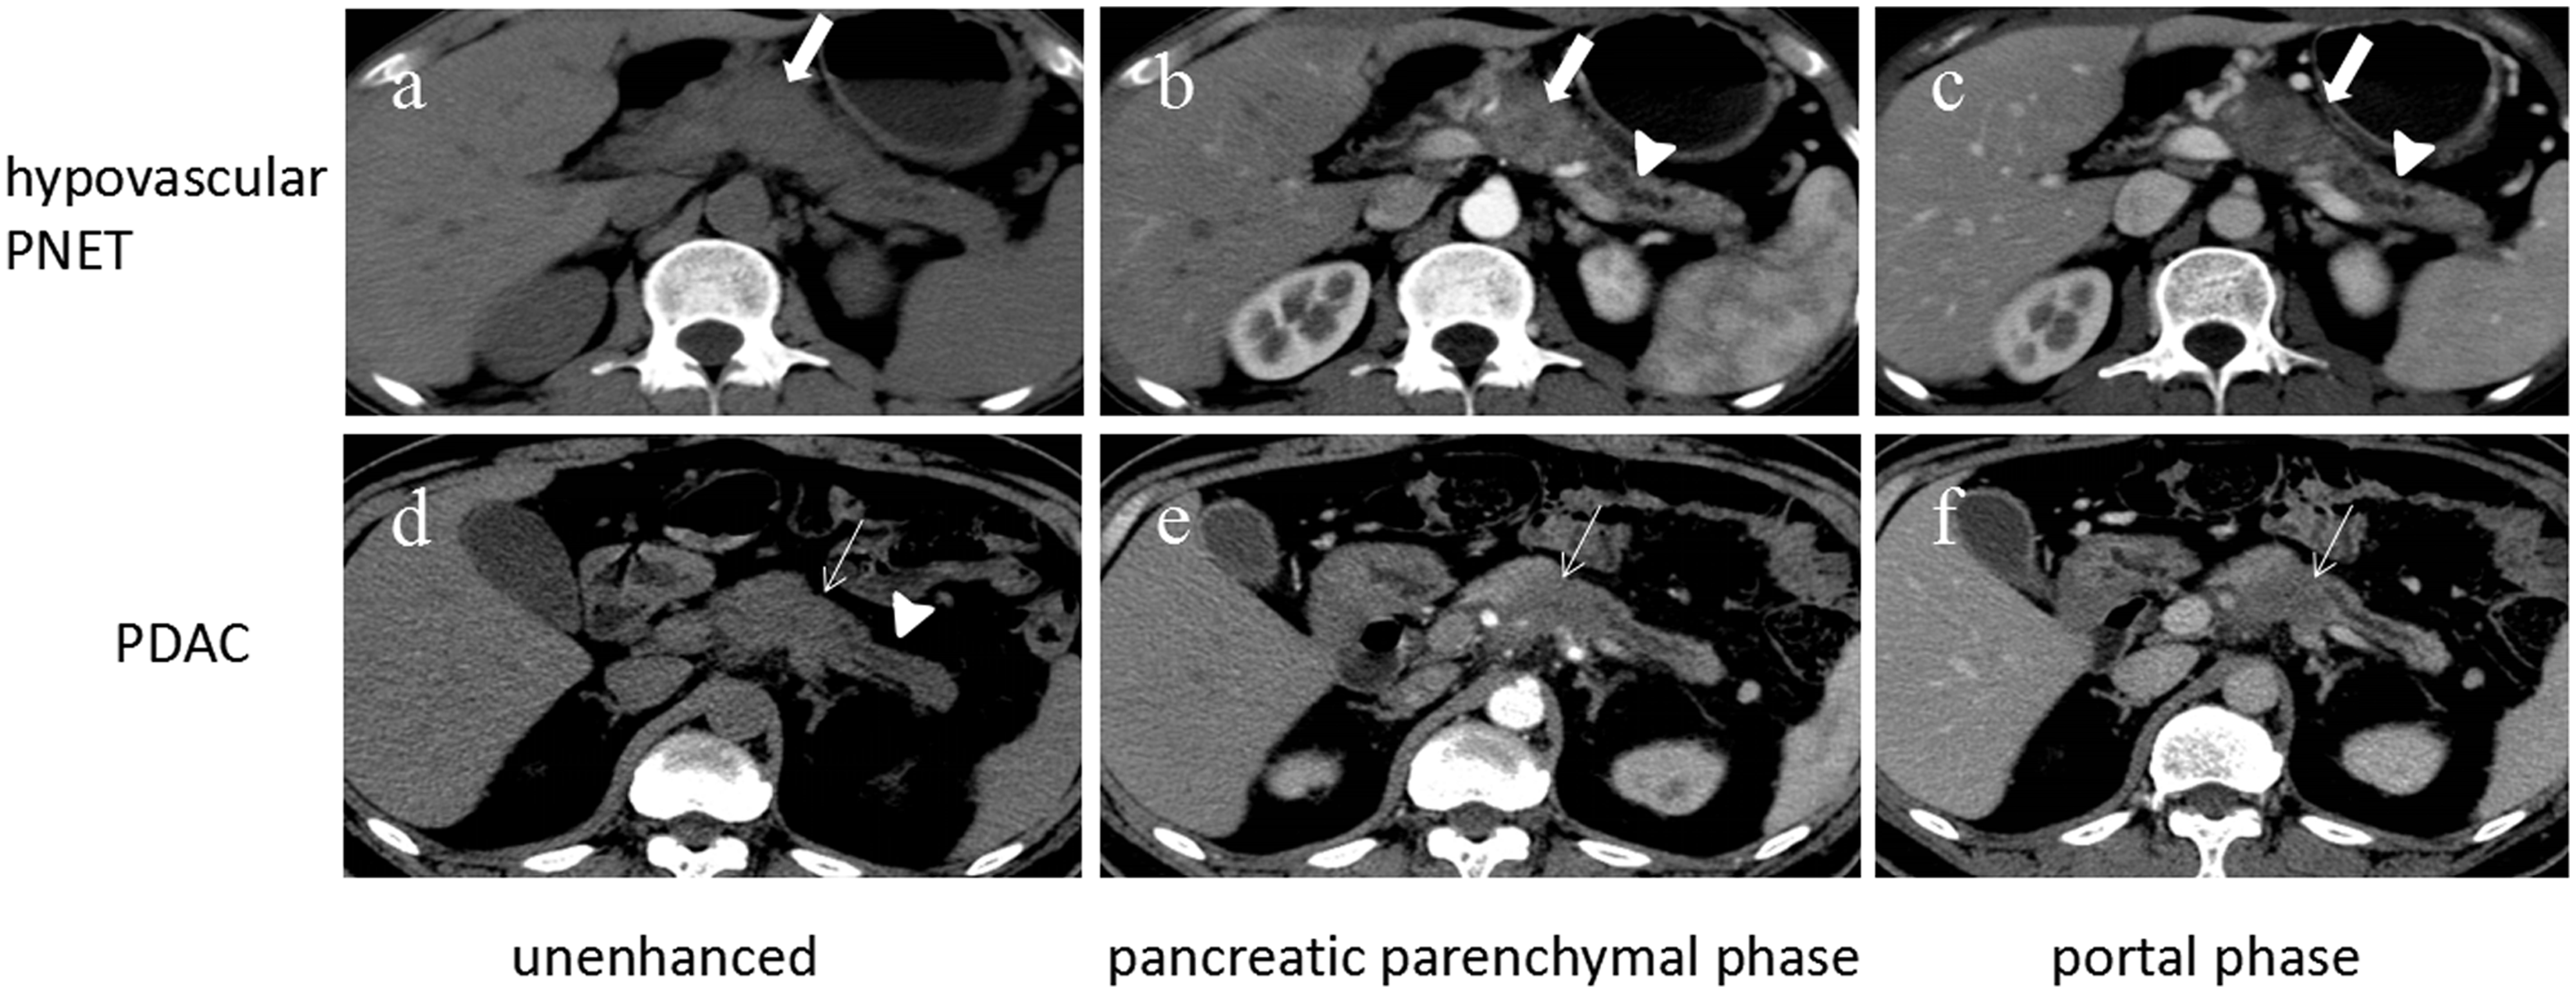
(a–c) CT images in a 59-year-old man with G3 pancreatic neuroendocrine tumor. On transverse unenhanced CT image (a), the lesion (thick arrow) shows ill-defined iso-density area in pancreatic body. On the pancreatic parenchymal phase (b) and portal phase (c) images, the lesion (thick arrow) shows hypo-enhancement compared to the adjacent pancreas, and with upstream dilatation of the main pancreatic duct (arrowhead), easily to be misdiagnosed as pancreatic ductal adenocarcinomas (PDAC). (d–f) CT images in a 65-year-old man with pancreatic adenocarcinoma. On transverse unenhanced CT image (d), the lesion (thin arrow) shows ill-defined iso-density area in pancreatic body, accompanied by distal parenchymal ductal dilatation and parenchymal atrophy (arrowhead). On pancreatic parenchymal phase (e) and portal phase (f) images, the lesion (thin arrow) shows hypo-enhancement compared to the adjacent pancreas.
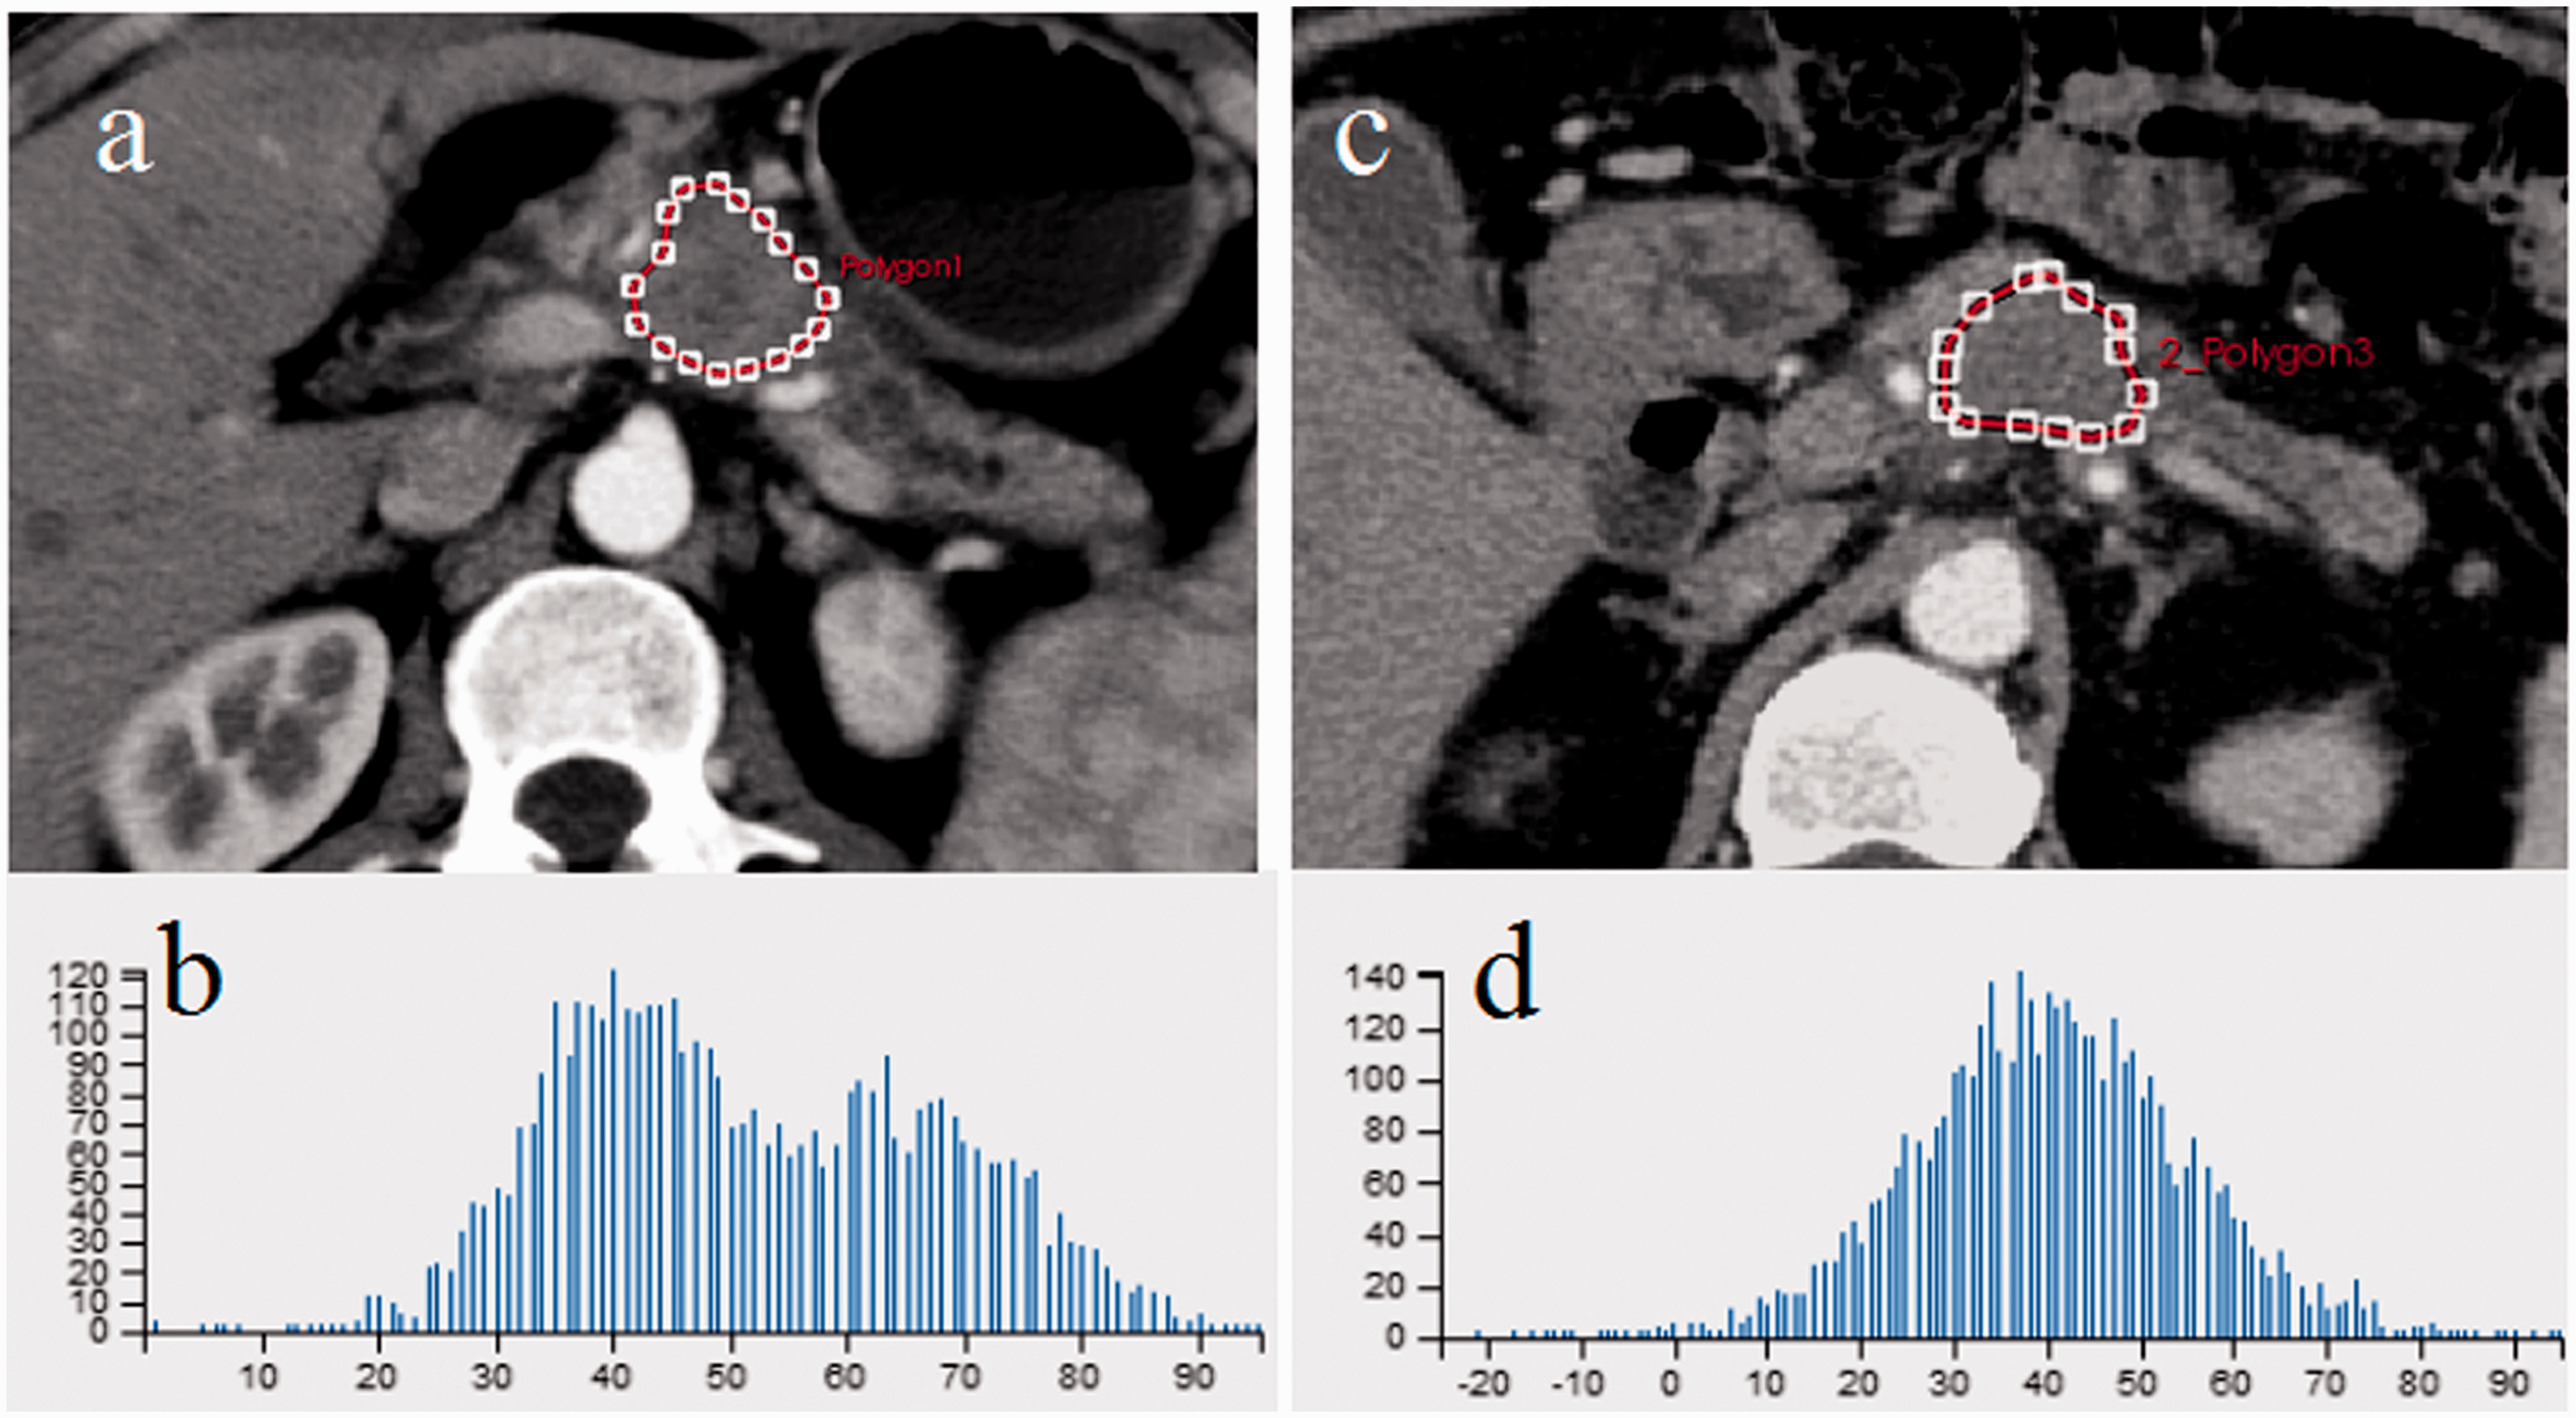
Texture features in hypovascular pancreatic neuroendocrine tumors (hypo-PNETs) and pancreatic ductal adenocarcinoma (PDAC) in two different patients. (a) 59-year-old man with G3 PNET. Axial pancreatic parenchymal phase CT shows a round mass (region of interest (ROI), the red dotted line) with upstream dilatation of the main pancreatic duct. (b) Histogram obtained from the ROI. The RMS was 54.02, Quantile50 was 53.09, and sumAverage was 0.53. (c) A 65-year-old man with PDAC. Axial pancreatic parenchymal phase CT shows a mass in pancreatic neck-body (ROI, the red dotted line). (d) Histogram obtained from the ROI. The root mean square (RMS) was 43.06, Quantile50 was 40.15, and sumAverage was 0.27.
Texture analysis
The CT texture features with statistical differences between hypo-PNETs and PDACs are summarized in Table 2 and Figure 4. Compared with PDACs, hypo-PNETs had higher MinIntensity, MedianIntensity, root mean square (RMS), mean of positive pixel (MPP), Quantile 5/10/25/50/75/90/95 (quantile of MPP), HaraEntropy, sumEntropy, sumAverage, GlcmTotalFrequency, ClusterProminence, ClusterShade, and VoxelValueSum, lower MeanDeviation, contrast, HaraVariance, differenceVariance, and AngularSecondMoment. We also analyzed the CT texture features based on portal phase images. Significant differences were observed in four parameters: “contrast;” Sum Average; Difference Variance; and Grey Level Nonuniformity.
Comparison of texture features between hypo-PNETs and PDACs based on pancreatic parenchymal phase CT images.
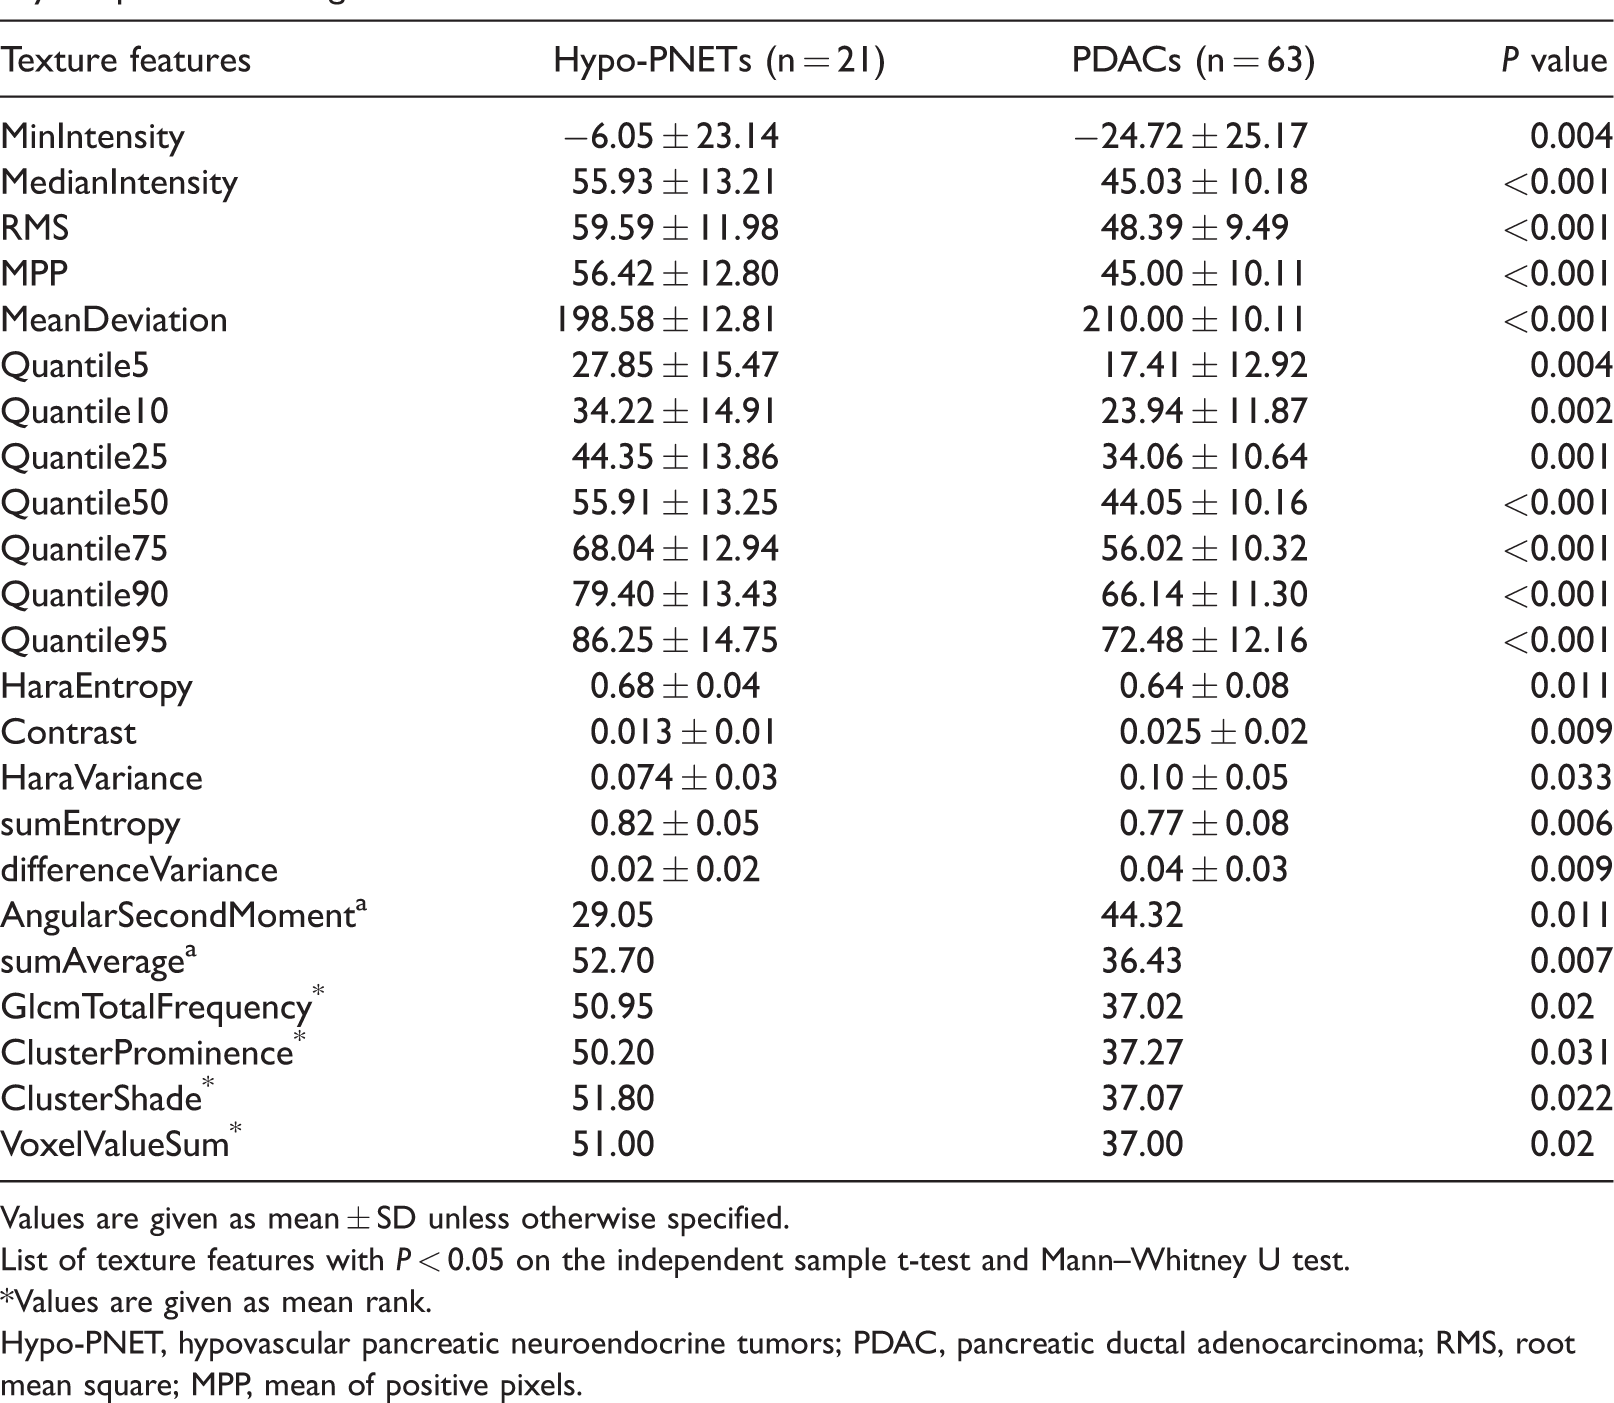
Values are given as mean ± SD unless otherwise specified.
List of texture features with P < 0.05 on the independent sample t-test and Mann–Whitney U test.
*Values are given as mean rank.
Hypo-PNET, hypovascular pancreatic neuroendocrine tumors; PDAC, pancreatic ductal adenocarcinoma; RMS, root mean square; MPP, mean of positive pixels.
Fifteen texture features in parenchymal phase images with P < 0.01 on univariate analysis were selected as variables for multivariate analysis. The results of multivariate analysis in differentiating hypo-PNETs and PDACs are shown in Table 3. Higher RMS (odds ratio [OR] = 0.498, 95% confidence interval [CI] = 0.324–0.766), higher Quantile50 (OR = 1.826, 95% CI = 1.211–2.752), and sumAverage (OR = 0.920, 95% CI = 0.862–0.982) were found to be independent predictors of hypo-PNETs. “Contrast” was the independent texture features in portal phase images (OR = 6.08, 95% CI = 1.17–31.66).
ROC analysis results (cut-off value, sensitivity, specificity, and AUC) of significant CT texture features in differentiating hypo-PNETs from PDACs on multivariate regression analysis.

ROC, receiver operating characteristics; Hypo-PNET, hypovascular pancreatic neuroendocrine tumors; PDAC, pancreatic ductal adenocarcinoma; RMS, root mean square; AUC, area under the curve; ICC, intraclass correlation coefficient; OR, odds ratio; CI, confidence interval.
ROC analysis
ROC analysis (Fig. 5) showed that the cut-off values for differentiating hypo-PNETs and PDACs were 51.10 for RMS, 52.57 for Quantile50, and 0.46 for sumAverage. The AUCs were 0.76 for RMS (sensitivity = 75%, specificity = 67%, ICC = 0.89), 0.73 for Quantile50 (sensitivity = 60%, specificity = 77%, ICC = 0.90), and 0.70 for sumAverage (sensitivity = 65%, specificity = 82%, ICC = 0.78) (Table 3). When we combined the three most discriminative parameters, the AUC was 0.85 with a sensitivity of 75% and a specificity of 85%. When age was added into the model, the AUC was 0.89 with a sensitivity of 88% and a specificity of 80%.
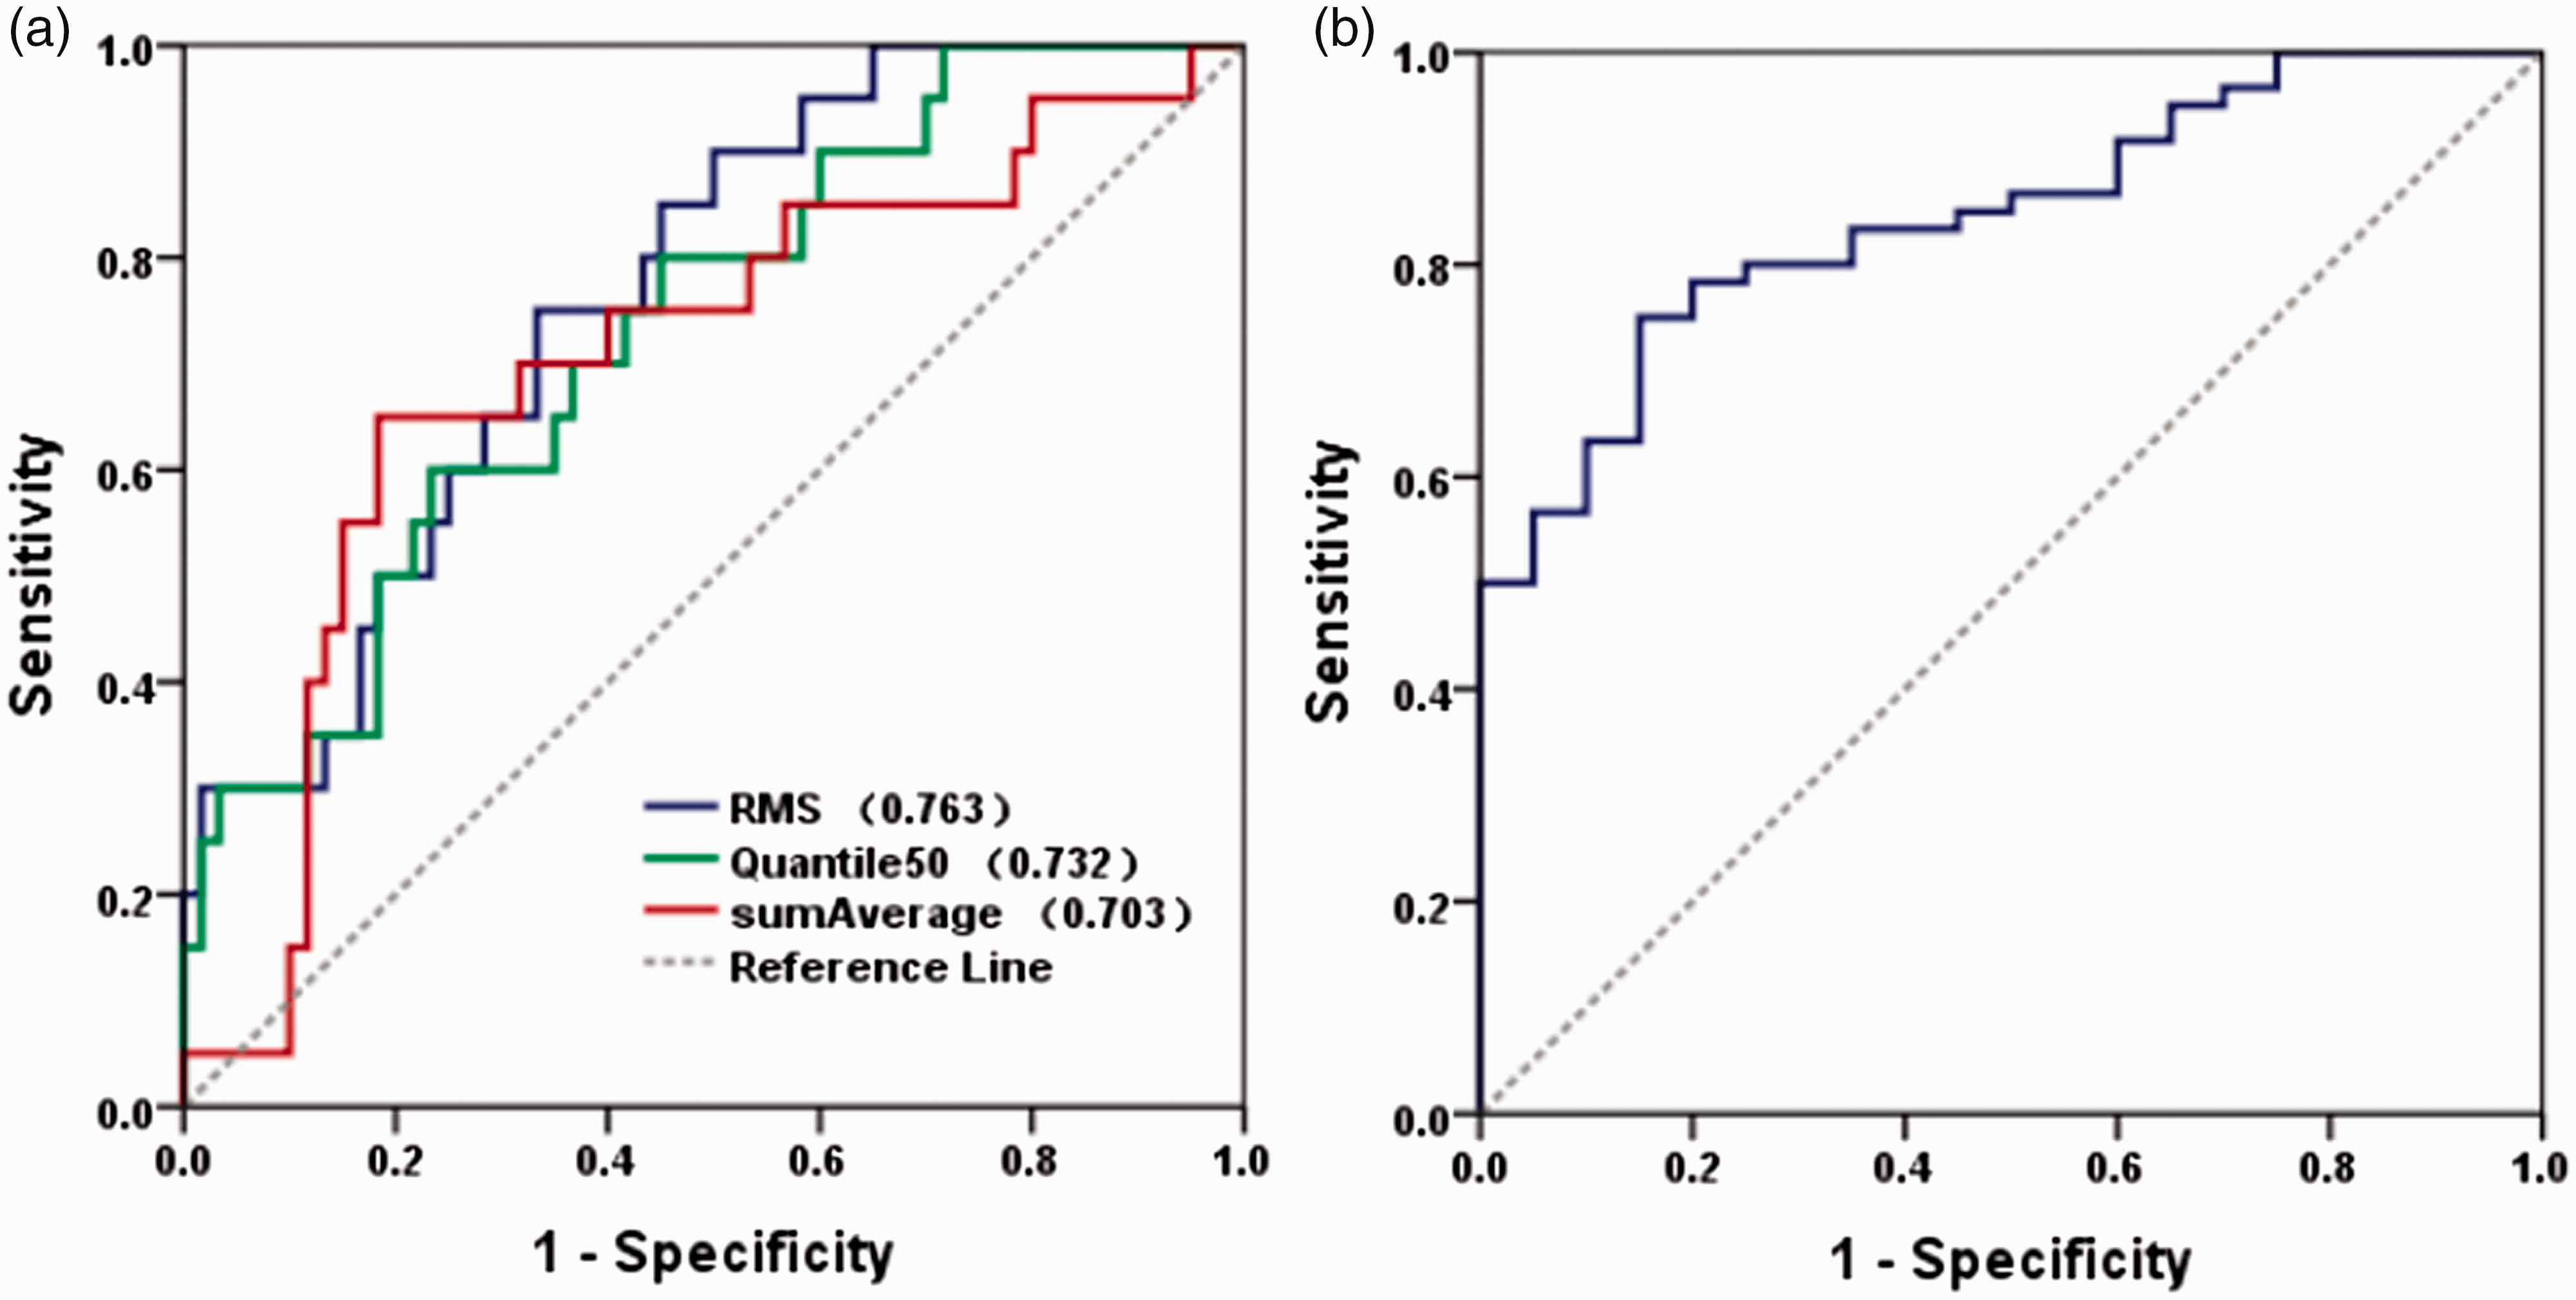
Receiver operating characteristic (ROC) curves of CT texture parameters in differentiating hypovascular pancreatic neuroendocrine tumors (hypo-PNETs) from PDAC. (a) ROC curves for texture parameters of RMS, Quantile50, and sumAverage. (b) ROC curve for predictive model combining RMS, Quantile50, and sumAverage.
The AUC was 0.79 for “contrast” (sensitivity = 83.0%, specificity = 77%) in portal phase images. The internal validation showed that the AUC of combined discriminative parameters was 0.83 with a sensitivity of 63% and a specificity of 92% (Fig. 6).
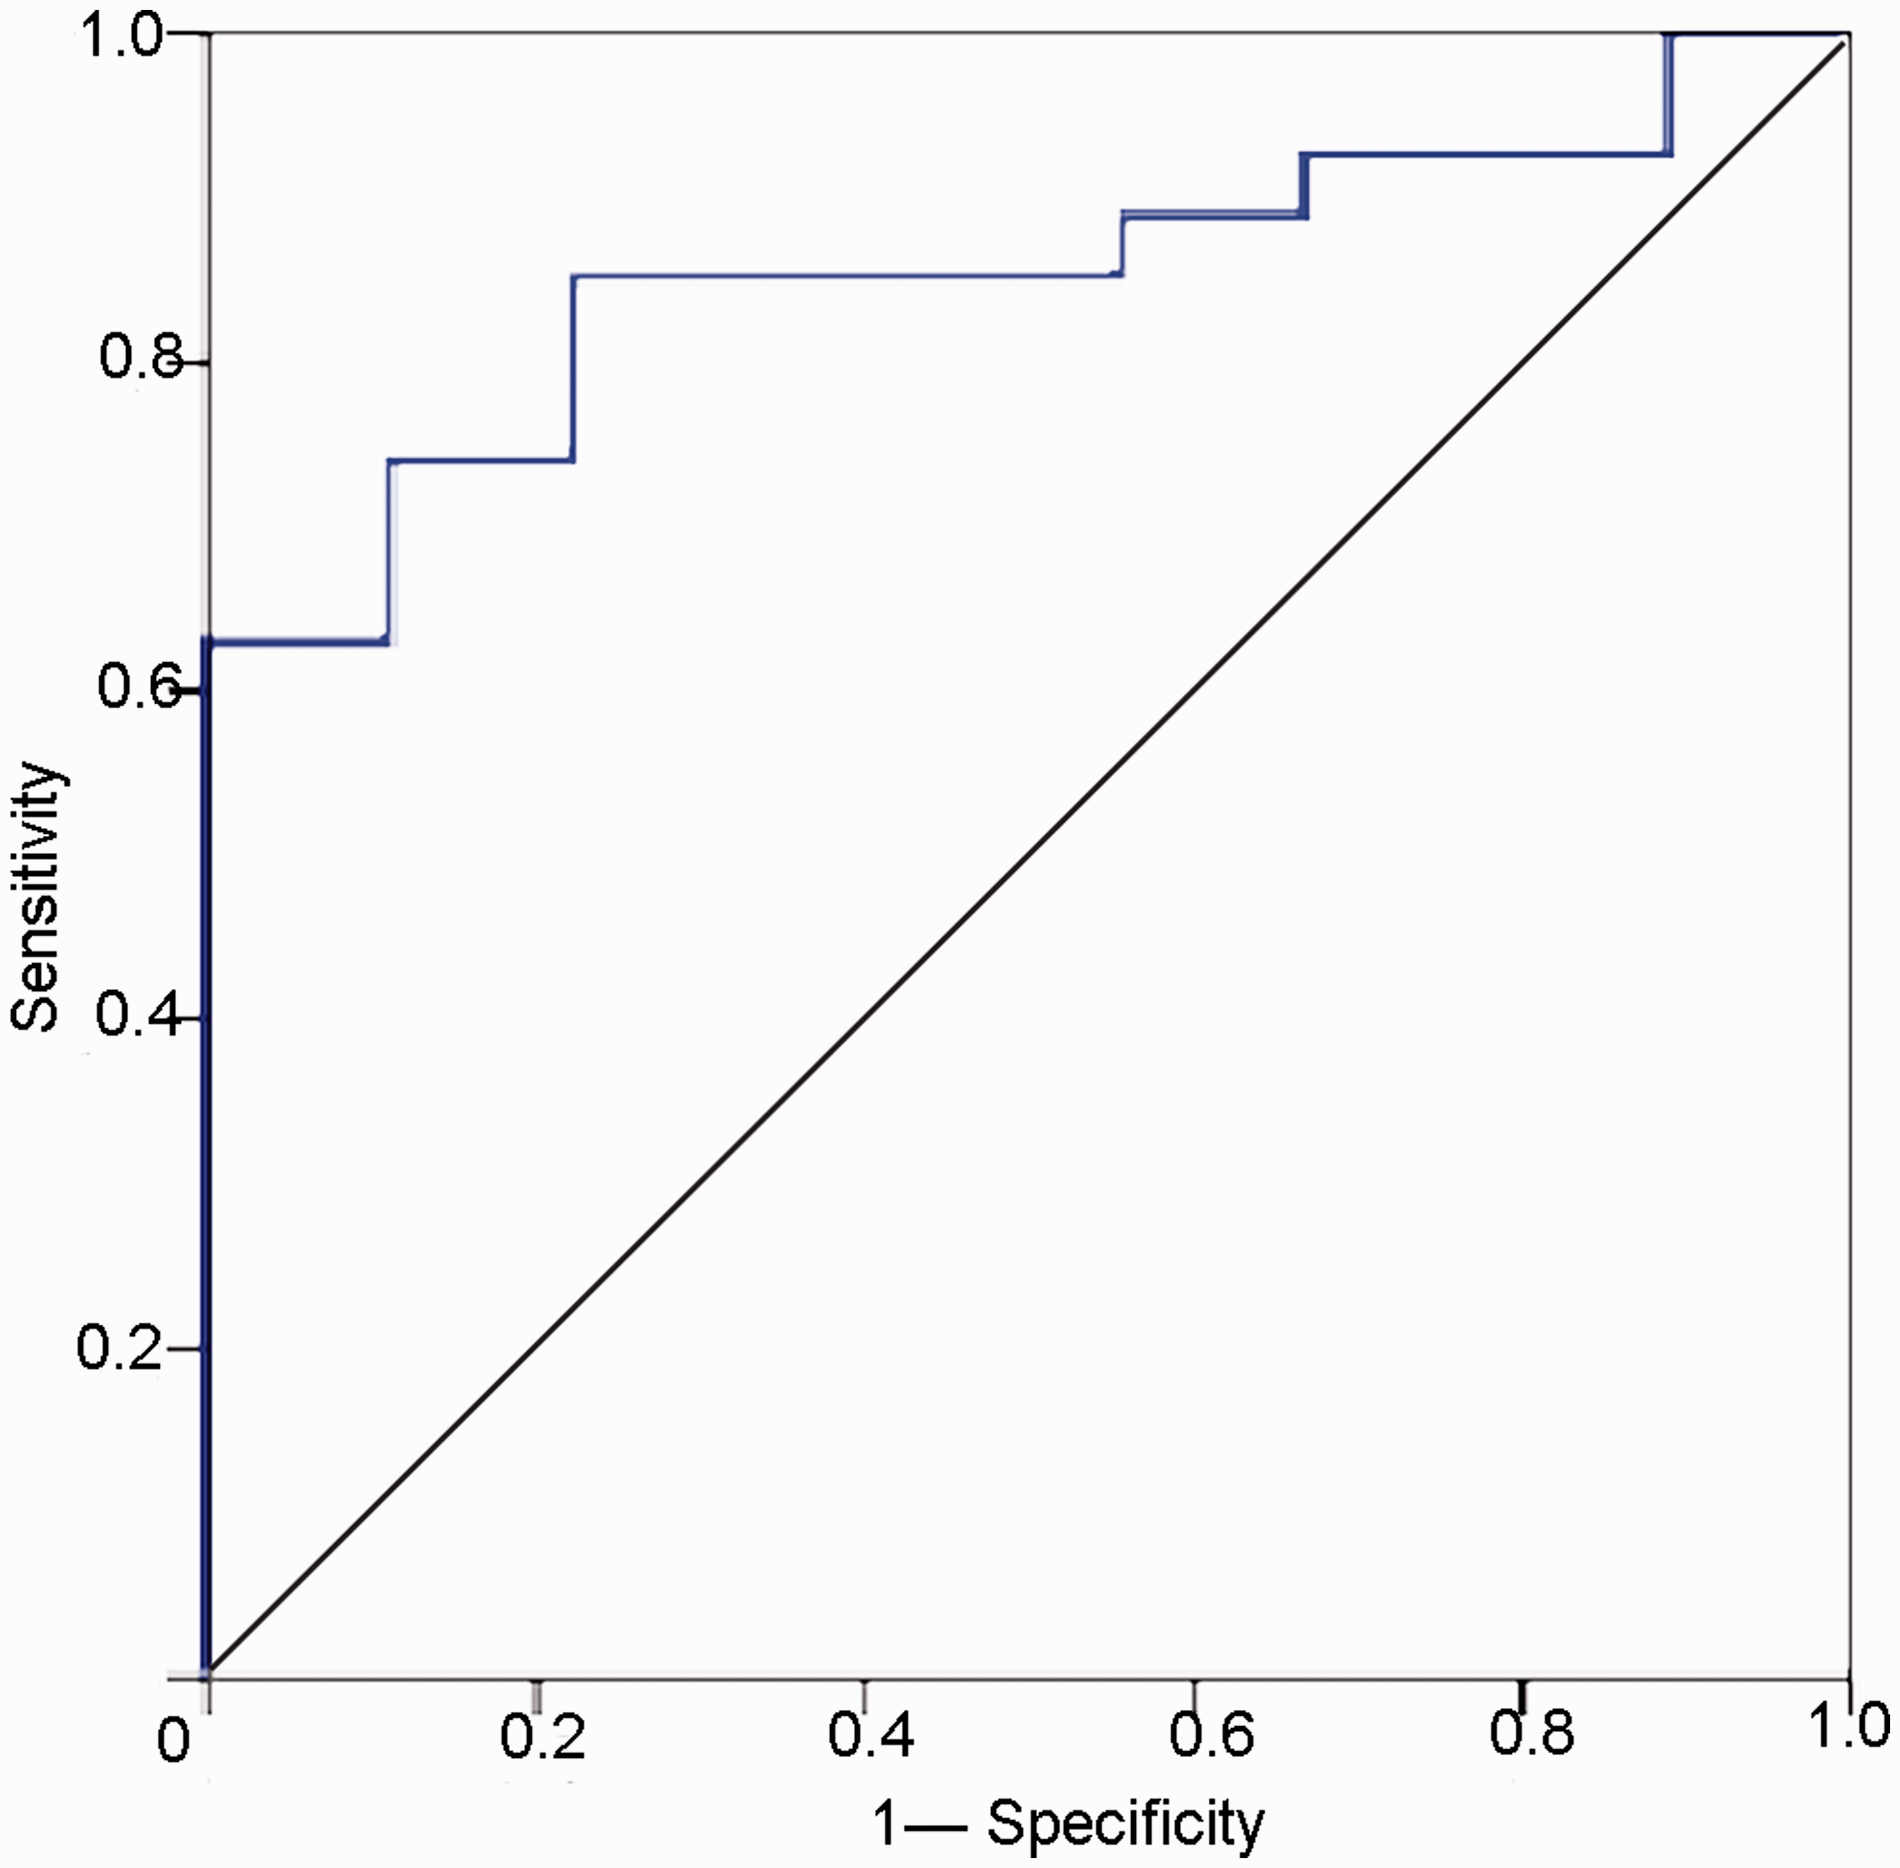
The internal validation of the combined texture features in differentiating hypovascular pancreatic neuroendocrine tumors (hypo-PNETs) from pancreatic ductal adenocarcinoma (PDAC). The model was validated in 9 hypo-PNETs and 25 PDACs from the same institution. The area under the curve (AUC) was 0.83 with a sensitivity of 63% and a specificity of 92%.
Discussion
Hypo-PNETs have some common imaging findings with PDACs. Routine CT and MRI examinations still find it challenging to identify the two entities. However, PNETs have different biological behaviors compared to PDACs, such as higher resectability and a better response to chemotherapy (8,11). Differentiation between hypo-PNETs and PDACs is important for treatment planning. Our data indicated that there were differences in texture features between hypo-PNETs and PDACs. Jeon et al. reported that the enhancement pattern of gradual portal hyperenhancement or persistent enhancement on delayed phase images was helpful to differentiate hypo-PNETs from PDACs (11); however, what hypo-PNETs defined referred to hypo-enhancement only in the arterial phase, which was different from our study. In another study, duct dilatation was an independent differentiator of atypical PNET from PDAC (16). However, diagnostic performance was poor.
TA provides an objective, quantitative assessment of tumor heterogeneity by analyzing the distribution and relation of pixel or voxel gray levels in the image (13). Early evidence suggests that TA has the potential to augment diagnosis and characterization as well as tumor staging and therapy response assessment in oncologic practice (17), such as differentiating benign from malignant lesions (14,18–22), evaluating the response to the treatment, and survival analysis (23–26).
In our study, texture parameters worked well in differentiating hypo-PNETs from PDACs, especially for the RMS, Quantile50, and sumAverage. The three parameters were significant higher in hypo-PNETs than those of PDACs. When the three parameters were combined, the AUC was 0.85 with acceptable sensitivity and specificity. This may be due to the relatively higher cellularity and a lower fibrous stroma in hypo-PNETs compared with PDACs. The typical histopathological feature of PDAC is the presence of abundant fibrous stroma in the tumor, which is known as desmoplastic reaction (11,27). Moreover, peritumoral fibroblast in PDAC overexpressed protein acidic and cysteine. Shindo et al. (21) and Guo et al. (14) reported that texture parameters skewness, kurtosis, entropy, and uniformity in PDACs might be related to the abundant fibrosis or mucin within the tumor. Li et al. (15) also reported that texture parameters 5th percentile and 5th + skewness helped to identify atypical PNET from PDAC. Some similar findings have already been reported (5,28–30). Hanania et al. (31) used TA to evaluate malignant potential of intraductal papillary mucinous neoplasms (IPMNs) and TA performed better results in identifying lesions with high-grade dysplasia than the imaging findings based on the Fukuoka criteria.
The valuable texture features identified in our study reflect the intensity levels. Hypo-PNETs showed relative higher intensity than PDACs, which indicated that the enhancement of hypo-PNETs was higher than that of PDACs. Our previous study also demonstrated that PNEC showed stronger enhancement than PDAC in MRI (10). The texture features were consistent with the routine imaging findings. Enhancement of PNET is correlated with microvascular density (MVD) and tumor differentiation (6,32,33). D’Assignies et al. (33) found that lower intratumoral blood flow was associated with lower microvascular density and higher-grade tumors by using perfusion CT. In our study, the data showed that the majority of hypo-PNETs were high-grade tumors, which were consistent with the previous reports. Choi et al. (5) found that CT texture parameters (sphericity, skewness, and kurtosis) could be used to predict grade 2/3 PNET. Moreover, the diagnostic performance of the CT texture analysis was superior to that of the CT findings. Our data further indicated that the combined texture features had great potential in differentiating hypo-PNETs and PDAC, which was confirmed by our internal validation.
Our study has several limitations. First, selection bias cannot be avoided due to the nature of retrospective research. Second, only pathologically proven PDAC were included in our study which may be another cause of bias. Third, the samples size of hypo-PNETs is small because PNETs are rare pancreatic lesions and further studies with a larger sample size are necessary to verify our results. Fourth, an external validation test is not performed because hypo-PNETs are rare tumors and it is hard to collect enough patients for external validation in a short time period.
In conclusion, there are differences in CT texture parameters, such as RMS, Quantile50, and sumAverage, between hypo-PNETs and PDACs. The combined texture features showed acceptable diagnostic performance in differentiating hypo-PNETs from PDACs. Texture analysis can aid in the differentiation between hypo-PNETs and PDACs.
Footnotes
Declaration of conflicting interests
The author(s) declared no potential conflicts of interest with respect to the research, authorship, and/or publication of this article.
Funding
The author(s) disclosed receipt of the following financial support for the research, authorship, and/or publication of this article: This study was supported by the National Natural Science Foundation of China (No. 81771899) and the Key Program of Research and Development of Jiangsu Province (No. BE2017772).