
Abstract
Background
Solid pseudopapillary neoplasm of the pancreas (SPNs) usually showed slight enhancement in contrast-enhanced computed tomography (CE-CT), which is similar to hypovascular pancreatic neuroendocrine tumors (hypo-PNETs).
Purpose
To show the values of CT imaging features in the differentiation between hypo-PNETs and SPNs.
Material and Methods
Forty-four patients with histologically confirmed SPNs and 24 patients with hypo-PNETs who underwent preoperative dynamic CE-CT were included. Two radiologists reviewed CT imaging findings and clinical features. Multivariate logistic regression analysis was performed to identify relevant features to differentiate SPNs and hypo-PNETs. Receiver operating characteristic (ROC) curve was used to evaluate the diagnostic performance.
Results
SPNs usually occurred in young women compared with hypo-PNETs (mean age = 34.5 years vs. 49.08 years, P < 0.01). SPNs usually showed an oval shape, “floating cloud” sign, calcification, and lower frequencies of metastases compared with hypo-PNETs (P < 0.05 for all). The combined features (lower age, “floating cloud” sign, and calcification) showed acceptable diagnostic performance (area under the curve [AUC] = 0.865 with 100% sensitivity and 63.6% specificity) for differentiating SPNs from hypo-PNETs.
Conclusion
“Floating cloud” sign, lower age, and calcification have great potential in differentiating SPNs from hypo-PNETs.
Keywords
Introduction
Solid pseudopapillary neoplasm of the pancreas (SPNs) is a rare, low-grade malignant pancreatic tumor which usually occurs in young women. Most SPNs are relatively indolent tumors which can get a perfect prognosis with complete surgical resection. However, 10–15% of SPNs are malignant (1,2). SPNs typically show a well-circumscribed mass with a pseudocapsule which is composed of compressed pancreatic tissue and fibrous change. They frequently show peripheral calcification, extensive hemorrhage, and necrotic changes (3,4).
Pancreatic neuroendocrine tumors (PNETs) are also rare tumors of the pancreas which account for 2–10% of all pancreatic neoplasm. PNETs are typically characterized by a well-circumscribed hypervascular mass. However, 30% of PNETs may not show hyper-enhancement which may be difficult to differentiate from other hypovascular pancreatic tumors (5–7). In addition, cystic components are not uncommon in PNETs, especially in hypovascular pancreatic neuroendocrine carcinoma (8). Solid-cystic SPTs may mimic pancreatic ductal adenocarcinomas or neuroendocrine carcinomas (4). Some PNETs also contain pseudopapillary areas. In addition, neuroendocrine differentiation also occurs in SPNs (9). Those histological or imaging overlaps leads to difficulties in differentiating SPTs and hypo-PNETs (10). However, the treatment strategies and prognosis are different for those two lesions. It would have great clinical values to differentiate hypo-PNETs from SPNs. Therefore, the purpose of our study was to determine the values of computed tomography (CT) imaging features in the differentiation between hypo-PNETs and SPNs.
Material and Methods
Patients
A total of 108 patients with pathologically diagnosed PNETs were identified between January 2011 and December 2017. Thirteen patients were excluded due to lack of preoperative dynamic contrast-enhanced CT (CE-CT) examination and 71 patients were excluded because the lesions showed hyper-enhancement in the arterial phase (Fig. 1).
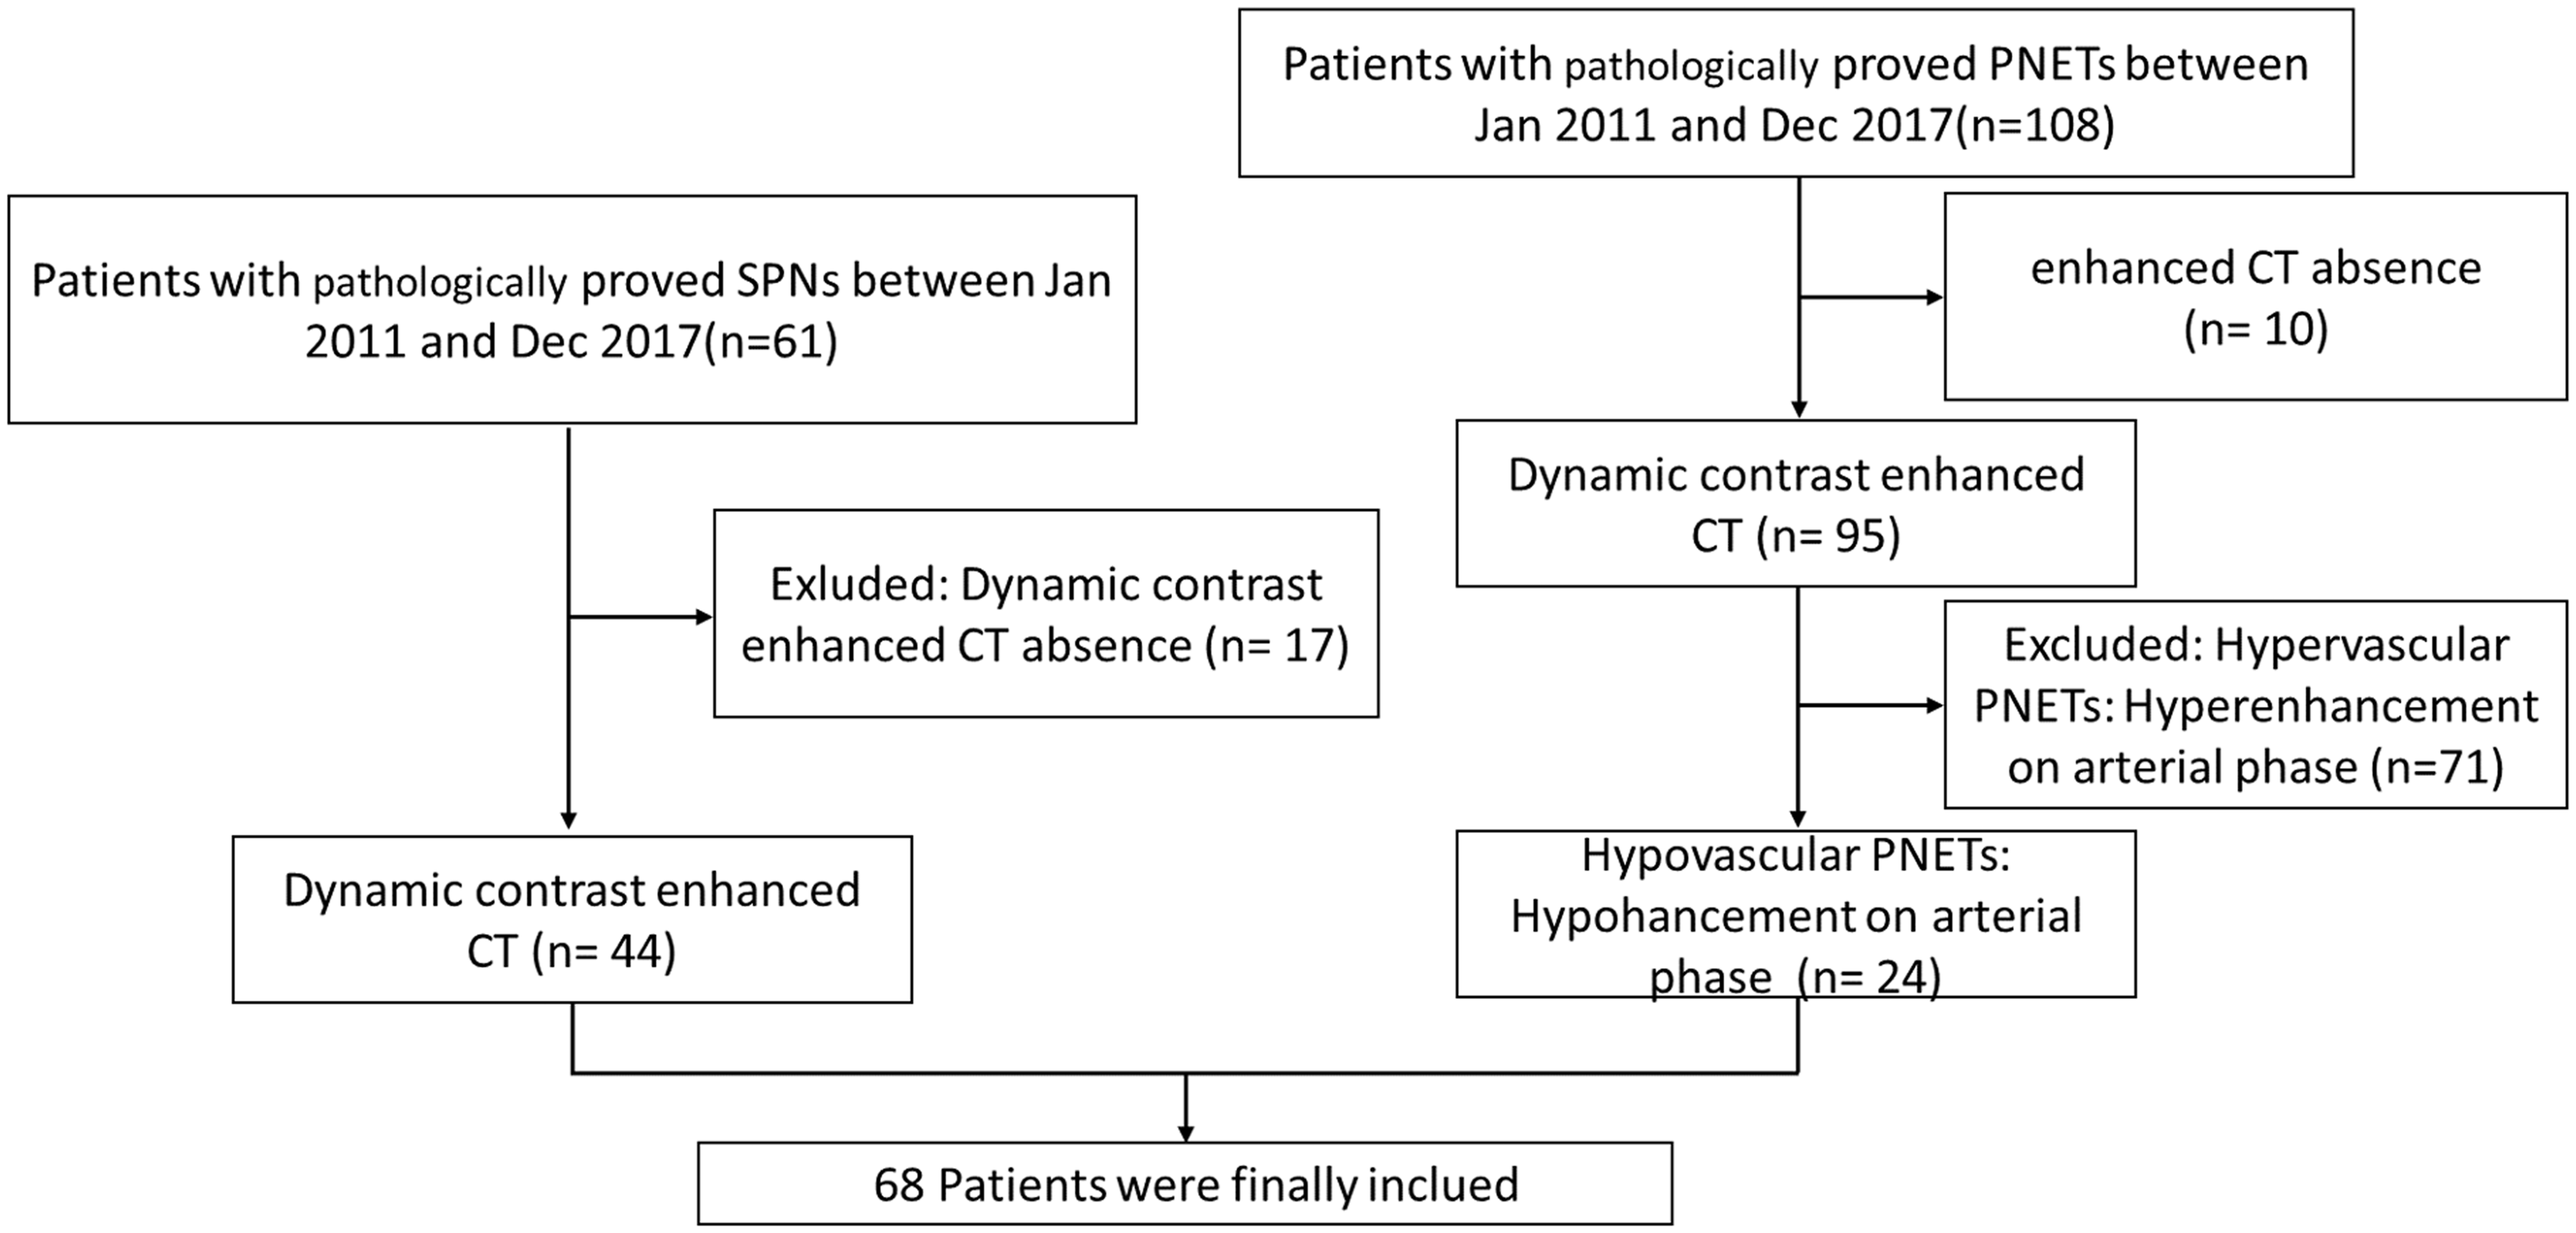
Flow chart shows the process for patient selection. hypo-PNETs, hypovascular pancreatic neuroendocrine tumors; SPNs, solid pseudopapillary neoplasm of the pancreas.
We also identified 61 patients with pathologically diagnosed SPNs between January 2011 and December 2017. Seven patients without preoperative dynamic CE-CT examination were excluded (Fig. 1). Ten patients were excluded because the lesions showed predominant cystic pattern (cystic components > 90%). Finally, a total of 68 patients (44 cases of SPNs and 24 cases of hypo-PNETs) were included in this study.
CT imaging
The following CT scanners were used in our study: Brilliance 64, Philips Medical Systems, Netherlands; Somatom Definition, Siemens AG, Medical Solutions, Forchheim, Germany; Optima670, GE Healthcare, Japan. We obtained the unenhanced, arterial, portal, and delayed phase images. The imaging parameters were as follow: 1–2 mm thickness; tube rotation speed = 0.75 s; tube voltage = 120 kVp; automatic tube current modulation = 160–251 mA. For CE-CT scan, patients received 2 mL/kg body weight of contrast media (Visipaque, 320 mg/mL, GE Healthcare) at a rate of 3.0 mL/s followed by 40 mL saline solution through the elbow vein. The arterial phase was obtained with a delay time of 35–40 s, portal venous phase with 75–80 s, and delayed phase with 175–180 s.
Image analysis
All variables of CT imaging were independently reviewed by two abdominal radiologists with three and ten years of experience in abdominal radiology on a picture archiving communication system (PACS). The radiologists were blinded to the final histopathological information. If there was inconsistency on the categorical variables, consensus was achieved through discussion or referral to a third radiologist with > 20 years of experience in abdominal radiology. Imaging analysis included the following features: location (head-neck or body-tail); size; tumor margin (well-defined or ill-defined); shape (oval or round, irregular); “floating cloud” sign; components; tumor attenuation; calcification; pancreatic duct dilatation; and metastasis (distant or lymph nodes metastasis, local invasion). The hypo-PNETs were defined as hypo-density in the arterial phase compared with the normal pancreatic parenchyma. Tumor components were divided into predominant solid (solid components > 90%) and solid-cystic (solid components 10–90%). If there were enhanced solid components within the unenhanced cystic components, we called this feature the “floating cloud” sign (Fig. 2). Pancreatic duct dilatation was defined as a duct diameter > 3 mm. Bile duct dilatation was defined as the extrahepatic bile duct > 8 mm and the intrahepatic bile duct > 2 mm. Region of interest (ROI) was manually drawn on the tumor and normal pancreatic parenchyma to determine the CT attenuation. The location and size of the ROI were also determined by consensus of two radiologists. We calculated the mean CT value of the tumor and the normal pancreatic parenchyma attenuation which were measured by two radiologists. CT valueN-T = tumor attenuation (HU) of the normal pancreatic parenchyma minus the tumor attenuation (HU) of the lesion in arterial phase.
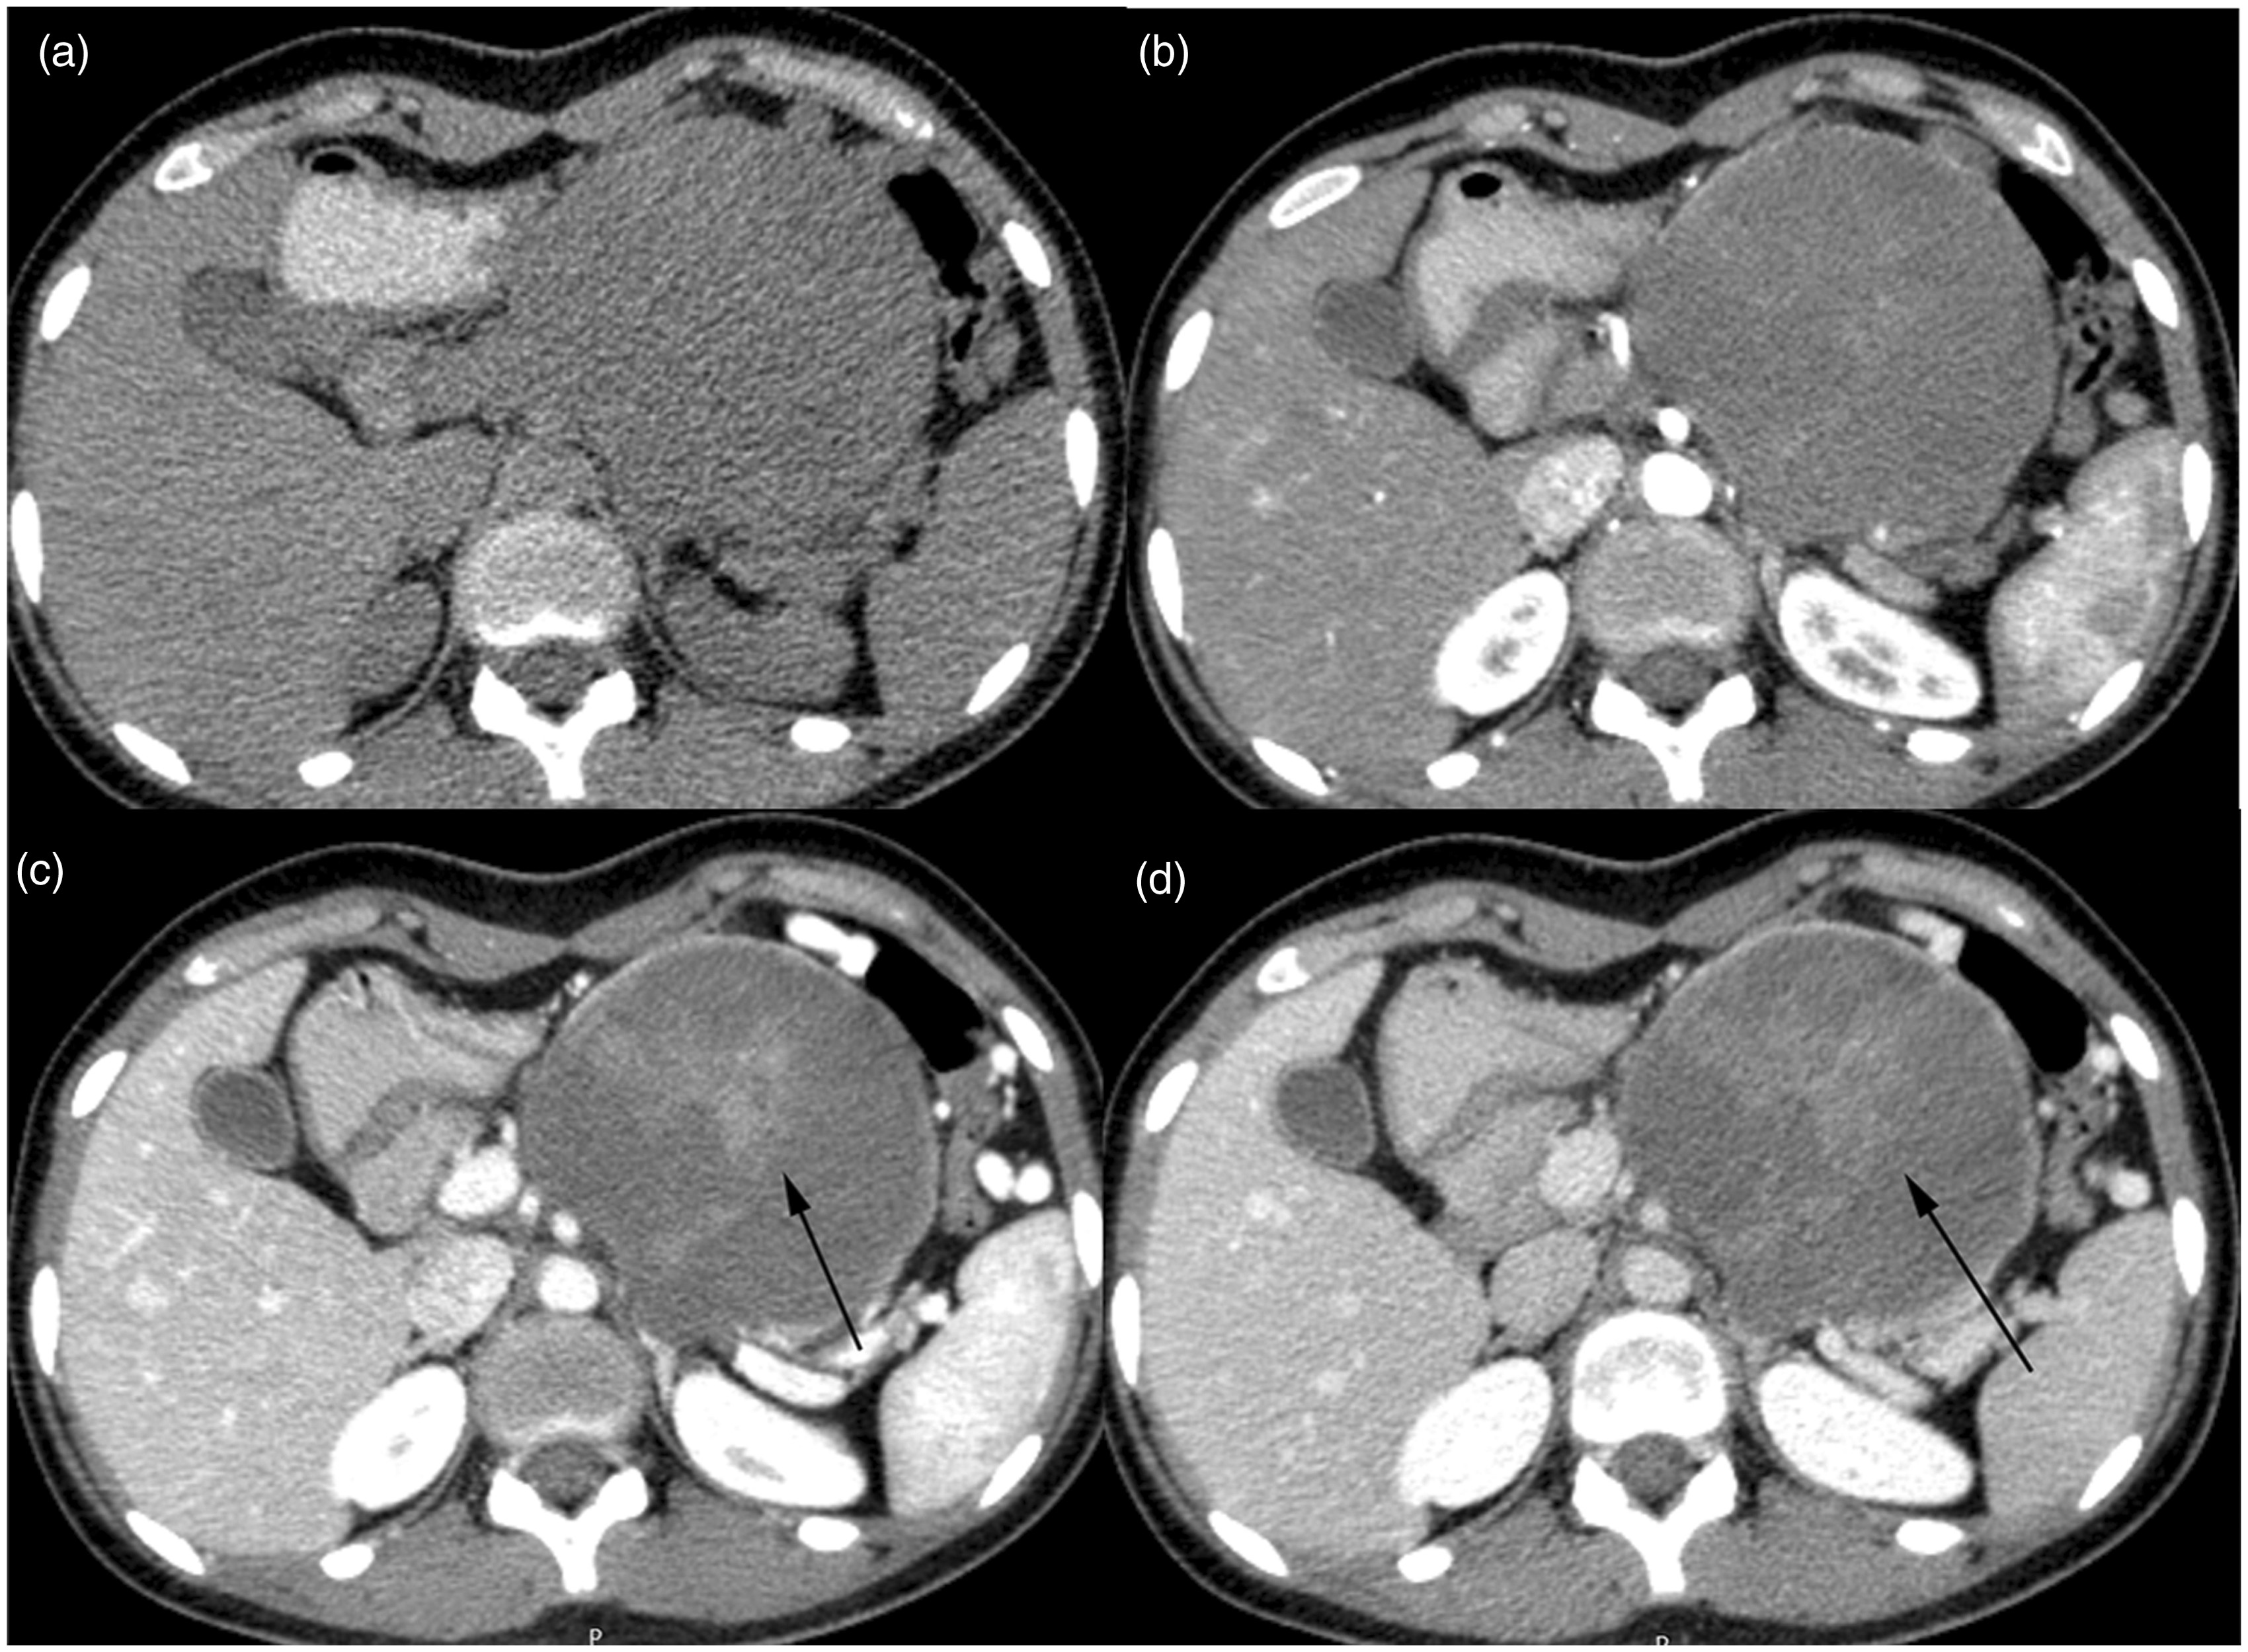
A 15-year-old girl with a 9.5-cm SPNs. (a) Axial unenhanced CT image demonstrates a hypoattenuation mass with well-defined margin in the body and tail of pancreas. Arterial phase (b), venous phase (c), and delayed phase (d) axial images show solid-cystic components. There are enhanced patchy-like structures (black arrow) within mass which defined as the “floating cloud” sign.
Histopathologic analyses
All tumors were reviewed according to the 2010 (SPNs) or 2017 (PNETs) World Health Organization classification of tumors. The diagnosis of tumors was based on the histopathologic examination as well as immunohistochemical staining. Each specimen was reviewed again by a different pathologist.
Statistical analyses
All statistical analyses were performed with commercially available software (SPSS 16.0 Chicago, IL, USA). Quantitative data with normal distribution were presented as means ± standard deviation and categorical data were expressed as number (percentage). The characteristics of the lesions were compared by using the independent samples t-test, or Chi-square or Fisher’s exact test. Multivariate logistic regression was used to determine the independent imaging features in the differentiation between SPNs and hypo-PNETs. Receiver operating characteristic (ROC) curve was used to evaluate the diagnostic performance of imaging features alone or in combination. The inter-obsever agreement was evaluated by calculating к coefficient. We define к value for level of agreement as follows: < 0.2 = slight agreement; 0.21–0.40 = fair agreement; 0.41–0.60 = moderate agreement; 0.61–0.80 = substantial agreement; > 0.80 = excellent agreement. P < 0.05 was considered to indicate a significance difference.
Results
Qualitative analysis
The SPNs usually occurred in women compared with hypo-PNETs (79.5% vs. 50%, P < 0.05). SPNs commonly occurred in pancreatic body-tail compared with hypo-PNETs (59% vs. 50%), but there was no significant difference (Table 1).
Demographic characteristics of patients with SPNs and hypo-PNETs.
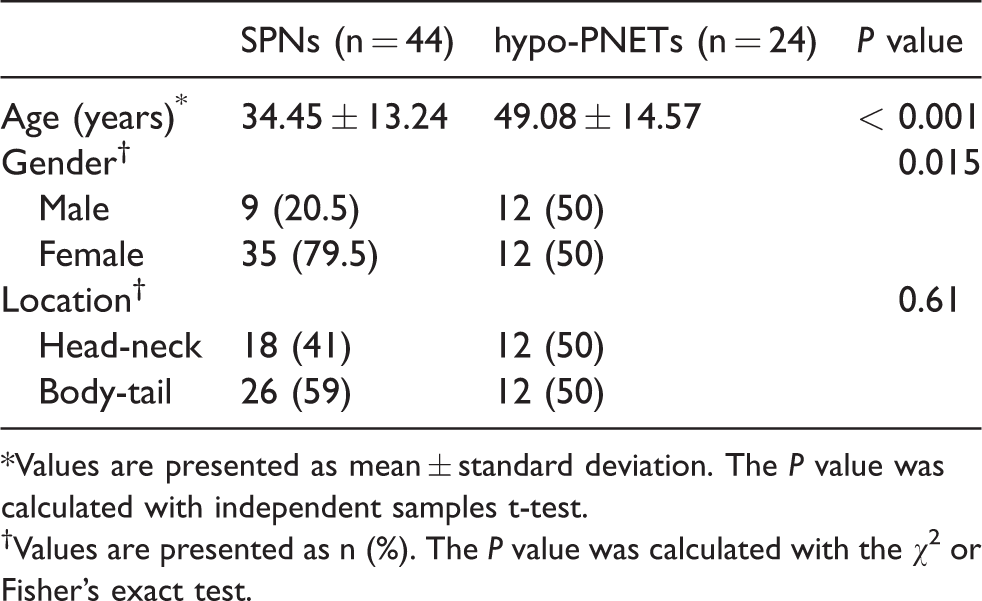
*Values are presented as mean ± standard deviation. The P value was calculated with independent samples t-test.
†Values are presented as n (%). The P value was calculated with the χ2 or Fisher’s exact test.
Qualitative CT findings between SPNs and hypo-PNETs are summarized in Table 2, Fig, 3 and Fig. 4. An oval or round shape and the “floating cloud” sign (Fig. 2) was more common in SPNs than hypo-PNETs (97.2% vs. 21.8%, P < 0.05; 40.9% vs. 12.5%, P = 0.026, respectively). Similar results were observed in calcification (P = 0.028). Metastases were more common in hypo-PNETs compared with SPNs (P = 0.049). No significant differences were found in the solid or cystic components, margins, and pancreatic or bile duct dilatation between the two groups.
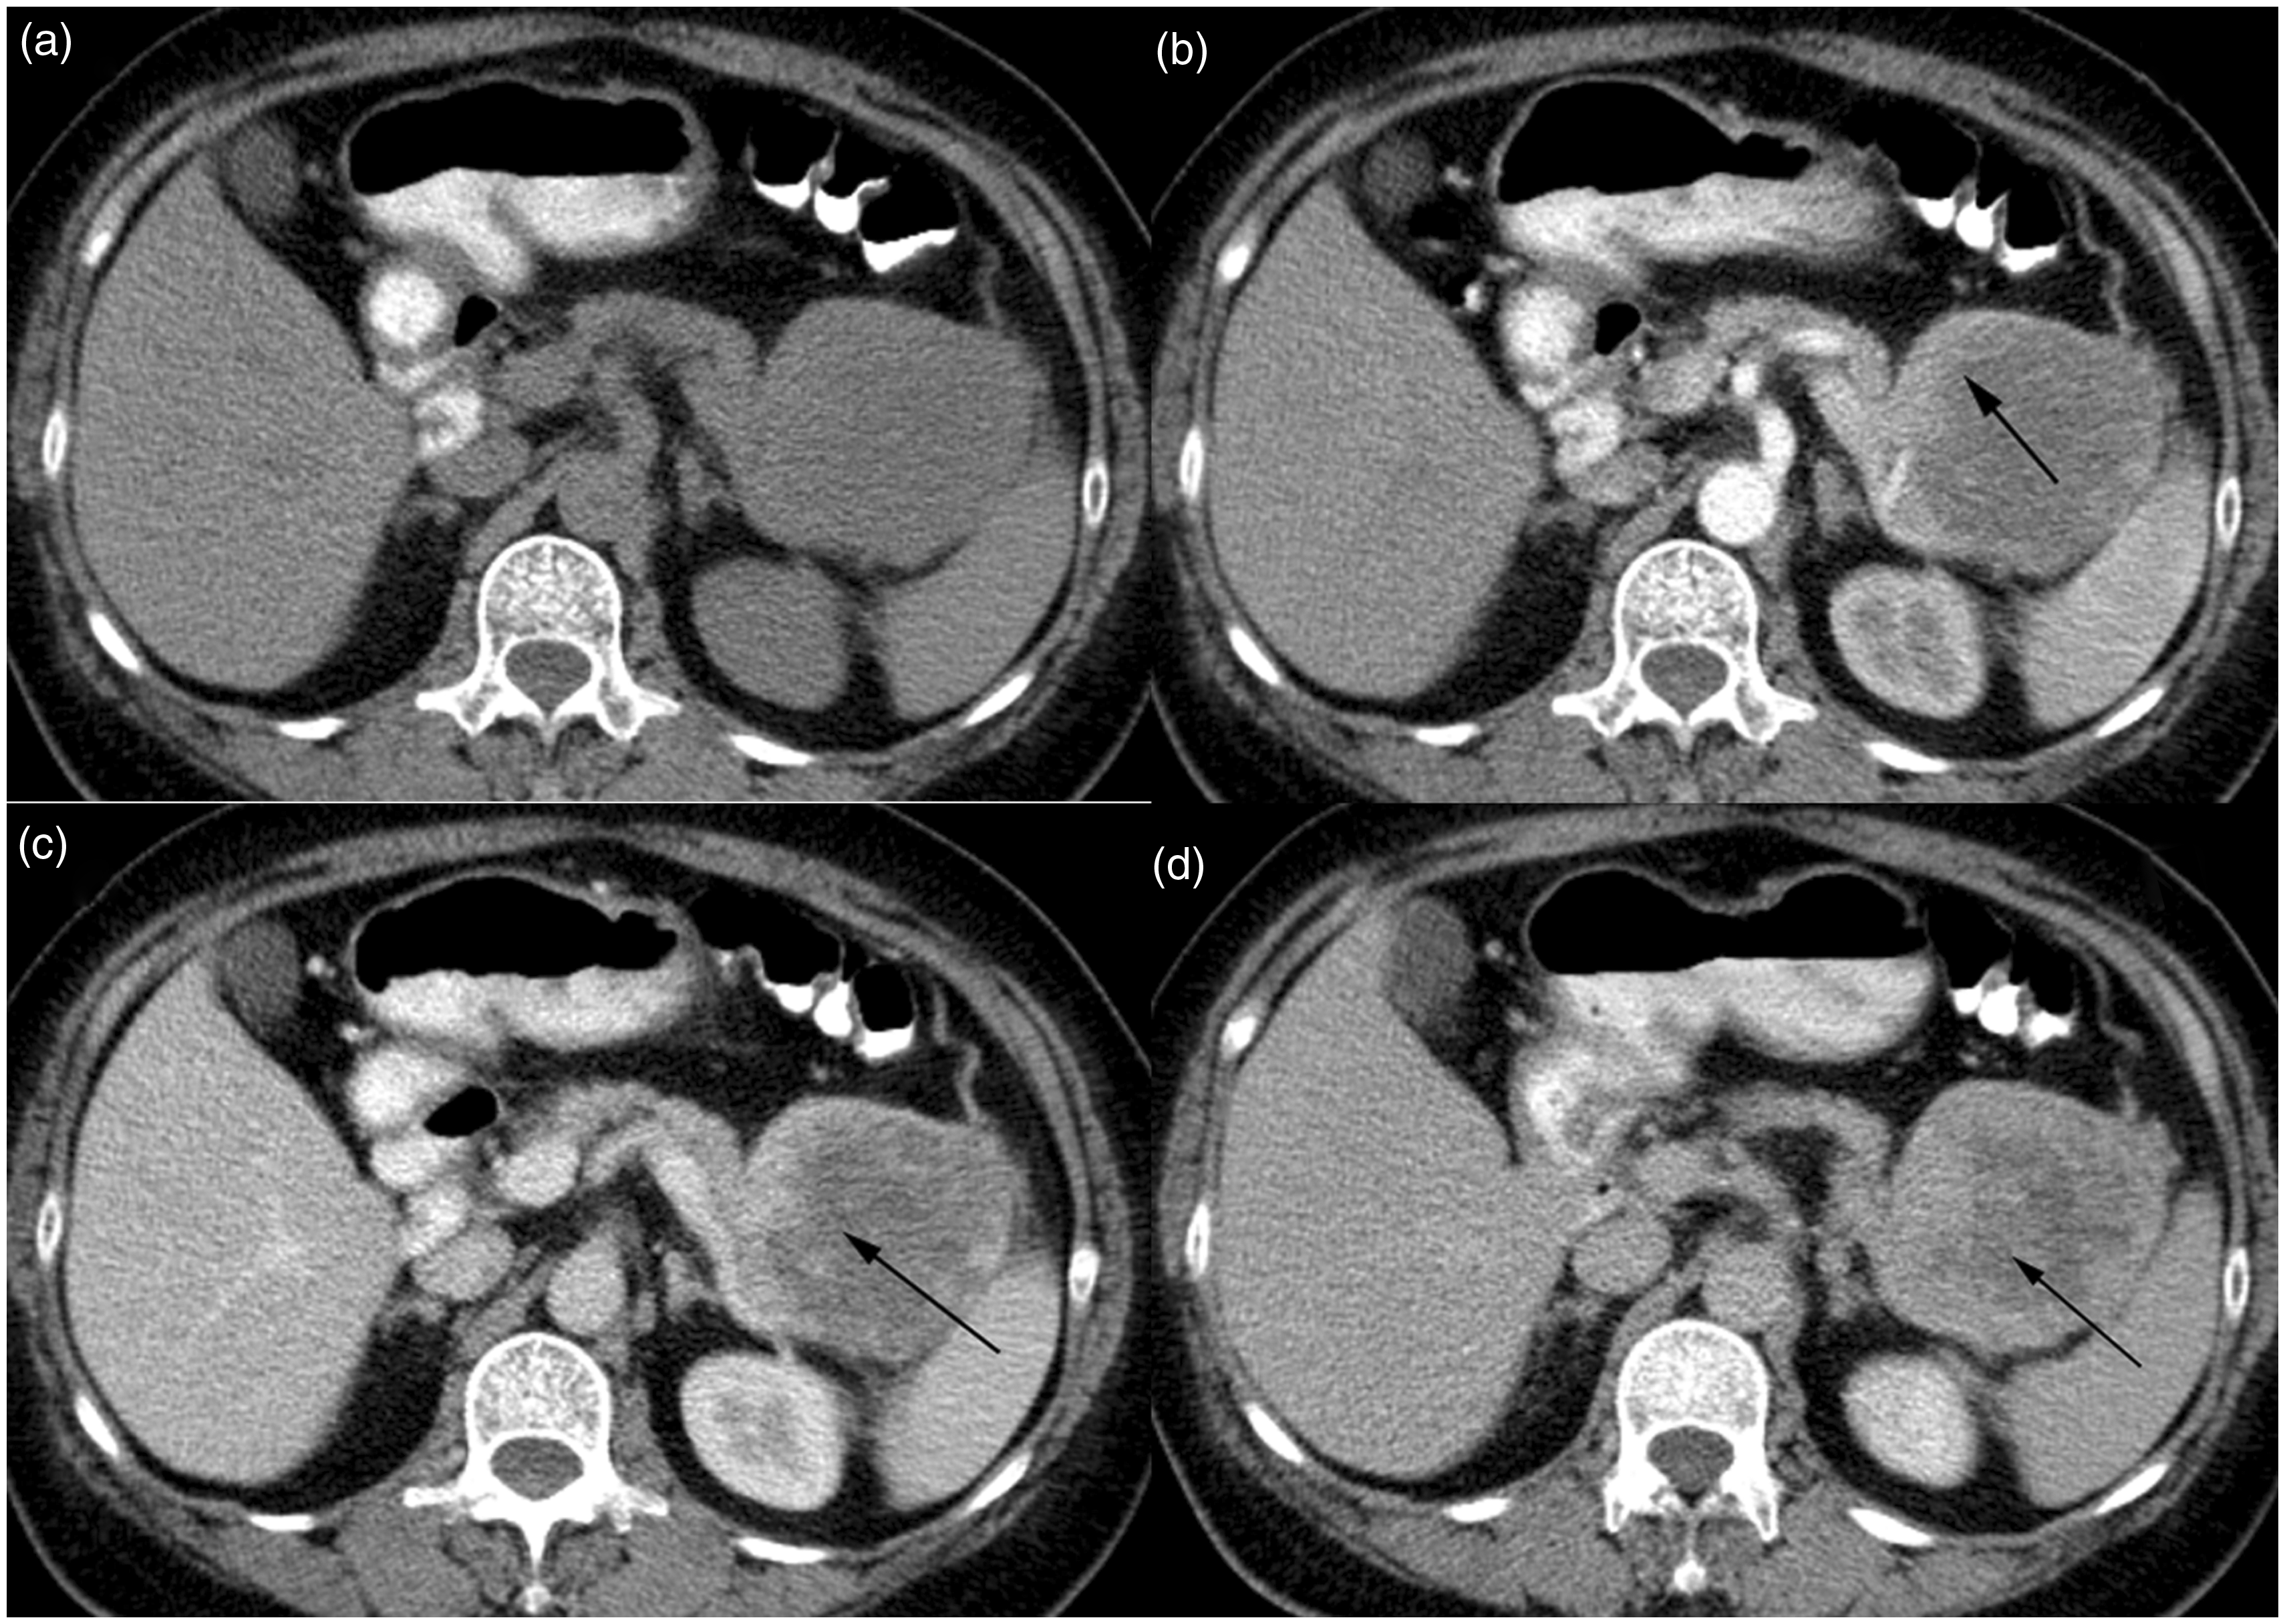
A 62-year-old woman with a 7-cm PNETs. (a) Axial unenhanced CT image demonstrates a iso-hypoattenuation mass with well-defined margin in the tail of pancreas. The tumor shows hypovasucular enhancement (arrow) in the arterial phase (b) and progressive centripetal enhancement (arrow) in the venous (c) and delayed (d) phase.
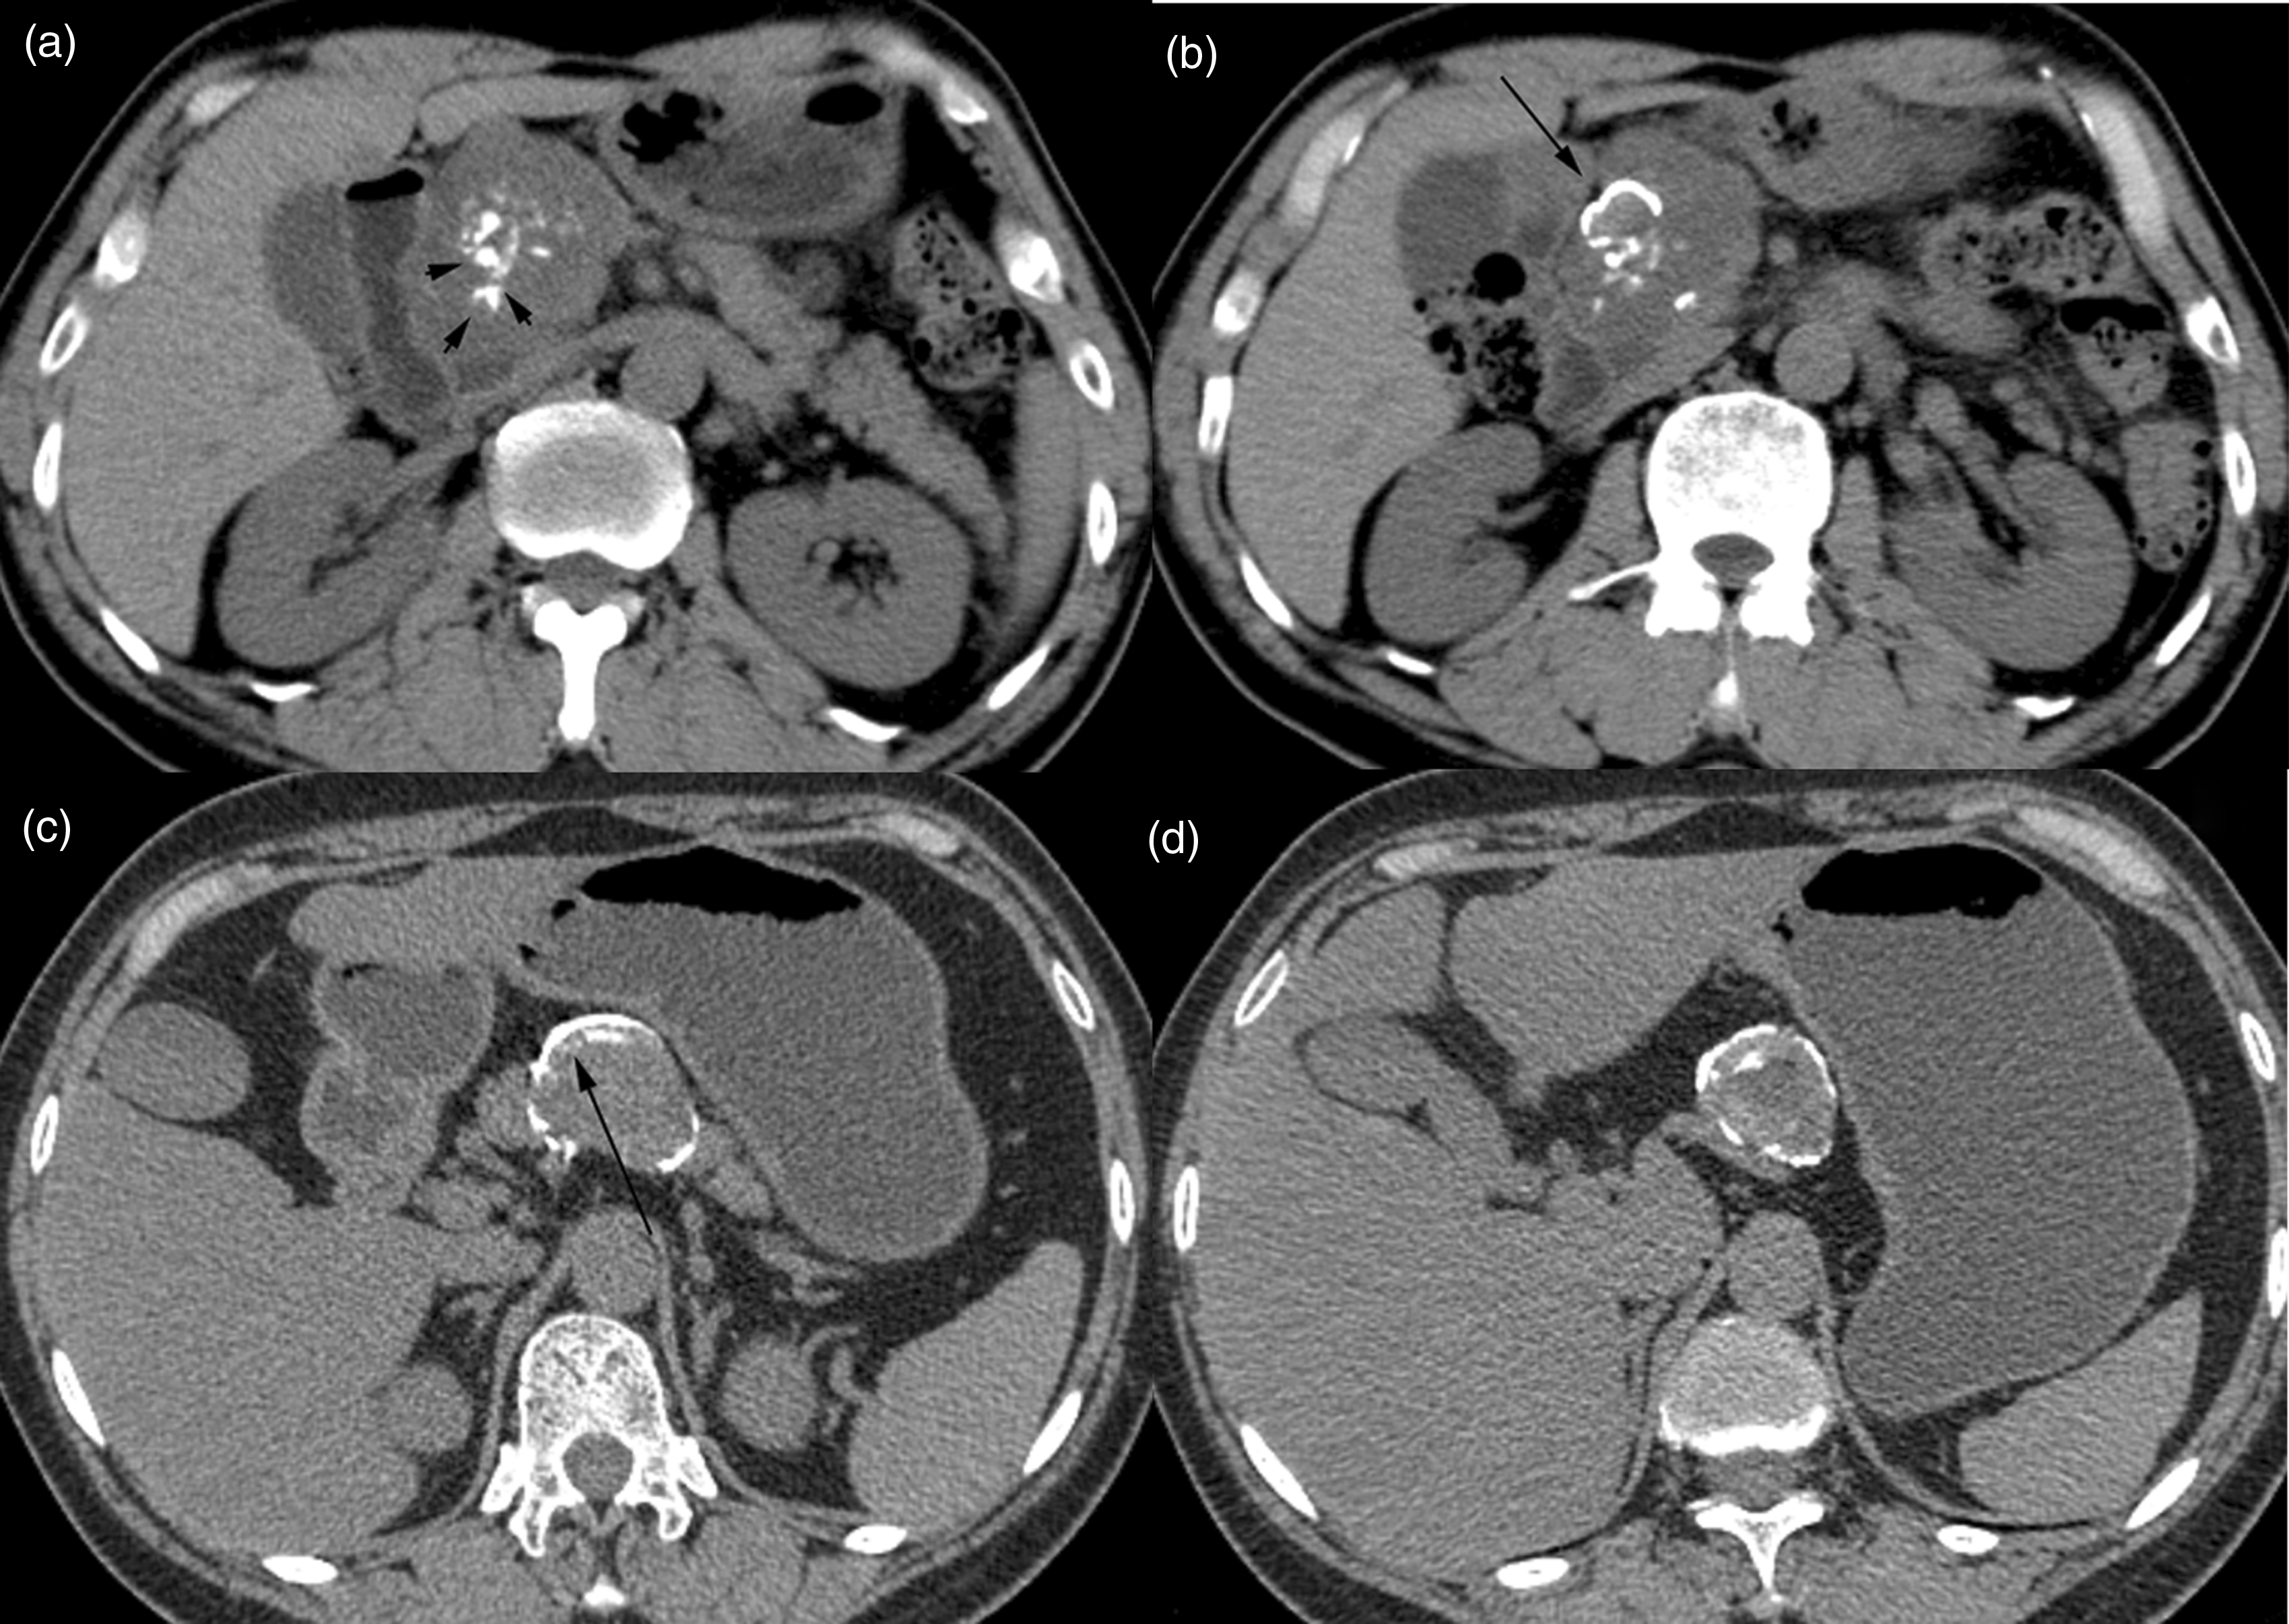
Morphology of calcification of SPNs. (a, b) SPN in the head of pancreas with scattered spotted (a, arrow head) and eggshell calcification (b, black arrow head) in a 58-year-old woman. (c, d) Peripheral eggshell calcification (black arrow) was shown in the neck of pancreas in a 62-year-old man.
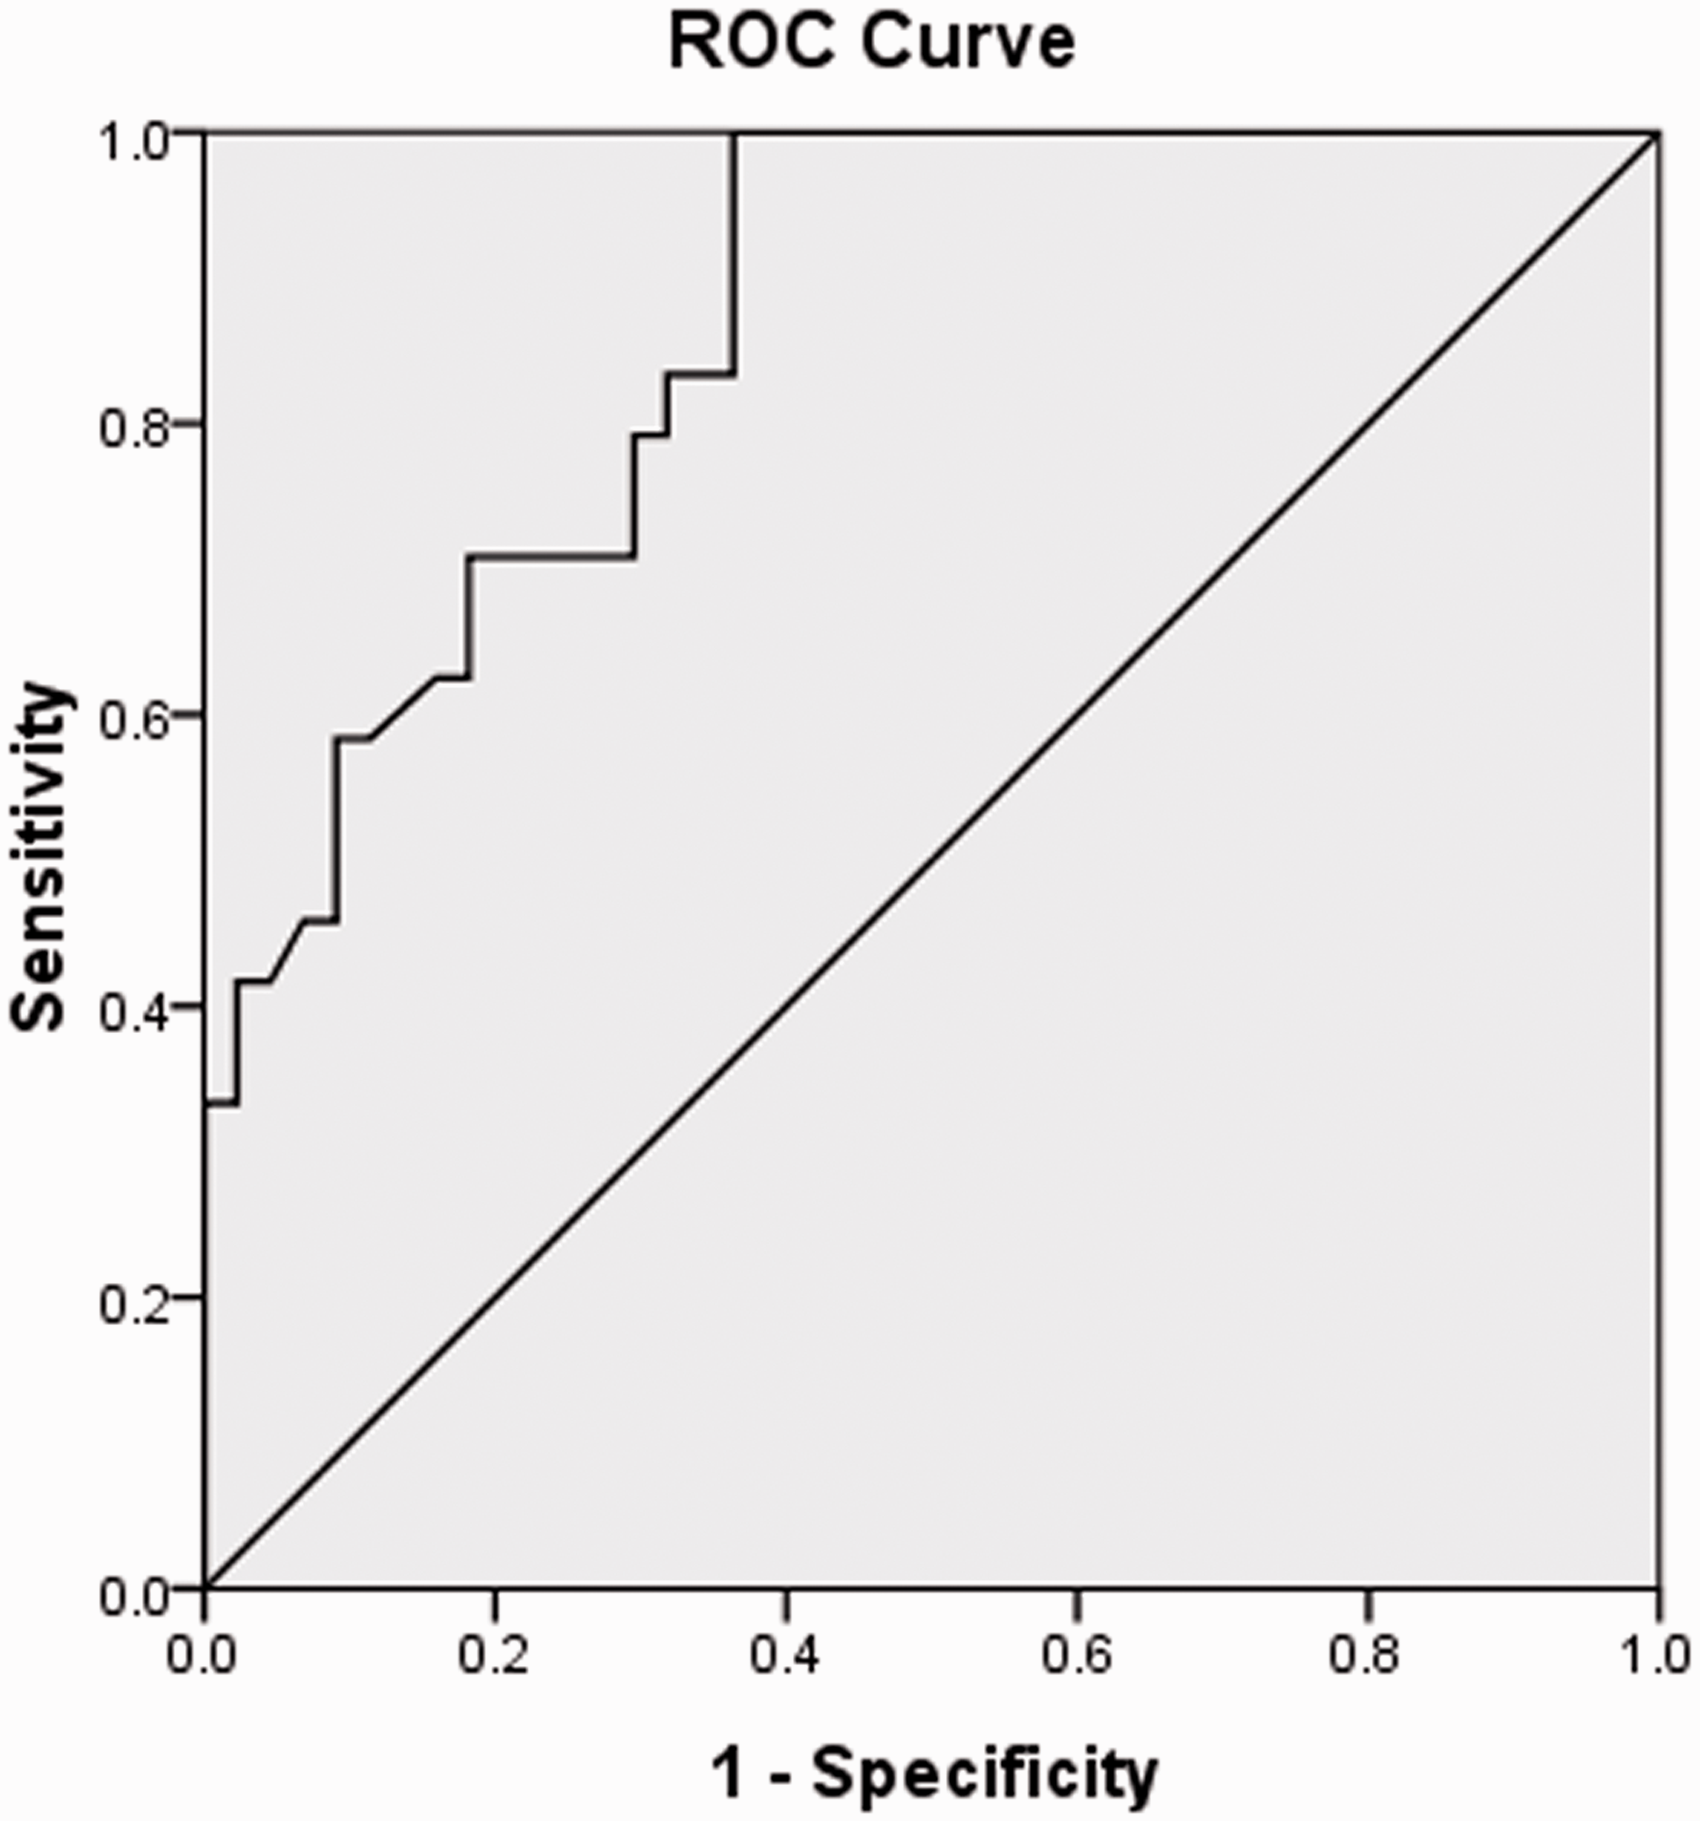
ROC curve of the combined three features (“floating cloud” sign, lower age, and calcification) for differentiating SPNs from PNETs. The AUC is 0.865.
CT imaging findings of SPNs and hypo-PNETs.
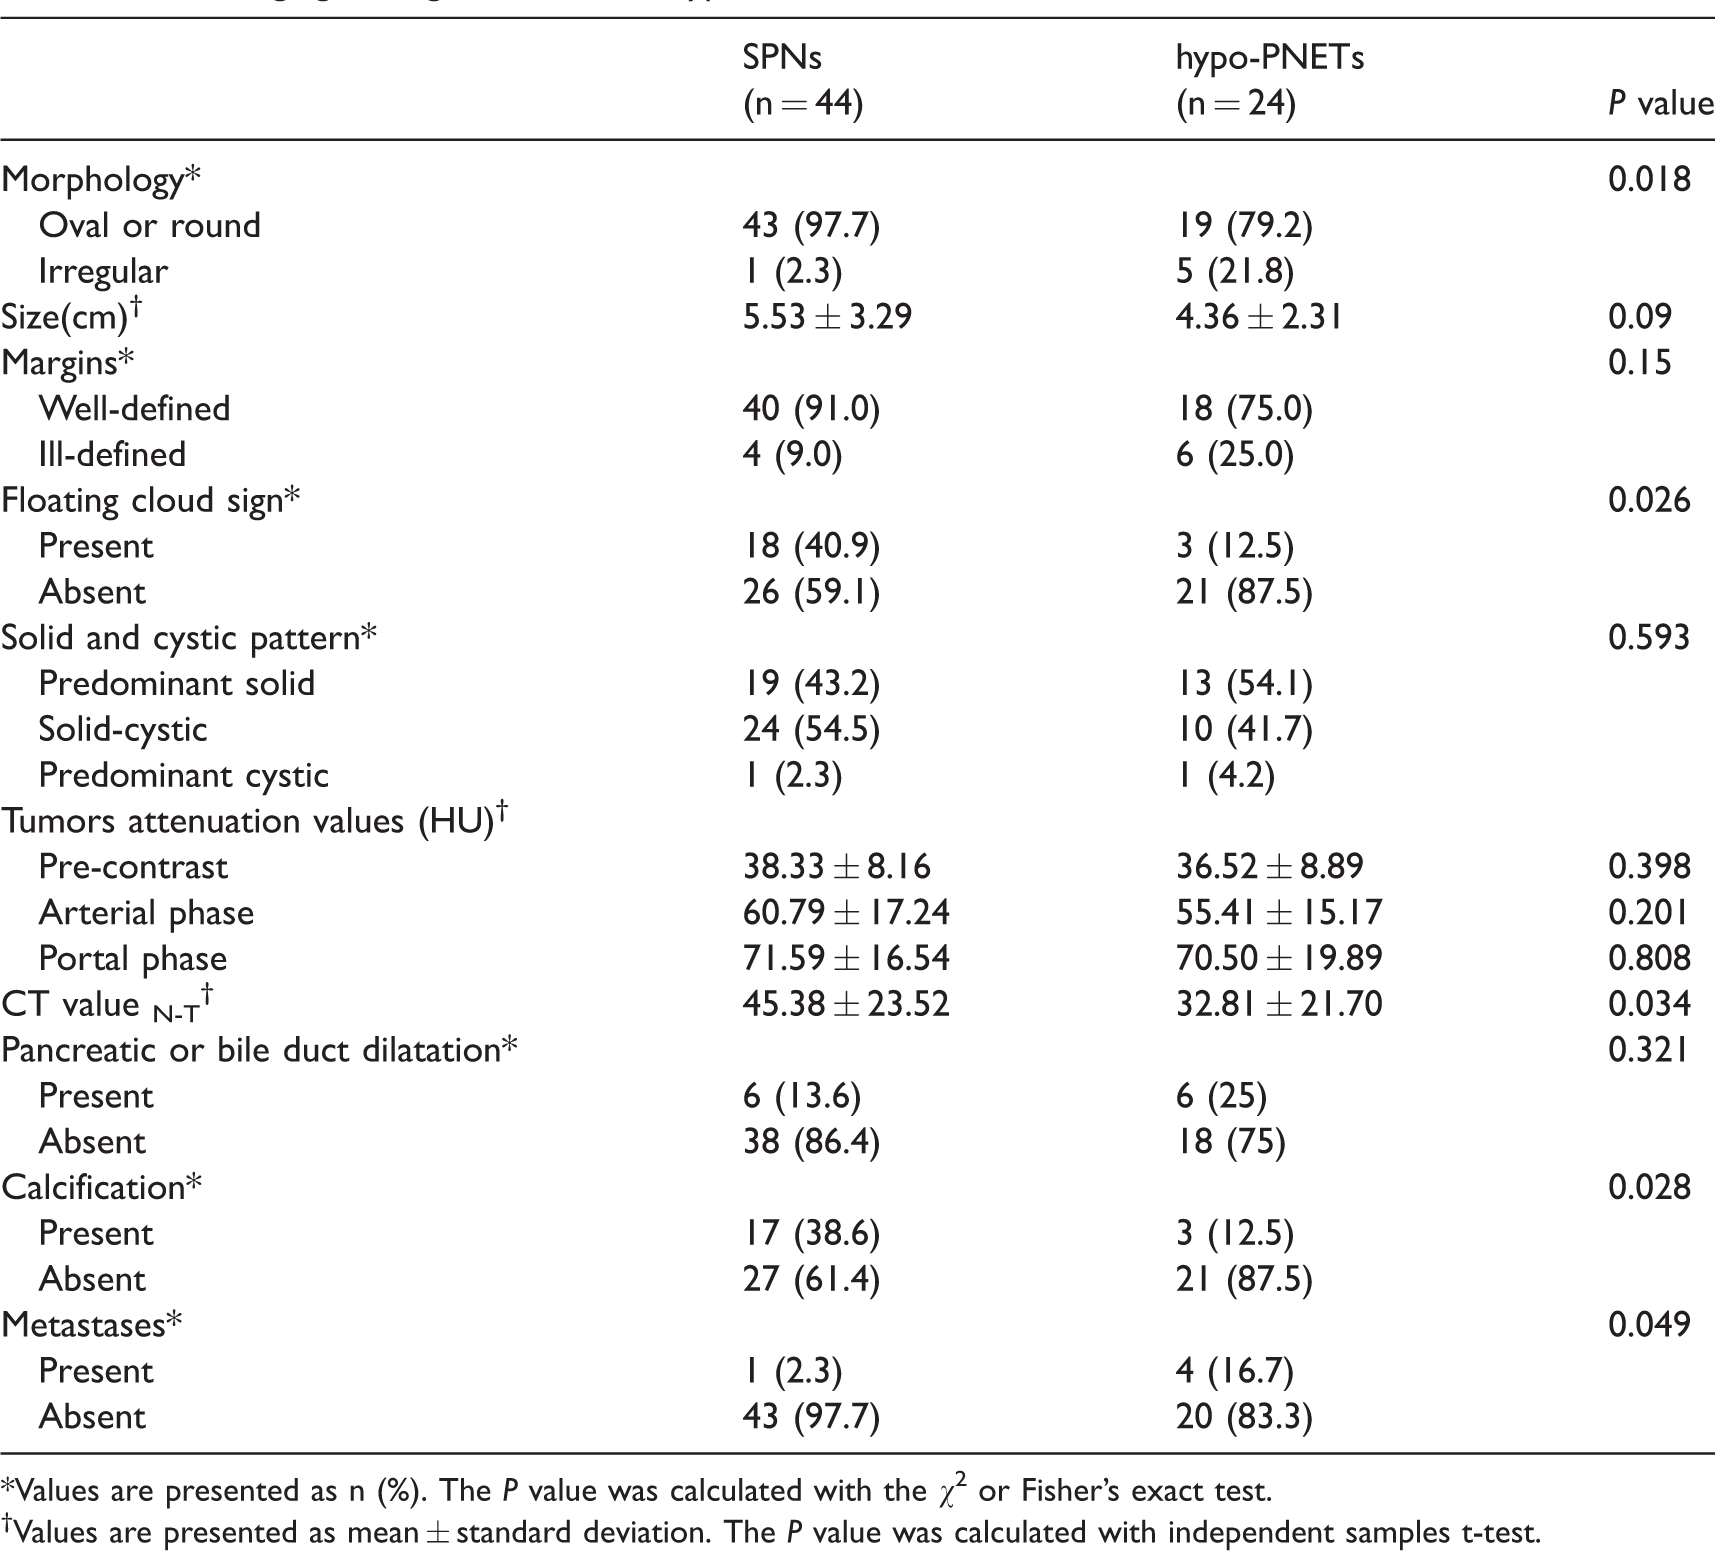
*Values are presented as n (%). The P value was calculated with the χ2 or Fisher’s exact test.
†Values are presented as mean ± standard deviation. The P value was calculated with independent samples t-test.
Subsequently, we evaluated the inter-observer agreement between two reviewers in this study. The following imaging findings showed excellent inter-observer agreement: “floating cloud” sign (к = 0.898) and calcification (к = 1); classification of solid and cystic pattern (к = 0.885); and tumor location (к = 0.881). Substantial agreement was found in pancreatic or bile duct dilatation (к = 0.755) and metastases (к = 0.746), classification of the tumor margin (к = 0.717), and morphology (к = 0.627).
Quantitative analysis
The age of patients with SPNs was younger than those patients with hypo-PNETs (mean age = 39.5 years vs. 49.1 years, P < 0.001). The mean sizes of SPNs were greater than those of hypo-PNETs (5.53 cm vs. 4.36 cm), but no significant difference was observed (P = 0.09). No significant difference was found in CT attenuation between the two groups. The CT value N-T of SPNs was significantly higher than that of hypo-PNETs (45.38 vs. 32.81, P = 0.034).
Diagnostic performance analysis
Three imaging features, including the “floating cloud” sign, lower age, and calcification, were found to be independent predictors of SPNs. Subsequently, we combined three predictors in the logistic regression model and evaluated the diagnostic performance in the differential diagnosis of SPNs from hypo-PNETs. The area under the curve (AUC) was 0.865 with 100% sensitivity and 63.6% specificity (Fig. 5).
Discussion
SPNs and hypo-PNETs overlap in imaging findings. However, few studies have compared their imaging features. In this study, our results showed that the “floating cloud” sign, shape, calcification, and metastases were valuable features in discriminating the two lesions at CT imaging. The combination of those imaging features shown acceptable diagnostic performance (AUC = 0.865) in differentiating SPNs from hypo-PNETs.
SPNs and PNETs can both contain pseudopapillary tissues (10). There may be histological overlap between them. In addition, SPNs usually showed a mild enhanced pattern in the arterial phase, which is also similar with hypo-PNETs. However, the treatment approaches between SPNs and PNETs are different. Generally, enucleation is the most effective therapy for SPNs (11,12). For PNETs, extensive pancreatic resection is usually adopted (13). In addition, targeted therapy (everolimus or sunitinib) and somatostatin analogs are also applicable for PNETs (14). The preoperative differentiation of the two tumors is valuable for treatment planning.
Previous studies reported that SPNs were usually occurred in women with a median age of 33.7 years (15). In our study, the SPNs predominantly affect young women and the median age of the SPNs at diagnosis is 34.45 years. Our data were consistent with the previous findings. Our data and several studies both showed that the mean age of hypo-PNETs was about 50 years (16–18). The age of disease onset may be an important factor in differentiating those two lesions.
In our study, the “floating cloud” sign was only found in the solid-cystic tumor; 72% of SPNs which had cystic degeneration showed this characteristic. Our data indicate that the “floating cloud” sign was one of the important CT imaging features which can distinguish SPNs from hypo-PNETs. The enhanced solid components on CT corresponding to those seen on pathologic specimens were the pseudopapillary areas or internal hemorrhage. In addition, few of the hypo-PNETs had the pseudopapillary areas. Consequently, few of them showed the “floating cloud” sign in CT images. Calcification is another valuable feature. Calcification has been reported in approximately 39% of SPNs (19) and 15.6% of 167 PNETs (8). Similar results were found in our study. In a regression model, we further indicated that the combination of age and the two imaging features above showed acceptable diagnostic performance in differentiating SPNs and hypo-PNETs, which were better than the age or imaging feature alone.
Previous studies (20,21) reported that the solid tissue of SPNs showed slight contrast enhancement in the arterial phase, progressive enhancement in the portal venous phase, and slightly increased or decreased enhancement in the delayed phase. The enhancement degree was lower than normal pancreatic parenchyma. The SPNs in our study showed the same enhanced pattern. In our study, only PNETs showed hypo-density in the arterial phase compared with the normal pancreatic parenchyma were included. Therefore, the CT attenuation of tumors between the two groups had no significant differences.
Some studies reported that most SPNs had some cystic compartments and a few SPNs showed complete cystic components. Anil et al. (22) reported that only one SPN was predominantly cystic in their study. There was one SPN that showed a complete cystic pattern in our study. SPNs showed higher frequencies of cystic degeneration compared with hypo-PNETs (56.8% vs. 45.9%). However, Jeon et al. (17) reported 20% of hypo-PNETs had cystic degeneration, which was inconsistent with our data. There were many more grade 3 tumors in our study, which had more cystic or necrotic components. As previous studies (23) suggested, PNETs in our study also showed more malignant potential than SPNs. The metastases were found in four hypo-PNETs and only one in SPNs.
There were several limitations. First, because of its retrospective nature, there may exhibit selection and verification bias. Second, clinical characteristics, such as jaundice or laboratory findings were not controlled in our study. Finally, the sample sizes are relatively small because both SPNs and PNETs are rare tumors.
In conclusion, our data indicate that lower age, “floating cloud” sign, and calcification were useful features in discriminating SPNs from hypo-PNETs. The combined three features showed acceptable diagnostic performance in the differentiation between SPNs and hypo-PNETs.
Footnotes
Acknowledgments
We thank all authors for their continuous and excellent support with patient data collection, imaging analysis, statistical analysis, and valuable suggestions for the article.
Declaration of Conflicting Interests
The author(s) declared no potential conflicts of interest with respect to the research, authorship, and/or publication of this article.
Funding
The author(s) disclosed receipt of the following financial support for the research, authorship, and/or publication of this article: This work was supported by the National Natural Science Foundation of China (no. 81771899) and the Key Program of Research and Development of Jiangsu Province (no. BE2017772).