
Abstract
Background
Radiostereometric analysis (RSA) is the gold standard to measure early implant migration which is a predictive factor for implant survival.
Purpose
To validate an alternative computed tomography (CT) technique to measure implant migration in shoulder arthroplasty.
Material and Methods
A cadaver proximal humerus and a scapula, which had tantalum beads incorporated within them, were prepared to accept a short-stemmed humeral component and a two-pegged glenoid component of a commercial total shoulder arthroplasty (TSA) system. A five degree of freedom micrometer and goniometer equipped rig was used to translate and rotate the implant components relative to the respective bone to predetermined positions. Double CT examinations were performed for each position and CT motion analysis software (CTMA) was used to assess these movements. The accuracy and precision of the software was estimated using the rig’s micrometers and goniometers as the gold standard. The technique’s effective dose was also assessed.
Results
The accuracy was in the range of 0.07–0.23 mm in translation and 0.22–0.71° in rotation. The precision was in the range of 0.08–0.15 mm in translation and 0.23–0.54° in rotation. The mean effective dose for the CT scans was calculated to be 0.27 mSv.
Conclusion
In this experimental setting, accuracy, precision, and effective dose of the CTMA technique were found to be comparable to that of RSA. Therefore, we believe clinical studies are warranted to determine if CTMA is a suitable alternative to traditional RSA for migration measurements in TSA.
Keywords
Introduction
Due to its accuracy and precision, radiostereometric analysis (RSA) is considered the gold standard for in vivo assessment of early orthopedic implant migration (1). Early migration is important to assess since it is correlated with higher revision rates in arthroplasty (2,3). However, not every hospital has access to the expensive set-up of RSA labs and to the trained personnel needed to take these radiographs (4). Therefore, there is a need to consider alternative techniques.
Improvements in computed tomography (CT) have increased resolution and decreased effective dose, motivating the use of widely available CT scanners to quantify implant migration. A CT technique has previously been used in lower limb arthroplasty to assess implant positioning (5,6). Furthermore, one experimental study has been conducted with a CT technique on acetabular cups comparing its accuracy and precision to RSA (4). However, to our knowledge, no such methodological CT study has yet been conducted for shoulder arthroplasty.
Our aim was to validate a commercially available low dose CT motion analysis (CTMA) program for use with total shoulder replacement and evaluate whether its accuracy, precision, and effective radiation dose are comparable to RSA.
Material and Methods
Model description
A cadaveric proximal humerus and a scapula were prepared to accept the short-stemmed humeral component and the two-pegged glenoid component, respectively, of a commercially available hybrid total shoulder arthroplasty (TSA) system (Affinis Short, Mathys, Bettlach, Switzerland) using the standard surgical technique (Fig. 1). The humeral head was resected at the anatomic neck and a cruciate-shaped recess was created in the humeral metaphysis using standard techniques. The width of each arm of the cruciform-shaped recess was then enlarged to facilitate implant translations and rotation during testing. The glenoid was also prepared and reamed using the standard procedure. The two peg holes were then created and subsequently their diameter was enlarged. Next, tantalum beads with 1.0 mm in diameter were inserted into the humeral head and the glenoid using a bead injector. In total, nine beads were inserted in the glenoid and 12 in the humerus.
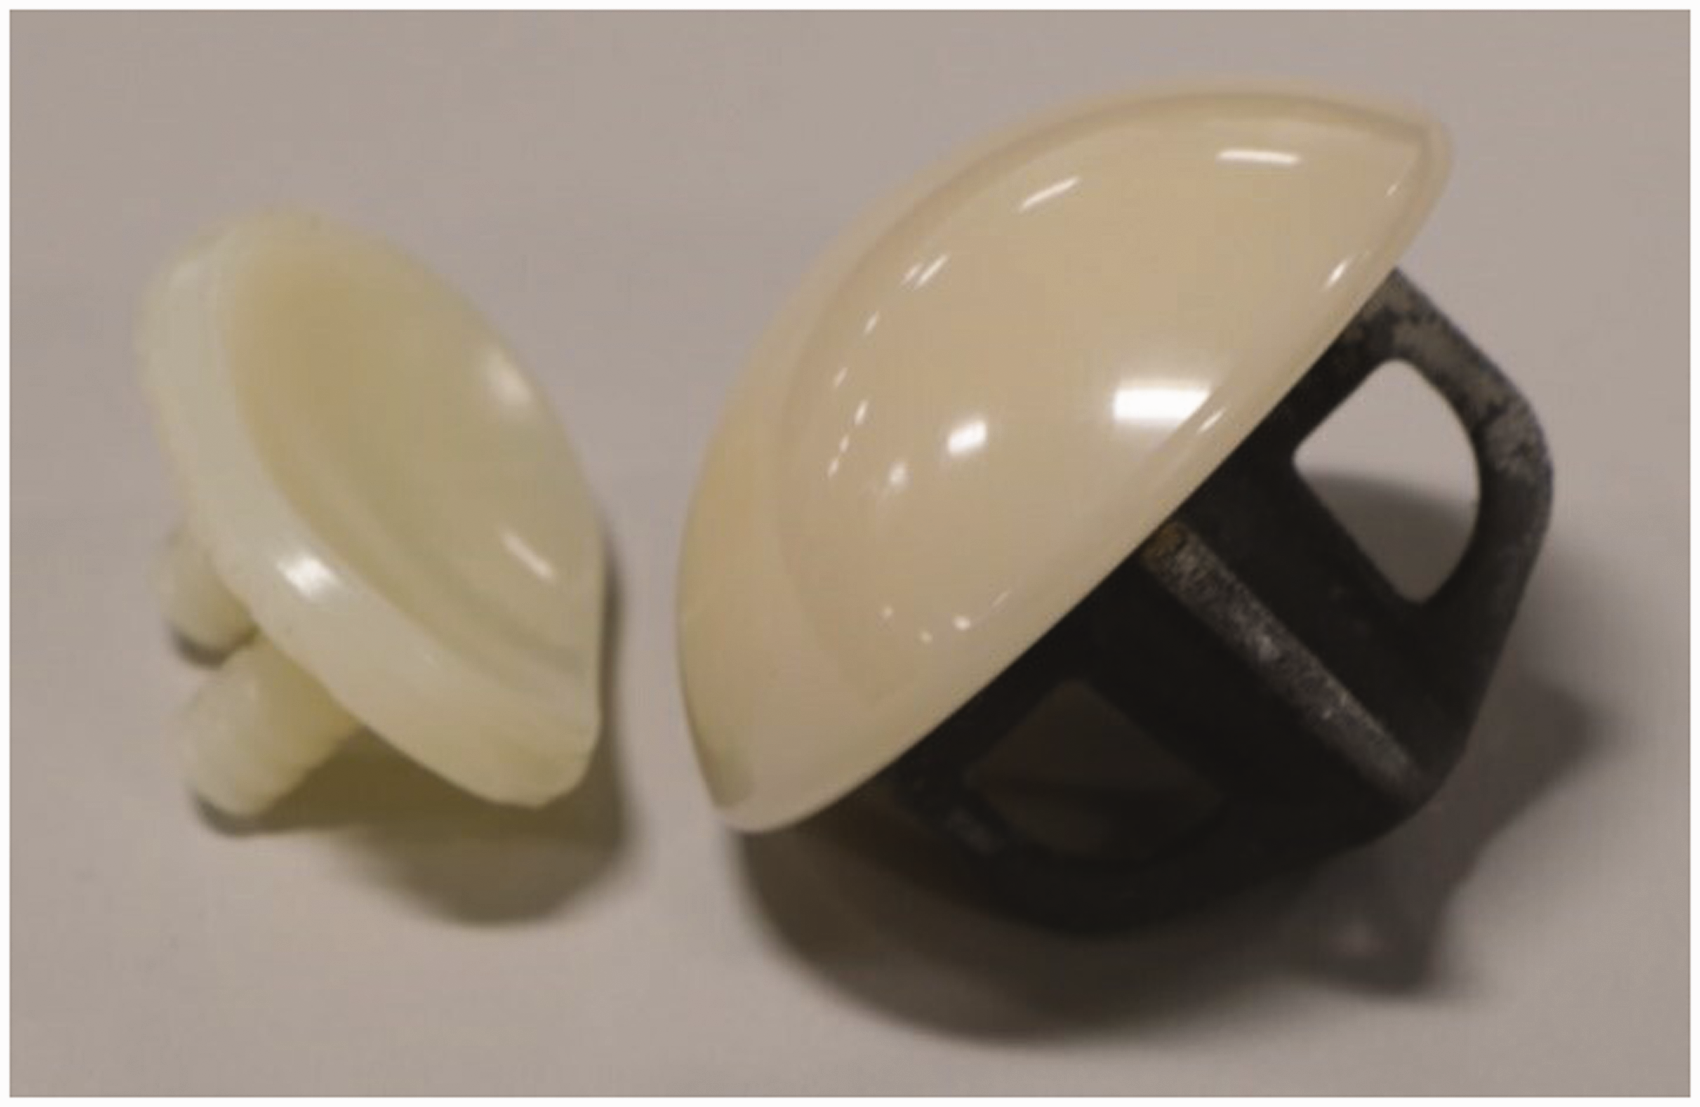
The Mathys Affinis short stem implant system.
Rig description
To accurately assess the ability of the three-dimensional (3D) CT technique to measure shoulder implant migration, a custom rig was developed with three orthogonal translations and two degrees of rotational freedom (Figs. 2 and 3). The implant mount of the rig is composed of three orthogonally stacked translational stages (Model 9061, Newport, Irvine, CA, USA) with micrometers (Model 148-215, Mitutoyo, Aurora, IL, USA) that produce translations with an accuracy of 0.005 mm and a rotational goniometer (Model GNL 18/M, ThorLabs, Newton, NJ, USA) with an accuracy of 10 arc min (i.e. 0.167°). The first translational stage is affixed to the base while the third translational stage connects to the goniometer which in turn acts as a mount for a glenoid or humerus implant fixture that were custom-designed. In the case of humeral testing, the fixture holds the ceramic humeral head. The cruciform-shaped short humeral stem can then be attached to the ceramic humeral head (Fig. 2). For glenoid testing, the fixture incorporates a morse taper to allow the base of the humeral head to be attached. The glenoid component is then fixed to the humeral head component using cyanoacrylate. The humeral head component is included in glenoid testing as the ceramic material of the head could produce CT artefacts and therefore affect accuracy and precision results (Fig. 3).
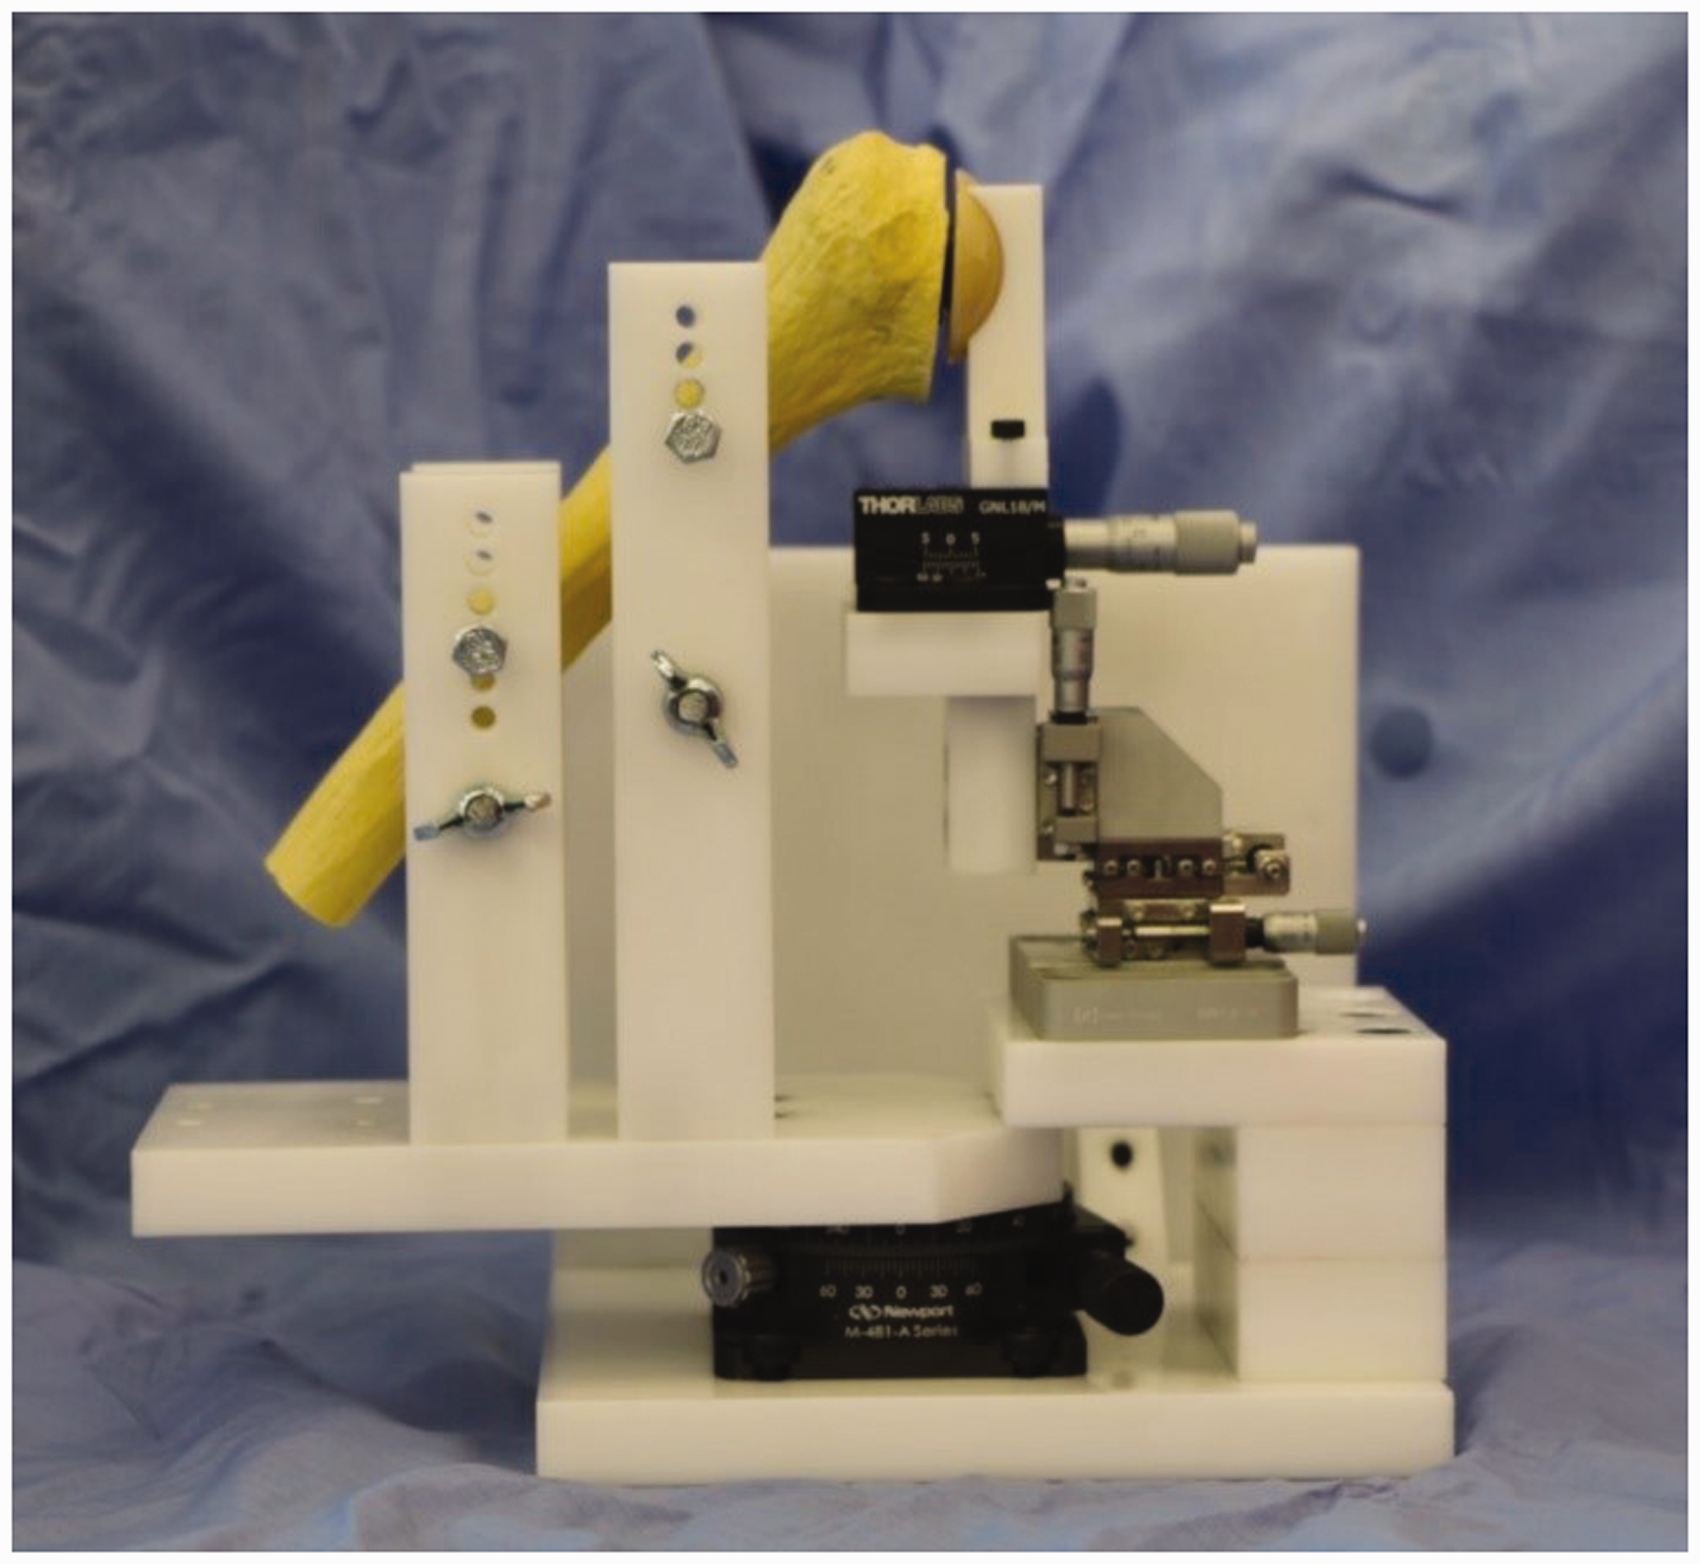
Micro-motion validation testing device in its humerus configuration. Note that a humeral Sawbone model is shown here for clarity in place of the cadaver bone used during the experiment.

Micro-motion validation testing device in its scapula configuration. Note that a scapula Sawbone model is shown here for clarity in place of the cadaver bone used during the experiment.
The bone mount for the humerus or scapula can be interchanged depending on the bone to be tested. This bone mount is connected to the testing rig base by a single axis rotational stage (Model M-481-A, Newport Co., Irvine, CA, USA) with an accuracy of 5 arc min (i.e. 0.083°). The humerus mount is composed of four uprights, each with height adjustable bolts. The humerus can be adjusted to a desired position and orientation and then clamped in place by tightening the four bolts onto the humeral shaft. The scapula mount consists of an upright attached to the base component and a set of clamping jaws which holds the scapula in position. Once the implant and bone are fixed in their desired initial position, their relative position can be adjusted to model 3D implant translations and rotations with a high level of accuracy using the micrometers of the translation and rotation stages.
Study setting
A total of 28 different positions were tested for each component relative to their respective bone: 16 translations and 12 rotations. For each position, a double exam was conducted to estimate the precision of the method. Within a double examination, two scans were conducted without changing the position of the component relative to the bone. However, the entire rig was repositioned between these exams to imitate a double examination in a clinical setting where the patient may shift. Translational and rotational movements were conducted separately.
Sixteen translations were performed without returning to the reference position, first along the medial/lateral axis (x-axis), then the inferior/superior axis (z-axis), and finally the anterior/posterior axis (y-axis). In its final position, the implant had undergone 3 mm of translation along each of the axes for the humeral and 2 mm along each axis for the glenoid component.
For the humeral component, scans were taken after translations along each axis of 0, 0.2, 0.5, 1.0, 2.0, and 3.0 mm. For the glenoid component, scans were taken after translations along each axis of 0.2, 0.5, 1.0, 1.5, and 2.0 mm. The increments differed slightly for the glenoid component since the glenoid bone was smaller and did not permit > 2.0 mm of translation along each axis.
The 12 rotations were also performed without returning to the reference position, first around the superior/inferior axis (z-axis) then around the anterior/posterior axis (y-axis). In its final orientation, the implant had undergone 3° of rotation around each of the two axes.
The y-axis and the z-axis corresponded to tilt and version of the implant, respectively. The design of the rig did not permit rotation around the x-axis.
For both components the implant was moved 0, 0.2°, 0.5°, 1.0°, 2.0°, and 3° around the z-axis and 0, 0.2°, 0.5°, 1.5°, 2.0°, and 3° around the y-axis.
CT scanner and radiation
A clinical CT scanner (Ingenuity, Philips, Eindhoven, The Netherlands) was used with standard shoulder parameters: voltage = 120 kVp; pitch = 1; rotation time = 0.4 s; and automatically modulated tube current. The images were reconstructed into a 768 × 768 matrix with an x–y pixel size of 0.65 mm and a slice thickness of 1 mm with an increment of 0.5 mm. No metal artefact reduction protocol was used.
The effective dose was computed using the standard method described by the American Association of Physicists (7). The CT dose index volume (CTDIvol) was multiplied by the scan length of a normal patient shoulder examination to obtain a more realistic value of the dose length product (DLP). The DLP was thereafter multiplied with a conversion factor suitable for a shoulder (calculated as the mean of the chest and neck conversion factors) to get an estimate of the effective dose.
Image analysis
For the image analysis, commercially available image registration software, CT-based implant Motion Analysis (CTMA, Sectra, Linköping, Sweden), was used. CTMA has been developed based on extensive research over the last few decades on methods of CT image registration applied to orthopedics (4,5,8–10). To assess implant migration, two CT datasets are imported into the CTMA tool (Fig. 4).

The CTMA analysis process.
In the graphical user interface, manual metal thresholding optimization is performed to achieve a clear 3D representation of the implants and/or beads while minimizing metal-related artefacts. The graphical interface allows the user to rotate and translate their view of the CT volumes to facilitate the designation of rigid bodies of interest. Two separate registrations are performed: one of the beads embedded in the bone and one of the implants.
For the measurements of the glenoid component, nine beads in the scapula were chosen for the first image registration. Thereafter, the beads of the implant were chosen for the second image registration. For the humeral component measurement, nine beads in the humerus were selected for the first registration. Thereafter, the humeral stem was used. For all registrations, the software spread 50,000 landmarks points over the surface of the beads/implants; these were used by the software in the registration process.
After registration, the software calculates the change in relative pose (i.e. position and rotation) between the two rigid bodies (the beads in the bone, and the implant) going from the first to the second CT image. The results are shown visually as registered 3D volumes, while the numerical migration values are expressed in 6° of freedom. Visual cues, such as color-coding, give feedback on the quality of the registration (Fig. 4). Numerically, the relative pose is described between the center of the landmarks distributed over the surface of the implant and the center of the landmarks distributed on the beads, in a CT coordinate system. This CT coordinate system was adjusted and aligned with the internal coordinate system of the rig in this experiment in order to describe the motions with respect to meaningful axes of the rig. The difference between the migration established with the micrometer and the CT-based measurements were used to calculate the technique’s accuracy and precision.
Statistics
Precision of a measurement was defined as “the degree to which repeated measurements under unchanged conditions show the same results” (11).
Precision was calculated as the difference between the double measurements at one predetermined position of the shoulder component relative to the cadaveric bone. The precision for each implant was calculated with the equation t * SD, as used by Sköldenberg and Odquist (11). The value “t” represents the value obtained in a t-distribution table for a double-sided 95% confidence interval (CI) with “n–1” degrees of freedom (n being the number of examinations). SD is the standard deviation of the difference in the pairs of double measurements. For the precision measurement “n–1” was estimated to 27 degrees of freedom and “t” to 2.052.
Accuracy of a measurement was defined as “the degree of closeness between a measured value and the true value and contains both random and systemic errors” (11). The micrometer was assumed to be the true value in this case and was used as the gold standard when the accuracy of the CT method was calculated. The accuracy was therefore determined by the difference between CT volume measurements of migrations and the micrometer-simulated migration between two different positions.
For the accuracy, the formula t∗ RMS was used where “RMS” represents the root mean square. The RMS was used since the difference between the micrometer and our CT data could be both positive and negative. “t” represents the value obtained in a t-distribution table for a double-sided 95% CI with “n” degrees of freedom (n is the number of examinations). The calculation of accuracy for translation and rotation were done separately.
Data from each implant was tested separately for normality using a Shapiro–Wilk test before conducting the statistical tests. All data were normally distributed besides the accuracy data for z-translation of the humeral component. Statistical tests were conducted in SPSS Statistics.
Results
Accuracy was in the range of 0.07–0.23 mm in translation and 0.22–0.71° for rotation (Tables 1 and 2). Precision was in the range of 0.08–0.15 mm in translation and 0.23–0.54° for rotation (Tables 3 and 4). Visual inspection of the CT volumes showed no significant artefacts. All the tantalum beads were readily identified without any occlusion. Additionally, a change in the implant’s position of > 0.2 mm between each of the different configurations could be seen in CTMA. Where no movement within the model between the prosthesis and the bone had been induced, the prosthesis showed an overlapping pattern in the software.
Accuracy of the CTMA on the humeral component.
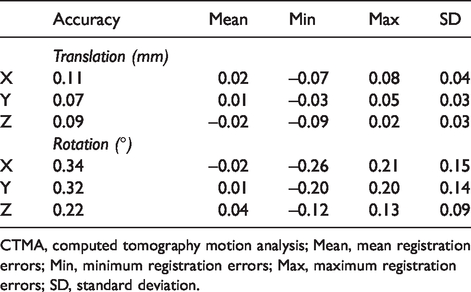
CTMA, computed tomography motion analysis; Mean, mean registration errors; Min, minimum registration errors; Max, maximum registration errors; SD, standard deviation.
Accuracy of the CTMA on the glenoid component.
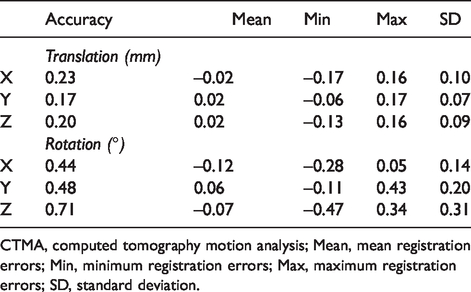
CTMA, computed tomography motion analysis; Mean, mean registration errors; Min, minimum registration errors; Max, maximum registration errors; SD, standard deviation.
Precision of the CTMA on the humeral component.
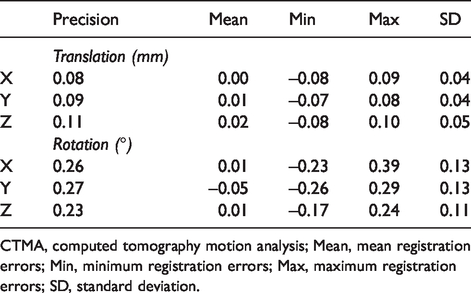
CTMA, computed tomography motion analysis; Mean, mean registration errors; Min, minimum registration errors; Max, maximum registration errors; SD, standard deviation.
Precision of the CTMA on the glenoid component.
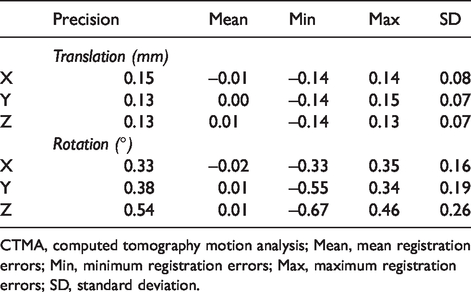
CTMA, computed tomography motion analysis; Mean, mean registration errors; Min, minimum registration errors; Max, maximum registration errors; SD, standard deviation.
The potential mean effective radiation dose per CT examination was calculated to be 0.27 mSv (range = 0.22–0.34 mSv). The CTDIvol was estimated to be 3.7 mGy (range = 3–4.5 mGy) and the DLP was estimated to be 27.4 mGy.cm (range = 22.5–33.75 mGy.cm).
The experimental data of this study will be available upon request from:
Discussion
The purpose of this study was to validate a new CT method for assessment of early migration in shoulder arthroplasty.
In this study, we found that precision of the CTMA technique was in the range of 0.08–0.15 mm in translation and 0.23–0.54° for rotation. Our results were slightly more precise for the humeral component compared to the glenoid. This could be due to the larger humeral implant size, the more asymmetrical geometrical shape of the stem, and the fact that the registration algorithm used in the software uses > 50,000 landmarks spread over the surface of the metal of the humeral implant. In comparison, the glenoid component’s only six beads were chosen as landmarks since the polyethylene is not visible in the CT scan. Therefore, the landmarks are fewer and less spread out which makes quantification of rotation less reproducible and therefore less precise. RSA shoulder implant studies in the literature report a mean glenoid component precision of 0.18 mm and 0.96° in rotation and a mean humeral component precision of 0.61 mm and 5.34° in rotation (12). Brinke et al. suggested in a systematic review that the precision is slightly worse on the humeral side than on the glenoid side, especially in rotation. This could be explained by the use of a symmetric humeral head resurfacing that showed poor rotational precision values (13).
We did not use a symmetrical implant in our study since we analyzed the movement between the short stem and the bone; therefore, this could explain our better precision values in rotations. In addition, our precision of the glenoid component is comparable to the glenoid studies included in Brinke et al.’s systematic review concerning translation; moreover, our results are slightly better with respect to rotation.
To our knowledge, there are no existing publications in the literature assessing the accuracy of marker-based RSA in shoulder arthroplasty. Our CT accuracy values are in the range of 0.07–0.23 mm in translation and 0.22–0.71° in rotation.
The accuracy limits represent the systematic and the random errors of the method used. A migration value obtained in our system that is greater than the accuracy limit would suggest that a true migration of the implant has occurred and could not be attributed to errors in the system. In hip and knee arthroplasty, different thresholds of implant migration have been established that predict the risk of loosening. It is therefore important that the accuracy of a method is below that threshold, so that a clinically significant implant migration could be meaningfully assessed. However, such a threshold has not yet been established in shoulder arthroplasty.
This study has some limitations. As it was performed under in vitro conditions providing optimal image quality, these results represent the accuracy and precision that could be obtained under ideal circumstances. Another limitation is the use of only a single type of humeral component having a cruciform shape; hence, we do not know how these data are generalizable to other designs. However, the promising results of the technique with this implant may justify repeating the experiment with other commercially available implants. A further limitation in this study is that rotations were only conducted in 2 degrees of freedom and not around the x-axis and that the accuracy data obtained in z-translation of the humeral component were not normally distributed. Therefore, the accuracy in z-translation of the humeral component should be carefully interpreted.
The effective dose of the CTMA technique was estimated to 0.27 mSv which is a slightly higher dose compared to the conventional RSA dose in the literature (estimated to 0.1 mSv in the hip). However, the combined ability to monitor early migration and potentially visualize the implant-bone interface using one technique may justify this increased dosage (2).
This technique is also advantageous due to the wide availability of CT scanners and the limited need for personnel with specialized training as is the case in RSA. The use of 3D images prevents problems such as marker occlusion and subsequent loss of data. As a result of its simplicity, this technique could motivate more and longer-term studies of shoulder implant migration to determine what value, if any, of early migration is predictive of shoulder implant failure.
In conclusion, CTMA can accurately and precisely detect the migration of shoulder implants in an experimental setting, using widely available CT imaging at low dose. We believe clinical studies are warranted to determine if CTMA is a suitable alternative to traditional RSA for migration measurements in TSA.
Footnotes
Acknowledgements
The authors thank Sally Spurr for her help with the collection of the data; she has no industrial affiliation.
Declaration of conflicting interests
The author(s) declared the following potential conflicts of interest with respect to the research, authorship, and/or publication of this article: CB and HO received consultancy fees from Sectra Orthopaedics. OS is a full-time employee at Sectra. Sectra Orthopaedics had no involvement in the study design or interpretation of the data.
Funding
The author(s) disclosed receipt of the following financial support for the research, authorship, and/or publication of this article: CB, JG, RP, and RE were supported by Translational Grant from The Wellcome Trust (Reference No. WT 098269/Z/12/Z).