
Abstract
Background
Since oligodendroglial tumors are sensitive to chemotherapy and have a better prognosis, the differentiation of oligodendroglial tumors (OT) from astrocytic tumors (AT) is important.
Purpose
To investigate the perfusion and permeability parameters that differentiate grade II and III OT from AT, using dynamic contrast-enhanced (DCE) and dynamic susceptibility contrast (DSC) magnetic resonance imaging (MRI).
Material and Methods
We retrospectively reviewed the DCE and DSC MRIs of 39 patients with OT (OTs, n = 19; grade II, n = 12 and grade III, n = 7) and AT (ATs, n = 20; grade II, n = 7 and grade III, n = 13). Glioblastomas were not included. Various histogram parameters of relative cerebral blood volume, volume transfer constant (Ktrans), flux rate constant (Kep), plasma volume fraction (Vp), and extravascular extracellular volume fraction (Ve) from DSC and DCE MRI, were compared between the two groups. Univariable and multivariable logistic regression were used to distinguish OT from AT. Receiver operating characteristic (ROC) curve analysis was performed.
Results
On the results of DCE MRI, most of the histogram parameters of Ktrans, Kep, and Ve showed tendencies toward higher values in OT than AT. Multivariable logistic regression revealed that the 50th Kep and 95th Ktrans were the most significant parameters predictive of OT, with an odds ratio of 3.7 and 2.5, respectively (P = 0.004 and 0.03). The area under the curve from the ROC curve analysis for the 50th Kep and the 95th Ktrans were 0.81 and 0.80, respectively.
Conclusion
The DCE MRI-derived parameters of Ktrans and Kep could facilitate differentiation of OT from AT.
Keywords
Introduction
According to the 2016 World Health Organization (WHO) classification of tumors of the central nervous system, oligodendroglial tumors (OT) comprise grade II and III oligodendroglioma, IDH mutant and 1p/19q-codeleted, and grade II and III oligodendroglioma, not otherwise specified (1). OTs differ from astrocytic tumors (ATs) in terms of histopathology, prognosis and treatment (2,3). Compared to AT, OT is characterized by better prognosis and longer survival rates (2–5). The median survival of patients with WHO grade II and III OTs are 12 and 3–10 years, respectively, while those with WHO grade II and III ATs are six to eight years for grade II and three years for grade III (6).
In terms of treatment approach, extensive resection is associated with longer overall survival in low- and high-grade gliomas. However, this can be difficult if the tumor involves the eloquent area (7–9). In that case, since oligodendrogliomas are chemo-responsive (procarbazine, lomustine, and vincristine) tumors, treatment could be partial resection, followed by adjuvant chemotherapy and radiation therapy (10,11). Accordingly, the preoperative distinction of OT from AT would facilitate the planning of the extent of resection. Therefore, the preoperative differentiation OT from AT is important.
Conventional magnetic resonance imaging (MRI) characterizes oligodendrogliomas by calcifications and cortical locations (2,12,13). However, calcifications are present in only 34–80% of oligodendrogliomas. Cortical involvement becomes more frequent with increasing size of high-grade gliomas (13). The presence of calcification and findings of cortical involvement in OT are not always available. With conventional MRI, it is not easy to differentiate OT from AT.
In terms of histopathology, OT has been known to show a branching pattern of vascularity, distinctively different from AT (14). Previous pathologic studies showed that OT exhibit neovascularization and vascular hyperplasia in both low- and high-grade tumors, while AT show microvascular hyperplasia only in high-grade tumors (15). Perfusion MRI has been used to characterize the tumor on the basis of tumor biology and the degree of neoangiogenesis (15–17). With dynamic susceptibility contrast-enhanced (DSC) MRI, the comparison studies between grade II OT and AT have revealed that higher cerebral blood volume (CBV) is shown in grade II OT than in AT due to branching vascular pattern of OT (15,18,19). However, to our knowledge, the comparison study with dynamic contrast-enhanced (DCE) MRI has not been performed in distinguishing OT from AT. The parameters derived from DCE MRI, especially volume transfer constant and extravascular extracellular volume fraction, are known to be related with the vessel permeability and leakage space (8,17). Therefore, we hypothesized that the permeability parameters derived from DCE MRI would be different between OT and AT. The purpose of this study was to investigate the perfusion parameters that differentiate grade II and III OT from grade II and III AT, using DSC and DCE MRI.
Material and Methods
Patients
This study was approved by our institutional review board and the requirement for informed consent was waived in accordance with the requirements of a retrospective study. Between January 2009 and September 2016, 39 consecutive patients with surgical confirmation of OTs or ATs (WHO grades II and III) were enrolled retrospectively. The individuals who were enrolled in a previously published article, from January 2009 to December 2015, were also included in this study (20). Tumors were classified according to the World Health Organization 2016 (1). Glioblastomas (WHO grade IV) were excluded from the study. The inclusion criteria required that the patients underwent both DSC and DCE MRI preoperatively and all tumors were surgically removed. Thirty-nine patients were included (19 men, 20 women; mean age = 43.6 years; age range = 21–82 years). The patients were classified into two groups: the oligodendroglial tumor group (OT, n = 19; mean age = 47 years, age range = 28–73 years) and the astrocytic tumor group (AT, n = 20; mean age = 40 years, age range = 21–82 years). The OT group (n = 19) included oligodendroglioma, IDH-mutant and 1p19q-codeleted (grade II) in 12 patients, and anaplastic oligodendroglioma, IDH-mutant and 1p19q-codeleted (grade III) in seven patients. The AT group (n = 20) included seven cases of diffuse astrocytoma and 13 cases of anaplastic astrocytoma.
MRI protocol
All patients underwent 3-T imaging (Verio; Siemens Healthcare, Erlangen, Germany) with a 12-channel head coil. The conventional MR protocol included T1-weighted (T1W) imaging performed before and after contrast enhancement, a transverse T2-weighted (T2W) imaging, and a transverse fluid-attenuated inversion recovery (FLAIR). The parameters for each sequence were as follows: T1W image with gradient echo (TR = 250 ms; TE = 3.5 ms; flip angle = 70°; field of view [FOV] = 220 × 220; section thickness = 5 mm), T2W images with turbo spin-echo (TR = 5500 ms; TE = 93 ms; echo-train factor = 18; flip angle = 150°; FOV = 220 × 220; section thickness = 5 mm). We obtained FLAIR with the following parameters: TR =9000 ms; TE = 2500 ms; inversion time (TI) = 95 ms; echo-train factor = 12; flip angle, = 150°; FOV = 220 ×220; section thickness = 5 mm. Contrast enhancement T1W images were performed after intravenous administration of gadobutrol (Gadovist, Bayer Healthcare, Berlin, Germany), at a dose of 0.1 mmol/kg body weight. The parameters of T1 contrast enhancement (T1CE) with volumetric interpolated breath-hold examination (VIBE) were as follows: TR = 5.1 ms; TE = 1.8 ms; flip angle = 2° and 15°, number of excitations (NEX) = 8 and 6; section thickness = 4 mm; FOV = 250 × 250 mm; matrix size = 192 × 138 mm.
All patients underwent both DCE and DSC MRI. For DCE MRI, three-dimensional gradient echo sequences with 20 sections were obtained. The parameters were as follows: TR = 4.3 ms; TE = 1.5 ms; flip angle = 15°; NEX = 1; section thickness = 4 mm; FOV =250 × 250 mm; matrix size = 192 × 138 mm. The administration of 0.1 mmol/kg of body weight of gadobutrol at a rate of 4 mL/s by power injector (Spectris Solaris, Medrad, Warrendale, PA, USA) was followed by a bolus injection of 25 mL saline. A total of 20 sections were acquired as a series of 1000 images at 50 time points, with a temporal resolution of approximately 5.5 s.
DSC MRI was performed using a gradient-echo echo-planar sequence (TR = 1880 ms; TE = 30 ms; flip angle = 90°; NEX = 1; section thickness = 5 mm; 25 sections; FOV = 230 × 230 mm; matrix size = 128 ×128 mm). After patients underwent a baseline period of four imaging volumes (7.6 s), a rapid bolus of contrast agent was administered at a dose of 0.15 mmol/kg body weight, at a rate of 4 mL/s, using a power injector. The bolus of contrast material was immediately followed by a 25-mL saline flush at the same rate. DSC data collection comprised a total of 60 series and the total acquisition time was 1 min 58 s.
Image post-processing and analysis
DSC and DCE images were processed using a commercial software package (Nordic ICE, Nordic NeuroLab, Bergen, Norway). Perfusion parametric maps were obtained. We used the CBV from DSC MRI, and four parametric maps from DCE MRI: volume transfer constant (Ktrans); flux rate constant (Kep); fractional volume of extravascular extracellular space (Ve); and plasma volume fraction (Vp) (21,22). For DSC MRI, the Boxerman method for correction of contrast leakage was applied (23,24). The relative CBV (rCBV) was computed with numeric integration of the curve (25). Normalization of the CBV to globally determined mean value was performed automatically by the software. The global mean value was calculated from all pixels determined to represent normal brain tissue, excluding noisy and otherwise abnormal dynamic curves.
For DCE MRI, the perfusion analysis method on the basis of the two-compartment extended Tofts model was used (21). In this study, the baseline T1 value was fixed at 1000 ms (8,26,27). For each tumor, the arterial input function was determined in the intracranial tumor-supplying artery in the region of interest (ROI). By consensus, the ROIs were manually defined by two neuroradiologists (JYL and KJA) in T2 high signal intensity area on the T2W imaging and the co-registered parametric maps. For a voxel-wise histogram analysis, the mean, and the 5th, 25th, 50th, 75th, and 95th percentiles of each parameter were obtained.
Statistical analysis
We applied an exploratory statistical analysis. Continuous variables are expressed as means and range. The Kolmogorov–Smirov test was performed to determine whether the values are normally distributed. Since the test revealed that the distribution was not normal, the results of the histogram analysis between OT and AT were compared by Mann–Whitney test. Univariable and multivariable logistic regression were used to determine the best predictors for the differentiation of OT from AT. A receiver operating characteristic (ROC) curve analysis was performed to measure a diagnostic performance of each parameter. We performed the subgroup analysis with Mann–Whitney test between grade II OT and AT and between grade III OT and AT, and also performed the comparisons with Mann–Whitney test between grade II and grade III of each OT and AT. Statistical analyses were performed using commercially available software (SPSS, version 18 for Windows, SPSS, Chicago, IL, USA and MedCalc, version 9.3.0.0. MedCalc Software, Mariakierke, Belgium). A value of P < 0.008 (0.05/6) was considered to be statistically significant for the correction of multiple comparison.
Results
Result of histogram analysis between OT and AT.
Data for Ktrans and Kep are in units of min–1 and data for Ve and Vp are percentages.
Numbers represent mean ± standard deviation.
The significance threshold for difference was set at a P value < 0.008 (0.05/6) for multiple comparison correction. P < 0.008.

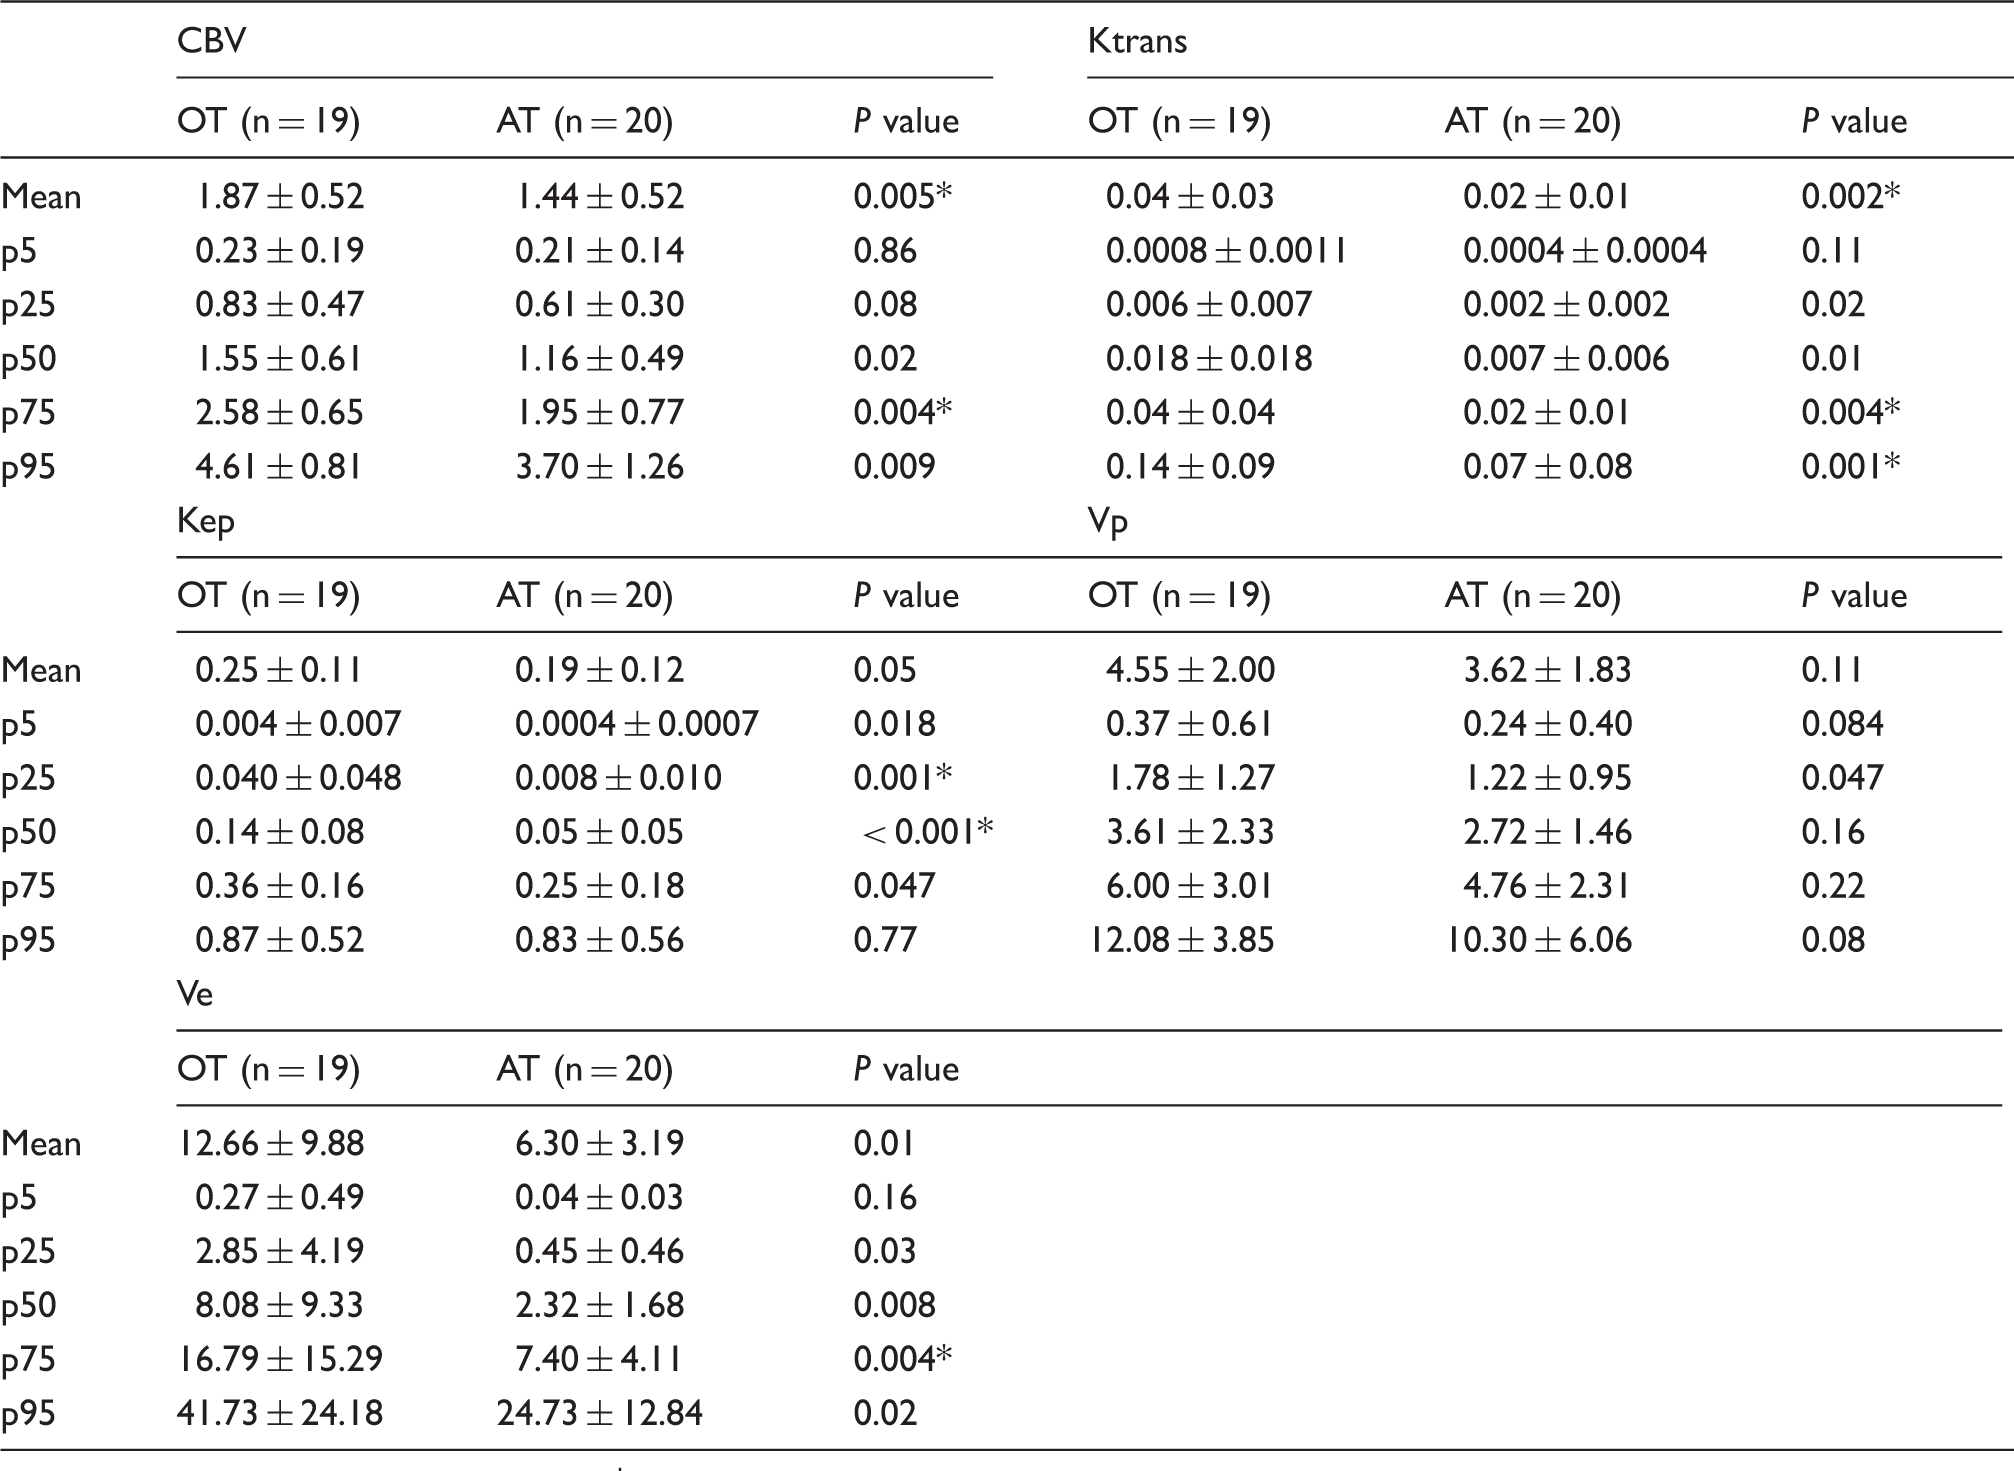
Images in a 57-year-old patient with IDH mutant, 1p19q-codeleted oligodendroglioma (grade II). (a) T2W image, (b) T2W image with ROI, (c) rCBV, (d) Ktrans, (e) Kep. The value of the 95th Ktrans and 50th Kep is 0.17 min–1 and 0.19 min–1.
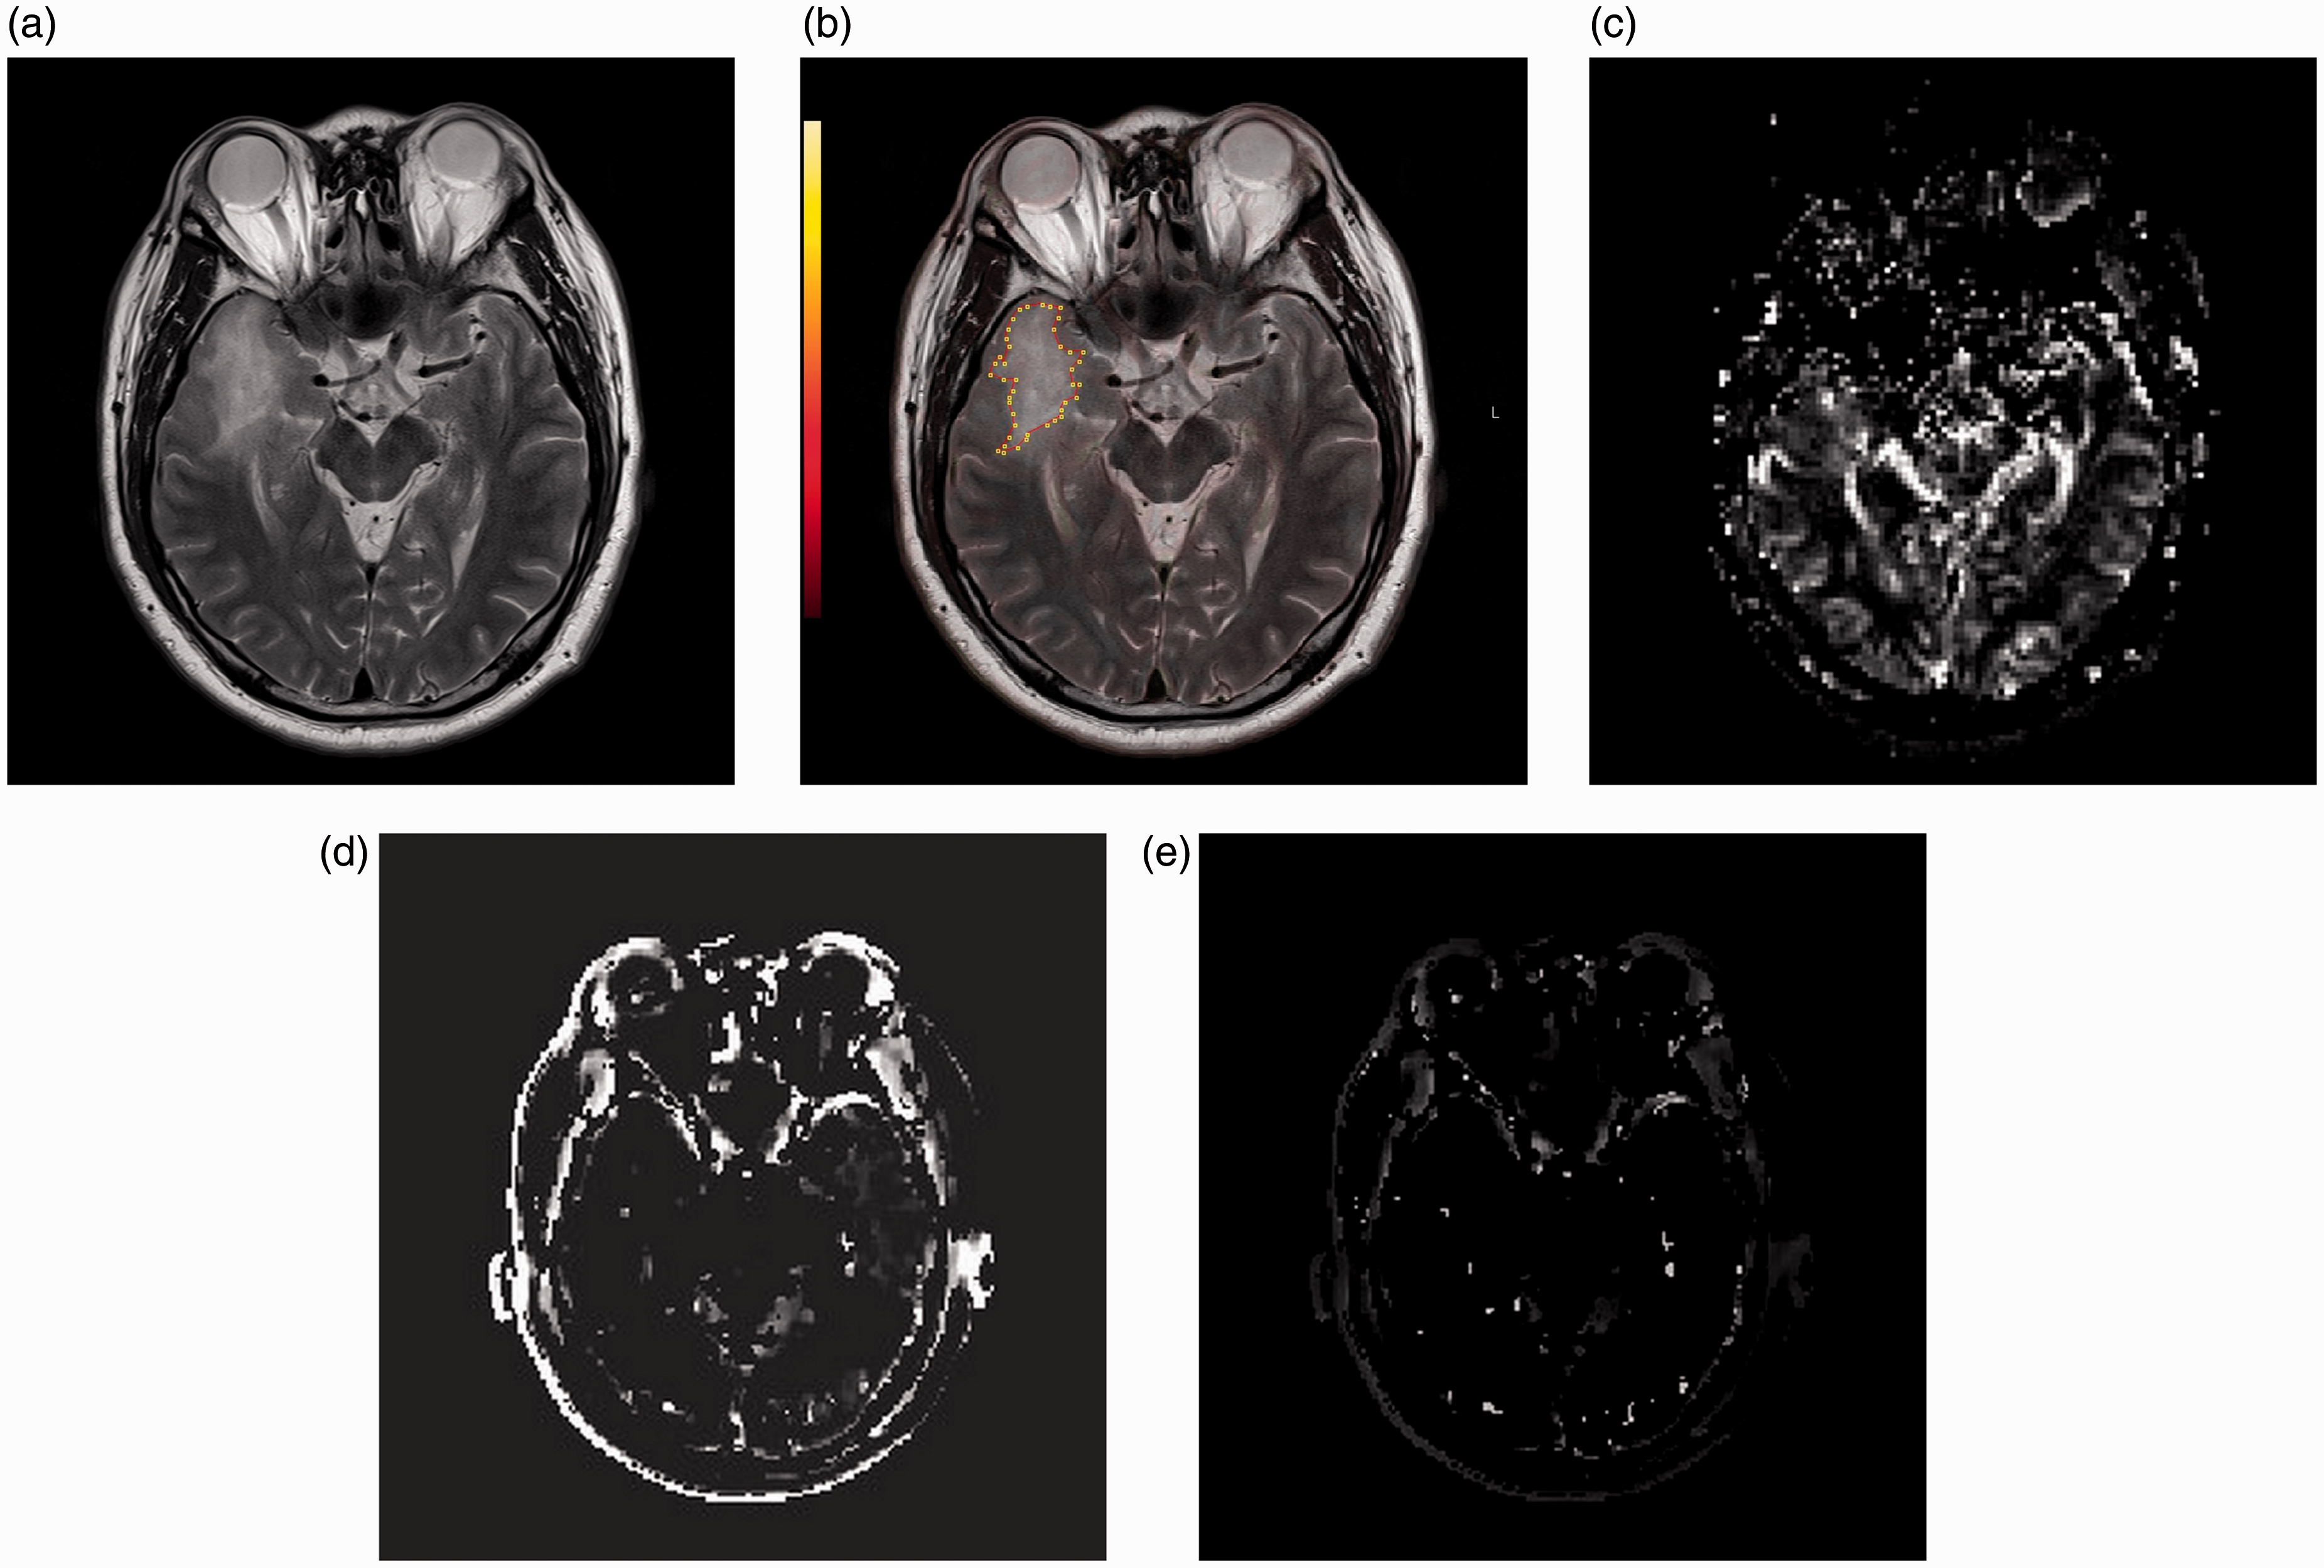
Images in a 42-year-old patient with diffuse astrocytoma (grade II). (a) T2W image, (b) T2W image with ROI, (c) rCBV, (d) Ktrans, (e) Kep. The value of the 95th Ktrans and 50th Kep is 0.08 min–1 and 0.04 min–1.
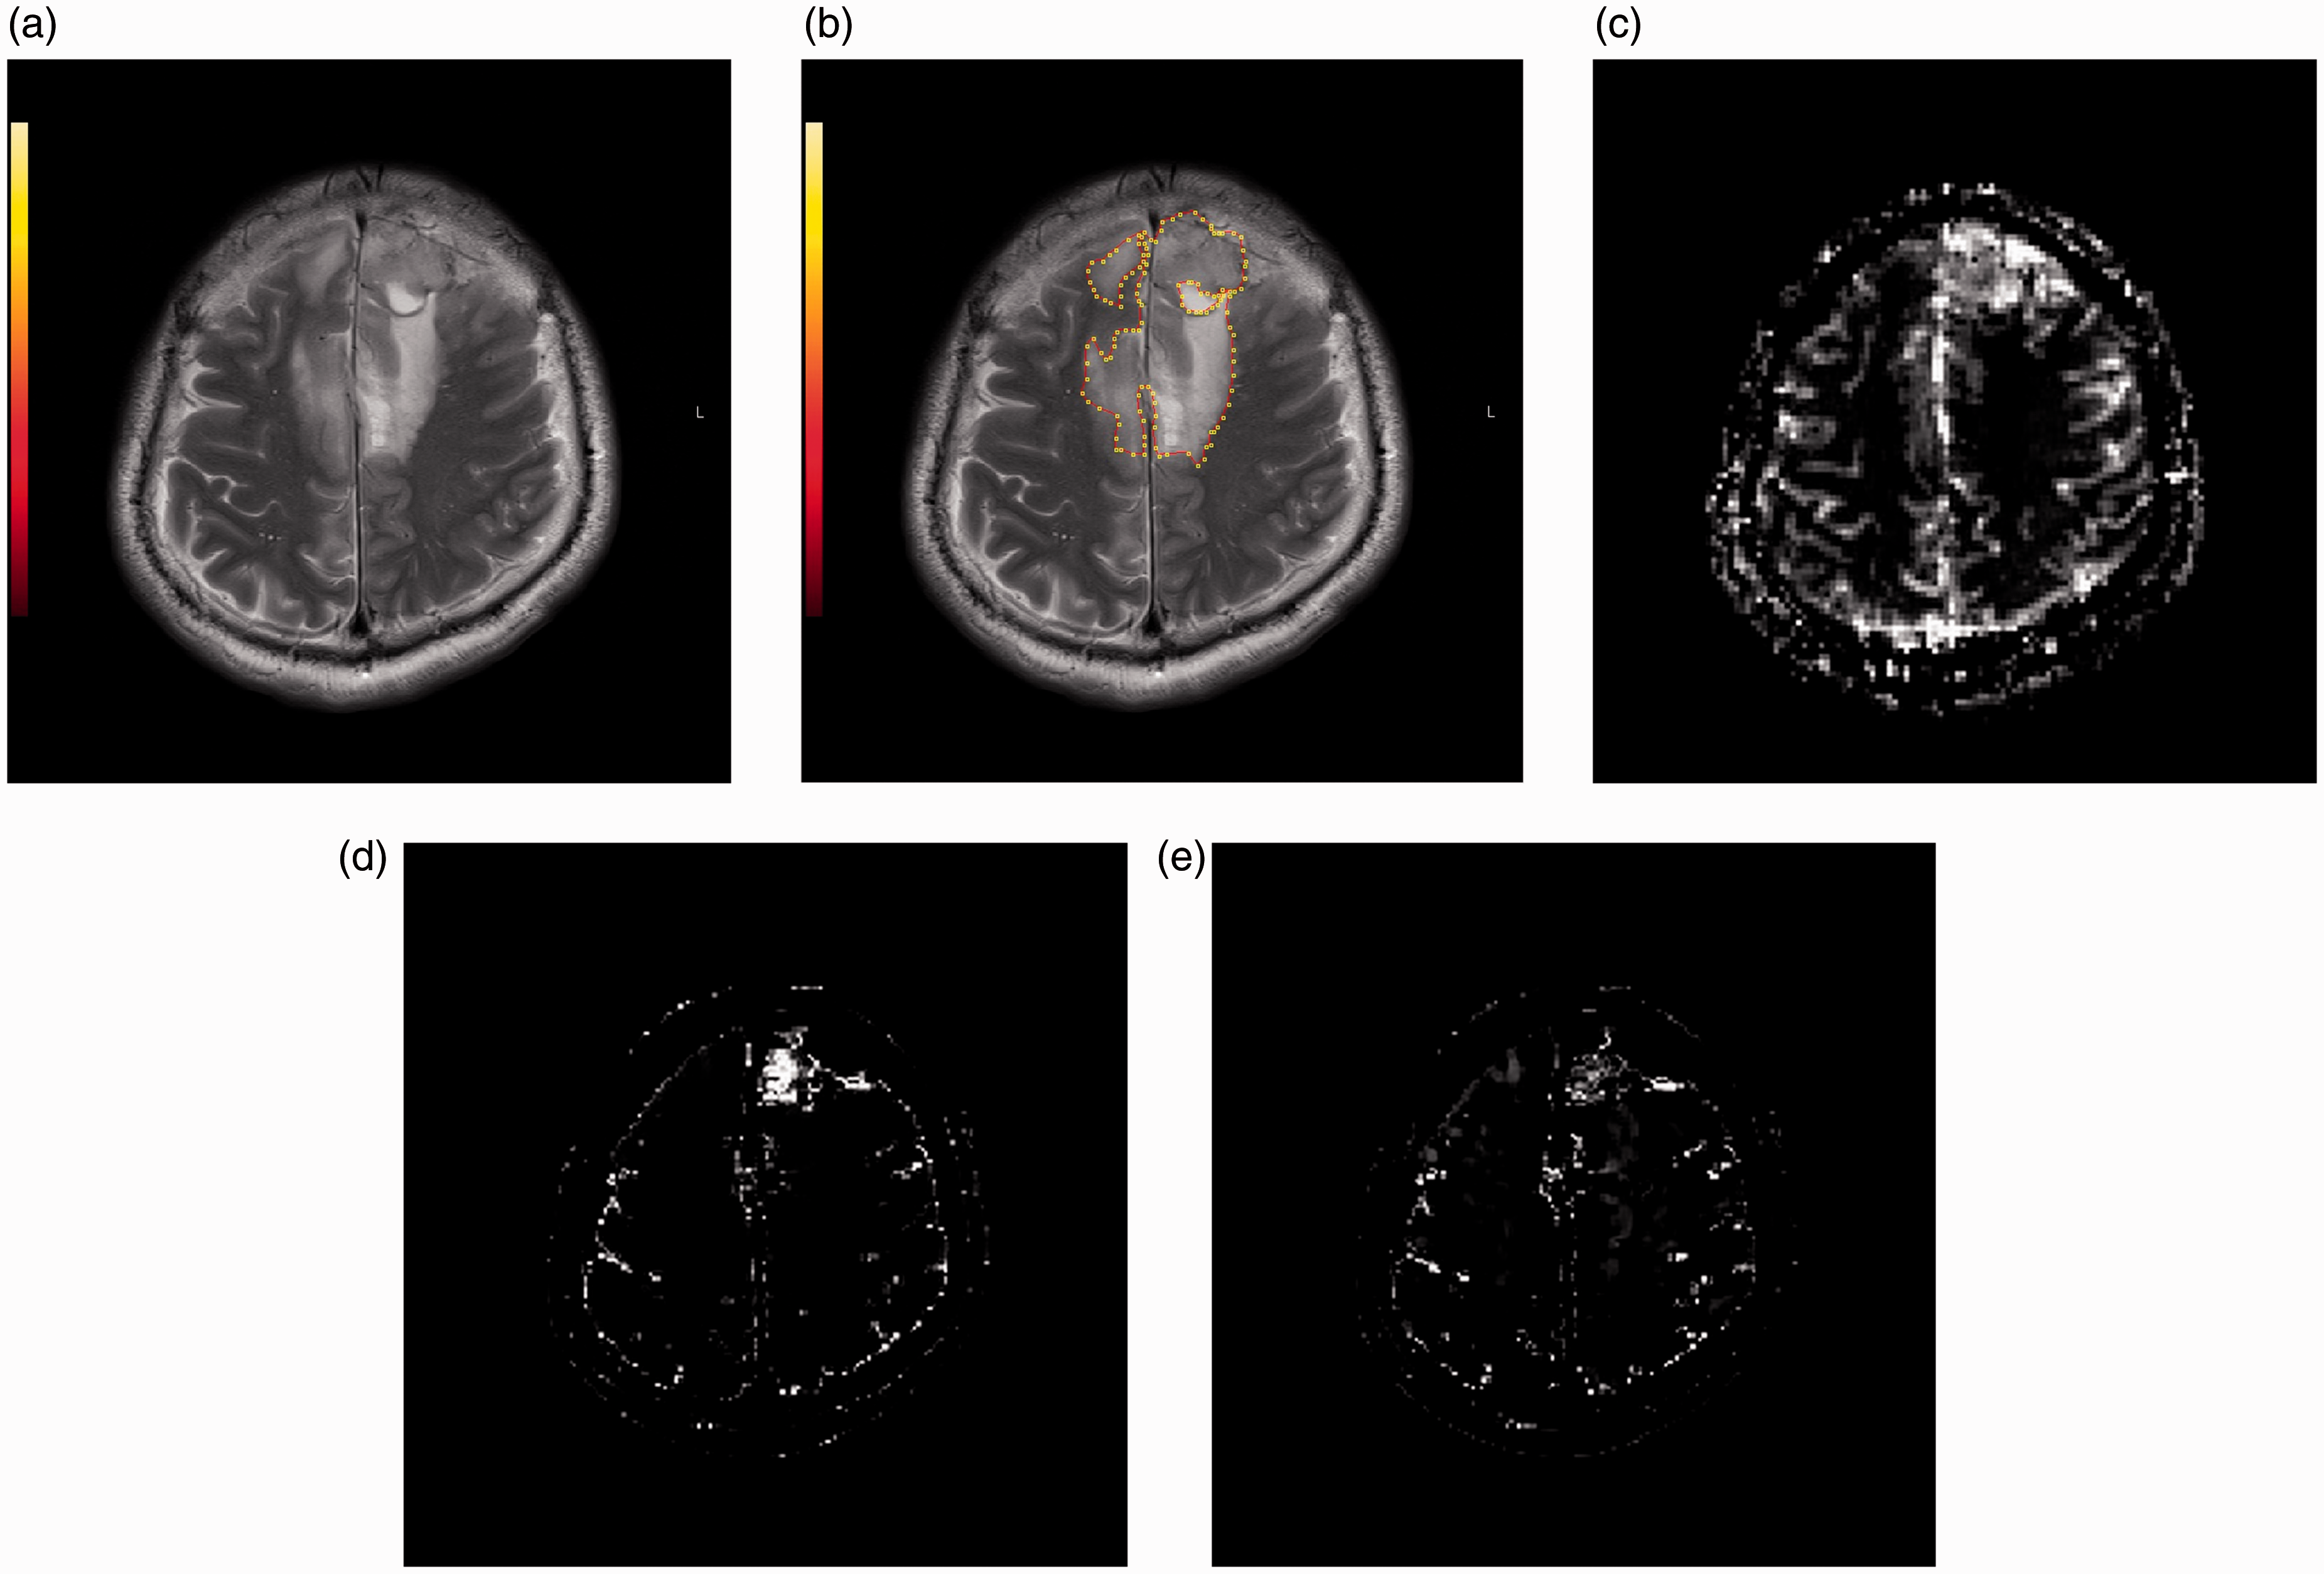
Images in a 54-year-old patient with IDH mutant, 1p19q-codeleted anaplastic oligodendroglioma (grade III). (a) T2W image, (b) T2W image with ROI, (c) rCBV, (d) Ktrans, (e) Kep. The value of the 95th Ktrans and 50th Kep is 0.09 min–1 and 0.07 min–1.
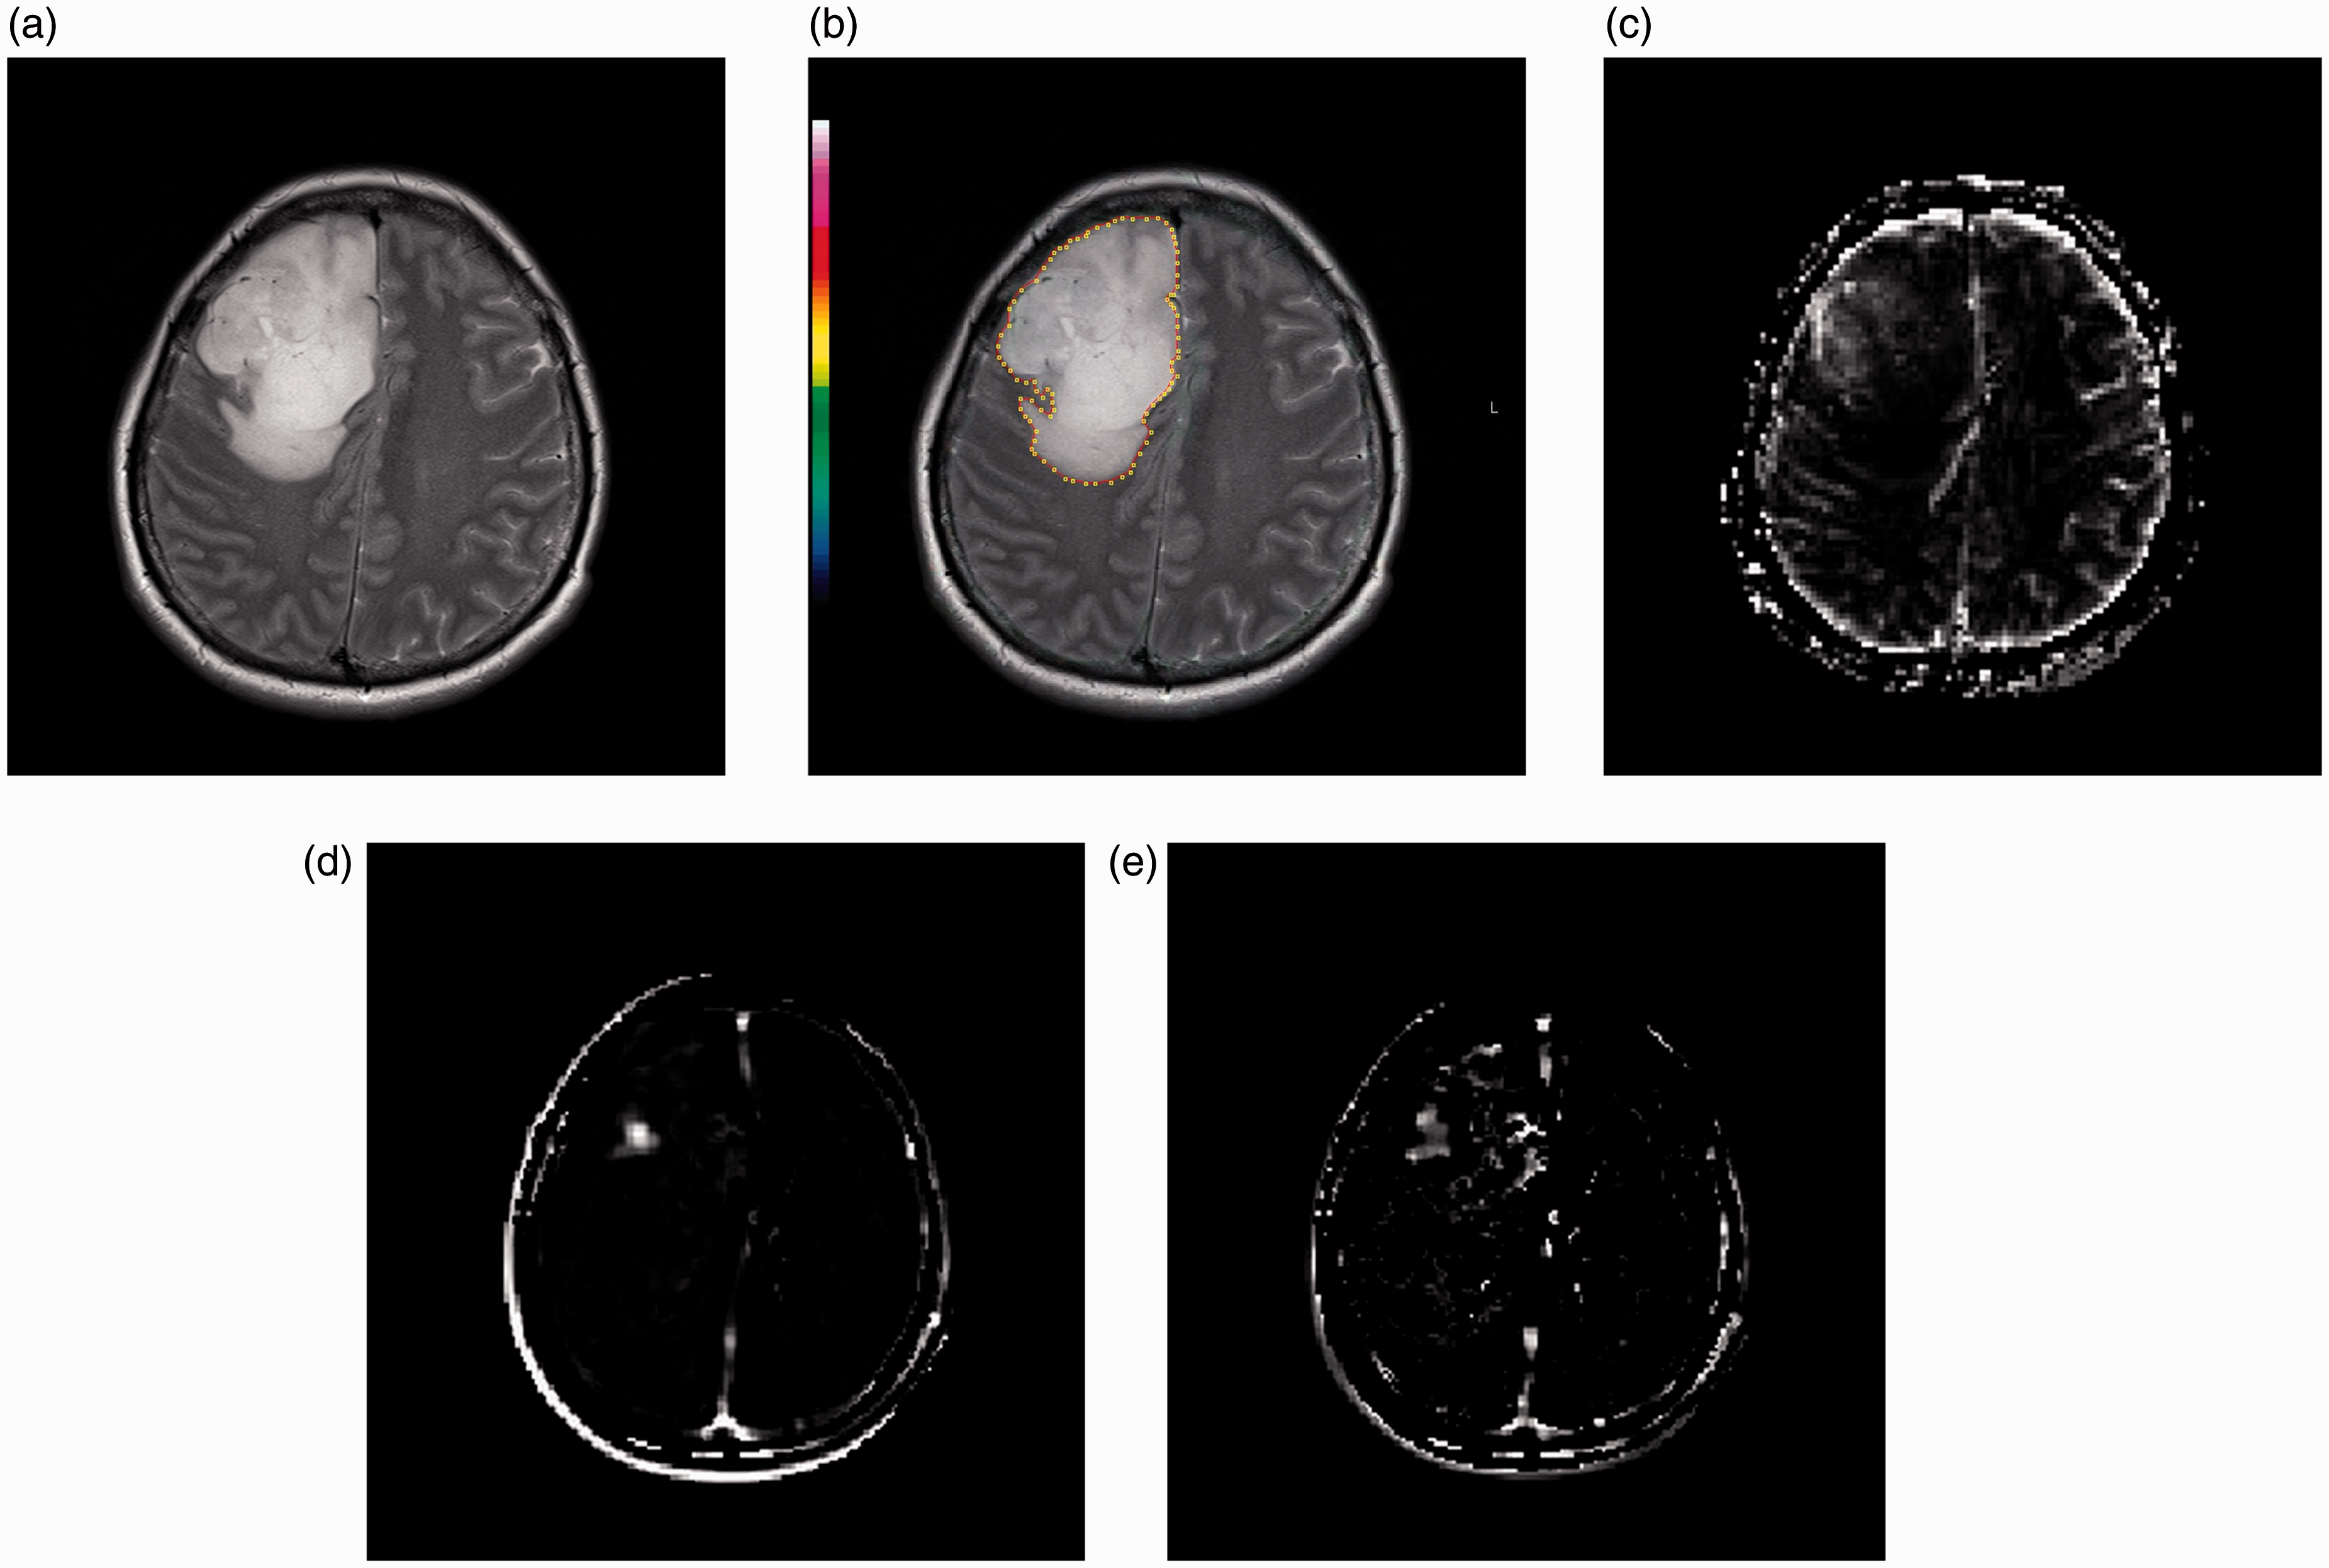
Images in a 46-year-old patient with anaplastic astrocytoma (grade III). (a) T2W image, (b) T2W image with ROI, (c) rCBV, (d) Ktrans, (e) Kep. The value of the 95th Ktrans and 50th Kep is 0.05 min–1 and 0.03 min–1.
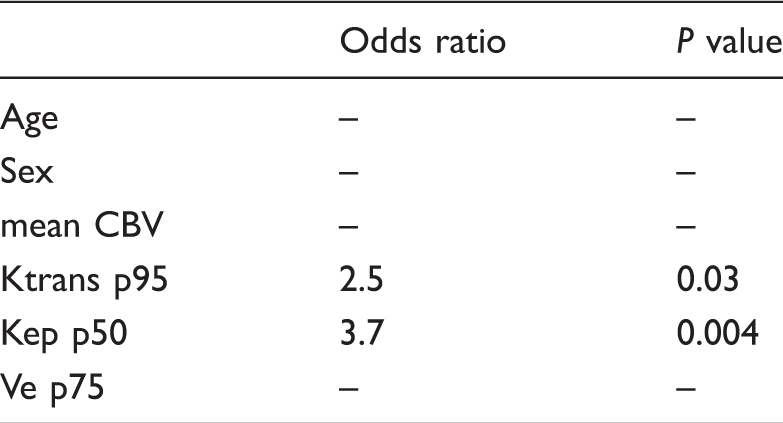
Multivariable logistic regression analysis for differentiation of OT from AT.
The area under the curve (AUC) from the ROC curve analysis is shown in Fig. 5. The AUC of 95th percentile of Ktrans and 50th percentile of Kep were 0.80 and 0.81, respectively. With a cutoff of 0.076 (min–1) of the 95th Ktrans, the sensitivity was 73.7% and the specificity was 85%. With a cutoff of 0.072 (min–1) of the 50th Kep, the sensitivity was 73.7% and the specificity was 85%.
ROC curve analysis of 95th Ktrans and 50th Kep for differentiation of OT from AT.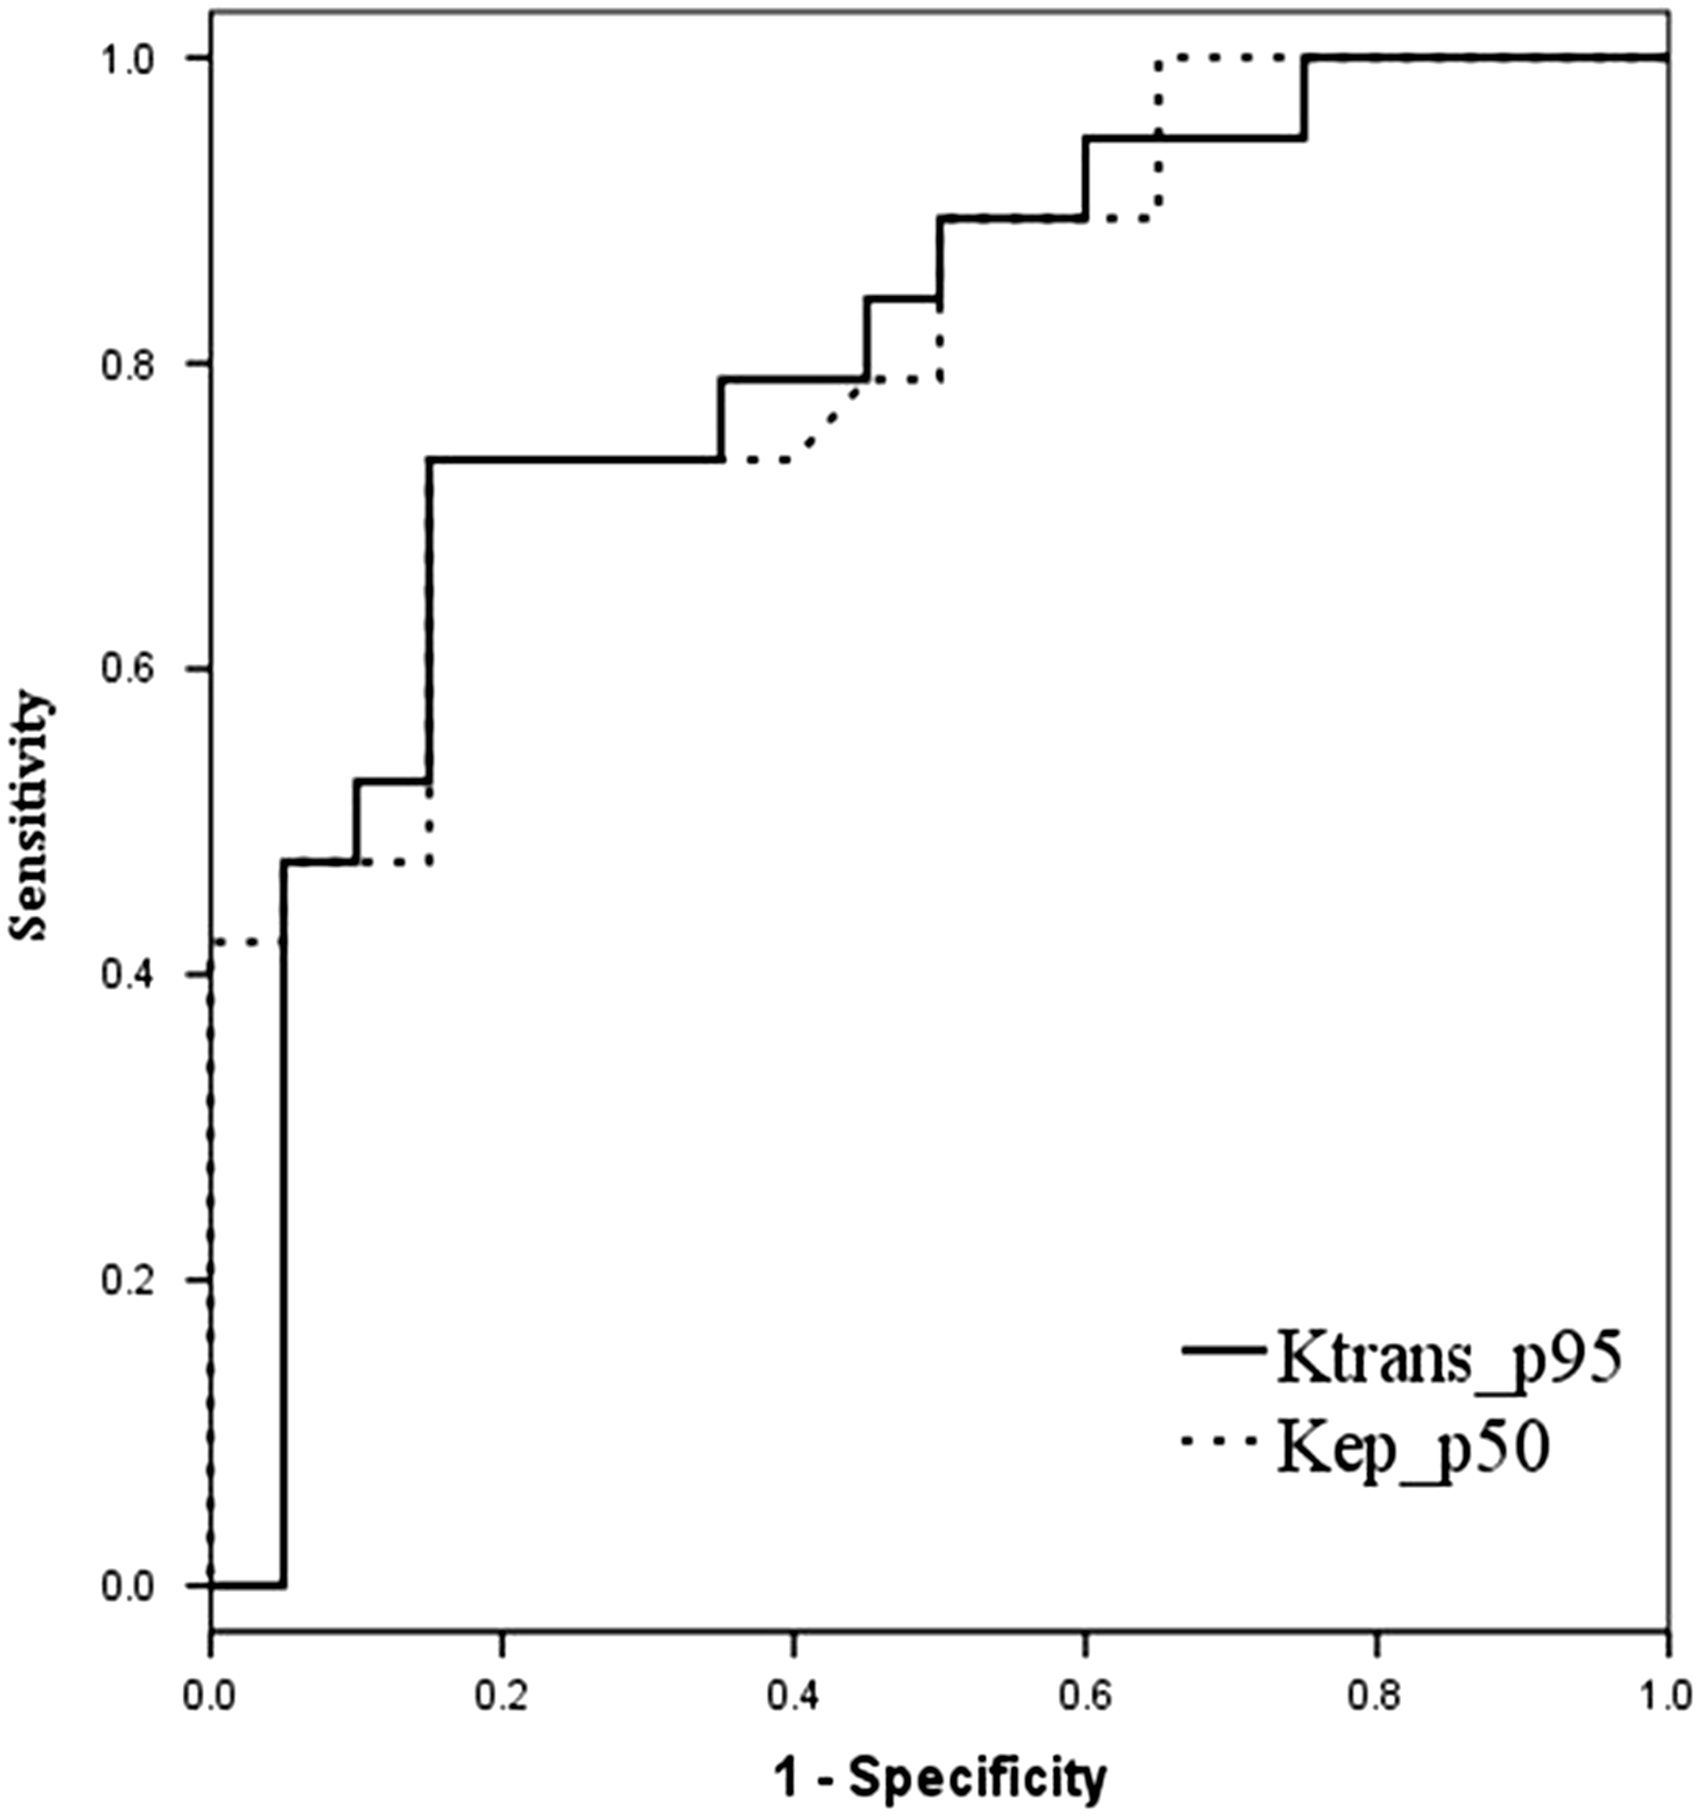
Divided into WHO grades, OT included 12 patients (63.2%) of grade II and seven patients (36.8%) of grade III. AT included seven patients (35%) of grade II and 13 patients (65%) of grade III. For the subgroup analysis of DSC and DCE parameters between grade II OT and AT, no significant differences were noted. However, there was a tendency toward higher values of DSC and DCE parameters in OT than AT (Suppl. Table 1). Comparison between grade III OT and AT revealed that the 50th percentile of Kep was significantly higher in grade III OT (P = 0.006, Suppl. Table 2).
No significant differences were noted in DSC and DCE parameters of the subgroup analysis between grade II and grade III within OT and AT, respectively. In OT, grade III OT showed tendencies toward higher values in all DSC and DCE parameters except for Vp. In AT, grade III AT showed higher values of rCBV and Vp.
Discussion
The present study demonstrates that the values of DCE-derived parameters were higher in OT than in AT, and they could well differentiate OT from AT. The multivariable logistic regression analysis showed that the 50th percentile of Kep and the 95th percentile of Ktrans were the best parameters for predicting OT.
Ktrans and Kep were significant parameters for distinguishing OT from AT in the logistic regression analysis. Based on the two-compartment pharmacokinetic models, the parameters derived from DCE MRI reflect the microvascular circulation in tumor tissues (17,22,28). Ktrans is characterized by endothelial permeability of the blood vessels (8). In gliomas, a high Ktrans has been reported to be associated with increased angiogenesis, vascular endothelial growth factor (VEGF) expression, and immature and hyperpermeable vessels (2,4). Kep indicates a rate constant of backflux from extravascular extracellular space to plasma. It is derived from the equation, Ktrans/Ve (21). Considering that the Ve is associated with leakage space and permeability, Kep could therefore be related to the vascular permeability (8,29). Hence, the result indicating that OT has higher Ktrans and Kep, might be related to the higher vascular permeability than seen in the AT.
Previous studies revealed the different vascular pattern between OT and AT. Compared with AT, OT has chicken wire pattern of vascularity, resulting higher microvessel density which is related to the high rCBV on DSC MRI (14,15). Also, OT shows capillary neovascularization and vascular proliferation in low- and high-grade tumors, whereas AT shows vascular proliferation in only high-grade tumors (15). This is supported by the high expression of VEGF and hypoxia-inducible factor-1α in the OT (15,30). VEGF is regarded as a major regulator in tumor angiogenesis and has an effect on endothelial membrane with increment of transendothelial permeability (31,32). Therefore, the result that OT has higher permeability values could be supported by the pathologic finding of higher VEGF expression. This result is in concordance with the study done by Kapoor et al. (16), which reported a strong association between OT with 1p19q loss of heterozygosity and higher VEGF.
As for the subgroup analysis based on the WHO grade, although statistically not significant, OT showed higher Ktrans than that of AT in both low- and high-grade. This result could be supported by the study by Maia et al., which revealed that low-grade OT showed positive VEGF staining, while low-grade AT showed negative VEGF staining (31). Also, Christov et al. demonstrated the expression of VEGF in 31 of 34 oligodendrogliomas (30). Regarding the comparison between high-grade OT and AT, there was a tendency toward higher Ktrans in OT in this study. This result could be supported by the study by Chan et al. which demonstrated that anaplastic oligodendrogliomas showed moderate to strong VEGF expression, whereas anaplastic astrocytomas showed VEGF expression at a lower level (33).
So far, perfusion parameters have been correlated with the prognosis in brain tumors. Arguably, several studies have reported that a higher Ktrans is related to a poorer prognosis of glioma (29,32,34). However, our result reveals that OT exhibits higher Ktrans than AT, and this is in contrast to the fact that oligodendrogliomas have a better prognosis than astrocytomas. The reason for this discrepancy remains unclear. However, it could be attributed to the tumors included in this study. We included only IDH mutant and the 1p19q co-deleted OT in the tumor subjects. The 1p19q codeletion is known to be associated with chemo responsiveness and good prognosis in oligodendrogliomas. Accordingly, the high Ktrans and Kep might therefore be related to the chemo-responsiveness and good prognosis. The reason for the relationship between high permeability and chemo responsiveness in OT is difficult to explain. However, we assume that the chemo-responsiveness of OT could be related to higher permeability of the blood–brain barrier, which induces enhanced drug transport to the tumor through the blood–brain barrier.
Attempts to differentiate OT from AT have been performed using perfusion CT or MRI (2,3). Our finding that OT showed significantly higher Ktrans than AT is in contrast to the study by Narang et al. (2), who reported that high-grade OT showed significantly lower surface permeability than high-grade AT by perfusion CT, while there was no difference in surface permeability between low-grade OT and low-grade AT. The difference between our study and that by Narang et al. is that the latter included glioblastomas in the astrocytoma group, and therefore the results could be overestimated.
This study has several limitations. First, the number of participants in each group is small. Second, we did not evaluate radiologic–pathologic correlations. The results of Ktrans and Kep could be correlated with VEGF staining or immunohistochemistry for CD31, which highlights endothelial cells. Further studies are required to analyze the correlation between MR permeability parameters and histopathological makers for the differentiation of OT from AT.
In conclusion, the parameters derived from DCE MRI could facilitate differentiation of OT from AT. Permeability-related parameters, including Ktrans and Kep, are significant parameters for distinguishing OT from AT.
Footnotes
Declaration of Conflicting Interests
The author(s) declared no potential conflicts of interest with respect to the research, authorship, and/or publication of this article.
Funding
The author(s) received no financial support for the research, authorship, and/or publication of this article.
References
Supplementary Material
Please find the following supplemental material available below.
For Open Access articles published under a Creative Commons License, all supplemental material carries the same license as the article it is associated with.
For non-Open Access articles published, all supplemental material carries a non-exclusive license, and permission requests for re-use of supplemental material or any part of supplemental material shall be sent directly to the copyright owner as specified in the copyright notice associated with the article.