




Abstract
Background
The value of the proximal extension of the clot in risk stratification of pulmonary embolism (PE) has not been established. The mean bilateral proximal extension of the clot (MBPEC) is a computed tomography (CT) radiological score, where initial evaluation showed promising results considering its ability in predicting the severity of PE.
Purpose
To explore the possible associations between MBPEC and PE-severity parameters, short- and long-term outcomes of PE, and inter-observer agreement.
Material and Methods
Patients diagnosed with PE at Østfold Hospital, Norway during 2003–2011 were identified. MBPEC was calculated by calculating the mean of a score in the range of 1–4 assigned for the most proximal extension of the clot in each lung: sub-segmental; segmental; lobar; and main pulmonary arteries. Medical records were reviewed to capture clinical, biochemical, and management-associated data (thrombolysis, admission to ICU).
Results
The mean age of 245 included patients was 55 ± 16 years; 42% were women. Patients with higher MBPEC scores had a significantly higher pulse rate and lower oxygen saturation. MBPEC score <4 predicted a negative troponin value with a negative predictive value of 90% (95% confidence interval [CI] 81–95). Patients with MBPEC 4 were 5.3 times more likely to have elevated troponin (odds ratio [OR] 5.3, 95% CI 2.0–14.3). MBPEC score of 4 was independently associated with admission to ICU (OR 3.8, 95% CI 1.8–7.9). The inter-observer agreement was excellent; weighted kappa 0.82.
Conclusion
MBPEC is associated with PE-severity parameters and can predict short-term adverse outcomes.
Keywords
Introduction
Acute pulmonary embolism (PE) is a potentially fatal disease with mortality rates in the range of <1%–15% (1). In order to choose the most appropriate patient management strategy, guidelines recommend risk stratification (2,3). For those patients presenting with hemodynamic shock the treatment of choice is fibrinolysis (2). Conversely, patients presenting with stable clinical parameters and a low pulmonary embolism severity index (PESI) score may be managed as outpatients (2). However, risk assessment in patients with submassive or intermediate low- or high-risk PE is still debated and represents a challenge for the clinician. Deterioration of the patients with PE is mainly attributed to right ventricular dysfunction (RVD) (4,5). Echocardiography is considered to be the gold standard method of assessing the right ventricle. However, this method is not available around the clock in most hospitals and is operator-dependent. Many studies have evaluated the role of various cardiac biomarkers and radiological parameters as potential markers for RVD in order to enable more feasible risk stratification (6,7). Cardiac troponins have in several studies been found to correlate with all-cause mortality and hemodynamic deterioration (6,8). This has resulted in international guidelines recommending the incorporation of cardiac biomarkers in severity assessment of acute PE (2,3).
In addition to being the first-line technique for diagnosing PE, computed tomography pulmonary angiogram (CTPA) also has the potential to further risk stratify patients with PE (9). CTPA findings such as right-to-left ventricular diameter ratio (RV/LV ratio), septal bulging, and contrast reflux to the inferior vena cava have been shown to be associated with adverse outcomes (7,10–12). However, studies have reported conflicting results with regard to which CTPA parameter most accurately risk stratifies the patients (13). In addition to these parameters, several CTPA scores have been shown to be associated with RVD and adverse outcomes (14,15). The pulmonary artery obstruction index (PAOI) is one such score, which assesses the degree of obstruction caused by the PE. The scoring accounts for both lungs and is based on both the proximal extension of the clot and the presence of a total or partial occlusion of a pulmonary artery (16). PAOI is the best validated tool and the most widely used score for quantifying clot burden in the research setting. However, it is rarely used in clinical practice due to its complexity and lack of experience among radiologists with this score. The most proximal extension of the clot is a descriptive method of reporting a PE. Although it is intuitive to interpret a more proximal extension of the clot as more severe, it lacks a standardized method of reporting and does not account for the contralateral lung. Previous studies have revealed that higher clot burden is associated with a more complicated clinical course, and the overall performance in predicting adverse outcomes can be improved by combining clot burden assessment with other risk stratification (17). Nevertheless, international guidelines do not support their use in risk stratification algorithms (2,3).
In 2007, Ghanima et al. (18) presented a simple radiological scoring system based on calculating the mean bilateral proximal extension of the clot (MBPEC). Although found to be highly correlated to PAOI and RVD, the cohort in which it was explored was relatively small (n = 99). Furthermore, the primary aim of the study was to study the correlation between MBPEC and available thrombus load scores rather than the potential association of MBPEC and severity parameters.
Accordingly, the aims of the present study were to investigate, in a larger cohort, the relationship between the MBPEC score at diagnosis and various clinical, biochemical, and radiological PE severity markers, the short- and long-term outcomes of PE, as well as the inter-observer reliability of the score.
Material and Methods
Study design, setting, and participants
This retrospective study included patients with PE diagnosed at Østfold Hospital, Norway between 2003 and 2011. Patients were identified from the Østfold Thrombosis Registry (TROLL). All patients with an objectively confirmed diagnosis of PE by CTPA were eligible for study inclusion. Furthermore, the CTPA images needed to have adequate image quality in order to calculate the MBPEC score. The study was approved by the Regional Norwegian Ethics Committee, and written and informed consent was obtained for every patient.
Data collection
Two of the authors (JG and FB) reviewed the medical records of the participants. The reviewers were blinded to the MBPEC scores and RV/LV ratios. In addition to age and sex, the following clinical parameters were extracted from patients’ electronic medical records: pulse rate (beats per minute); systolic blood pressure (SBP; mmHg); and peripheral oxygen saturation (SpO2) at the time of diagnosis. It was also noted if the patients had a clinically significant fall in SBP, which was defined as a decrease of > 40 mmHg during a 15-min period during the hospital stay. Co-morbidities including congestive heart failure, chronic lung disease (either obstructive or restrictive), and malignancy (active cancer or chemotherapy within the past six months) were also recorded. The PESI score was calculated retrospectively.
Biochemical parameters were extracted from laboratory databases. Quantitative real-time cardiac Troponin-T (Roche Diagnostics GmbH, Mannheim, Germany) or Troponin-I (Siemens Healthineers, Erlangen, Germany), which were assayed during the first 48 h after the establishment of the diagnosis of PE, were recorded. Since different assays were used during the study periods, this outcome was dichotomized into positive or negative.
As this was a retrospective observational study, patients were managed and treated at the discretion of the treating physician. Management associated outcomes were regarded as either receiving thrombolytic treatment (yes or no) or admission to the intensive care unit (ICU) (yes or no).
Computed tomography
All study participants performed a CTPA as an initial diagnostic evaluation. Low-osmolar or iso-osmolar contrast media was injected through the cubital vein by power injector. A high injection rate with a uniphase injection of up to 5 mL/s (1.7 g iodine/s) was used and the scanning delay was set by continues bolus tracking of the pulmonary trunk. Product names of the iodine contrast agents used during the study period are given in Appendix A. CT scans were obtained with 40-slice or 64-slice scanners (Brilliance 40 or Brilliance 64; Phillips, Eindhoven, The Netherlands or Aquilion ONE; Toshiba, Tochigi, Japan). Images were acquired in the caudocranial direction and reconstructed to 3-mm slices in the transversal plane (from 2006, with the addition of reconstructions in the sagittal and coronal planes).
Assessment of MBPEC score and RV/LV ratio
The MBPEC score was calculated retrospectively. For each lung, the most proximal extension of the embolus is identified and categorized as follows: 1 = sub-segmental; 2 = segmental; 3 = lobar; and 4 = interlobar arteries, main pulmonary arteries, or pulmonary trunk (Fig. 1). The MBPEC score was then calculated by estimating the mean bilateral score, rounded upwards to the nearest integer. For example, a patient with a PE located in the lobar artery in the right lung and segmental artery in the left lung would receive a score of (3 + 2)/2 = 2.5 which is rounded up to 3.

Schematic illustration displaying how MBPEC is scored. For each lung, the most proximal extension of the embolus was identified and categorized. The most proximal extension for a saddle embolus is the artery proximal to the affected part. The total MBPEC score was the mean value from both lungs rounded up to the nearest integer. MBPEC, mean bilateral proximal extension of the clot.
Left and right ventricular short-axis transversal diameters were measured at the widest points between the inner surface of the compact part of the free wall of right ventricle and left ventricle, respectively, and the surface of the interventricular septum. Original straight transversal CTPA images without reconstructions with the largest ventricular diameters were used for measurements. Both MBPEC and RV/LV ratio were assessed by two radiologists (MS and KJT). In order to analyze inter-observer reliability, 50 randomly selected CT images were independently assessed by two radiologists (MS and JG).
Study endpoints
PE-severity parameters were studied for possible association with MBPEC. Clinical PE-severity parameters included SBP, pulse rate, SpO2, and PESI score at admission. Biochemical PE-severity parameters included elevation in cardiac troponin and radiological parameters represented RV/LV ratio. The short-term management associated outcomes were thrombolytic treatment and/or admission to the ICU.
Statistical analyses
Normally distributed variables were presented as mean ± SD or median (interquartile range [IQR]) if non-normally distributed. Categorical variables were presented as frequencies and percentages.
Student’s t-test or Mann–Whitney U test were used as appropriate for continuous variables when comparisons was made between groups. Categorical variables were analyzed with the chi-square test.
ANOVA or Kruskall–Wallis test was used to compare the distribution of continuous variables and serial groups dependent on Gaussian or non-Gaussian distribution.
Receiver operating characteristics (ROC) analysis was used for identifying the cut-off value for MBPEC for predicting positive troponin, receiving thrombolytic treatment, and being admitted to the ICU. Hereafter, the cut-off value was used in a binary logistic regression model to analyze the ability of MBPEC to predict the odds ratio (OR) for adverse outcomes of thrombolysis and/or admission to the ICU. In order to account for age, gender, hypotension, and co-morbidities, the model in which thrombolytic treatment and admission to the ICU were analyzed, was adjusted for PESI score.
Sensitivity, specificity, positive predictive value (PPV), and negative predictive values (NPV) were calculated using cross tables.
Since MBPEC is scored on an ordinal scale in the range of 1–4, inter-observer reliability was analyzed with the Cohen’s weighted kappa and a value > 0.8 was considered an excellent interrater agreement.
Statistical analyses were performed using Statistical Package for Social Sciences version 24.0 (SPSS Inc., Chicago, IL, USA) and a two-tailed P value <0.05 was considered statistically significant.
Results
Patients
In total, 390 patients were identified from the thrombosis registry with the diagnosis of PE. Of these, 245 patients had objectively confirmed the diagnosis of PE with CTPA and consented to participate in the study. The reasons for excluding 145 patients were: lack of consent; diagnosis by ventilation/perfusion scintigraphy; not having adequate image quality for confirmation of PE diagnosis; and/or calculation of MBPEC score. The mean age of patients was 55 ± 16 years and 42% were women (Table 1). Fifty patients (20%) were admitted to the ICU and 10 (4%) patients received thrombolytic treatment (Table 1).
Characteristics of the study population at diagnosis.

Values are given as n (%) or mean ± SD.
*Pulse rate >100 beats per minute.
†Active cancer or chemotherapy in previous six months.
‡Documented diagnosis of heart failure.
§Chronic obstructive or restrictive pulmonary disease.
**Only available in 147 patients.
DVT, deep vein thrombosis; ICU, intensive care unit; PESI, Pulmonary Embolism Severity Index; RV/LV ratio, right-to-left ventricular diameter ratio on axial CT images; SBP, systolic blood pressure; SpO2, peripheral oxygen saturation.
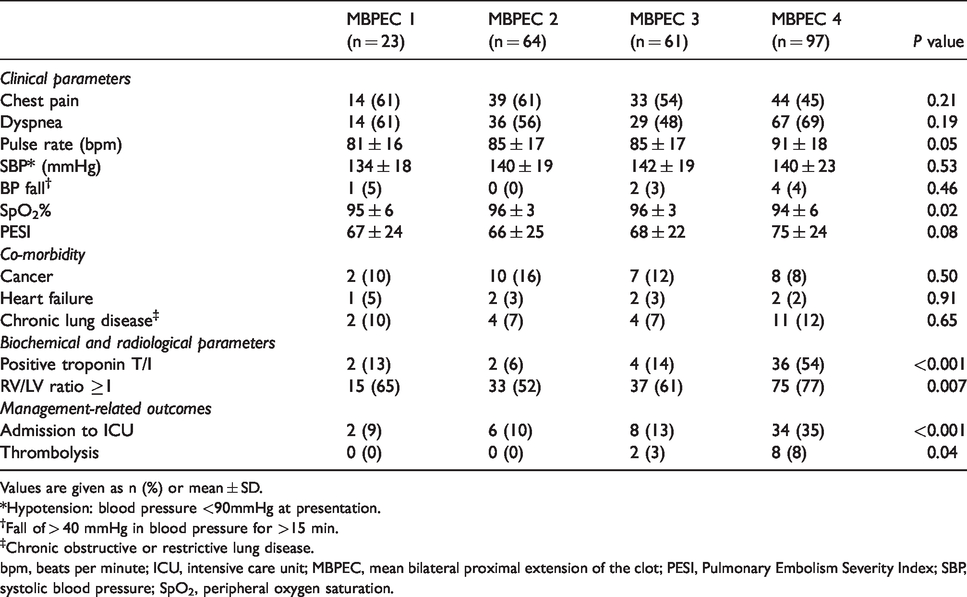
Table 2 shows the characteristics of the patients according to their MBPEC score at time of diagnosis. Twenty-three patients (9%) had a MBPEC score of 1, 64 (26%) had a MBPEC score of 2, 61 (25%) had a MBPEC score of 3, and 97 (40%) patients were classified with a MBPEC score of 4.
Clinical and biochemical parameters, as well as management-related outcomes at baseline stratified by MBPEC score.
Values are given as n (%) or mean ± SD.
*Hypotension: blood pressure <90mmHg at presentation.
†Fall of > 40 mmHg in blood pressure for >15 min.
‡Chronic obstructive or restrictive lung disease.
bpm, beats per minute; ICU, intensive care unit; MBPEC, mean bilateral proximal extension of the clot; PESI, Pulmonary Embolism Severity Index; SBP, systolic blood pressure; SpO2, peripheral oxygen saturation.
There was no statistical difference observed between the patients in the four MPBEC categories regarding chest pain, dyspnea, and co-morbidities (Table 2). Higher MBPEC score was significantly associated with higher pulse rate (P = 0.05) and lower SpO2 (P = 0.02) (Table 2).
The association between MBPEC and biochemical parameters
A significant association was found between MBPEC and positive troponin levels (P <0.001) (Table 2). The ROC curve analysis revealed MBPEC 4 as the best cut-off value for predicting positive troponin with an area under the curve (AUC) of 0.76 (95% confidence interval [CI] = 0.68–0.85). MBPEC 4 was found to have a sensitivity, specificity, PPV, and NPV of 82% (95% CI = 67–92), 70% (95% CI = 60–78), 54% (95% CI = 41–66), and 90% (95% CI = 81–95), respectively, for predicting elevated troponin. Lowering the cut-off to MBPEC ≥ 3 further increased the sensitivity to 91% (95% CI = 77–97). However, compared to patients with negative troponin, those with positive troponin had significantly higher mean RV/LV ratio (1.6 ± 1.0 versus 1.0 ± 0.2; P <0.005). In order to account for the possible confounding effect of the RV/LV ratio, we analyzed the association between MBPEC and troponin also in a logistic regression model adjusted for both RV/LV ratio and PESI score. A MBPEC score of 4 was independently associated with elevated troponin with an OR of 5.3 (95% CI = 2.0–14.3).
The association between MBPEC and radiological parameters
Fig. 2 displays RV/LV ratios in the four different MBPEC categories. Patients with a MBPEC score of 4 had a mean RV/LV ratio of 1.36 compared to 1.00 ± 0.12, 1.01 ± 0.15, and 1.09 ± 0.24 in patients with MBPEC 1, 2, and 3, respectively (P <0.001) (Fig. 2).
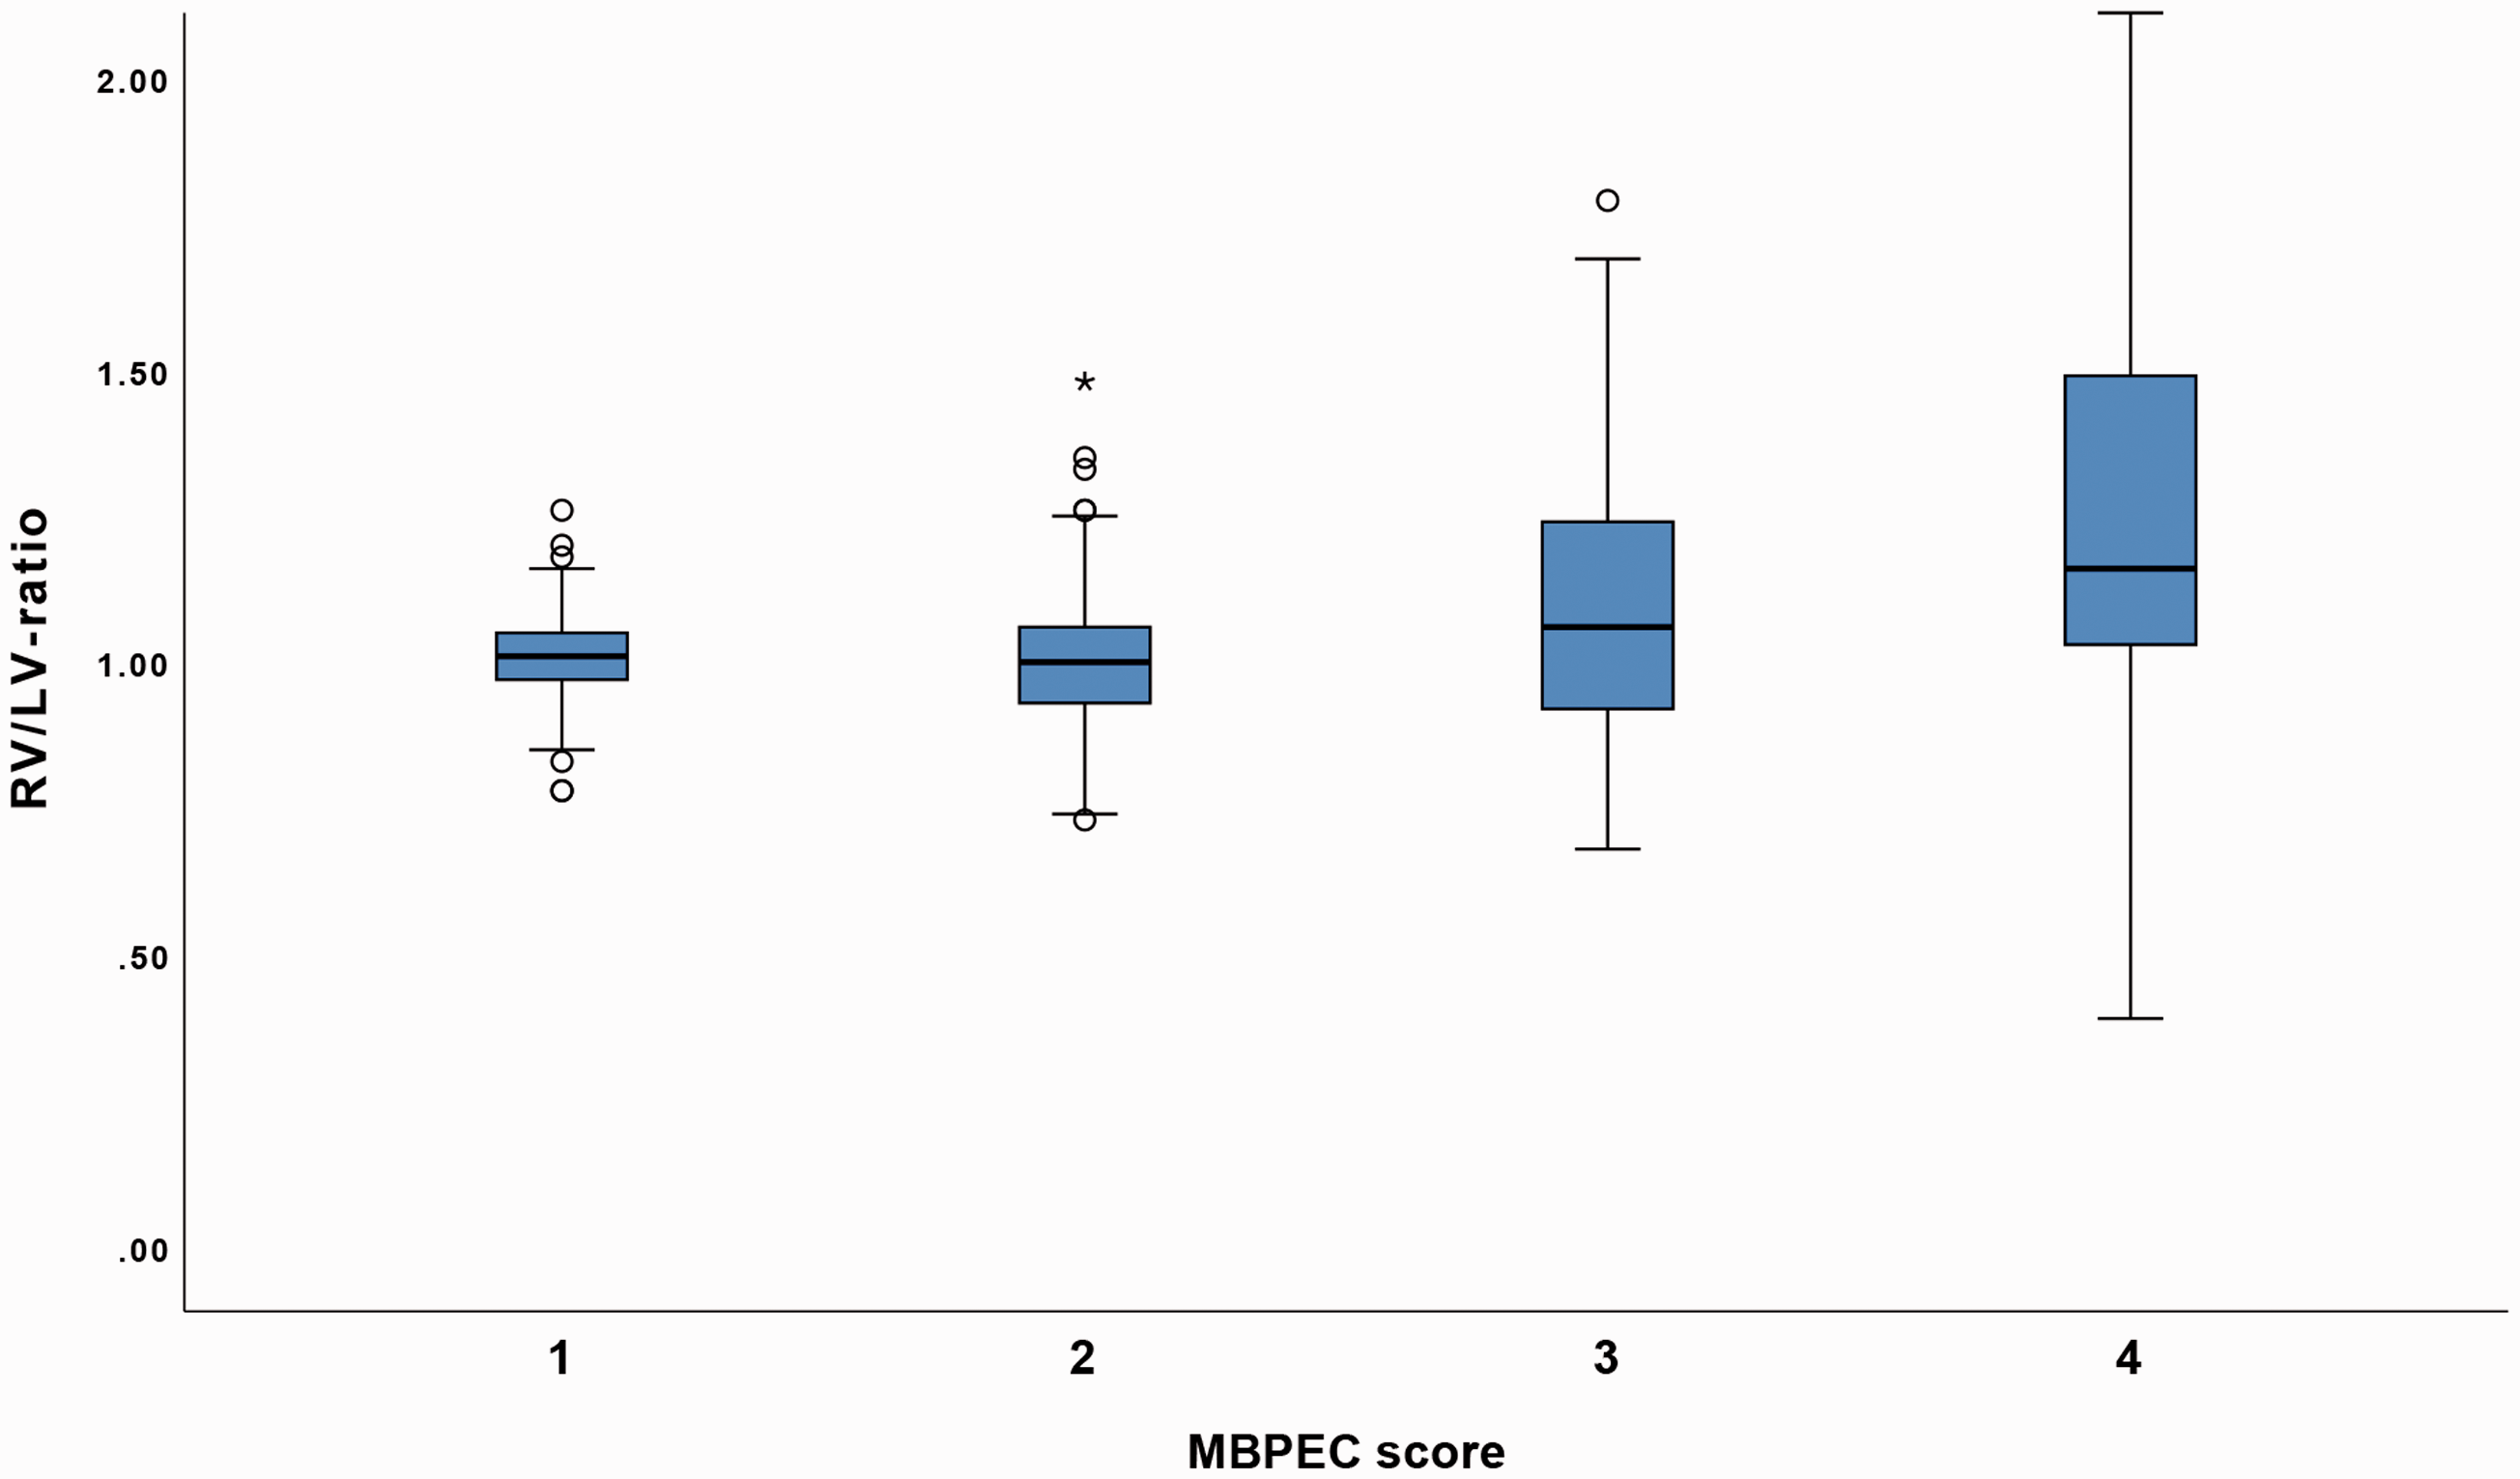
The association between RV/LV ratio and MBPEC scores. Pairwise comparison revealed significant association in RV/LV ratios between categories 1–4, 2–4, and 3–4 (P < 0.0001, P = 0.003, and P = 0.01, respectively). LV, left ventricle; MBPEC, mean bilateral proximal extension of the clot; RV, right ventricle.
The association between MBPEC and management-related outcomes
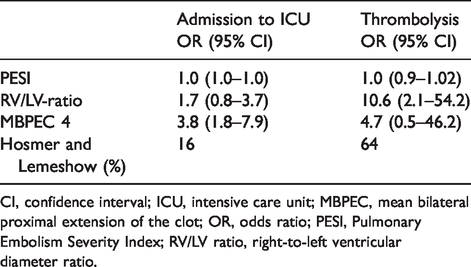
Out of the 50 patients admitted to the ICU, 34 (68%) patients had a MBPEC score of 4. ROC analysis identified a cut-off value of 4 for MBPEC in predicting both admission to the ICU with an AUC of 0.69 (95% CI = 0.61–0.77) and thrombolytic treatment with an AUC of 0.75 (95% CI = 0.64–0.86). In the logistic regression model adjusted for PESI score and RV/LV ratio, MBPEC score of 4 was independently associated with admission to the ICU (OR = 3.8, 95% CI = 1.8–7.9) (Table 3).
Logistic regression model evaluating the ability of a MBPEC score 4, PESI score, and RV/LV ratio to predict admission to the ICU and thrombolytic treatment.
CI, confidence interval; ICU, intensive care unit; MBPEC, mean bilateral proximal extension of the clot; OR, odds ratio; PESI, Pulmonary Embolism Severity Index; RV/LV ratio, right-to-left ventricular diameter ratio.
Inter-observer reliability
MBPEC was assessed by two independent radiologists in 50 randomly selected patients. The number of overall agreements between the two observers was 43, resulting in a weighted kappa of 0.82 (95% CI = 0.68–0.95).
Comparisons between the most proximal extension of the clot and MBPEC
The sensitivity, specificity, PPV, and NPV with corresponding AUC values of the most proximal extension of the clot and MBPEC concerning predicting troponin values and admission to the ICU are given in Table S1 in Appendix B. Overall, the analysis revealed a similar performance between the two radiological scores. However, MBPEC indicated better discriminative ability with higher AUC (Table S1). The performance of the two scores in predicting elevated troponin or admission to the ICU was compared in a logistic regression analysis controlling for RV/LV ratio and PESI score. The results revealed that MBPEC had the ability to retain its significance whereas the most proximal extension of the clot did not (Table S2).
Discussion
In the present study, we found that MBPEC 4 was associated with more severe disease and short-term outcomes including higher pulse rate, lower SpO2%, elevated troponins, and higher RV/LV ratio, confirming, in a larger cohort of patients, our previous findings (18). A MBPEC score of 4 was independently associated with the short-term outcome of admission to the ICU as the majority of patients who were admitted to the ICU were in MBPEC category 3 or 4. Moreover, an excellent interrater agreement was observed. Our results indicate that MBPEC could be a useful tool for rapid assessment of PE severity.
As PE is a potentially fatal disease, feasibility and rapidness of diagnosis and risk stratification are of great importance. CTPA, which is available around-the-clock and a rapid imaging technique, is now the gold standard for the diagnosis of PE. Accordingly, many studies have investigated the performance of various CTPA parameters in predicting the outcome of patients with PE (9,19,20). The proximity of the emboli and obstruction index of the pulmonary arteries are among CTPA parameters that have been shown to be associated with both RVD and adverse outcomes (11,21). Obstruction index is the most widely used scoring system in research settings. Although being comprehensive, due to its complexity and time-consuming calculation, it is rarely used in the clinical setting. Conversely, although feasible, the most proximal extension of the clot mainly describes the distribution of the clot without a structured score and lacks a standardized classification. The main advantages of MBPEC over PAOI and the proximal extension of the clot are its feasibility to score and accommodation of the distribution of the clot also in the contralateral lung, respectively.
In the present study, we found that a higher MBPEC score was associated with PE-severity clinical parameters such as elevated pulse rate and decreased SpO2%. However, we did not find an association between SBP and MBPEC, which we believe is due to the low number of patients with hypotension. We also observed a trend towards significant association between MBPEC and higher PESI scores. PESI score has not been reported in previous studies evaluating the prognostic performance of clot burden. Since vital signs and PESI score are available before the emergency physician proceeds with diagnostic imaging, our finding could alert the clinician, in the very early stages, of higher clot burden and hence the potential need for aggressive management strategies.
Cardiac biomarkers have been shown to predict adverse outcomes (6). They are frequently measured in practice and are recommended by international guidelines to be used in risk stratification algorithms in PE (2,3). However, these are time- and resource-consuming. Our results showed that MBPEC <4 has a NPV of 90% in predicting negative troponin values and that patients with MBPEC score 4 were 5.3 times more likely to have an elevated troponin. MBPEC’s performance in predicting elevated troponin was also retained when we adjusted for RV/LV ratio and PESI score, indicating an independent association. These findings suggest that MBPEC can be used to rationalize the use of troponin by assessing it in patients with MBPEC 3 and 4 only. Thus, allowing more effective risk assessment of the patients with PE.
The accuracy of clot burden to predict adverse clinical outcomes have been debated (19). Of note, however, the majority of the published studies have had mortality and not management-associated outcomes as their primary endpoint (19). Our results revealed that patients with MBPEC score of 4 were more likely to experience an adverse outcome such as admission to the ICU. Although it may be argued that these results are more likely related to increased RV/LV ratio rather than MBPEC, the RV/LV ratios have not consistently been shown to significantly predict adverse outcomes (22). Furthermore, MBPEC retained its ability to predict admission to the ICU when we adjusted the model for both PESI score and RV/LV ratio, indicating an independent association. As such, our findings could indicate that in patients with a MBPEC score of 4, a more comprehensive risk assessment should be considered, e.g. urgent echocardiography.
Clot burden has not been studied previously with regard to long-term outcomes. Residual thrombosis has been shown to be associated with reduced exercise capacity and dyspnea (23). Clot burden at diagnosis has been shown to correlate with residual thrombosis. The present study did not show any association between MBPEC score at diagnosis and long-term sequalae such as persistent dyspnea or reduced exercise capacity long time after the diagnosis of PE.
The strength of the study lies in its relatively large sample size and in the inclusion of the PESI score, which has not been presented in the majority of the previous studies. The PESI score is considered one of the most validated clinical scoring tools in order to identify high- or low-risk patients with PE (24,25).
The present study has some limitations. First is the retrospective design of the study; some data were missing, particularly on cardiac biomarkers, which was not measured in all patients. Second, since inclusion required the patients’ consent, not all patients were included. This is important, particularly with regard to those with the most severe outcome that resulted in death were not included. Therefore, short-term mortality was not included among the studied outcomes. Third, since ECG-gated CTPA was not used, it could be argued that our RV/LV ratio measurements are inaccurate. Fourth, as we did not have access to echocardiographic data at the initial diagnosis of PE, we cannot exclude that the patients already had RVD from other causes rather than their PE. Fifth, different troponin assays were used with different cut-off values in the studied cohort. However, this issue was solved by dichotomizing the obtained troponin values. Finally, we cannot exclude the possibility that the knowledge of the proximity of the clot has conferred some bias concerning the decision for ICU admission or even thrombolysis. However, with regard to the latter, our local practice guideline restricts the indication for thrombolysis to hemodynamically unstable patients. Therefore, we do not believe that the knowledge of proximal extension of the clot has influenced the decision to administer thrombolysis.
In conclusion, the present study indicates that MBPEC is significantly associated with other established risk-stratification parameters as well as with short-term adverse outcomes. Since MBPEC can be calculated easily by the radiologist, it enables a more rapid risk stratification. Consequently, MBPEC could be used as an adjunct to current risk stratification models in order to improve the acute care of patients with PE. However, further prospective management studies are needed to validate these results.
Supplemental Material
sj-pdf-1-acr-10.1177_0284185120966724 - Supplemental material for The mean bilateral proximal extension of the clot is associated with pulmonary embolism severity parameters and management-associated outcomes
Supplemental material, sj-pdf-1-acr-10.1177_0284185120966724 for The mean bilateral proximal extension of the clot is associated with pulmonary embolism severity parameters and management-associated outcomes by Mazdak Tavoly, Jostein Gleditsch, Josef. P. Ghanima, Fredrik Bremtun, Martin Schintzkewitz, Karl Julius Thrane, Oyvind Jervan and Waleed Ghanima in Acta Radiologica
Supplemental Material
sj-pdf-2-acr-10.1177_0284185120966724 - Supplemental material for The mean bilateral proximal extension of the clot is associated with pulmonary embolism severity parameters and management-associated outcomes
Supplemental material, sj-pdf-2-acr-10.1177_0284185120966724 for The mean bilateral proximal extension of the clot is associated with pulmonary embolism severity parameters and management-associated outcomes by Mazdak Tavoly, Jostein Gleditsch, Josef. P. Ghanima, Fredrik Bremtun, Martin Schintzkewitz, Karl Julius Thrane, Oyvind Jervan and Waleed Ghanima in Acta Radiologica
Footnotes
Declaration of conflicting interests
The author(s) declared the following potential conflicts of interest with respect to the research, authorship, and/or publication of this article: WG reports grants and lecture honoraria from Novartis, Bayer, and Pfizer/BMS and lecture and advisory board honoraria from MSD, Novartis, and Amgen, none of which is relevant for the submitted work.
Funding
The author(s) received no financial support for the research, authorship, and/or publication of this article.

Supplemental material
Supplemental material for this article is available online.
References
Supplementary Material
Please find the following supplemental material available below.
For Open Access articles published under a Creative Commons License, all supplemental material carries the same license as the article it is associated with.
For non-Open Access articles published, all supplemental material carries a non-exclusive license, and permission requests for re-use of supplemental material or any part of supplemental material shall be sent directly to the copyright owner as specified in the copyright notice associated with the article.
