
Abstract
Background
The value of dual-energy computed tomography (DECT)-based radiomics in renal lesions is unknown.
Purpose
To develop DECT-based radiomic models and assess their incremental values in comparison to conventional measurements for differentiating enhancing from non-enhancing small renal lesions.
Material and Methods
A total of 349 patients with 519 small renal lesions (390 non-enhancing, 129 enhancing) who underwent contrast-enhanced nephrographic phase DECT examinations between June 2013 and January 2020 on multiple DECT platforms were retrospectively recruited. Cohort A included all lesions, while cohort B included Bosniak II–IV and solid enhancing renal lesions. Radiomic models were built with features selected by the least absolute shrinkage and selection operator regression (LASSO). ROC analyses were performed to compare the diagnostic accuracy among conventional and radiomic models for predicting enhancing renal lesions.
Results
The individual iodine concentration (IC), normalized IC, mean attenuation on 75-keV images, radiomic model of iodine images, 75-keV images and a combined model integrating all the above-mentioned features all demonstrated high AUCs for predicting renal lesion enhancement in cohort A (AUCs = 0.934–0.979) as well as in the test dataset (AUCs = 0.892–0.962) of cohort B (P values with Bonferroni correction >0.003). The AUC (0.864) of mean attenuation on 75-keV images was significantly lower than those of other models (all P values ≤0.001) except the radiomic model of 75-keV images (P = 0.038) in the training dataset of cohort B.
Conclusion
No incremental value was found by adding radiomic and machine learning analyses to iodine images for differentiating enhancing from non-enhancing renal lesions.
Introduction
With the widespread use of computed tomography (CT) and magnetic resonance imaging (MRI), the increasing diagnosis of incidentally found small renal masses carries the risk of unnecessary examinations and treatments (1–5). Multidetector computed tomography (MDCT) protocols for renal mass evaluation typically include at least the unenhanced and contrast-enhanced nephrographic scans (1,2,6). However, many renal masses remain incompletely diagnosed either because they are too small to be characterized or because they are incidentally discovered on the single-phase CT examinations not performed using a standard protocol for renal mass evaluation (3,7,8). In addition to the distinct morphologic characteristics, the most important clinical task is to determine the presence or absence of contrast enhancement of the lesions, while enhancing masses are most commonly malignant or benign renal tumors, whereas non-enhancing masses are usually renal cysts.
Dual-energy CT (DECT) enables direct quantification of the iodine concentration (IC) from a single-phase contrast-enhanced scan, which may potentially eliminate the need for an unenhanced CT scan for the characterization of indeterminate renal lesions (9,10). However, there are conflicting data in the literature regarding the diagnostic accuracy of iodine quantification in comparison to conventional attenuation change measurements in differentiating enhancing from non-enhancing renal lesions (11–15). Of note, the threshold values of IC for predicting enhancing renal lesions are different depending on the patient cohort and the type of DECT platforms used in previous studies (11–15).
Radiomics may potentially improve diagnostic, predictive, and prognostic accuracy by converting medical images into high-throughput quantitative mineable data (16). In prior studies, radiomic analyses of iodine images showed promising performance in predicting microsatellite instability status of colorectal cancer (17), pathologic aggressiveness, and survival outcomes of lung adenocarcinoma (18,19), and were more accurate than conventional iodine quantification for distinguishing between solid benign and malignant hepatic lesions (20). However, all these studies were performed either on a rapid-kilovoltage-switching DECT (rsDECT) or dual-source DECT (dsDECT) platforms.
To the best of our knowledge, the diagnostic performance of DECT-based radiomic analyses of renal lesions is still unknown. Due to the relatively high discrimination ability of conventional iodine quantification, the necessity of applying radiomic analyses to DECT images in differentiating enhancing from non-enhancing small renal lesions still needs to be determined (15,21,22). The aim of the present study was to determine whether radiomic analyses of iodine and virtual monochromatic (VM) images at 75 keV from both rsDECT and dsDECT platforms were more accurate than conventional iodine quantification and attenuation measurement for differentiating enhancing from non-enhancing small (1–4 cm) renal lesions.
Material and Methods
Study participants
This retrospective, single-center, HIPAA-compliant study was approved by the institutional review board of Duke University (IRB: Pro00075346) and the requirement to obtain written informed consent was waived. One author of this study (J.C.R.G.) is an employee of Siemens Healthineers, all other authors are not consultants or employees of any company and had control of any data that might present a conflict of interest.
The patient accrual flowchart is shown in Fig. 1. A manual search was performed on the radiology picture archiving and communication system (Centricity 4.2, GE Healthcare) for patients who underwent DECT examinations of the genitourinary system at our medical center between June 2013 and January 2020. Inclusion criteria were as follows: (i) renal lesions with a diameter in the range of 1.0–4.0 cm; (ii) patients underwent prior or follow-up imaging (including ultrasound, CT, or MRI) for at least 18 months. The 1.0-cm lower threshold was chosen in order to avoid the potential partial volume effect in the segmentation of small lesions (23). Detailed exclusion criteria are summarized in the Supplemental Material. It should be noted that only patients with a total body weight <260 lbs (118 kg) were included in this study, which is our standard departmental cutoff for performing DECT scans.
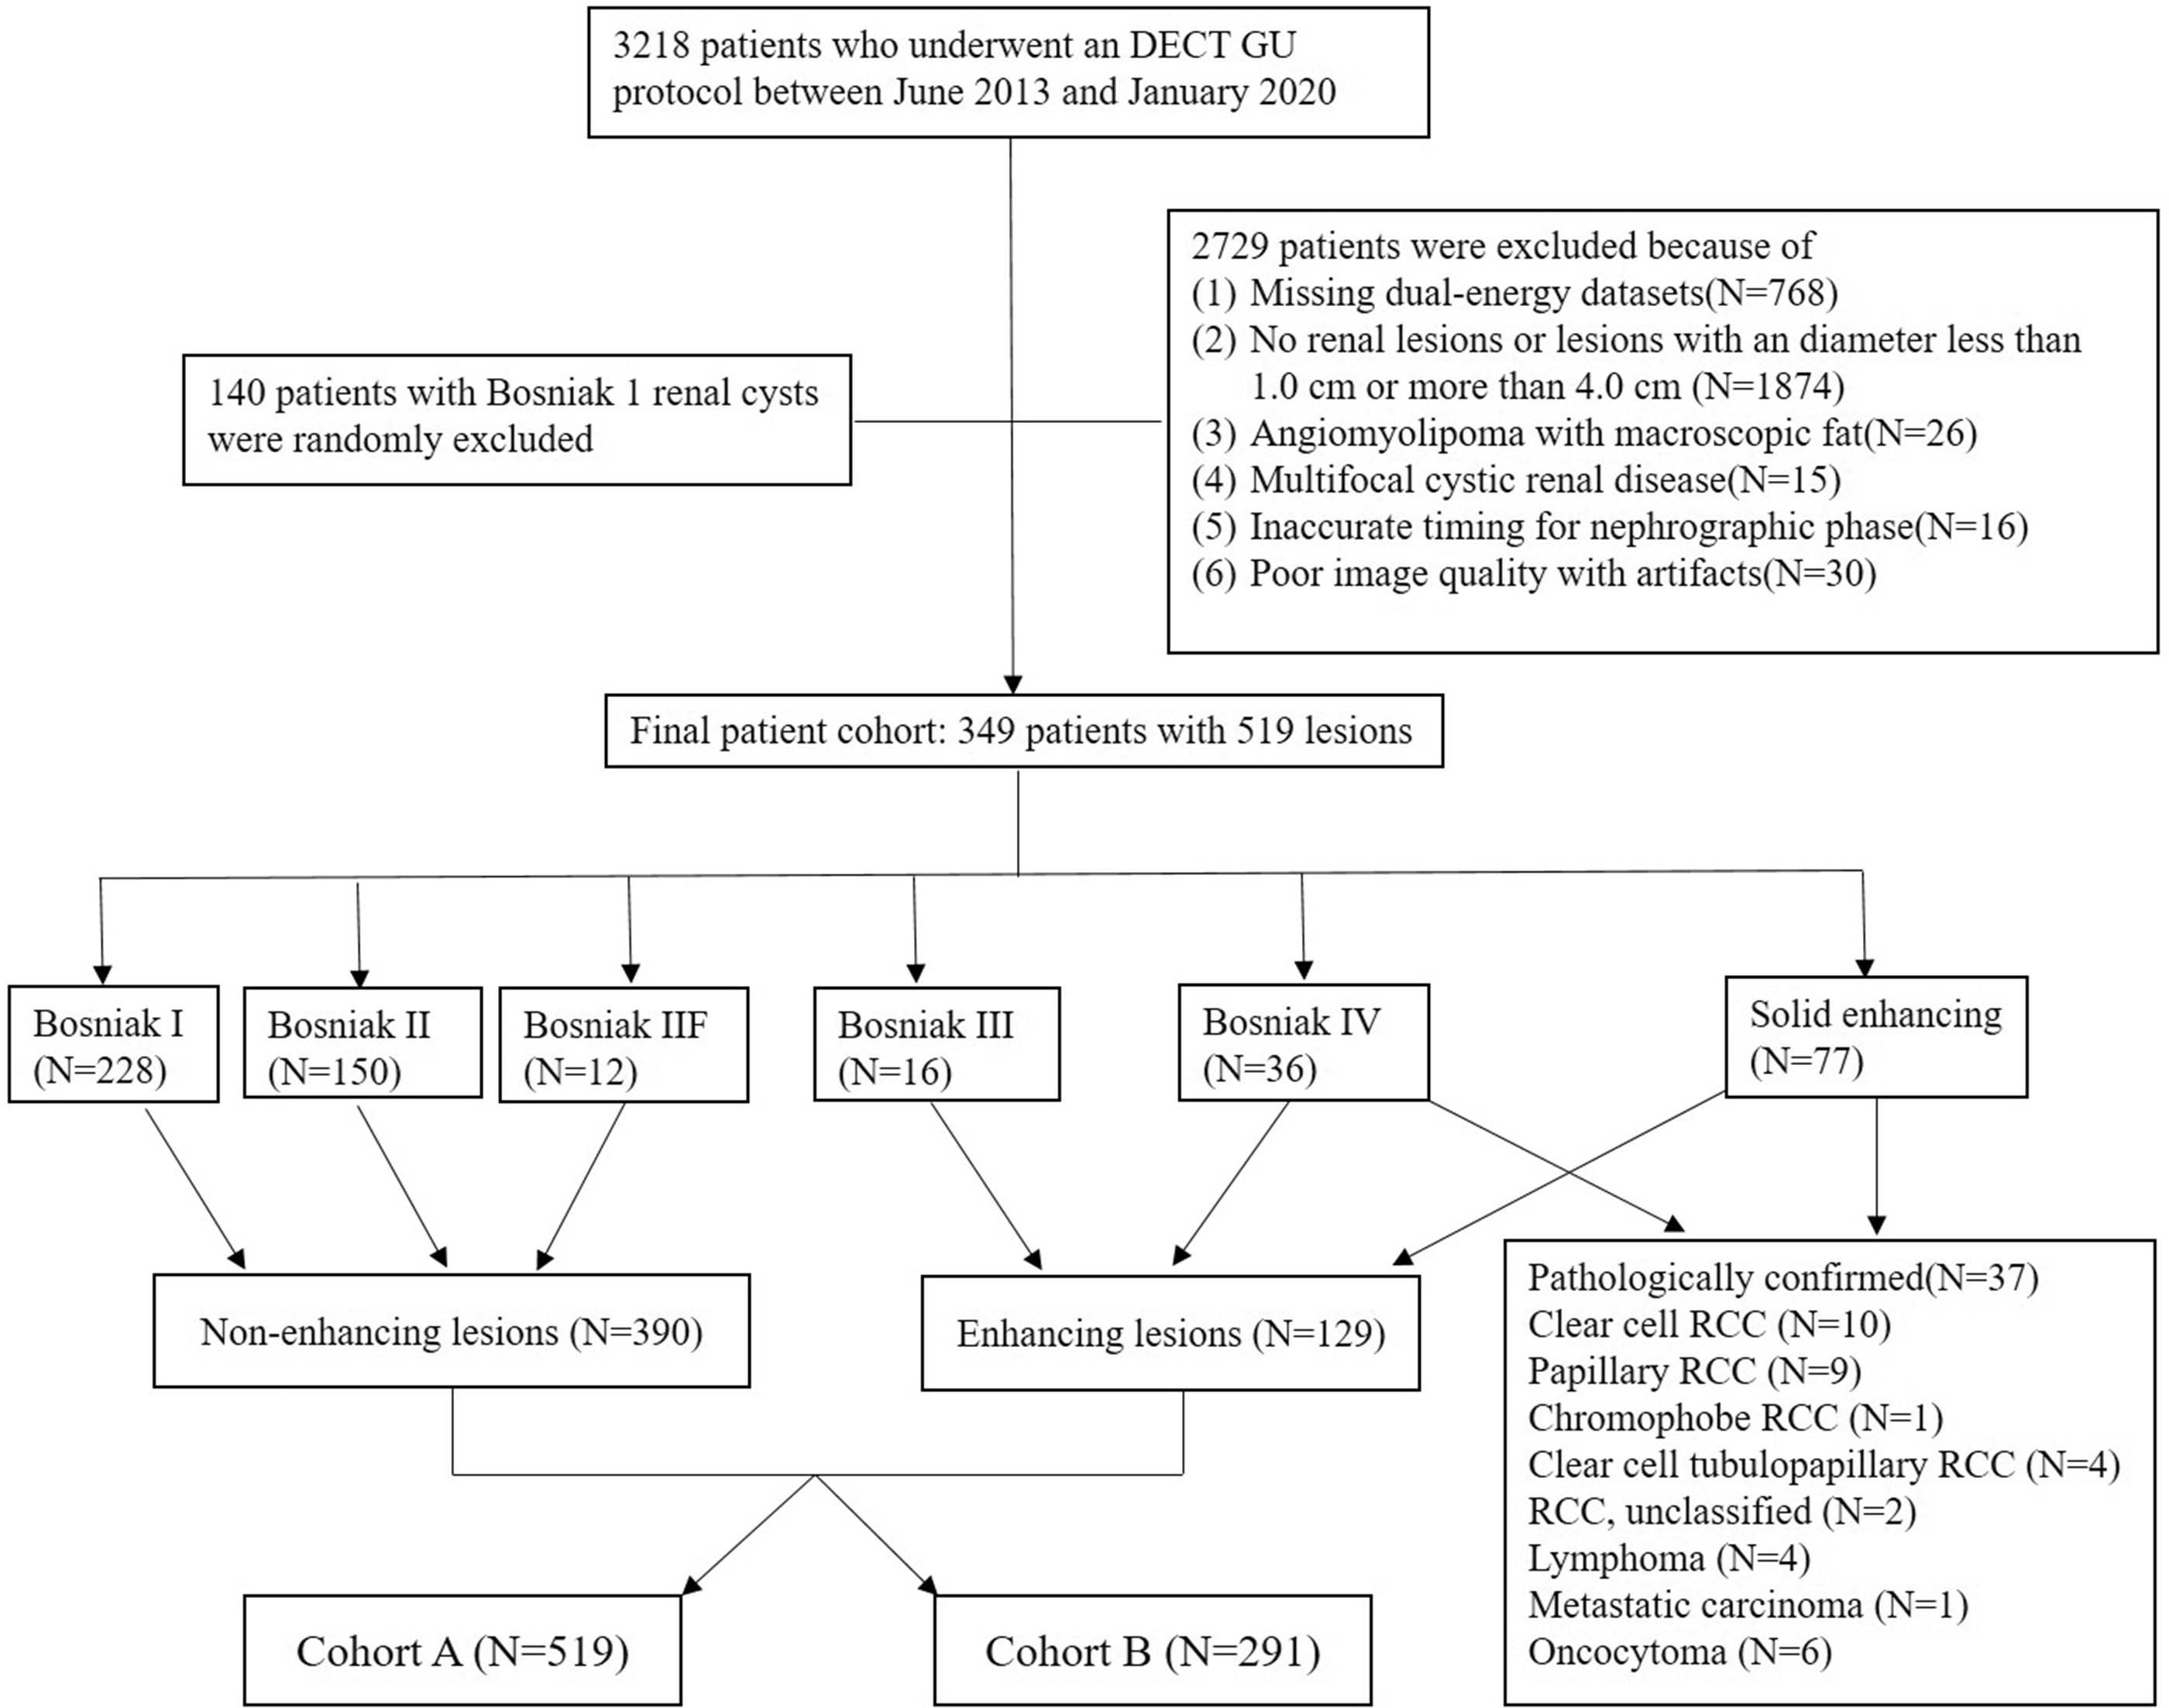
Flow chart of the patient cohort. DECT, dual-energy computed tomography; GU, genitourinary; RCC, renal cell carcinoma.
A total of 489 patients fulfilled our inclusion criteria; 140 patients with Bosniak I renal cysts were randomly excluded in order to make a relatively balanced patient cohort. In patients with multiple renal lesions, up to four of the smallest and most challenging lesions in each patient were included. Our final study population comprised 349 patients with 519 lesions (390 non-enhancing and 129 enhancing), which were divided into two cohorts. Cohort A included all lesions (n = 519), while cohort B included only Bosniak II–IV and solid enhancing renal lesions (n = 291).
CT acquisition technique
All CT examinations were performed on one of four DECT scanners (Somatom Definition Flash and Somatom Force, Siemens Healthineers, Forchheim, Germany, Discovery CT 750 HD and Revolution CT, GE Healthcare, Milwaukee, WI, USA) at our institution. Detailed CT acquisition parameters are summarized in Table S1. A single-energy unenhanced 120-kVp examination was initially performed from the top of both kidneys to the pubic symphysis. Patients were then scanned in DE mode during the nephrographic phase at a fixed delay time of 90 s after the initiation of the contrast medium injection. All patients received 150 mL of an intravenous non-ionic contrast medium with a concentration of 300 mg I/mL (iopamidol, Isovue 300; Bracco). The contrast medium was injected via a peripheral vein in the arm through an 18–20-gauge angiocatheter using a dual-chamber mechanical power injector (Empower; E-Z-EM) at a flow rate of 3 mL/s.
Data reconstruction and conventional measurements
The iodine and VM images at 75 keV (our routine clinical dataset) were generated from each manufacturer’s software by using the default settings. Detailed data reconstruction algorithms are presented in Supplemental Material. All the identifiers of patients (including name and medical record number) were anonymized when the images were stored in an encrypted hard drive.
Conventional measurements of renal lesions were performed by a radiologist (Y.Q.D.) with nine years of experience in genitourinary imaging, who was not aware of the final diagnosis at the time of data collection. The attenuation (in Hounsfield unit) on unenhanced and contrast-enhanced 75-keV images as well as IC (in mg/mL) of each renal lesion were measured by manually placing circular or ovoid regions of interest (ROIs) that encompassed as large as possible for homogeneous lesions. Freehand or circular ROIs were drawn to encompass the most avidly contrast-enhanced part of heterogeneous renal lesions. The size, shape, and position of the ROIs were kept constant by using the copy-and-paste function on the workstation. The ROIs were also placed on the abdominal aorta at the level of the ipsilateral main renal artery, with care to avoid any calcified atherosclerotic plaque. Normalized IC was calculated as follows: Inormalized = Ilesion/Iaorta, where Ilesion and Iaorta represent ICs of the lesion and abdominal aorta, respectively (24).
For each patient, the age, gender, body mass index, lesion location within the kidney (defined as intrarenal, ≤50% exophytic, or >50% exophytic) were also recorded.
Clinical reference standard
The clinical reference standard of our study was established by a radiologist (D.M.) with 11 years of experience in genitourinary imaging who had access to the medical records of the patients, including pathologic reports and images obtained before and after the index CT scan. Renal lesions with an attenuation change (ΔHU) ≥20 HU between unenhanced and contrast-enhanced 75-keV images were defined as enhancing lesions (25). The Bosniak classification was used to characterize cystic renal lesions, and Bosniak I, II, and IIF lesions were defined as non-enhancing renal lesions (26). For renal lesions that could not be verified by surgery or biopsy, the prior or follow-up ultrasound, CT, or MRI for a minimum of 18 months were used as a reference.
Lesion segmentation and radiomic feature extraction
The radiomic analysis workflow is shown in Fig. 2. The unit of iodine images from two dsDECT platforms was rescaled from the Hounsfield unit to 100 ug/cm3 by using an in-house built python-based software. Volumetric renal lesion segmentation, image preprocessing, and feature extraction were performed using a prototype software (Radiomics, version 1.2.2, Siemens Healthineers). The volumetric segmentation masks were generated from the 75-keV images and automatically applied to the iodine images.
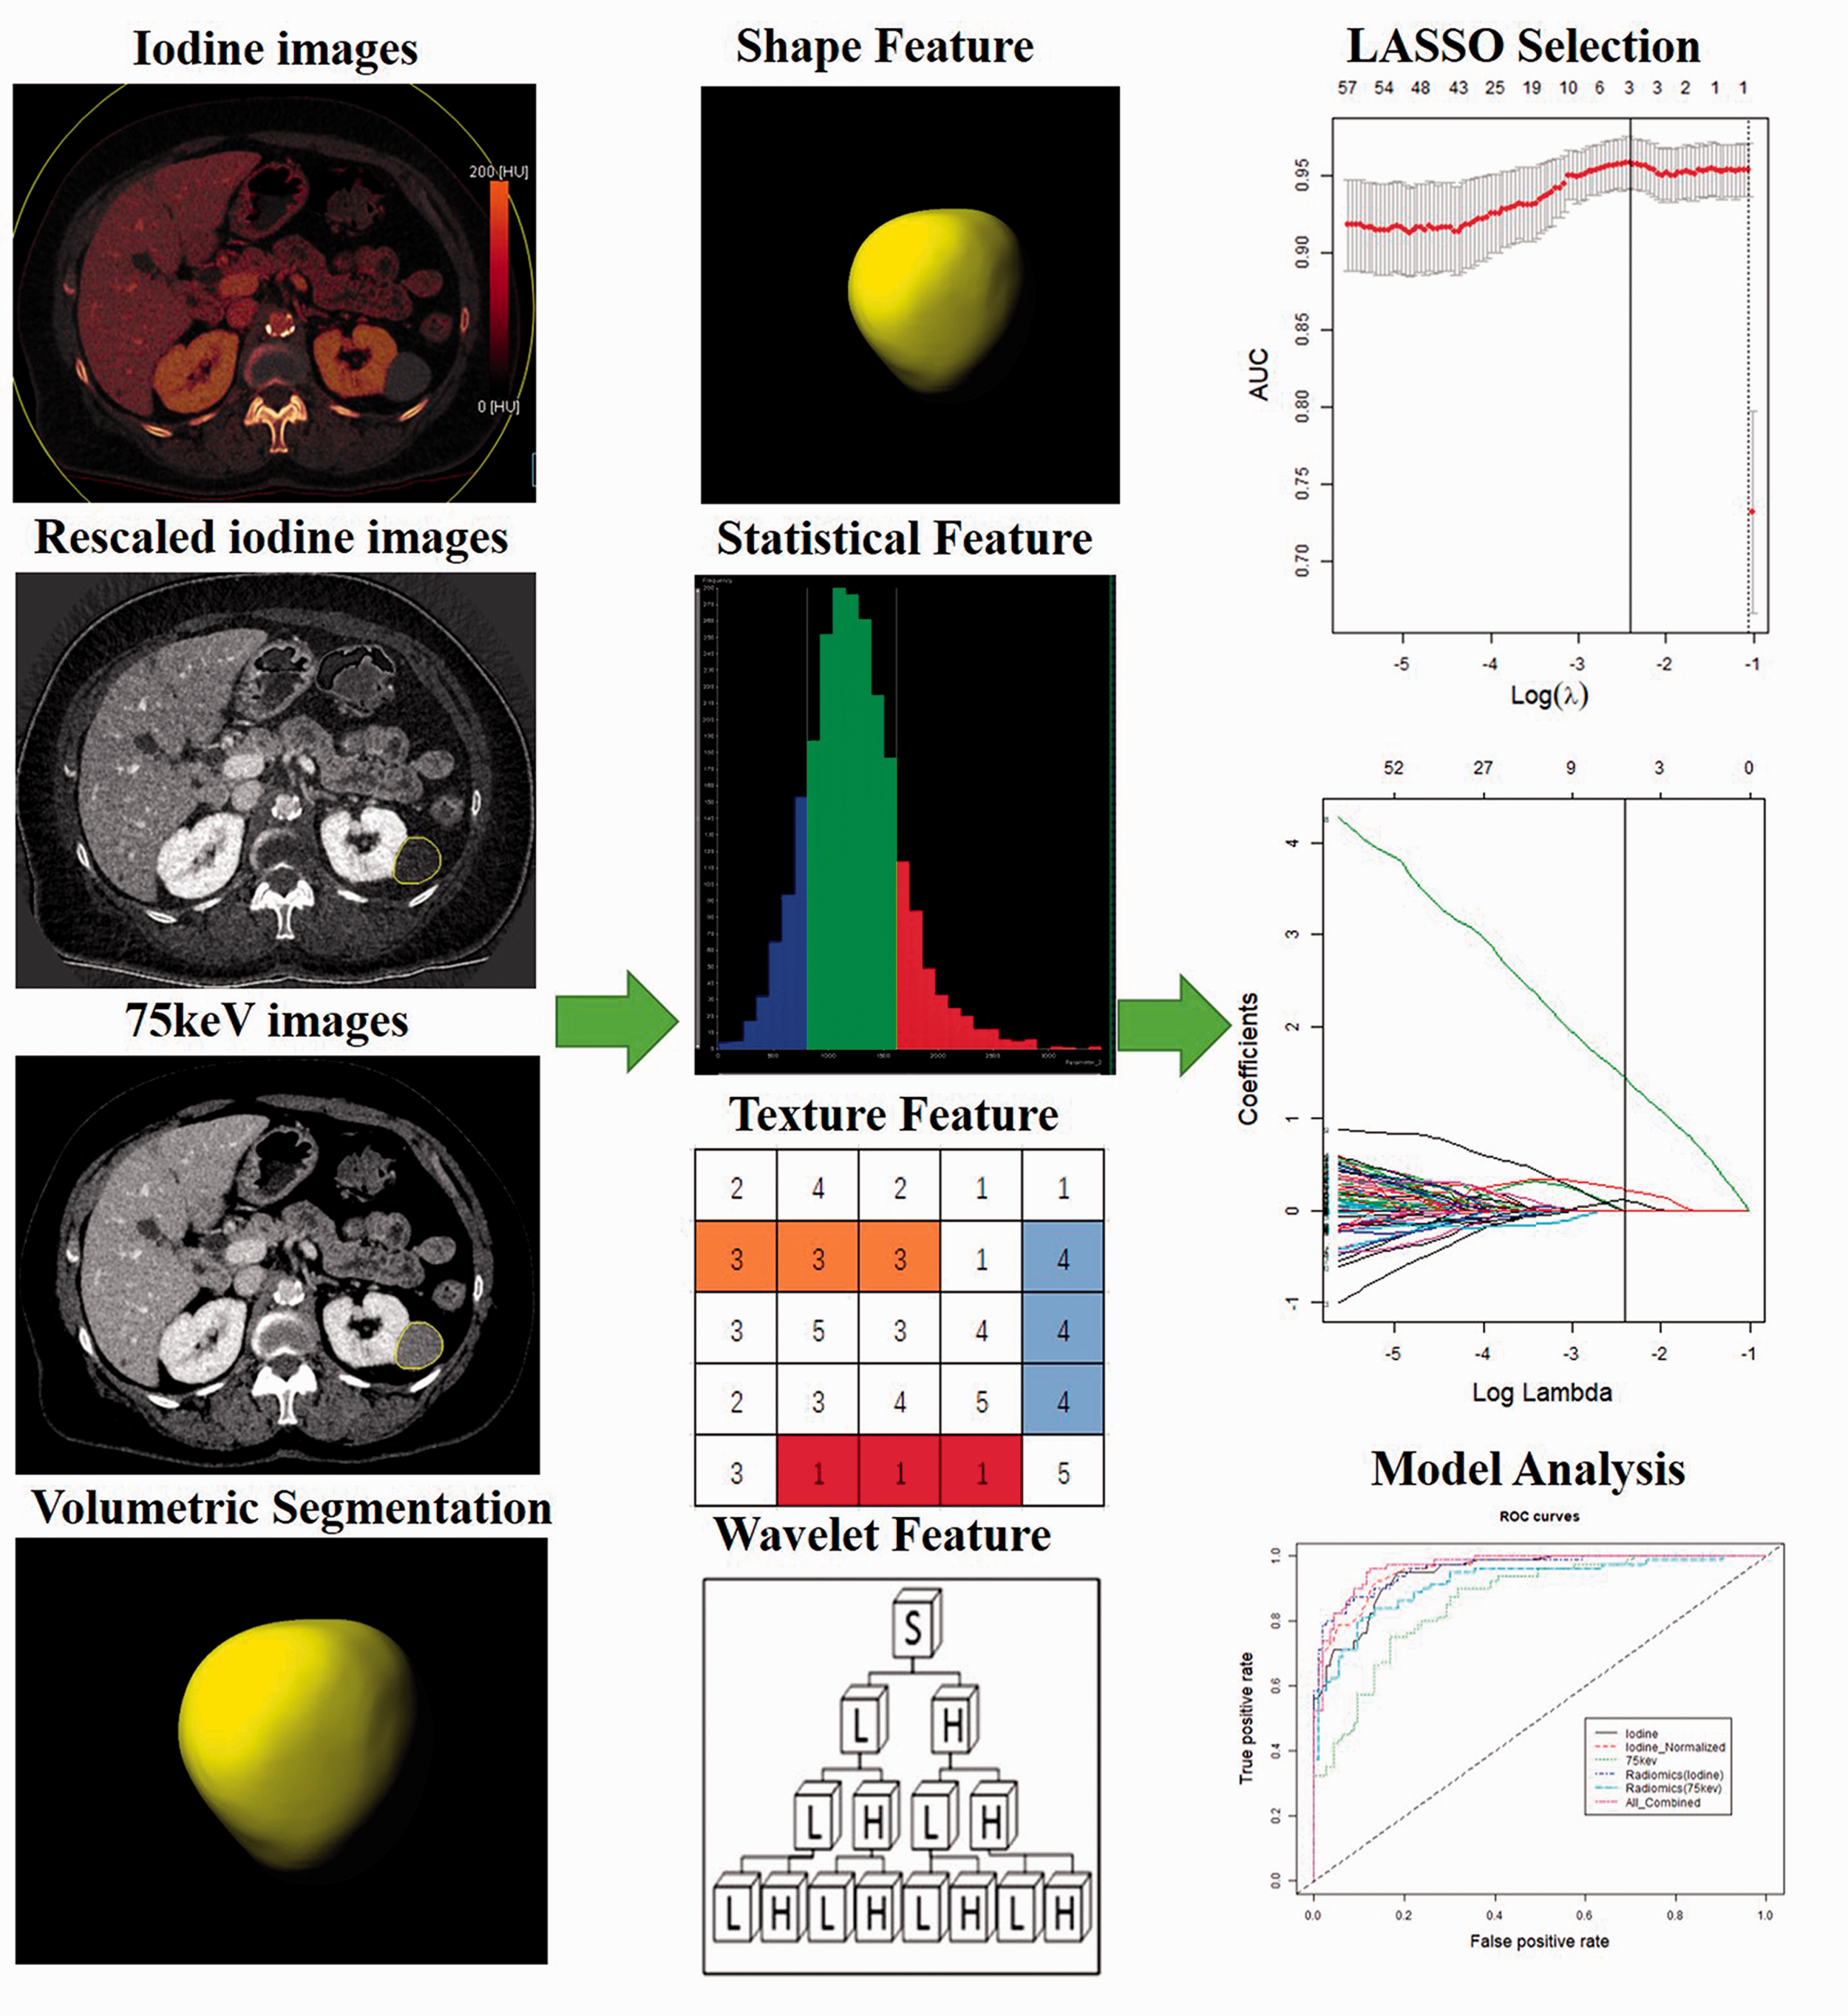
Radiomic analysis flowchart of tumor segmentation, feature extraction, feature selection, and model building. LASSO, least absolute shrinkage and selection operator.
Before radiomic feature extraction, all images were resampled to an isotropic voxel size of 1 × 1 × 1 mm3 using cubic B-spline interpolation (27,28), and their dynamic range was rebinned at a bin width of 15 HU. We extracted 854 radiomic features (19 first-order statistics, 16 shape-based features, 75 texture features, and 744 wavelet decompositions) from each volumetric segmentation, resulting in a total of 1708 features representing each lesion (Supplemental Material). Detailed descriptions of the radiomic features can be found online (https://pyradiomics.readthedocs.io/en/latest/features.html).
To evaluate the inter-observer reproducibility of radiomic features in segmentation, the volumetric segmentation and feature extraction process was repeated in 50 randomly selected lesions by three radiologists (F.R., Y.Q.D., and P.J.L., with 6, 9, and 11 years of experience in abdominal imaging, respectively).
Radiomic feature selection and model building
We followed a three-step procedure to identify robust radiomic features. First, the values of extracted radiomic features were standardized with z scores. Second, radiomic features with an intraclass correlation coefficient (ICC) >0.8 were considered reproducible, and then included in the following feature selection. Third, the least absolute shrinkage and selection operator (LASSO) logistic regression algorithm was used to select features with the best mean area under the curve (AUC) to build the radiomic model (29). Leave-one-out cross-validation was conducted for internal validation in the training dataset. The radiomic score for each lesion was computed through a linear combination of the selected features weighted by their corresponding coefficients.
The IC, normalized IC, mean attenuation on 75-keV images, radiomic model of iodine images, radiomic model of 75-keV images, and a combined model integrating all the abovementioned features were created. Receiver operating characteristic (ROC) curve analyses were performed to quantify the performance of the six models, and multiple comparisons of the AUCs were performed by the Delong test with Bonferroni-adjusted P values. The AUC with 95% confidence interval (CI), accuracy, sensitivity, and specificity were calculated by using the optimal thresholds to maximize the Youden index. Data partitioning was performed at the patient level, ensuring that lesions from the same image in each cohort would not be split between the training and test datasets (30). The model with the best performance on the training dataset was then validated on the test dataset.
Statistical analysis
Statistical analysis was performed with R software version 3.6.1 (R Foundation for Statistical Computing, Vienna, Austria) and SPSS Statistics version 22.0 (IBM Corp., Chicago, IL, USA). Continuous variables were summarized as mean ± SD, and categorical variables were reported as frequency and counts. The demographics between training and test datasets were compared by using the chi-square test for categorical variables and independent samples t test or Mann–Whitney U test for continuous variables, where appropriate. The LASSO regression model was performed by using the “glmnet” package and the ROC curve analysis was performed by using the “pROC” package. Two-sided P values <0.05 were considered statistically significant.
Results
Demographics
Our final study population consisted of 349 patients (117 women, 232 men; mean age = 67 ± 12 years; age range = 18–93 years) with 519 lesions (228 Bosniak I, 150 Bosniak II, 12 Bosniak IIF, 16 Bosniak III, 36 Bosniak IV, and 77 solid enhancing lesions). Thirty-seven of the Bosniak IV and solid enhancing renal lesions were pathologically confirmed (10 clear cell renal cell carcinomas [RCCs], nine papillary RCCs, one chromophobe RCC, four clear cell tubulopapillary RCCs, three unclassified RCCs, four lymphomas, one metastatic carcinoma, and six oncocytomas).
When comparing the demographics between the training and test datasets, no statistically significant difference was found in terms of gender, body mass index, lesion diameter, location in the kidney, enhancement status, and lesion classification (P = 0.134–0.952), except for age (P = 0.044) in cohort A (Table 1).
Characteristics of the patients and renal lesions.
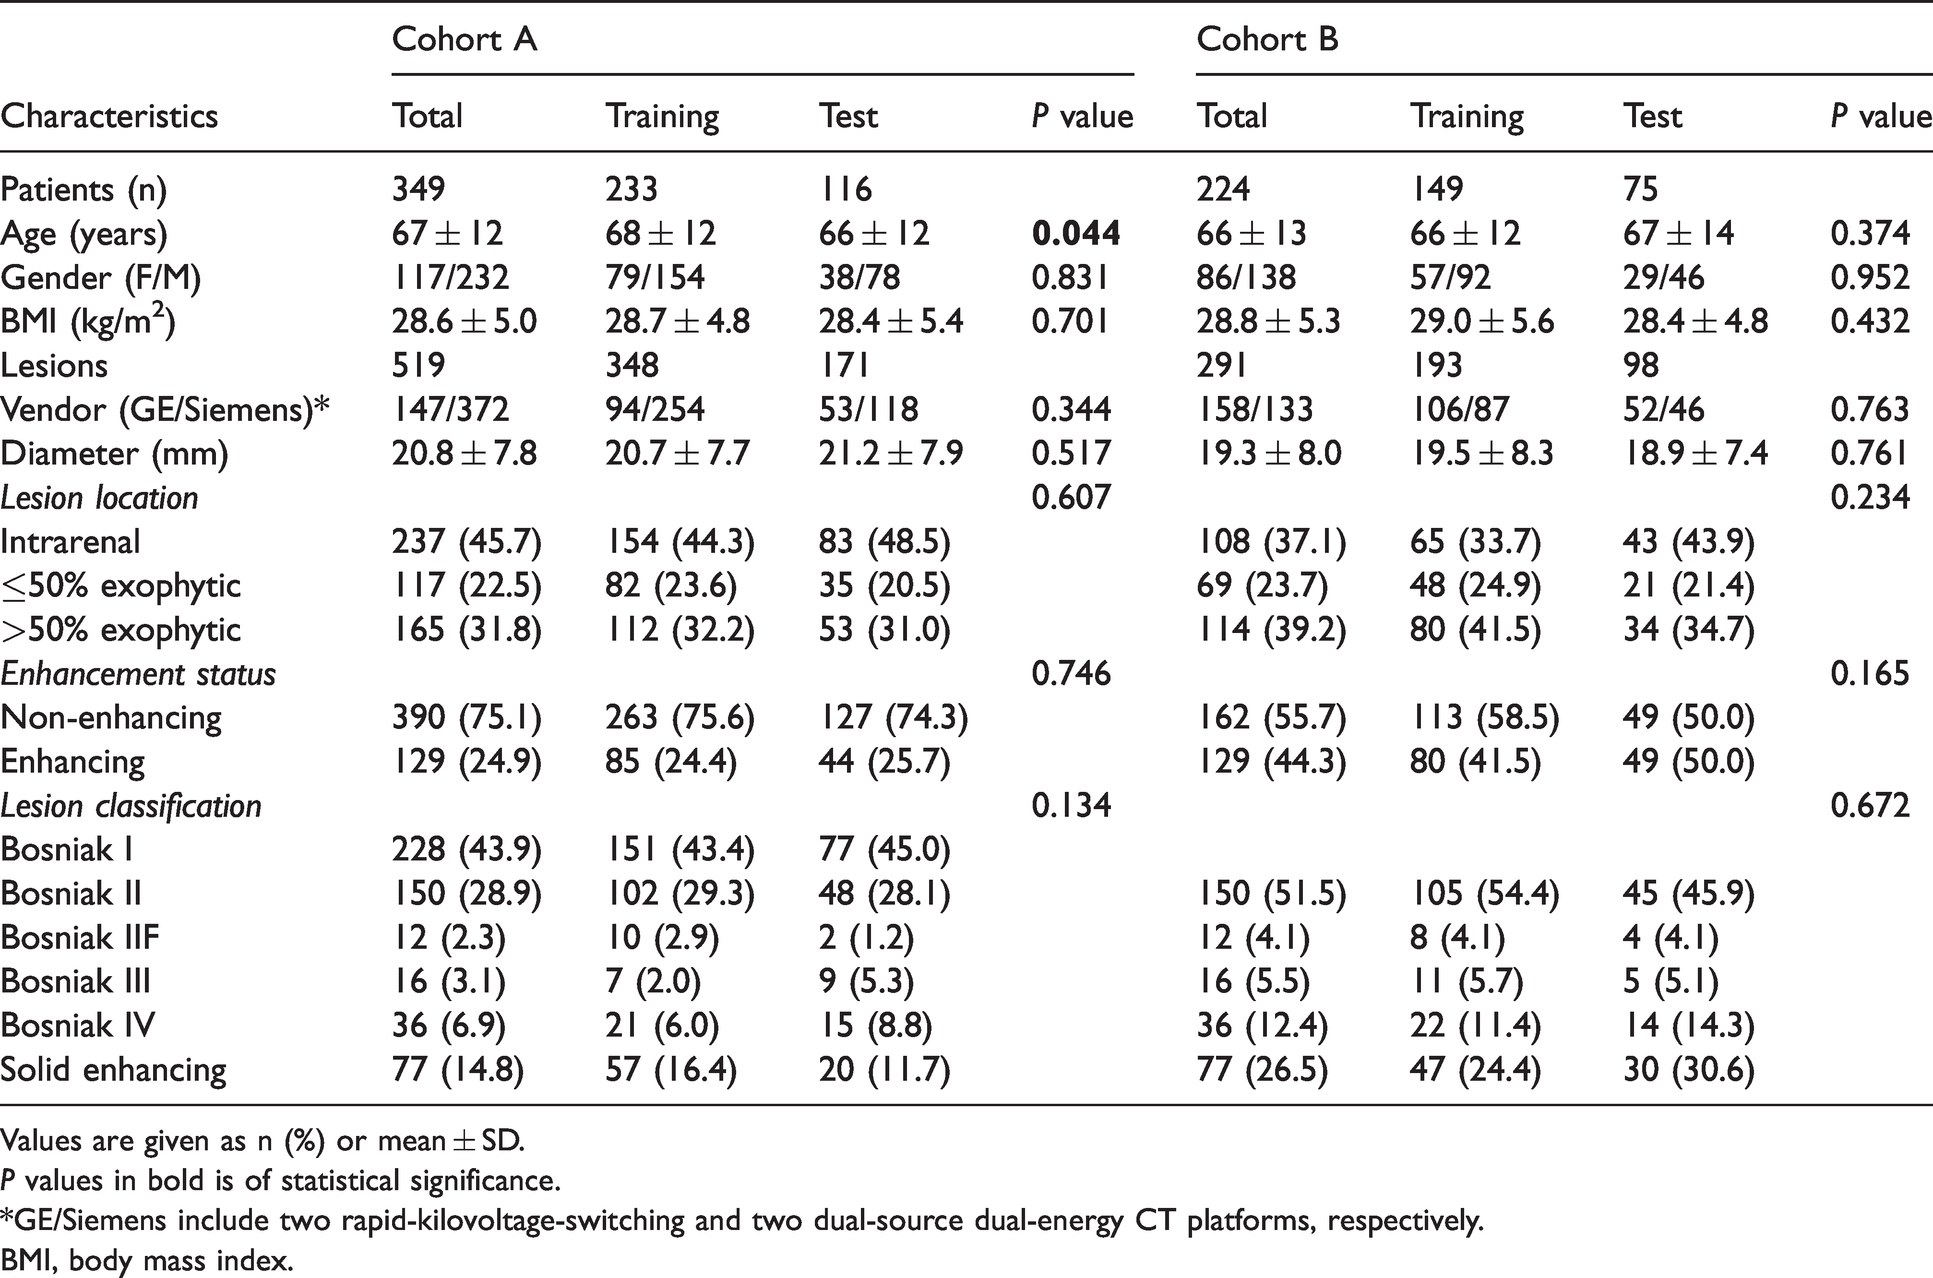
Values are given as n (%) or mean ± SD.P values in bold is of statistical significance.
*GE/Siemens include two rapid-kilovoltage-switching and two dual-source dual-energy CT platforms, respectively.
BMI, body mass index.
Attenuation and iodine quantification
The mean attenuation on contrast-enhanced 75-keV images, IC, and normalized IC values between enhancing and non-enhancing renal lesions in the training and test datasets of both cohort A and B were all statistically different (all P values <0.001) (Table S2 and Fig. S1). Examples of typical enhancing and non-enhancing renal lesions are shown in Fig. 3.
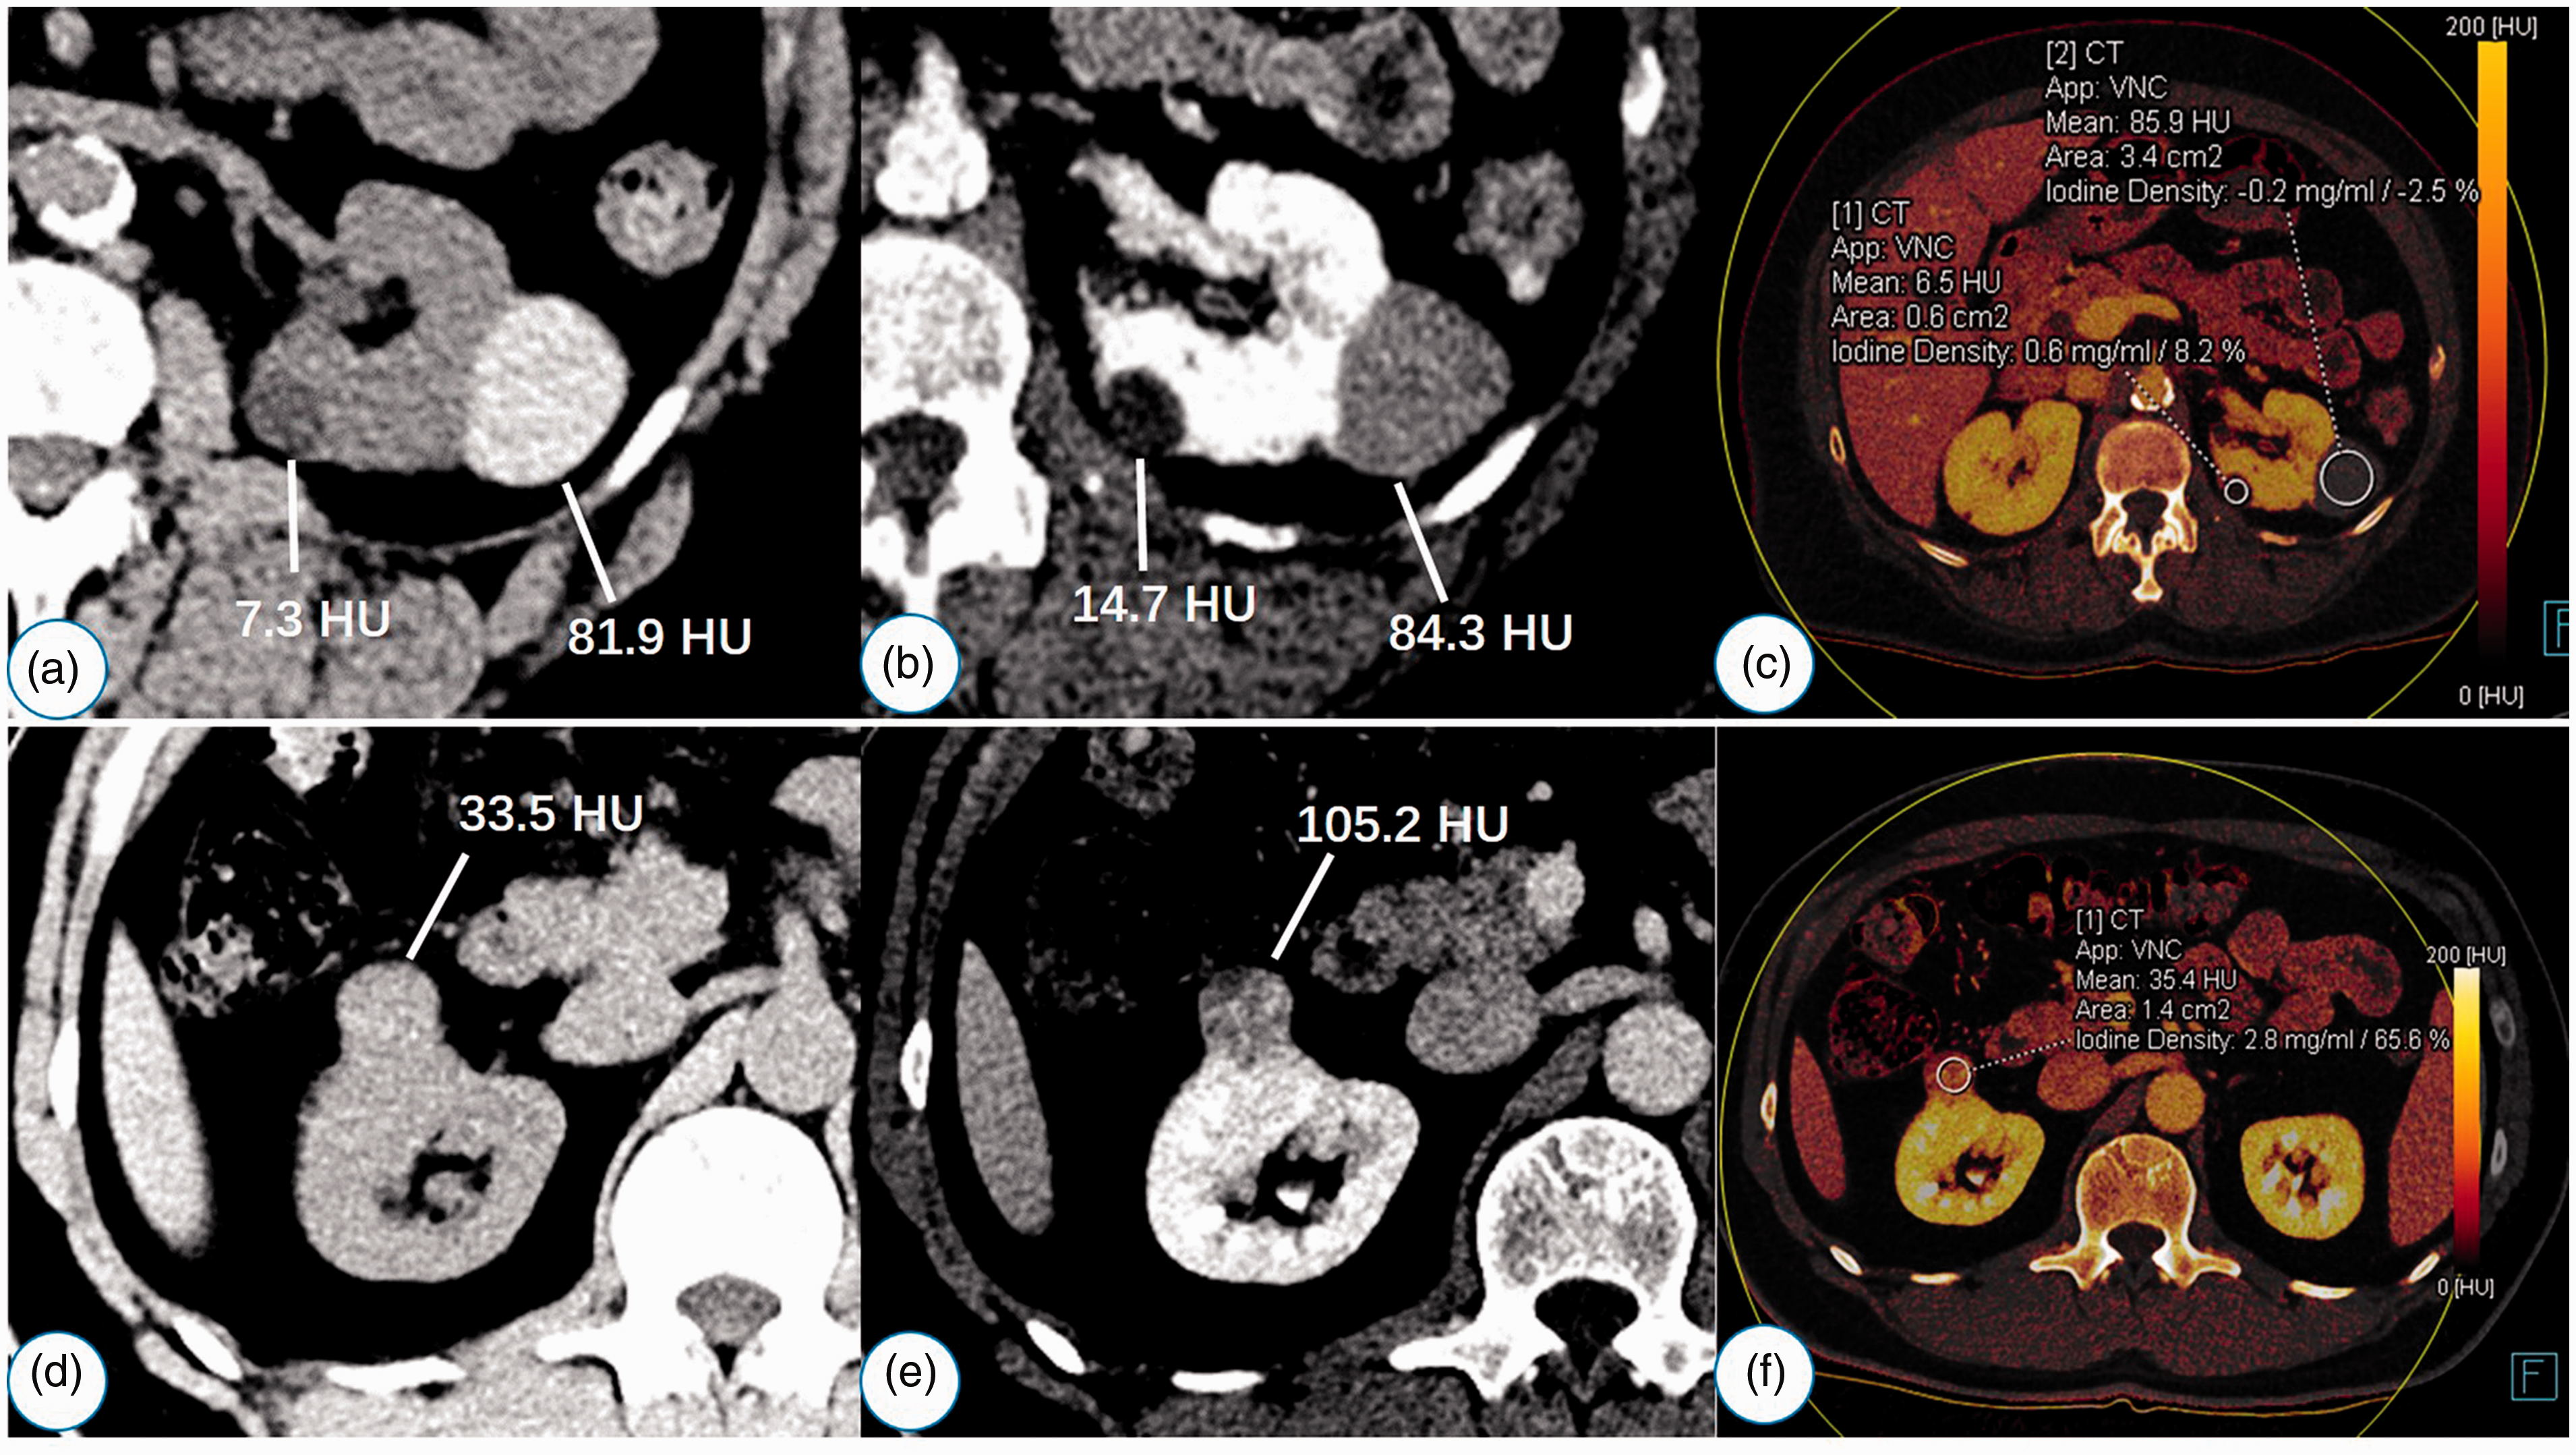
Representative dual-energy computed tomography images of non-enhancing and enhancing renal lesions. (a–c) Case 1 is a 70-year-old woman with Bosniak I (lesion 1) and Bosniak II (lesion 2) renal cysts. Conventional attenuation change between the true unenhanced (a) and contrast-enhanced 75-keV images (b) for both lesions is <20 HU. Of note, IC (–0.2 mg/mL) and normalized IC (–2.5%) for lesion 2 are negative on the iodine image (c). (d–f) Case 2 is a 56-year-old man with pathologically confirmed clear cell renal cell carcinoma. Conventional attenuation change between true unenhanced (d) and contrast-enhanced 75-keV images (e) of the lesion is >20 HU. The IC and normalized IC of the lesion are >1.1 mg/mL and 0.24 on the iodine image, respectively (f). IC, iodine concentration.
Radiomic feature selection and model performances
After feature stability analysis, 1534 features (89.8%) with ICCs >0.8 were selected for subsequent investigation. The results of ROC analyses of different models are summarized in Table 2, and the corresponding ROC curves are shown in Fig. 4. Eighteen and three features with non-zero coefficients were selected by LASSO in the combined model of cohort A and B, respectively (Figs. S2 and S3). However, the normalized IC value outperformed all radiomic features in both cohort A (odds ratio [OR] = 10.45) and cohort B (OR = 4.26), respectively (Table 3). Detailed descriptions for the selected features are summarized in the Supplemental Material. The box-and-whisker plots showing the distributions of radiomic scores of the combined model are presented in Fig. 5.
Diagnostic performance of conventional measurements and radiomic models.
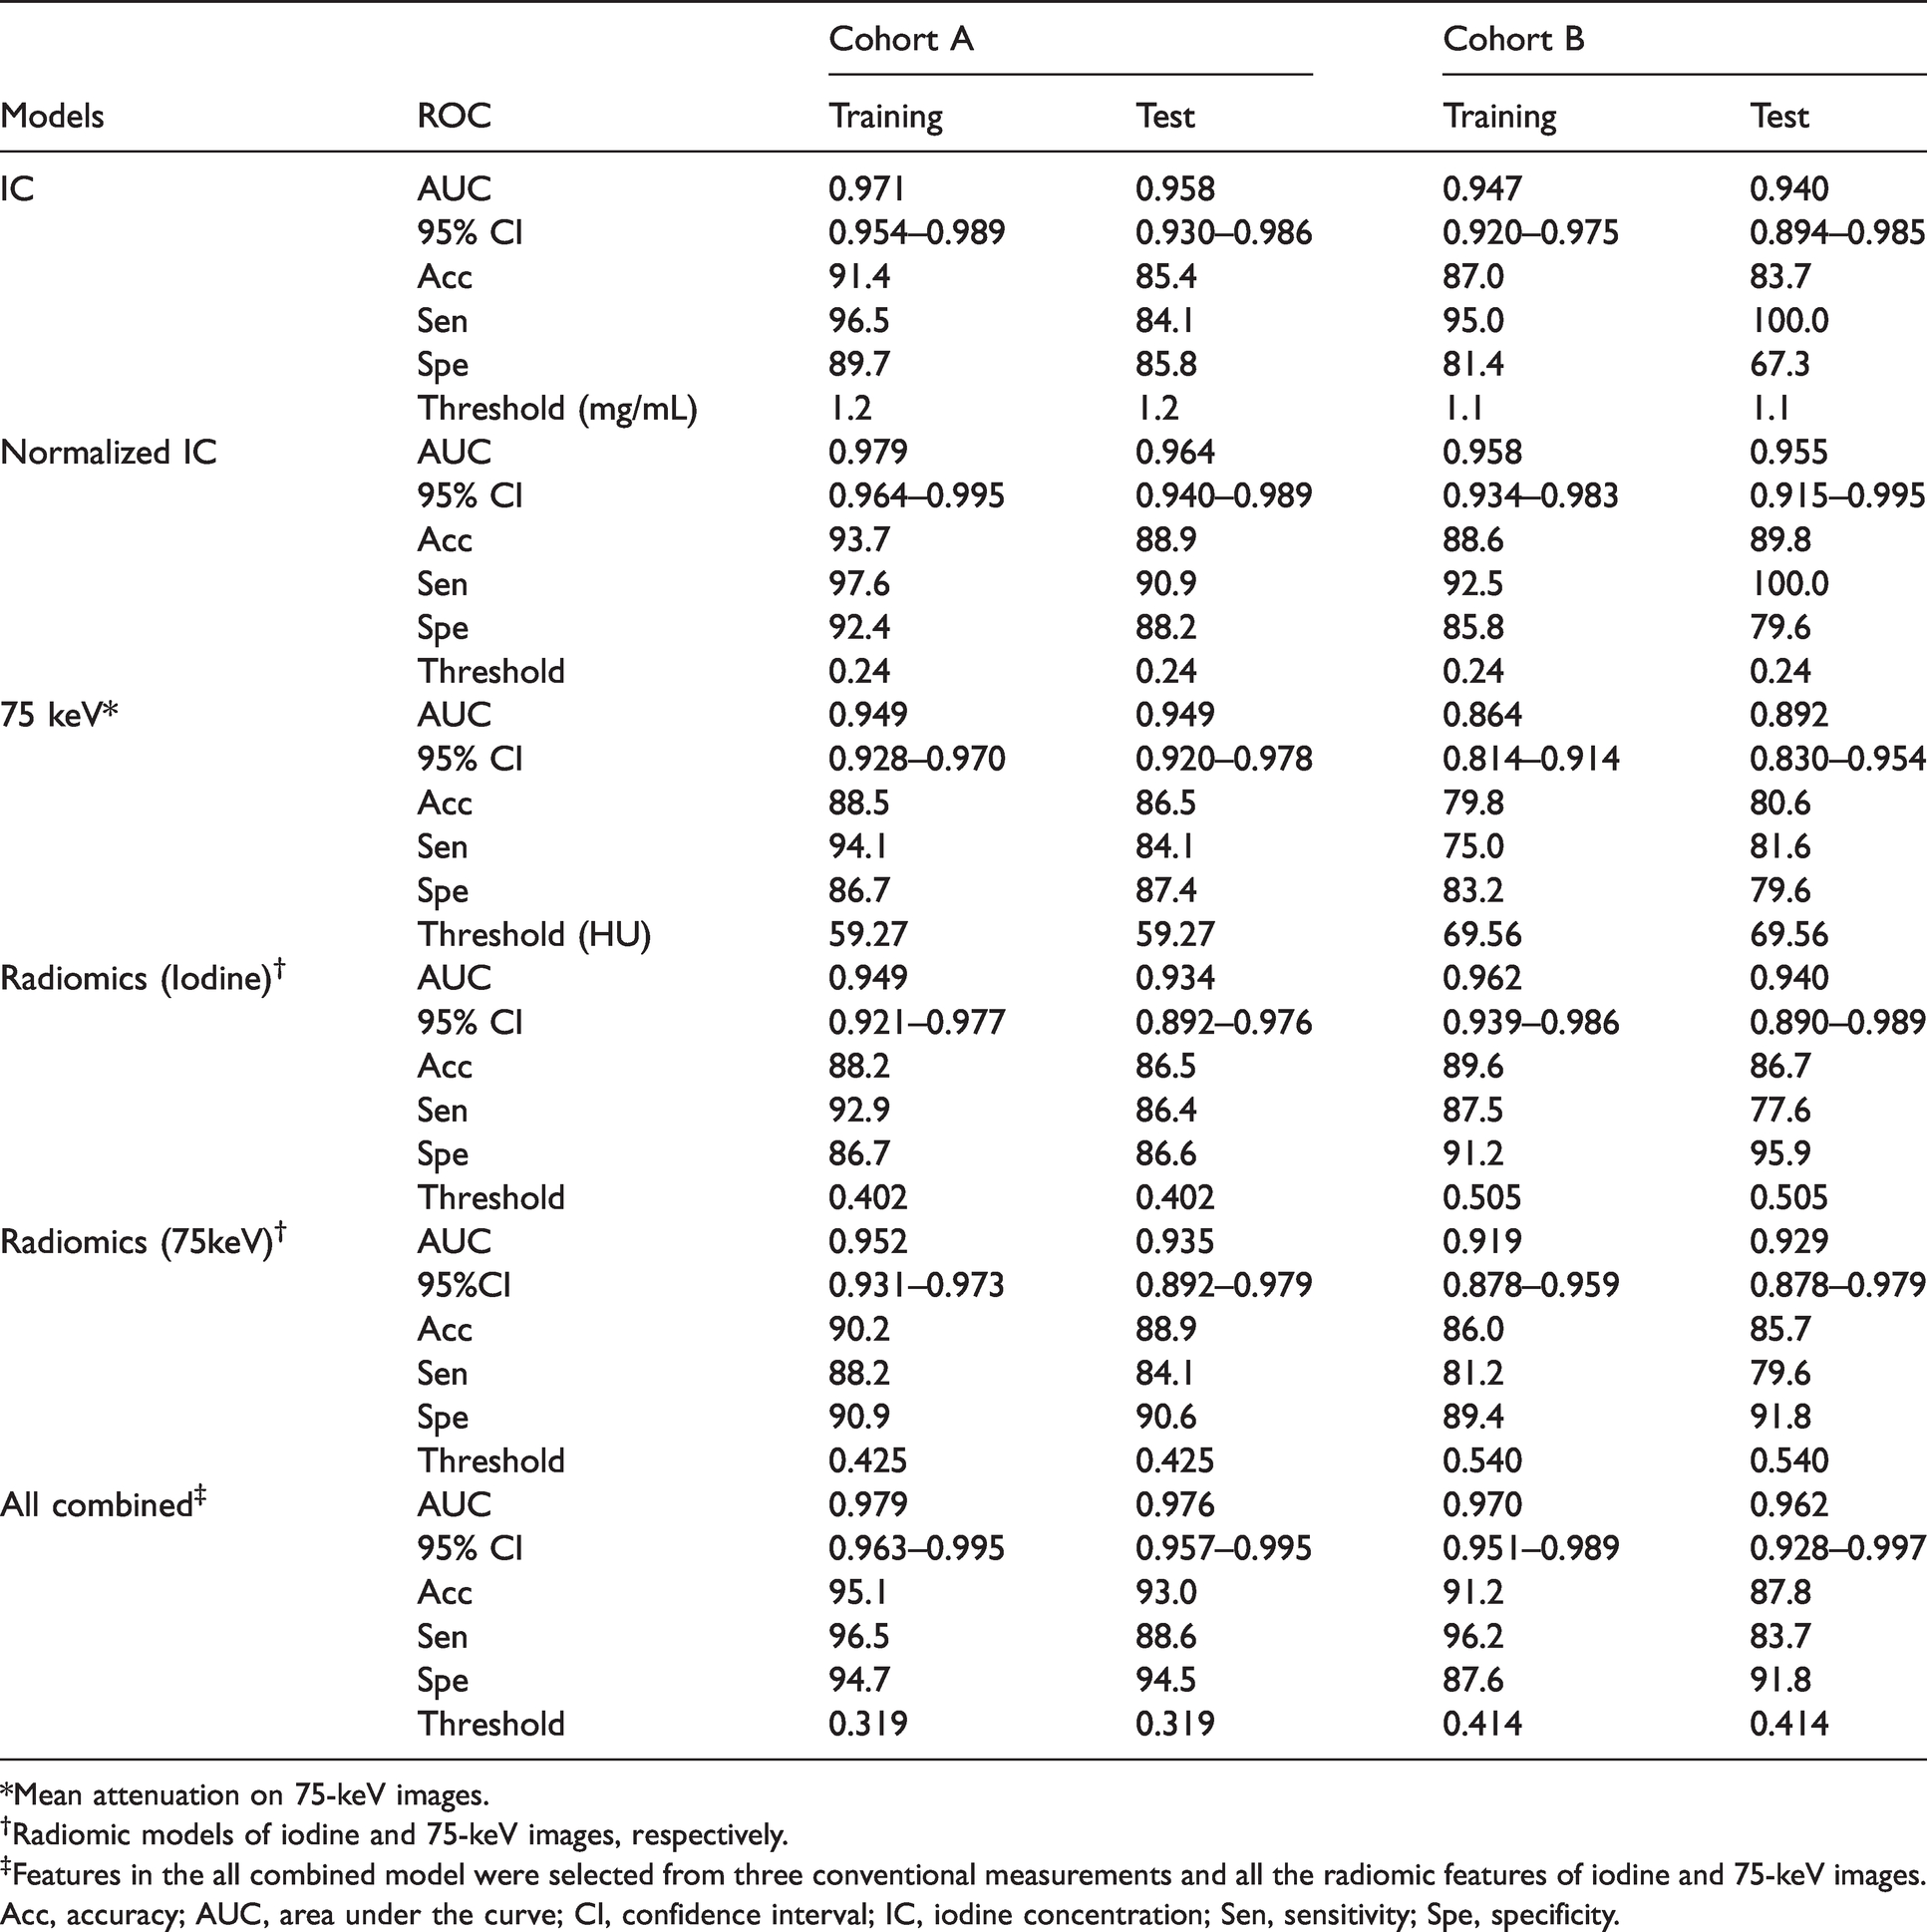
*Mean attenuation on 75-keV images.
†Radiomic models of iodine and 75-keV images, respectively.
‡Features in the all combined model were selected from three conventional measurements and all the radiomic features of iodine and 75-keV images.
Acc, accuracy; AUC, area under the curve; CI, confidence interval; IC, iodine concentration; Sen, sensitivity; Spe, specificity.

Receiver operating characteristic curves of conventional measurements and radiomic models of iodine and 75-keV images.
Features selected by LASSO in the combined model.
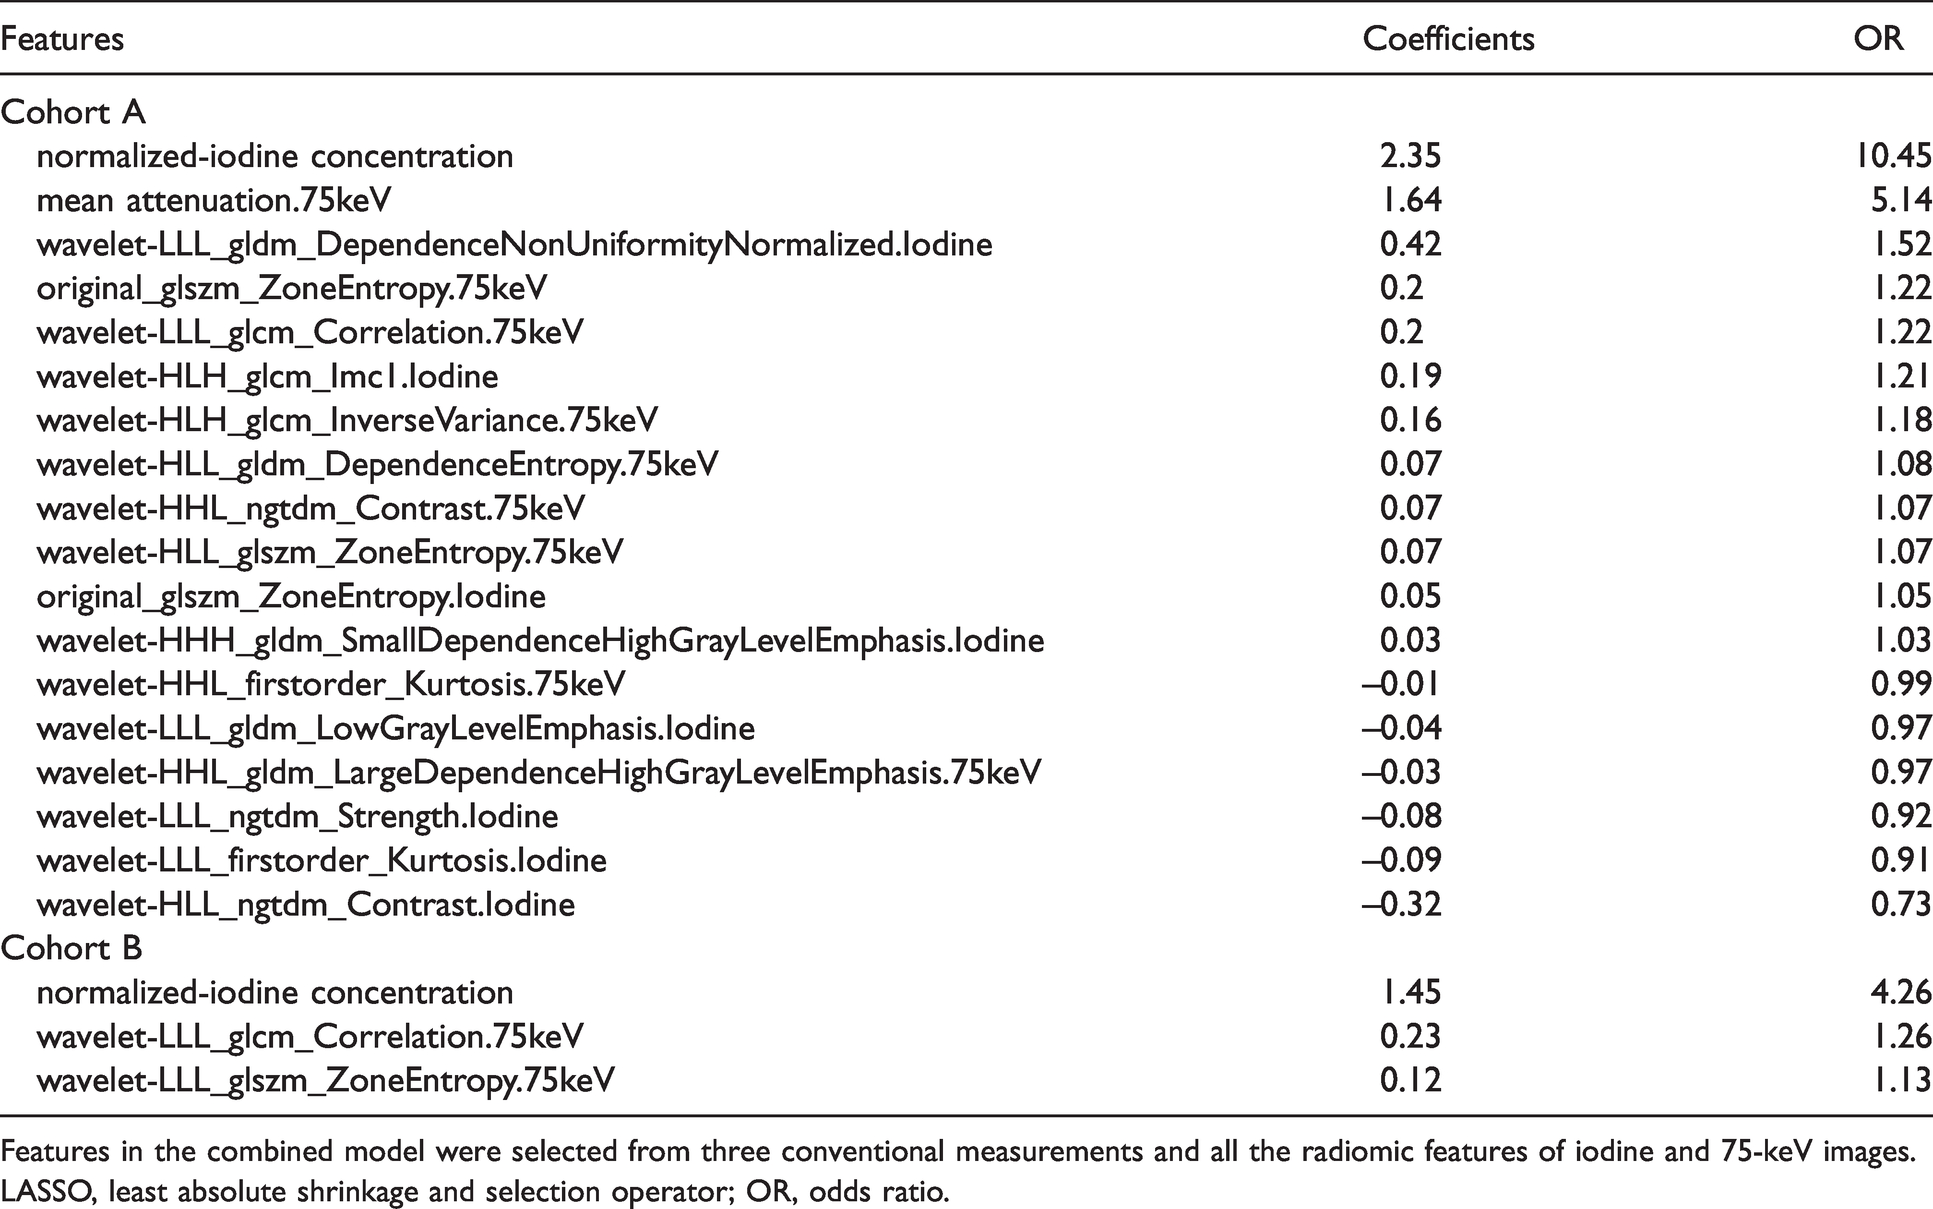
Features in the combined model were selected from three conventional measurements and all the radiomic features of iodine and 75-keV images.
LASSO, least absolute shrinkage and selection operator; OR, odds ratio.

The box-and-whisker plots show distributions of radiomic scores of the combined model in cohorts A and B. The boxes represent the 25th and 75th quartiles, the two ends of the whiskers represent the upper and lower limits, the horizontal lines represent median values, and the squares and circles represent outliers.
All five individual models (IC, normalized IC, mean attenuation on 75-keV images, radiomic model of iodine images, and radiomic model of 75-keV images), as well as the combined model, demonstrated high AUCs for predicting enhancing renal lesions in cohort A (AUCs = 0.934–0.979) and the test dataset (AUCs = 0.892–0.962) of cohort B. No statistically significant difference was found among the models after Bonferroni correction (all P values >0.003) (Table S3). However, the AUC (0.864) of mean attenuation on 75-keV images was significantly lower than other models (all P values ≤0.001) except for the radiomic model of 75-keV images (P = 0.038) in the training dataset of cohort B.
Discussion
Our study demonstrated that both conventional iodine quantification and radiomic analyses of iodine images showed high diagnostic accuracy in differentiating enhancing from non-enhancing small renal lesions. In contrast to prior studies that showed better performance of radiomic analyses of iodine images in colorectal cancer (17), lung adenocarcinoma (18,19), and hepatic lesions (20), no incremental value was found by adding radiomic and machine learning analyses to iodine images in the present study. It was not surprising that negative results were obtained in the present study, given the relatively high accuracy of conventional iodine quantification in differentiating enhancing from non-enhancing renal lesions (15,21,22). However, radiomic analysis of 75-keV images showed higher diagnostic accuracy (although not significantly different) than that of conventional lesion attenuation measurement in cohort B. Moreover, the normalized IC value outperformed all the radiomic features in the combined model of both cohort A and B.
To the best of our knowledge, this is the first study using radiomic analyses of iodine images from both rsDECT and dsDECT platforms in a relatively large patient cohort of renal lesions. Our results partly agree with a recent study using radiomic analysis of dsDECT data, when hepatic cysts (71.7%, 43/60) were included in the benign lesions, random forest classification found no significant difference between radiomics and iodine quantification, both showing high accuracies (AUC = 0.90–0.91) for differentiating benign from malignant hepatic lesions (20). In the combined model, the top two radiomic features selected by LASSO in cohort A (wavelet-LLL_gldm_DependenceNonUniformityNormalized.Iodine and original_glszm_ZoneEntropy.75keV) and cohort B (wavelet-LLL_glcm_Correlation.75keV and wavelet-LLL_glszm_ZoneEntropy.75keV) were related to the distribution and dependency of gray level values, with a higher value indicating more heterogeneity (enhancing lesions) in the texture patterns. Our results were consistent with a previous study using texture analysis of unenhanced single-energy CT images for differentiating low attenuation (≤20 HU) RCCs from simple renal cysts, the diagnostic performance of entropy was comparable to subjective evaluation by two expert readers (AUC = 0.89 vs. 0.90, respectively) (31).
The IC thresholds for distinguishing between enhancing and non-enhancing renal lesions were slightly different in cohort A (1.2 mg/mL) and cohort B (1.1 mg/mL) in the present study, and were in the range of previous reported IC thresholds (0.5–2.0 mg/mL) (11,12,14,15,21,22,32,33). Although the threshold of normalized IC (0.24) was identical in both cohorts, it was lower than those reported in previous studies (0.27 and 0.3) (11,21). Many factors may explain these discrepancies, including but not limited to differences in scanning and DE reconstruction parameters, DECT platforms, gold standard (e.g. ΔHU ≥10, 15, or 20 HU), and patient characteristics in the studies. The lower normalized IC threshold (0.24) might partially be explained by the high proportion of lesions from dsDECT platforms (71.7%, 372/519) in the present study. This may be further compounded by the fact that part of the non-enhancing lesions from dsDECT platforms showed negative IC and normalized IC values. Chandarana et al. (34) also found that IC calculation was underestimated with a mean error of 0.55 mg/mL for all concentrations >0 mg/mL in their phantom studies performed with the first and second-generation dsDECT platforms.
The present study has important clinical implications. Although radiomics has been used in a wide variety of applications in research, there are some challenges for the implementation of the current applications into real-life clinical practice (16,35,36). Given the complexity of lesion segmentation, feature extraction, model building, and the difficulty in interpretation of the selected features from radiomic data, the use of conventional iodine quantification is recommended and maybe a more practical method for differentiating enhancing from non-enhancing small renal lesions.
In addition to its retrospective design, the present study has some limitations. First, we only included truly enhancing renal lesions (25); the choice of ΔHU ≥20 HU as the enhancement threshold may be penalized by misclassification of low-level truly enhancing neoplasms (e.g. papillary RCC). Moreover, only 28.7% (37/129) of the enhancing renal lesions were pathologically confirmed. However, this can be expected because active surveillance is an acceptable clinical protocol for the management of small renal masses (37). Second, our data in cohort A are imbalanced due to the low proportion (24.9%, 129/519) of enhancing renal lesions, which may lead to constitutively biased results (38). The clustering effect was unavoidable because up to four lesions were chosen from one patient in our study (30). Third, we only analyzed the variability of radiomic features in inter-observer segmentation differences of 50 randomly selected patients; other factors including but not limited to acquisition and reconstruction technique, vendor, spatial-temporal resolution, radiomic software package, and so on were not evaluated in this study (27,39). As a result, it remains to be determined whether our results can be replicated with other patient cohort and DECT platforms.
In conclusion, no incremental value was found by adding radiomic and machine learning analyses to iodine images. Conventional iodine quantification is recommended as a more practical method given the comparable and relatively high accuracy in differentiating enhancing from non-enhancing small renal lesions.
Supplemental Material
sj-pdf-1-acr-10.1177_02841851211010396 - Supplemental material for Can radiomic analysis of a single-phase dual-energy CT improve the diagnostic accuracy of differentiating enhancing from non-enhancing small renal lesions?
Supplemental material, sj-pdf-1-acr-10.1177_02841851211010396 for Can radiomic analysis of a single-phase dual-energy CT improve the diagnostic accuracy of differentiating enhancing from non-enhancing small renal lesions? by Yuqin Ding, Mathias Meyer, Peijie Lyu, Francesca Rigiroli, Juan Carlos Ramirez-Giraldo, Kyle Lafata, Siyun Yang and Daniele Marin in Acta Radiologica
Footnotes
Acknowledgements
The authors thank Félix Lades (Siemens Healthineers) for providing the prototype software Radiomics used in this study and excellent technical support.
Declaration of conflicting interests
The authors of this manuscript declared the following potential conflicts of interest with respect to the research, authorship, and/or publication of this article: Yuqin Ding received a funding as research fellowship from Siemens Healthineers (related to this study); Peijie Lyu received a funding as research fellowship from GE Healthcare (not related to this study); Francesca Rigiroli received a funding as research fellowship from Bracco Diagnostics Inc (not related to this study); Juan Carlos Ramirez-Giraldo works as a scientist for Siemens Healthineers, who had no control of any data that might present a conflict of interest. All the other authors of this manuscript declare no relationships with any companies, whose products or services may be related to the subject matter of the article.
Funding
The authors received no financial support for the research, authorship, and/or publication of this article.
Supplemental material
Supplemental material for this article is available online.
References
Supplementary Material
Please find the following supplemental material available below.
For Open Access articles published under a Creative Commons License, all supplemental material carries the same license as the article it is associated with.
For non-Open Access articles published, all supplemental material carries a non-exclusive license, and permission requests for re-use of supplemental material or any part of supplemental material shall be sent directly to the copyright owner as specified in the copyright notice associated with the article.