
Abstract
Background
Little is known about the value of dynamic contrast-enhanced (DCE) in combination with diffusion-weighted imaging (DWI) for the differentiation of lacrimal gland tumors.
Purpose
To evaluate the ability of DCE and DWI in differentiating lacrimal gland tumors.
Material and Methods
DCE and DWI were performed in 72 patients with lacrimal gland tumors. Time-intensity curve (TIC) patterns were categorized as type A, type B, type C, and type D. Apparent diffusion coefficient (ADC) was measured on DWI. Then, the diagnostic effectiveness of TIC in conjunction with ADC was assessed using classification and regression tree (CART) analysis.
Results
Type A tumors were all epithelial; they could be further separated into pleomorphic adenoma sand carcinomas. Type B tumors were all non-epithelial tumors, which could be further separated into benign inflammatory infiltrates (BIIs) and lymphomas. Type C tumors contained both carcinomas and non-epithelial tumors, which could be diagnosed into carcinomas, BIIs and lymphomas. Type D tumors were all PAs. The mean ADC of epithelial tumors was significantly higher than that of non-epithelial tumors, and the mean ADC values were significantly different between PAs and carcinomas. Besides, the mean ADC value of BIIs was higher than that of lymphomas. Therefore, the CART decision tree made by ADC and TIC had a predictive accuracy of 86.1%, differentiating lacrimal gland tumors effectively.
Conclusion
Combined DCE and DWI-MRI can efficiently differentiate lacrimal gland tumors which can be of help to ophthalmologists in the diagnosis and treatment of these tumors.
Keywords
Introduction
The lacrimal gland can be affected by a broad spectrum of benign and malignant tumors of epithelial and non-epithelial origins. The treatment and surgical approach are different among different types of lacrimal gland tumors (benign and malignant, and epithelial and non-epithelial), making accurate preoperative differential diagnoses of these entities highly desirable (1). Specifically, benign lacrimal gland tumors, such as benign inflammatory infiltrates (BIIs) of reactive lymphoid hyperplasia (RLH) and inflammatory pseudotumor, may show excellent responses to systemic or local corticosteroid therapy, while the malignancies should be treated with surgical resection, radiotherapy, and/or chemotherapy (2). Moreover, for epithelial tumors such as pleomorphic adenoma (PA) and carcinoma, complete excision is frequently recommended in clinical practice, whereas non-epithelial tumors, mainly lymphomas, usually undertake local radiotherapy or systemic chemotherapy, depending on tumor type and stage (3). Even in epithelial tumors, the benign PA is usually resected with minimal damage to the adjacent tissue, and should only be performed with complete tumor resection, but the carcinomas require a more careful cure for the uninvolved surrounding margin (4).
Clinically, magnetic resonance imaging (MRI) plays an important role in diagnosing lacrimal tumors. However, the morphological features demonstrated on MRI among different lacrimal tumors are often non-specific and overlap. Therefore, preoperative diagnosis of lacrimal gland tumors remains challenging, even for ophthalmologists and radiologists with considerable experience in orbital diseases (5). Functional MRI, such as dynamic contrast-enhanced (DCE) and diffusion-weighted imaging (DWI), is capable of quantifying the tumoral cellularity and microvascular perfusion, and have been reported to be useful for differentiating malignant from benign tumors in several regions, including the salivary glands (6–10). In addition, some studies have also confirmed that DWI or DCE holds the ability for the diagnosis of orbital tumors and cellulitis (11–15). In previous studies (16), DWI could effectively differentiate between benign and malignant tumors in lacrimal masses: the mean ADC value of malignant tumors significantly was lower than that of benign PAs. However, these studies only focused on the categorization of benign and malignant entities, which was not sufficient for preoperative diagnostic and treatment planning, because the treatment of lacrimal gland tumors also differs between epithelial and non-epithelial origins. In this regard, despite the promising potential of DWI, other modalities may be needed to further differentiate lacrimal gland tumors.
Recent studies have shown that the diagnostic performance can be highly improved when DWI and DCE-MRI are used in combination (17–19). In a recent study of lacrimal gland masses, Feng et al. (20) reported the differential diagnosis of inflammatory pseudotumor and lymphoma in the lacrimal gland with the combination of DWI and DCE-MRI. However, no comprehensive studies have been performed to differentiate lacrimal gland tumors from different types (including benign and malignant as well as epithelial and non-epithelial tumors) using the combination of DCE-MRI and DWI. Classification and regression tree (CART) analysis is a tree-building method that uses binary recursive partitioning, which can be applied in clinical settings to assist in radiological and clinical decision-making. Therefore, the aim of the present study was to analyze the parameters of DCE and DWI, and build a CART model using DCE in combination with DWI to differentiate lacrimal gland tumors.
Material and Methods
Participants
The institutional review board of our hospital approved this retrospective study; the requirement for patient informed consent was waived due to the retrospective nature of the study. Our study cohort or part of it was not used in previous published studies by the authors.
A total of 80 patients with histopathologically proven lacrimal gland tumors were searched from September 2011 to October 2014 based on the following inclusion criteria: (i) lacrimal gland tumor was confirmed by histopathology; (ii) comprehensive MRI including DWI and DCE were available; and (iii) the tumor was a primary lacrimal gland tumor. The exclusion criteria were as follows: (i) the quality of the image was insufficient due to severe artefacts (n = 3); (ii) the lesion was deemed too small (<10 mm in short-axis diameters) (n = 2); and (iii) the patient had a history of fine needle aspiration biopsy, surgery, or medical treatment before MR examinations (n = 3). Finally, 72 patients (38 men, 34 women; mean age = 46 years; age range = 14–81 years), were enrolled. The histopathological types of lacrimal tumors were as follows: PA (n = 35); adenoid cystic carcinomas (ACC) (n = 6); carcinoma expleomorphic adenomas (CEPAs; n = 9); adenocarcinoma (n = 5); mucoepidermoid carcinoma (n = 1); myoepithelial carcinoma (n = 1); RLH (n = 3); inflammatory pseudotumor/IgG-4 related disease (n = 3); Miculicz disease (n = 1); and lymphoma (n = 8). The treatment principles are consistent among the various kinds of carcinomas, which were analyzed together as a whole category, namely “carcinoma.” RLH, inflammatory pseudotumor/IgG-4 related disease, and Miculicz disease were analyzed together as a whole category, namely “benign inflammatory infiltrates.” The average tumor area was 4.09 ± 2.9 cm2 (area = 1/2 length × width2). The flow diagram for patient selection is shown in Fig. 1.
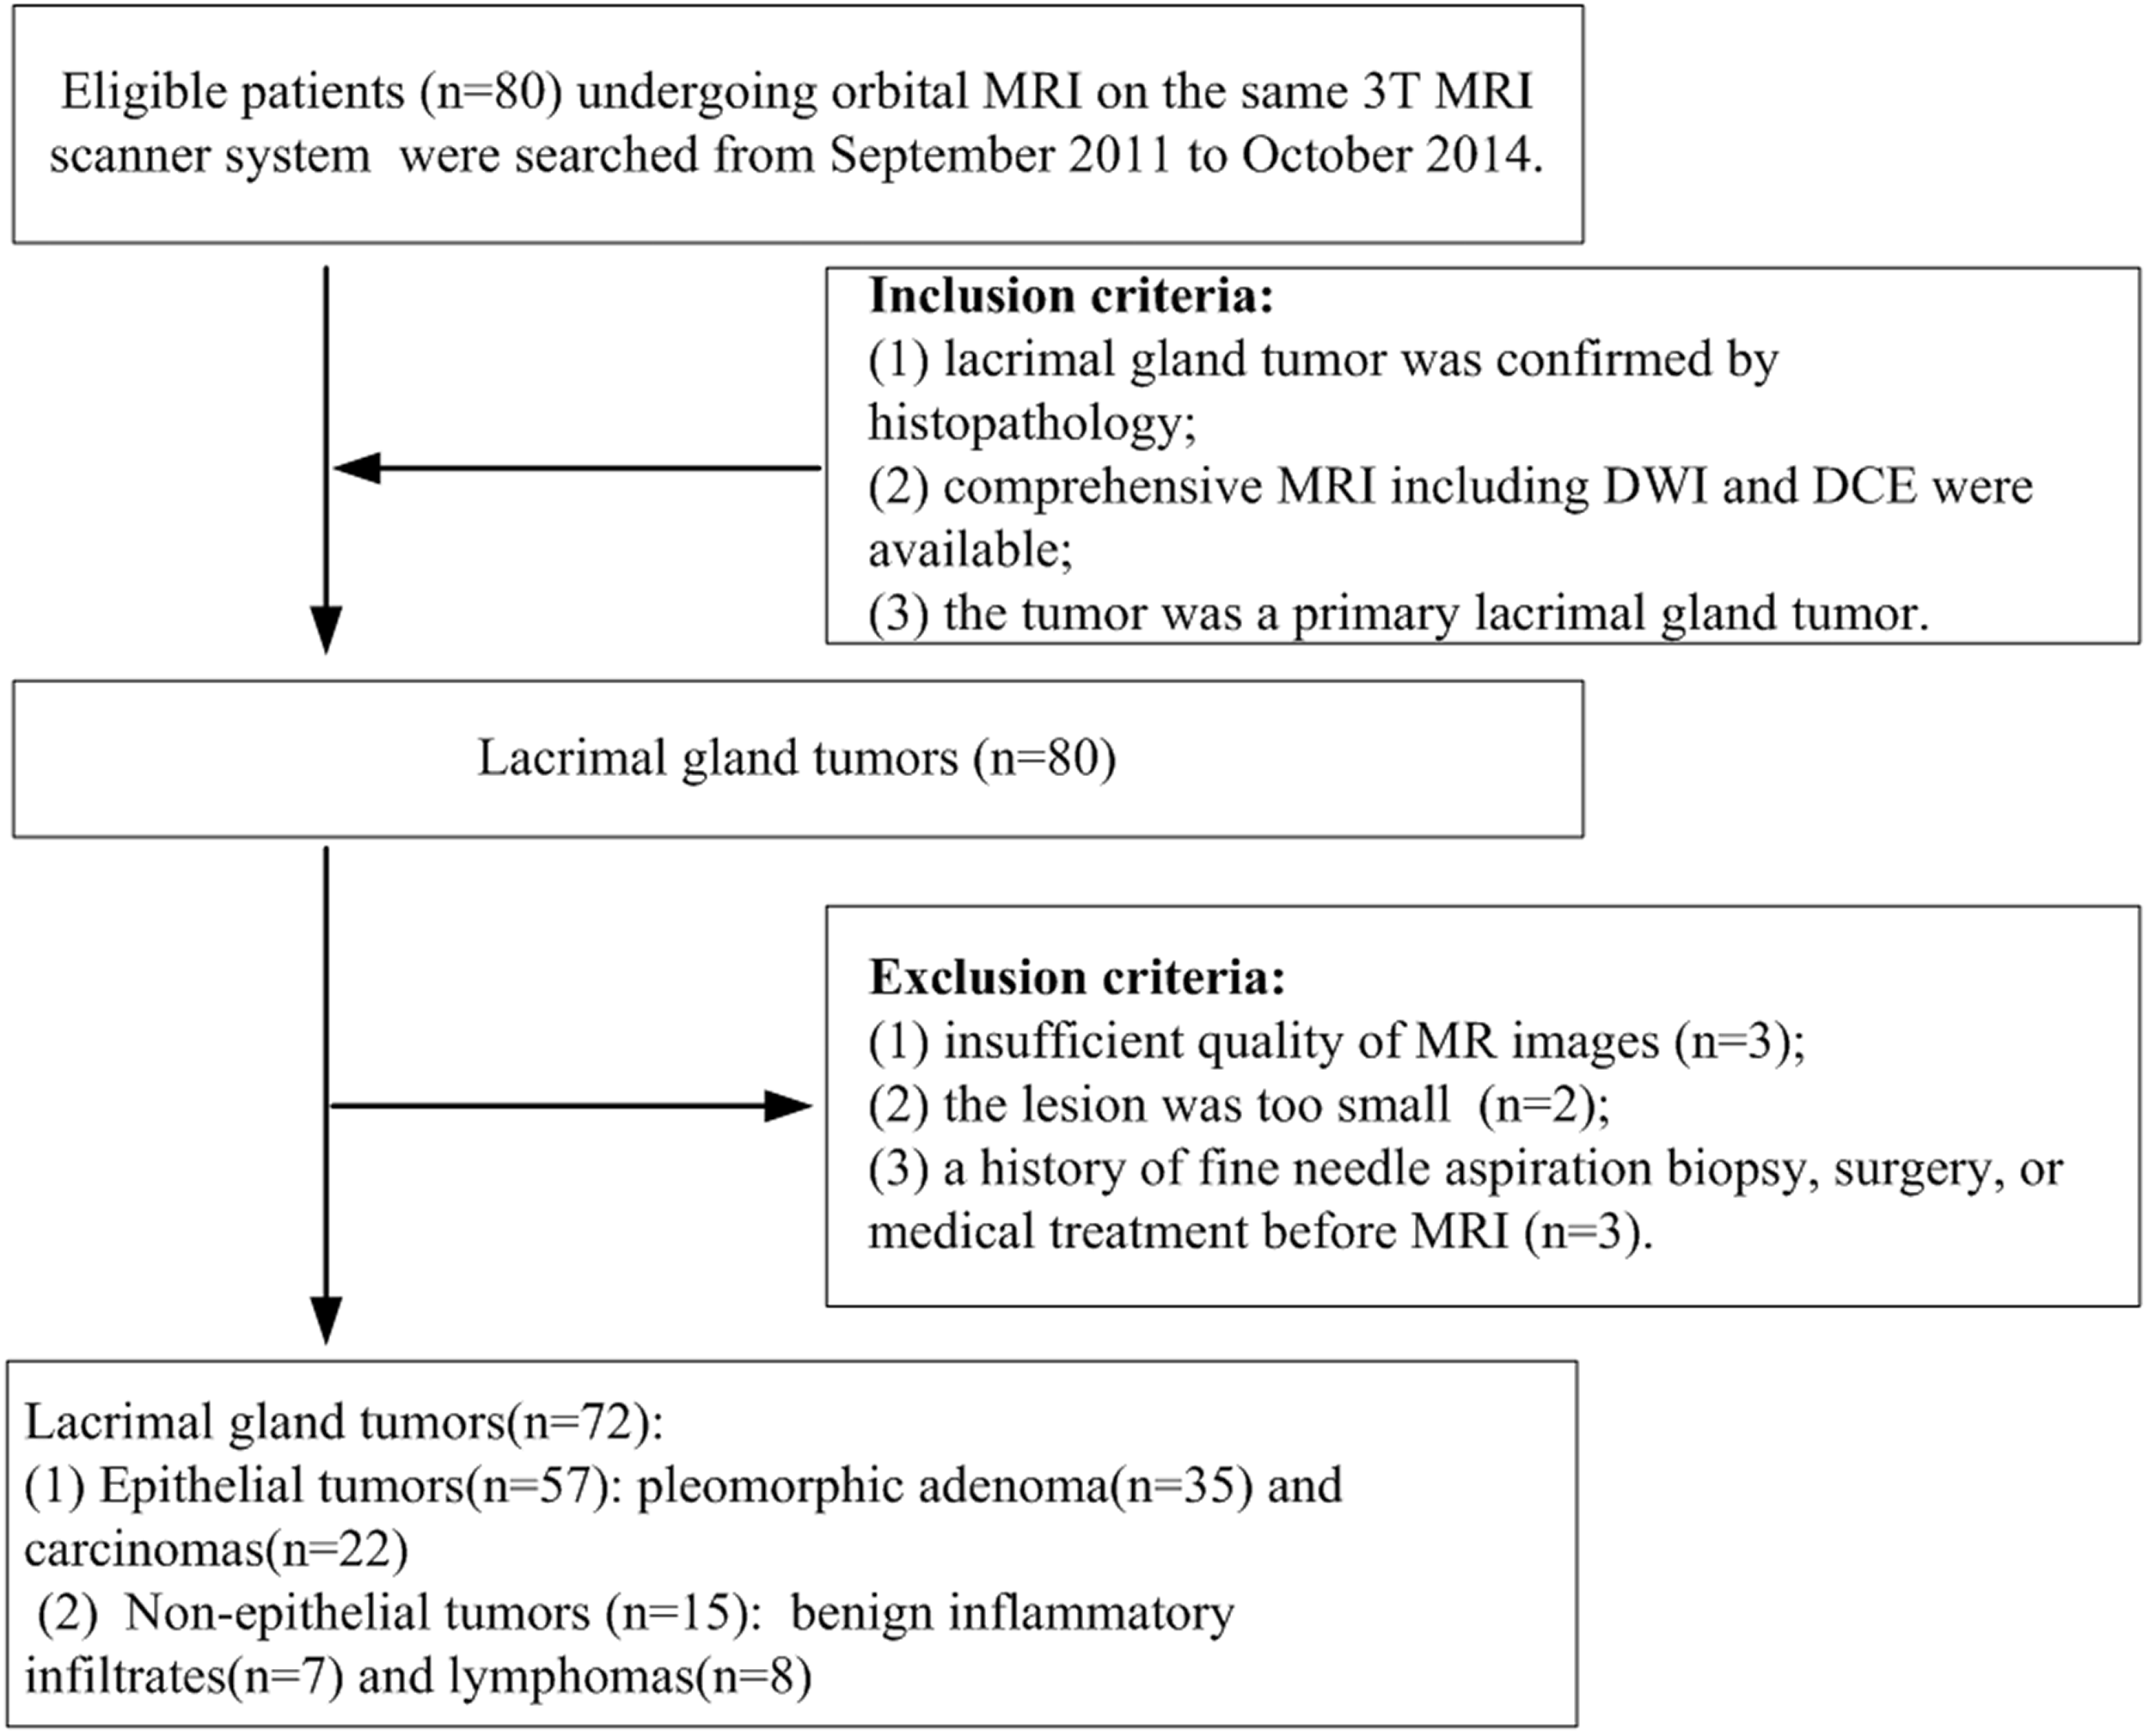
Flow diagram for depicting the patient selection process.
Magnetic resonance imaging
MR images were obtained with a MAGNETOM® Verio 3T MRI scanner system (Siemens Medical Solutions, Erlangen, Germany) using a 12-channel high-resolution quadrature head coil. Axial and coronal T2-weighted MR sequences were performed with repetition time (TR)/echo time (TE) of 4500–5500/96 ms, followed by a transverse T1 flair sequence with TR/TE of 4490/9 ms. We used a field of view (FOV) of 24 × 24 cm, section thickness of 3 mm, interslice gap of 0.45, and matrix of 320 × 320.
DCE-MRI was conducted by a two-dimensional fast spoiled gradient-recalled echo (FSPGR) sequence with 300/8.5 ms (TR/TE), flip angle of 150°, one excitation, an acquisition matrix of 256 × 154, FOV of 220 × 220 mm, section thickness of 3 mm, and interslice gap of 0.15 mm. Gadopentetate dimeglumine (Beijing BEILU Pharmaceutical Co. Ltd., Beijing, PR China), the contrast agent, was administered (0.2 mL/kg body weight) at a rate of 2.0 mL/s followed by a 20-mL saline flush into the antecubital vein. The scanning and contrast agent injection were started simultaneously. Ten scans were obtained for each patient, each of which was obtained for 17 s without leaving time intervals. Six imaging sections containing the mid-portions of the tumors in the axial plane were taken for DCE. Total scanning time for DCE imaging was 174 s. After the DCE imaging, axial, coronal, and sagittal fat suppression T1-weighted MR images (TR/TE = 455–568/11 ms) were performed with an acquisition matrix of 320 × 240.
The DWI was conducted in the transverse plane using a spin-echo echo-planar imaging sequence and b-values of 0 and 1000 s/mm2. The following imaging parameters were used: TR/TE = 4700/78 ms; FOV = 23 × 23 cm; section thickness = 3 mm; interslice gap = 0.45 mm; excitation number = 3; matrix = 128 × 128; and radiofrequency (RF) pulse bandwidth = 1028. The data acquisition time was 81 s.
Data processing
All the MR images were reviewed in a masked fashion, without the knowledge of the final diagnosis. For cases with bilateral tumors, the tumor diagnosed histopathologically was analyzed. The regions of interest (ROIs) were delineated manually, which were placed on the relatively homogeneous area on the DCE series, avoiding the necrotic, hemorrhagic, and cystic areas. Signal intensity (SI) of multiple regions on DCE imaging was measured and areas with high SI were selected. Subsequently, TIC was drawn based on the time-dependent average SI within the ROI both by the workstation and by SigmaPlot™ software version 12.0 (Systat Software Inc., San Jose, CA, USA). Some parameters were computed by equations according to Eida (18): enhancement ratio (ER) = (SIpeak – SIpre-enhancement)/SIpre-enhancement; Tpeak = time required to reach the intensity peak; washout ratio (WR) = (SIpeak – SIthe end)/(SIpeak – SIpre-enhancement), in which SIpeak is equal to the maximum SI during dynamic contrast enhancement, SIpre-enhancement is equal to the SI before CA injection, and SIthe end is equal to the SI at the end of the dynamic enhancement scanning. According to the TIC categorization reported previously by Yabuuchi et al. (17), the TIC was also classified into four types as follows: type A (persistent), Tpeak > 120 s, ER > 20%; type B (washout), Tpeak ≤ 120 s, high WR (> 30%), ER > 20%; type C (plateau), Tpeak ≤ 120 s, low WR (≤ 30%), ER > 20%; and type D (flat), ER ≤ 20%.
Standard mono-exponential DWI is expressed by the following equation (21): Sb/S0 = exp (-b·ADC), where Sb and S0 are the SI in the diffusion gradient factors of b and 0, respectively. ADC can be calculated by fitting the signal with b values of 0 and 1000 s/mm2 to this model. Thereafter, for each slice, ADC maps were calculated automatically on a commercially available workstation (syngo® MultiModality Workplace; Siemens Healthcare, Erlangen, Germany). For ADC measurements, based on a ROI of DCE image, four regions were selected, which were 3–10 mm2 and carefully confined to avoid the cystic, necrotic, or hemorrhagic areas. In addition, the average ADC based on four ROIs was selected as the mean ADC.
Statistical analysis
The continuous data were presented as the mean accompanied by 95% confidence intervals (CI). The categorical variables were presented as frequency accompanied by percentages. For continuous data, the differences between groups were analyzed using the non-parametric Mann–Whitney test, as the variances in the different groups were not homogeneous. Further, the Bonferroni correction was used to determine the differences, in which P < 0.025 (0.05/2, because we performed a multilevel comparison) was deemed statistically significant. The chi-square test for categorical variables was used to determine the differences. Receiver operating characteristic (ROC) curve analysis was performed to assess the power of ADC values to differentiate epithelial tumors from non-epithelial tumors, carcinomas from PAs, and lymphomas from BIIs. The statistical analyses mentioned above were conducted using SPSS® software version 19.0 (SPSS Inc., Chicago, IL, USA). A CART decision-tree model was established to evaluate the preoperative diagnosis by ADC and TIC. CART analyses were performed using R statistical software (version 4.0.3; The R project for Statistical Computing, Vienna, Austria). A micro-average ROC curve was used to evaluate the average performance across categories of the decision-tree model, because the diagnosis variant was divided into four categories. The confusion matrix was used to evaluate the diagnosis accuracy of the model. The statistically significant level was set as P < 0.05.
Results
Features of DCE in lacrimal gland masses
As demonstrated in Table 1, the epithelial tumors exhibit types A, C and D patterns. Among them, 91% (32/35) of the PA showed type A patterns and 64% (14/22) of carcinomas showed type C patterns. Non-epithelial tumors exhibited type B and C patterns, and 57% (4/7) of BIIs and 88% (7/8) of lymphomas showed type C patterns. Examples of A, B, and C patterns are shown in Figs. 2–4. Significant differences of TIC types were found between epithelial and non-epithelial lacrimal gland tumors, and between benign and malignant tumors (both P < 0.001). The TIC patterns of PA were significantly different from those of carcinomas (P < 0.001). However, there was no significant difference between lymphomas and BIIs (P = 0.179). ER, another DCE parameter, showed no significant difference between benign and malignant tumors (P = 0.081), epithelial and non-epithelial tumors (P = 0.200), PAs and carcinomas (P = 1.000), or lymphomas and BIIs (P = 0.232). Tumors exhibiting type A patterns contained 32 PAs and eight carcinomas, with no non-epithelial tumors; while tumors exhibiting type B patterns consisted of three BIIs and one lymphoma. Two cases exhibiting type D patterns were PAs. As such, tumors with type A and D patterns were epithelial and tumors with type B patterns were non-epithelial. However, tumors with type C patterns could be both epithelial and non-epithelial tumors (including one PA, 14 carcinomas, seven lymphomas, and four BIIs), which cannot be differentiated by TIC alone.
Distribution of DWI and DCE parameters in lacrimal gland tumors.
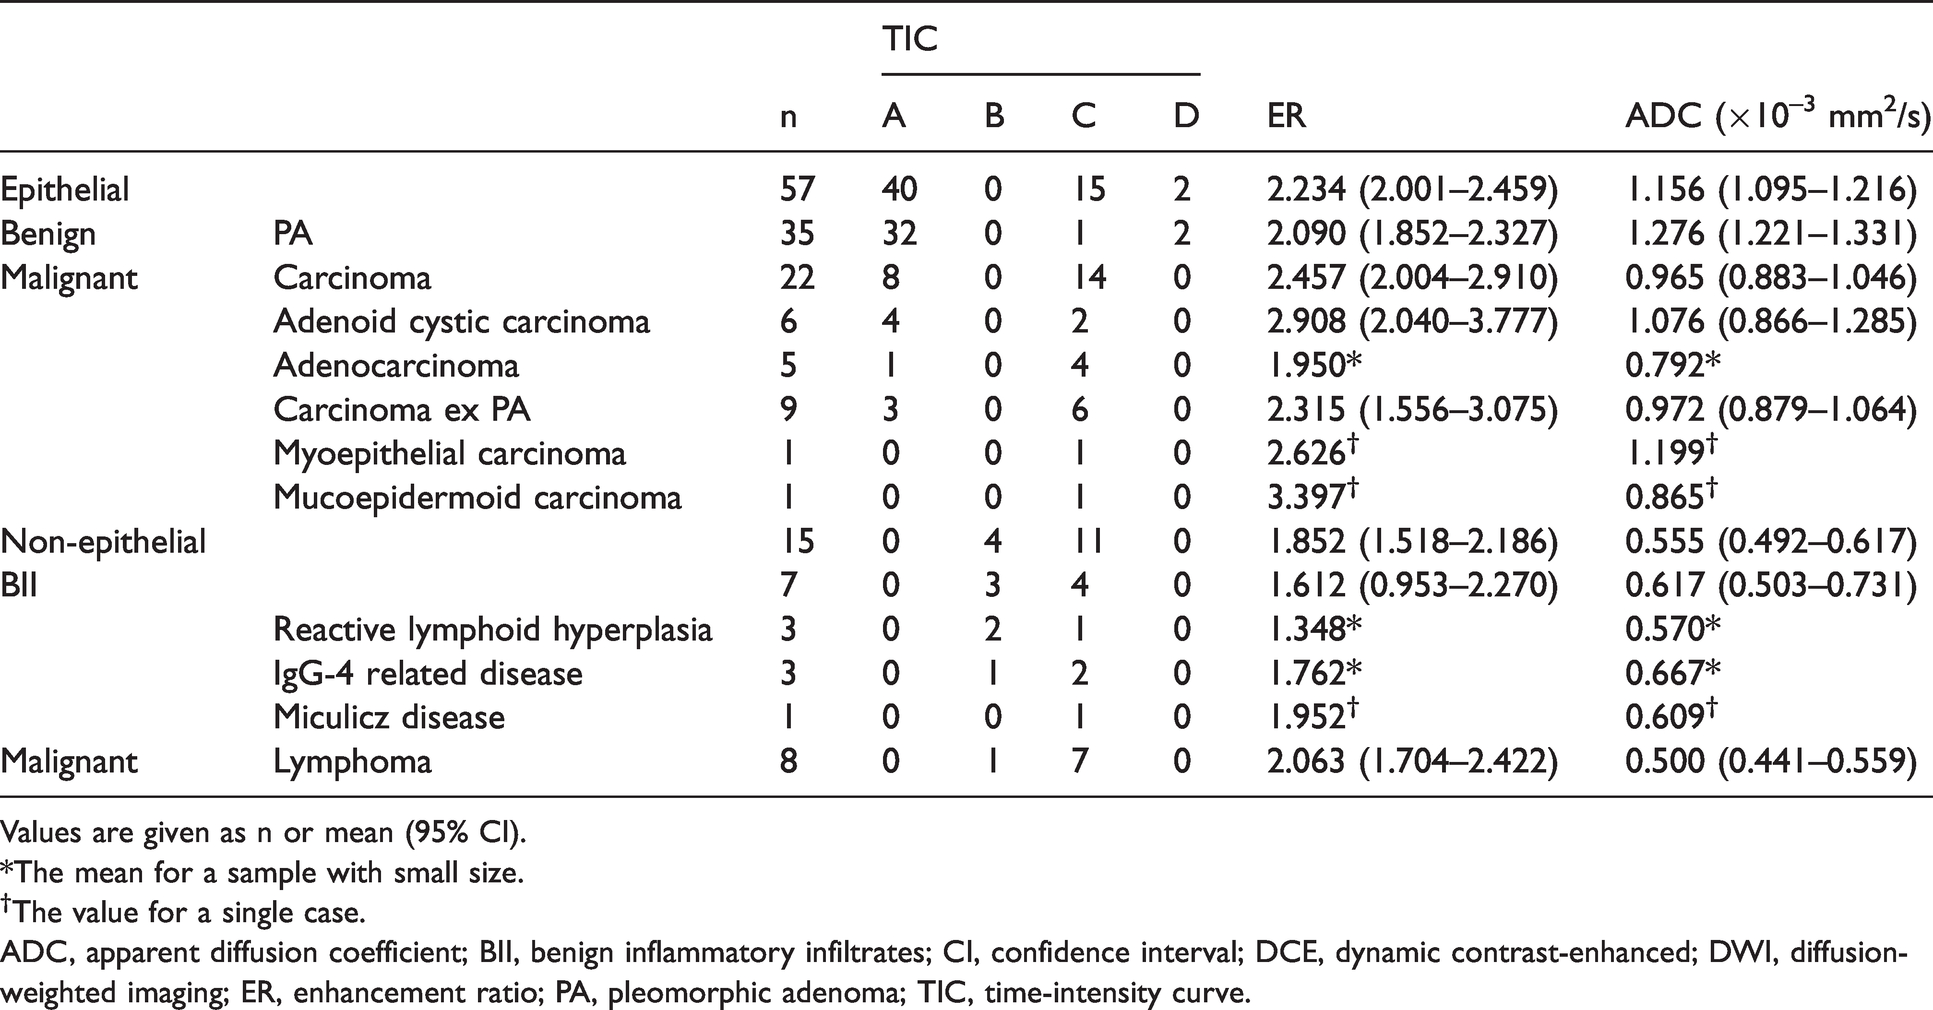
Values are given as n or mean (95% CI).
*The mean for a sample with small size.
†The value for a single case.
ADC, apparent diffusion coefficient; BII, benign inflammatory infiltrates; CI, confidence interval; DCE, dynamic contrast-enhanced; DWI, diffusion-weighted imaging; ER, enhancement ratio; PA, pleomorphic adenoma; TIC, time-intensity curve.
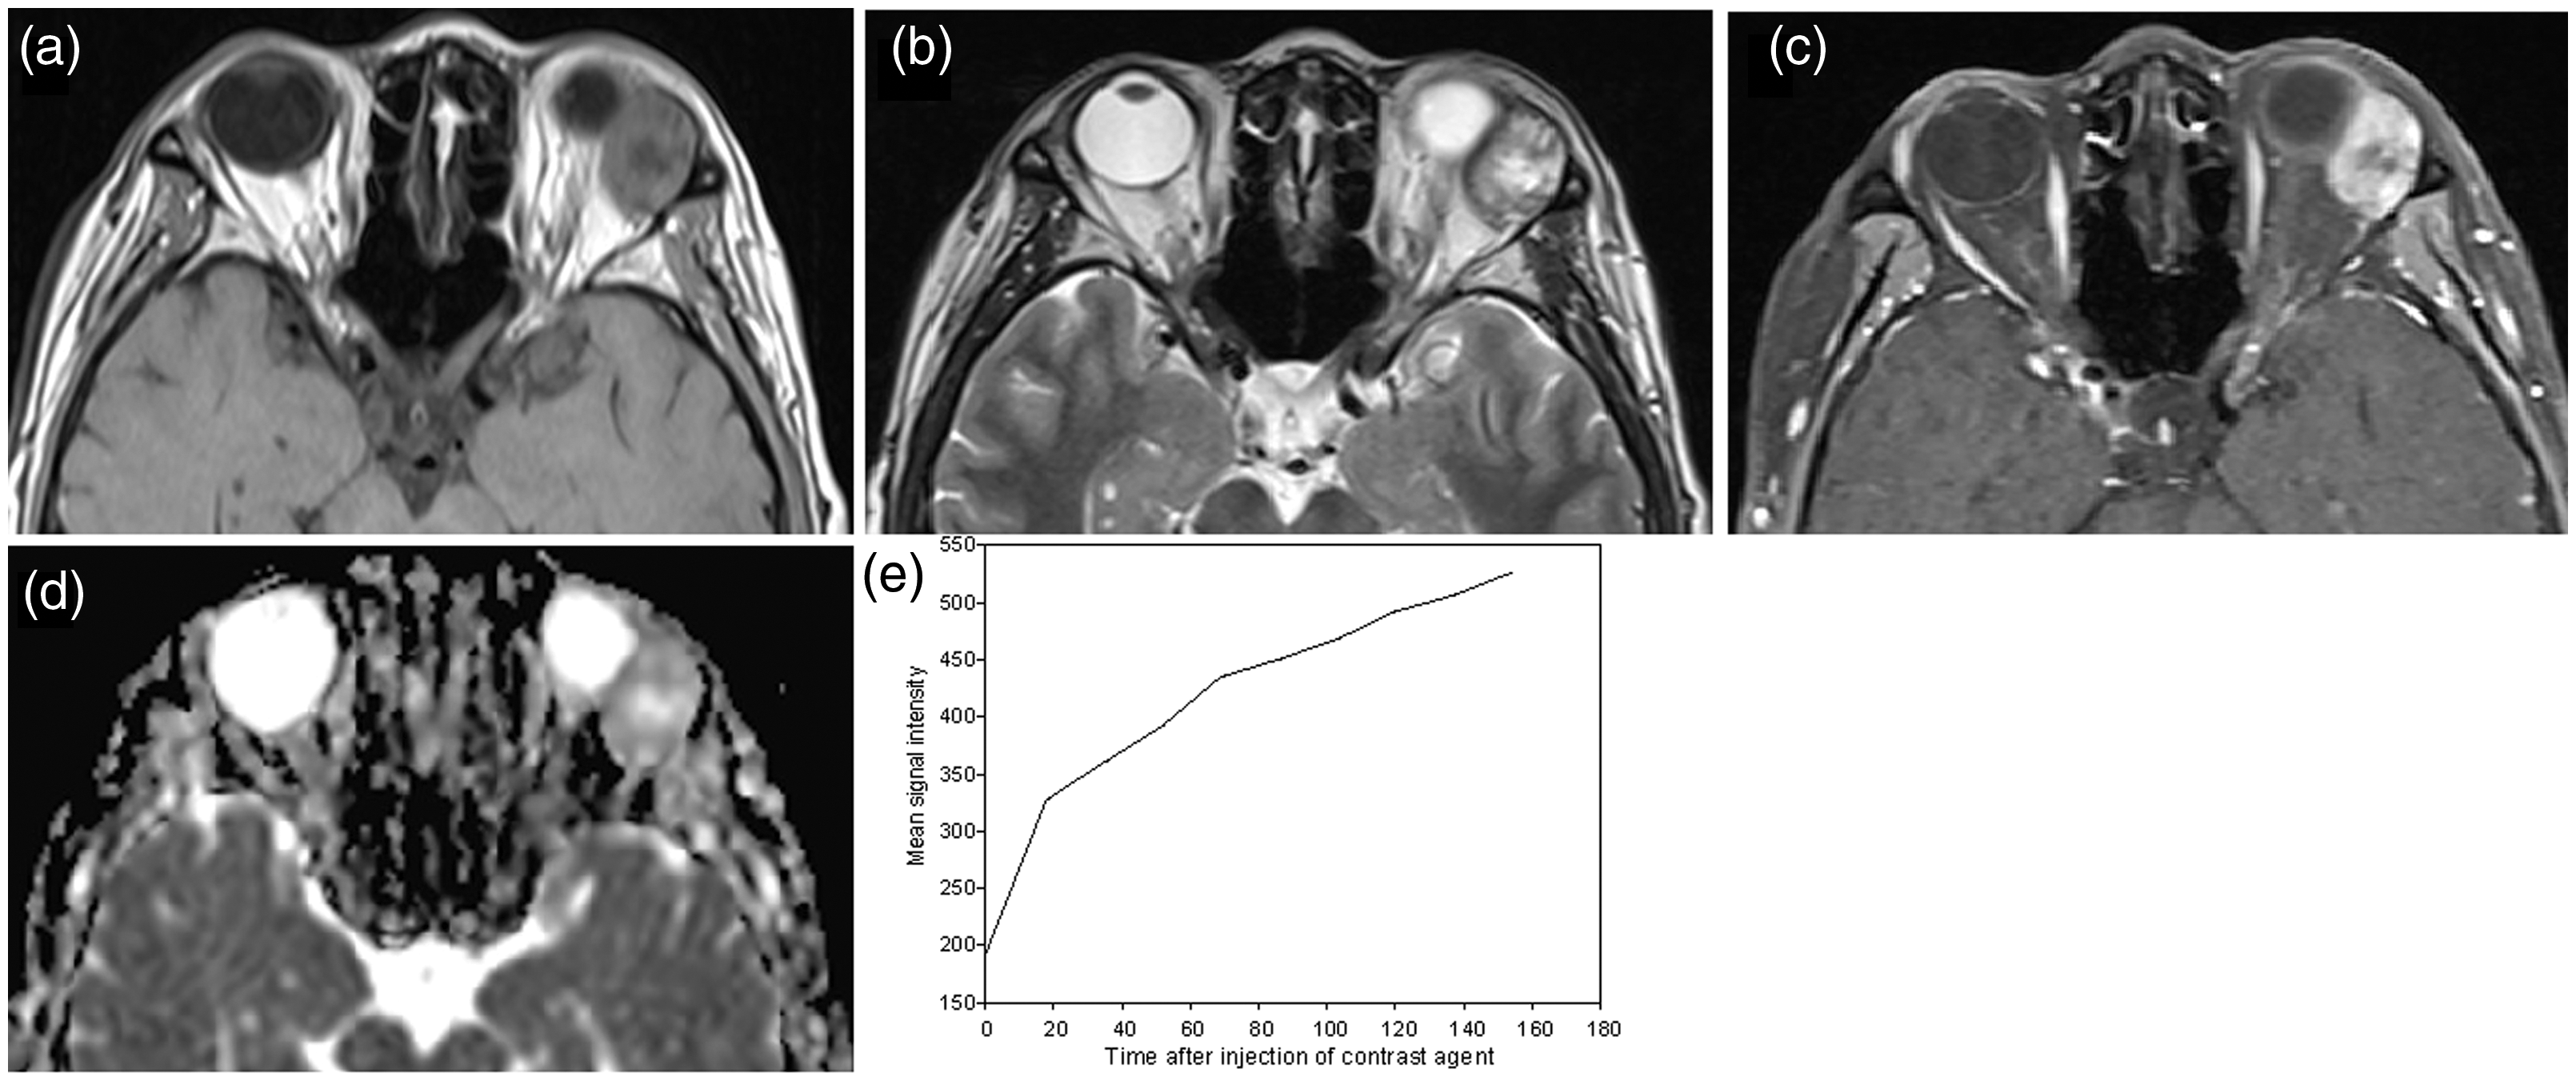
PA in the left lacrimal gland of a 58-year-old man. (a, b) The tumor is isointense on T1- and T2-weighted images, with cystic areas in the central region. (c) Marked tumor enhancement with cysts remaining unenhanced. (d) The PA is slightly bright on the ADC map, with a mean ADC value of 1.360 × 10⁻³ mm2/s. (e) TIC shows a type A pattern. ADC, apparent diffusion coefficient; MRI, magnetic resonance imaging; PA, pleomorphic adenoma; TIC, time-intensity curve.
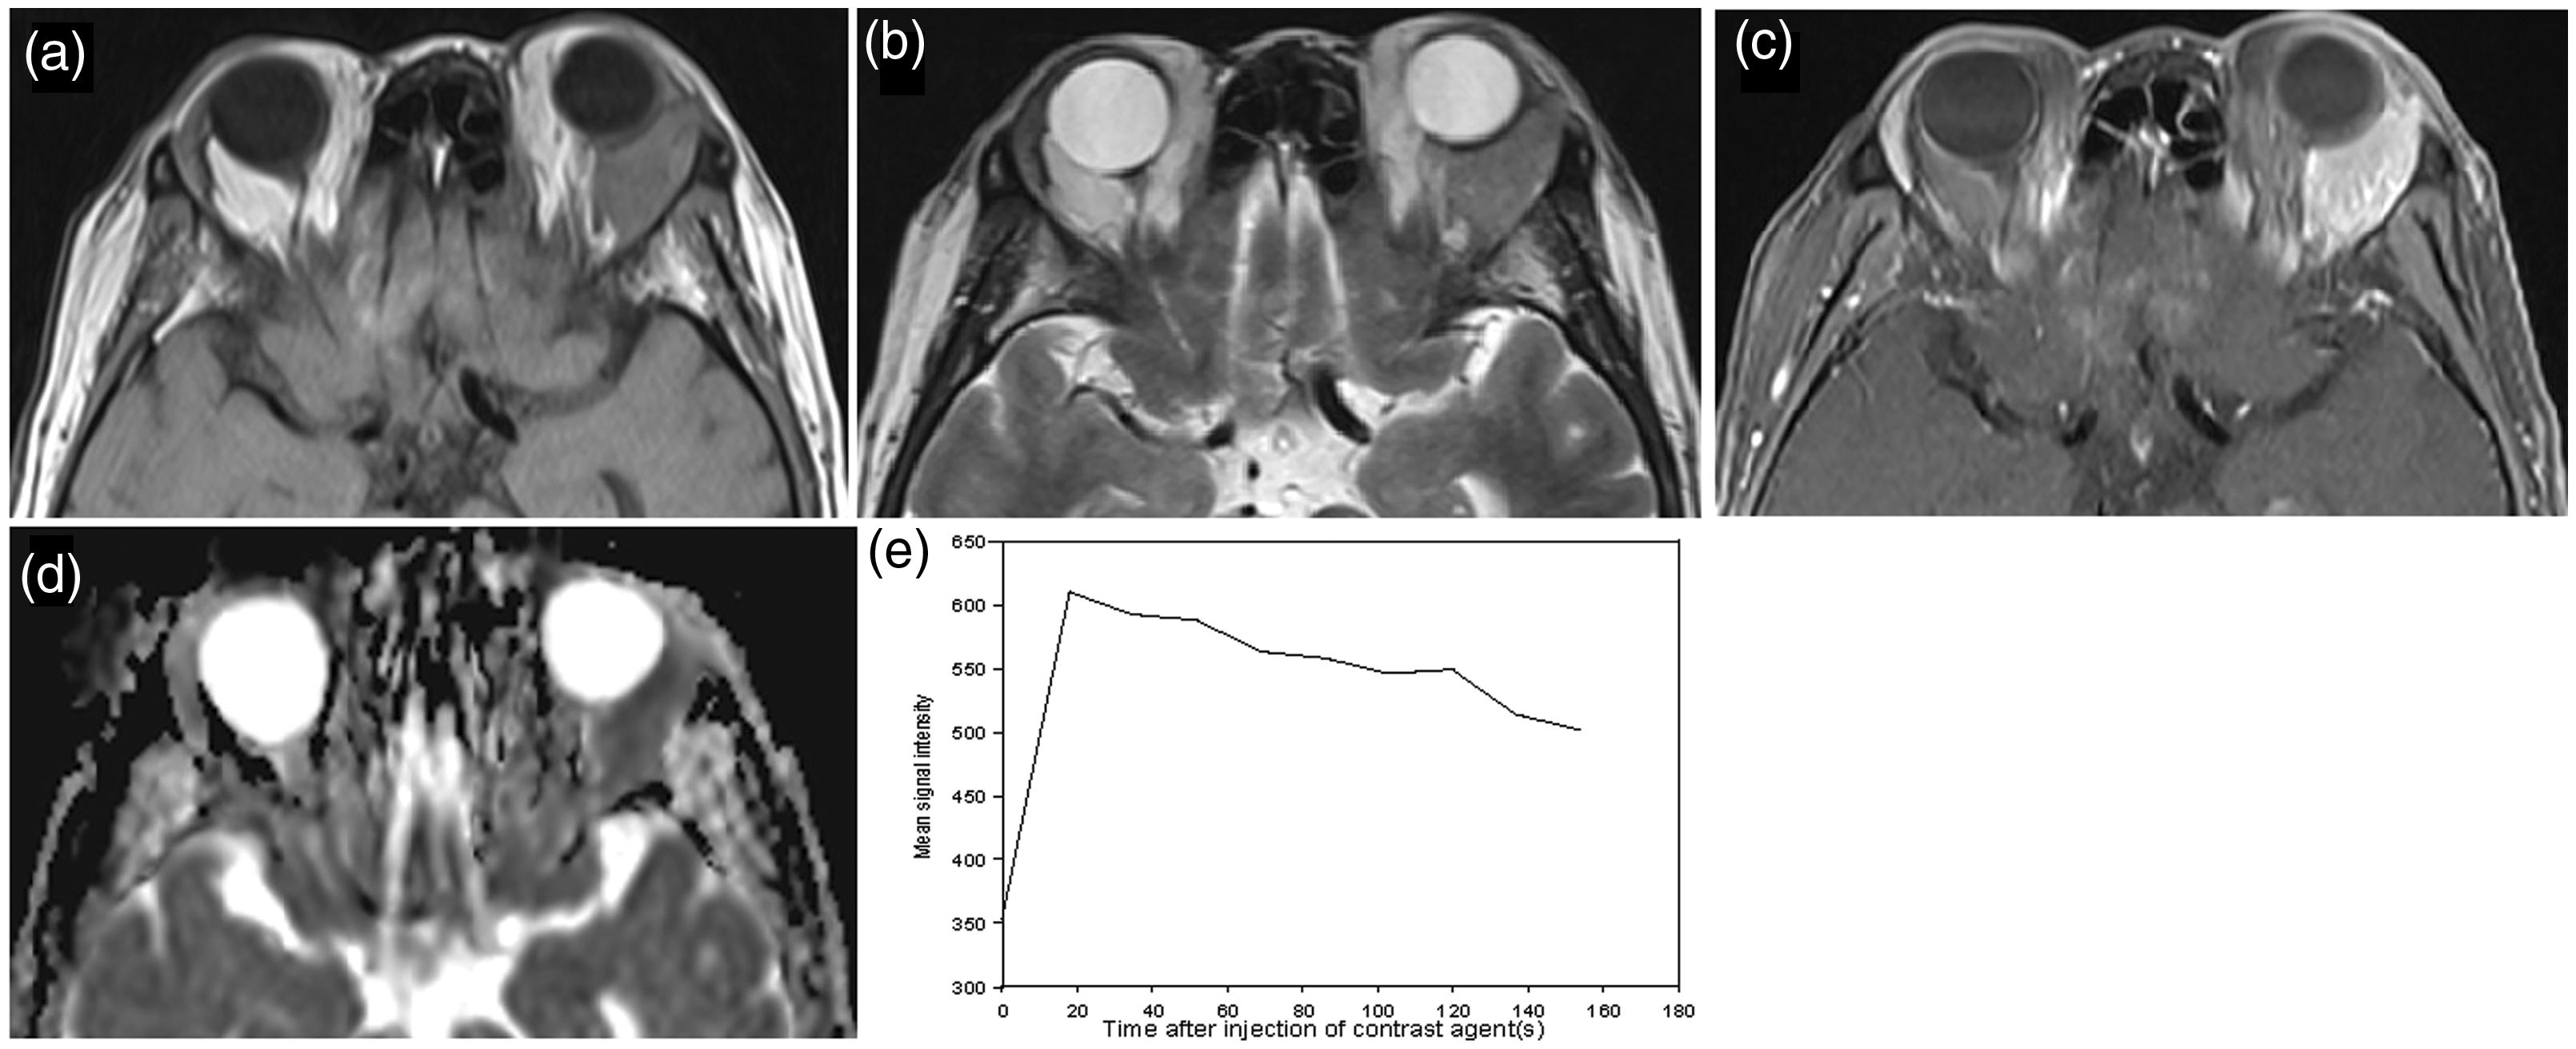
Reactive lymphoid hyperplasia in the left lacrimal gland of a 69-year-old woman. (a–c) The mass is isointense on T1- and T2-weighted images, with moderate enhancement. (d) The mean ADC value is 0.526 × 10⁻³ mm2/s. (e) TIC shows a type B pattern. ADC, apparent diffusion coefficient; MRI, magnetic resonance imaging; TIC, time-intensity curve.

Myoepithelial carcinoma in the left lacrimal gland of a 64-year-old man. (a, b) The neoplasm is isointense on T1- and T2-weighted images. (c) Moderate enhancement with tiny cysts. (d) The mean ADC value is 1.199 × 10⁻³ mm2/s. (e) TIC shows a type C pattern. ADC, apparent diffusion coefficient; MRI, magnetic resonance imaging; TIC, time-intensity curve.
Features of DWI in lacrimal gland masses
ADC values also appeared to be dependent upon the type of lacrimal tumors (Fig. 5). The mean ADC of epithelial tumors (1.156 × 10⁻³ mm2/s) was significantly higher than that of non-epithelial tumors (0.555 × 10⁻³ mm2/s; P = 0.005) (Fig. 5a). By ROC analysis, the area under curve (AUC) was 0.987 (95% CI = 0.966–1.000) (Fig. 5b), and the cutoff value of ADC value for differentiating these two types of tumor was 0.673 × 10⁻³ mm2/s, with a sensitivity of 98% and a specificity of 93%. Thus, ADC value could be used in differentiating tumors with type C patterns. PA had significantly higher ADC than other lacrimal gland tumors (P < 0.001), while lymphomas had significantly lower ADC values than other tumors (P < 0.001). For epithelial tumors, the mean ADC values were significantly different between PAs and carcinomas (1.276 × 10⁻³ mm2/s vs. 0.965 × 10⁻³ mm2/s; P < 0.001) (Fig. 5c). Based on the ROC curve analysis, the cutoff value of ADC for discriminating between PAs and carcinomas was 1.028 × 10⁻³ mm2/s, yielding the AUC of 0.903 (95% CI = 0.815–0.991) (Fig. 5d), with an optimal sensitivity (97%) and specificity (68%). Likewise, the mean ADC value of BIIs was higher than that of lymphomas (0.617 × 10⁻³ mm2/s vs. 0.500 × 10⁻³ mm2/s; P = 0.021) (Fig. 5e). The ROC analysis showed that the cutoff ADC value for these non-epithelial tumors was 0.524 × 10⁻³ mm2/s, yielding an AUC of 0.857 (95% CI = 0.655–1.000) (Fig. 5f), with a sensitivity of 100% and a specificity of 75%.

(a, c, e) Comparative ADC values of epithelial and non-epithelial tumors, PAs, and carcinomas, and BIIs and lymphomas. (b, d, f) ROC curve of ADC discrimination of epithelial and non-epithelial tumors, PAs and carcinomas; BIIs and lymphoma. ADC, apparent diffusion coefficient; AUC, area under the curve; BII, benign inflammatory infiltrates; CI, confidence interval; MRI, magnetic resonance imaging; PA, pleomorphic adenoma; ROC, receiver operating characteristic; SE, standard error; TIC, time-intensity curve.
Diagnostic value of the combination of DCE and DWI analyzed by CART decision-tree model
The CART algorithm is one of the most popular methods used for building a decision tree. In the present study, information gain was used for feature selection and 10-fold cross validation was used to select the optimal model. According to the error figure of cross-validation (Fig. 6a), it can be seen that when CP = 0.03, the error is the minimum. Based on this parameter, the model is rebuilt (Fig. 6b).
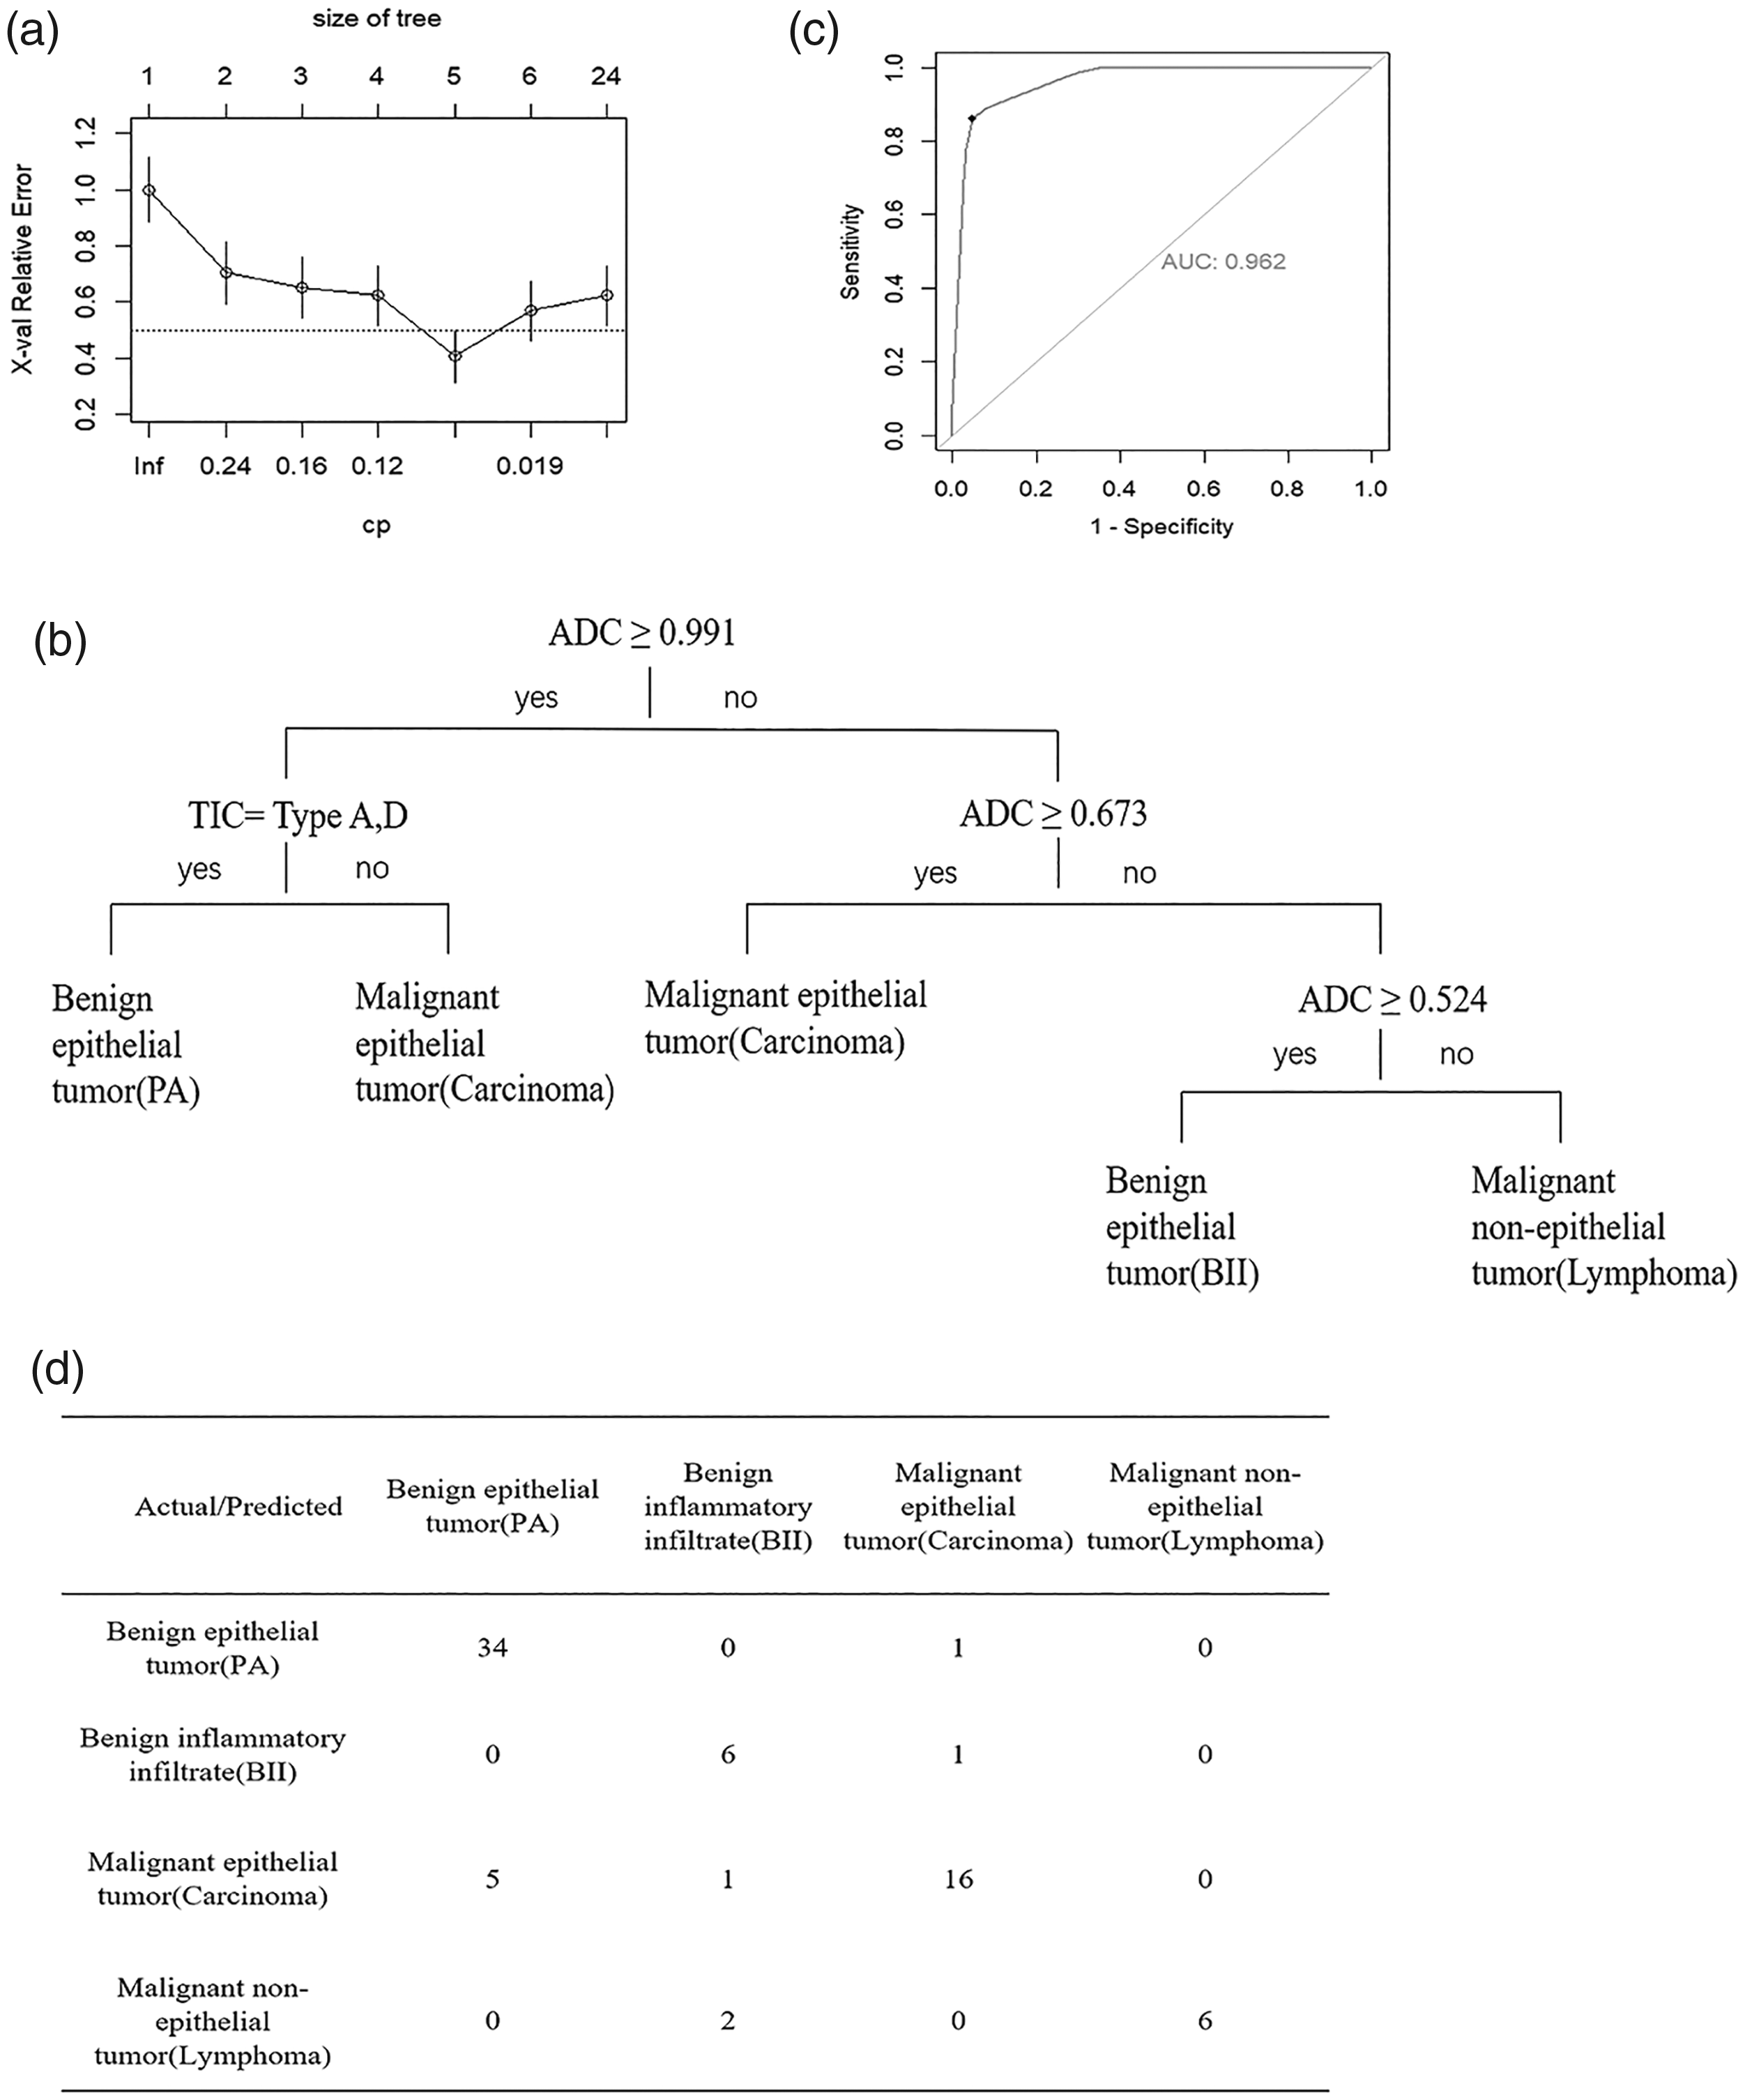
Results of the CART analysis. (a) The results of cross-validation. (b) The CART model using ADC and TIC for diagnosing lacrimal gland tumors. (c) The diagnostic performance of the CART model calculated by micro-averaging ROC curve: the AUC of the model was 0.962. (d) Accuracy of prediction for decision tree evaluated by confusion matrix. ADC, apparent diffusion coefficient; AUC, area under the curve; CART, classification and regression tree; ROC, receiver operating characteristic; TIC, time-intensity curve.
As shown in Fig. 6b, tumors with ADC ≥ 0.991 × 10⁻³ mm2/s and type A or D TIC pattern were diagnosed as benign epithelial tumor (PAs); tumors with ADC ≥ 0.991 × 10⁻³ mm2/s but type B or C TIC pattern were diagnosed as carcinomas. When the tumors’ ADC values were < 0.991 × 10⁻³ mm2/s, the decision trees continued next step; those with ADC ≥ 0.673 × 10⁻³ mm2/s were carcinomas, while those with ADC < 0.673 × 10⁻³ mm2/s could be separated into BIIs (those with ADC ≥ 0.524 × 10⁻³ mm2/s) and lymphomas (those with ADC < 0.524 × 10⁻³ mm2/s).
The micro-averaging ROC curve was used to calculate the preoperative diagnostic performance of the decision-tree model. The AUC and 95% CI of the model were 0.962 and 0.9473–0.9765, respectively, indicating that the model had excellent preoperative diagnostic performance (Fig. 6c). Then, this decision-tree model was adopted to predict the classification of 72 patients (Fig. 6d): the first class predicted 34 patients correctly; the second class predicted six patients correctly; the third class predicted 16 patients correctly; and the fourth class predicted six patients correctly. The total accurate number was 62 patients; prediction accuracy was 62/72 = 86.1%, showing that the CART decision-tree model built with ADC value and TIC pattern has good prediction accuracy.
Discussion
Although conventional MRI has value for preoperative diagnosis (22), difficulties still exist in many cases, especially those with atypical clinical presentations. It has been reported that ill-defined tumor margins and low SI on T2-weighted MRI of parotid gland tumors are indicators of malignancy (23,24). However, Ben-Simon et al. (25) suggested none of the conventional MRI parameters yield consistent diagnostic accuracy.
Recently, DCE have been applied in the differentiation of benign and malignant tumors in several anatomical regions with temporal differences of SI in DCE reflecting tumor vascularity. In this study, PAs mostly showed type A TIC patterns, whereas most malignant tumors including carcinomas and lymphomas showed type C patterns. However, such differentiation between benign and malignant is not sufficient for preoperative clinical planning. To address this deficit, we attempted to differentiate lacrimal gland tumors by multi-model MRI analyses. In our study, to some extent, the TIC patterns alone can be useful in this differentiation; all tumors with type A patterns are epithelial, while all tumors with type B patterns are non-epithelial. But type C patterns comprise both epithelial and non-epithelial tumors. As DWI quantifies microscopic water movement in tissue, the ADC values of malignant orbital neoplasms have been shown to be lower than that of benign tumors (11,26). Because DWI is able to differentiate PAs from carcinomas of the lacrimal gland (16), we hypothesized that DWI could be useful in identifying TIC patterns that correlate with the histopathologic diagnosis. In a study on parotid tumors by Yabuuchi et al. (17), the addition of DWI to DCE findings improved the diagnostic accuracy from 82% to 94%.
PAs contain abundant myxoid components, which may be responsible for the long Tpeak in type A patterns, as the contrast agent is likely to leak only slowly from vessels and accumulate at a slow rate in the extracellular matrix. The four ACC also exhibited type A patterns, which may be explained the fact that myxoid matrix can also be found in ACC (27). The ADC values of carcinomas were significantly lower than those of PAs because PAs have relatively higher percentages of myxoid matrix and are less cellular than carcinomas, with the myxoid areas contributing to high ADC values, and cellular areas yielding low ADC values (10). Thus, taking ADC into account permits type A pattern epithelial tumors to be separated into PAs and carcinomas. The diagnostic significance of the type D TIC pattern needs to be investigated further in a larger sample, as only two tumors exhibited this pattern in our study.
The short Tpeak in type B and type C TIC patterns correlates with tumor vascularity, high vascular permeability (28), and less myxoid or fibrous stroma (29). The high WR in tumors with type B TIC patterns, which contain BII and lymphoma, is attributed to hypercellularity and less intercellular stroma, which accelerates the reuptake of the contrast agent by capillaries. Carcinomas and lymphomas were mainly type C TIC pattern tumors correlating with their histopathologic features, which presenting as tumor nests surrounded by fibrous connective tissue stroma. To further assist in differentiating tumors exhibiting type B or C patterns, we added ADC values. The carcinomas showed higher ADC than non-epithelial tumors, even BIIs, presumably due to the hypercellularity of the non-epithelial tumors. Lymphomas had relatively lower ADC than BIIs, probably due to their greater cellularity.
CART is a non-parametric modelling method, which means that it can handle small samples better than parametric modelling methods such as logistic regression. In this report, the CART decision tree proved those with ADC ≥ 0.991 × 10⁻³ mm2/s and type A or D TIC pattern to be PAs, which should be resected with minimal damage to adjacent tissue; those with ADC ≥ 0.991 × 10⁻³ mm2/s but type B or C TIC pattern to be carcinomas which should be resected with definitely uninvolved margin; those with ADC ≥ 0.524 × 10⁻³ mm2/s but < 0.673 × 10⁻³ mm2/s to be BIIs which could be treated successfully with systemic corticosteroids; while those with ADC < 0.524 × 10⁻³ mm2/s were lymphomas requiring biopsy for diagnosis of tumor type that was followed by staging and treatment. Using this model, the lacrimal gland tumors can be effectively diagnosed into four groups, which should be diagnosed and treated differently.
The present study has some limitations. Functional MRI, including DCE and DWI, are difficult to standardize from one institution to another. Therefore, results from one facility may not translate directly to others with different scanners, software, and methods. Moreover, due to the limitations of objective conditions, it was difficult to perform co-registration. However, cutoff values are still comparable between disease groups in a single study cohort. As our study was retrospective, there is a chance of selection bias, which we mitigated by examining consecutive patients. In addition, our stepwise predictive model was derived retrospectively from the data in the research cohort. Therefore, it may have a propensity to overestimate predictive values. Considering these limitations, additional studies on larger groups of patients and including more disease entities are necessary to confirm and extend our observations.
In conclusion, using a stepwise diagnostic approach combining DCE and DWI, lacrimal gland tumors can be differentiated into four disease groups which can be of help to ophthalmologists in the diagnosis and treatment of these tumors.
Footnotes
Acknowledgments
We thank Victor M Elner, Department of Ophthalmology and Visual Sciences and Department of Pathology, University of Michigan, and Joanne Momcilovich for providing language help.
Declaration of conflicting interests
The author(s) declared no potential conflicts of interest with respect to the research, authorship, and/or publication of this article.
Funding
The author(s) received the following financial support for the research, authorship, and/or publication of this article: This work was supported by the National Natural Science Foundation of China (grant no. 81970835). The funding organization had no role in the design or conduct of this research.