
Abstract
Background
Kidney transplantation is one of the most effective ways to treat end-stage kidney disease. However, 5000 renal transplant recipients start or restart dialysis because of chronic allograft nephropathy (CAN) every year in the United States. Detecting changes in the stiffness of transplanted kidneys can help diagnose transplanted kidney disease.
Purpose
To explore changes in the stiffness of transplanted kidneys after renal transplantation using shear wave elastography (SWE).
Material and Methods
This study conducted consecutive follow-up observations on 10 patients after kidney transplantation. SWE examination was performed in the first week, second week, first month, second month, third month, fourth month, fifth month, and sixth month after surgery. This study also analyzed the graft stiffness of 86 patients with stable renal function recovery one month after surgery.
Results
The results show that there is a change in the stiffness of the transplanted kidney over time after renal transplantation. It decreases rapidly within one month after renal transplantation and tends to be stable after one month. The mean renal cortical and pyramidal stiffness of patients with stable renal function were 28.48 ± 4.27 kPa and 21.97 ± 3.90 kPa, respectively.
Conclusion
Consecutive stiffness measurement of transplanted kidneys is an effective method for monitoring the function of transplanted kidneys. According to the change in transplanted kidney stiffness, we can designate a more scientific review plan to determine the functional status of the transplanted kidney.
Introduction
The incidence and prevalence of chronic kidney disease (CKD), particularly diabetes and hypertension-related nephropathies, in high-income countries are increasing (1). Kidney transplantation is one of the most effective treatments for end-stage kidney failure. It has greatly improved patient quality of life. However, 5000 renal transplant recipients start or restart dialysis because of chronic allograft nephropathy (CAN) every year in the United States (2). Chronic allograft nephropathy is the most common cause of kidney allograft failure (3). In recent years, elasticity has been used in various tissues to measure tissue stiffness. Previous research has shown that stiffness is significantly correlated with the grade of kidney fibrosis (4,5). In a previous study, the shear wave speed was significantly higher in the acute rejection (AR) group than in the non-AR group (6). Therefore, detecting changes in the stiffness of transplanted kidneys can help diagnose transplanted kidney disease. Unfortunately, we have not found any studies on the follow-up of stiffness changes after kidney transplantation. Therefore, we will explore the pattern of stiffness changes over time after renal transplantation using shear wave elastography (SWE).
Material and Methods
Informed consent was obtained from all patients, and approval was secured from our local ethics committee (approval number: 2020-ks-02).
In the present study, a total of 132 patients who came to our hospital for routine examination after kidney transplantation from November 2017 to January 2019 were collected, and the traditional ultrasound and SWE examinations were performed on each patient. In the first part of the small sample repeated measurement study of 10 patients, we found that the stiffness of the transplanted kidney basically reached a stable value one month after kidney transplantation. The second part of the study mainly observed the stiffness of transplanted kidneys in 86 patients with stable renal function one month after kidney transplantation. Thirty-six patients were excluded due to unstable renal function and being within one month of the kidney transplantation at the time of examination. The flowchart of the patient selection in these two studies is shown in Fig. 1.
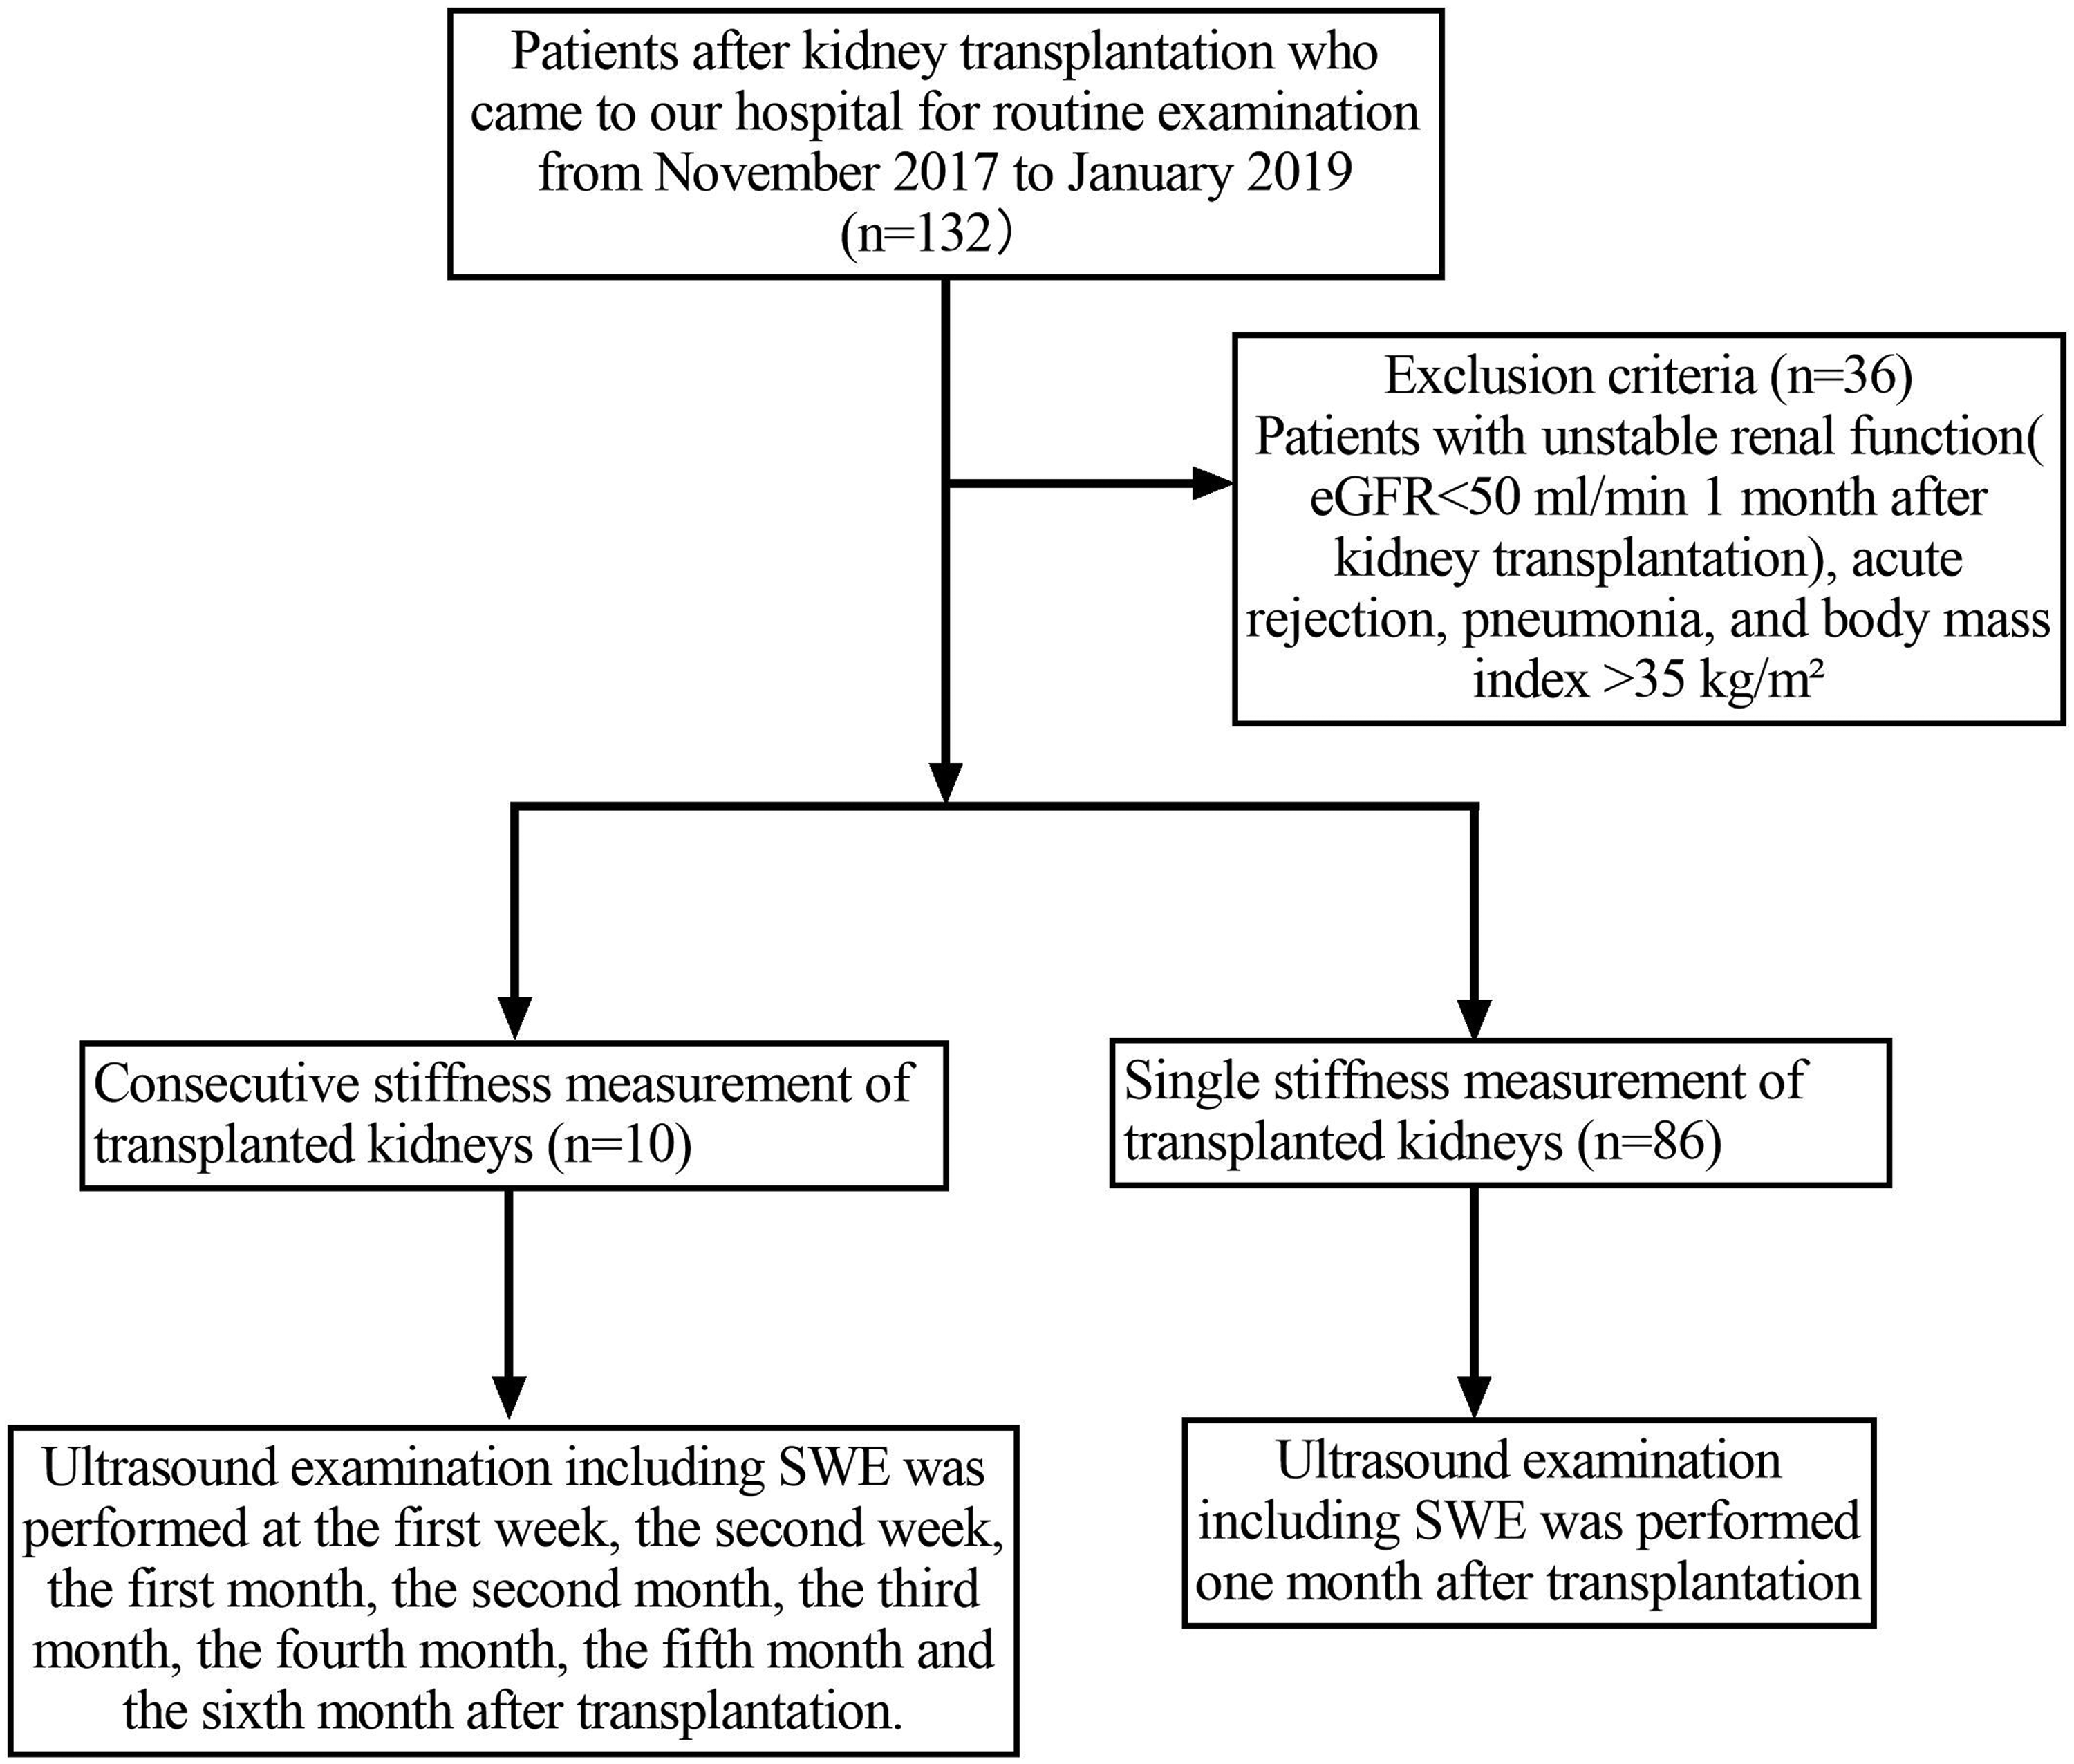
The flowchart of the patient selection in these two studies.
Repeated measurement of kidney graft stiffness
Ten patients who had undergone renal transplantation were recruited for this study. The participants were patients whose blood creatinine decreased smoothly after renal transplantation and whose estimated glomerular filtration rate (eGFR) was > 50 mL/min when creatinine levels were stable (7). The exclusion criteria were acute rejection, pneumonia, and body mass index (BMI) > 35 kg/m2. Ultrasound examination including SWE was performed on these 10 patients in the first week, second week, first month, second month, third month, fourth month, fifth month, and sixth month after surgery.
Single measurement of kidney graft stiffness
Eighty-six patients who had undergone renal transplantation more than one month prior were recruited for the present study. The participants were patients whose blood creatinine reduced smoothly after renal transplantation and whose eGFR was > 50 mL/min after one month. The exclusion criteria were acute rejection, pneumonia, and BMI > 35 kg/m2. For these 86 patients, ultrasound examination including SWE was performed one month postoperatively.
US and SWE technique
All ultrasound examinations, including SWE, were performed with an Aixplorer ultrasound scanner (Supersonic Imaging, Aix-en-Provence, France) using a Convex array probe (SC6-1, Supersonic Imaging). The machine was equipped with the SWE function. Patients were placed in a supine position, with their graft area fully exposed. First, two-dimensional ultrasound was used to observe the size, morphology, and renal parenchymal echo of the transplanted kidney and to determine whether there was renal effusion or weak renal effusion. Second, color Doppler was used to assess renal blood flow and measure the systolic peak velocity, pulse index, and resistance index of the renal arteries. Finally, the machine was set to SWE mode. The elasticity range was set at 180 kPa. The region of interest (ROI) was set to include the entire superficial renal cortex of the transplant kidney (8). Five SWE measurements in the kidney cortex were made in the middle third of the transplanted kidney (6), and the Emean, Emin, Emax, and Esd were provided for each measurement. The average value of the five measurements was calculated, which represented the stiffness of the transplant renal cortex. During SWE quantification, the probe was adjusted to achieve sufficient pressure-free contact with the patient’s body.
Statistical analysis
We performed all statistical analyses using SPSS version 16.0 (IBM, Armonk, NY, USA). Metrological data with a normal distribution were expressed as the mean ± standard deviation (SD). Student’s t test was used for comparisons of normally distributed data between two independent groups. Paired t test was used to compare the blood creatinine of patients before kidney transplantation and at the time of examination. Spearman’s correlation analysis was used for continuous variables. Repeated-measures analysis of variance was used to compare the change in SWE measurements at different points in time. A P value < 0.05 was considered statistically significant.
Results
Consecutive measurement of transplanted kidneys
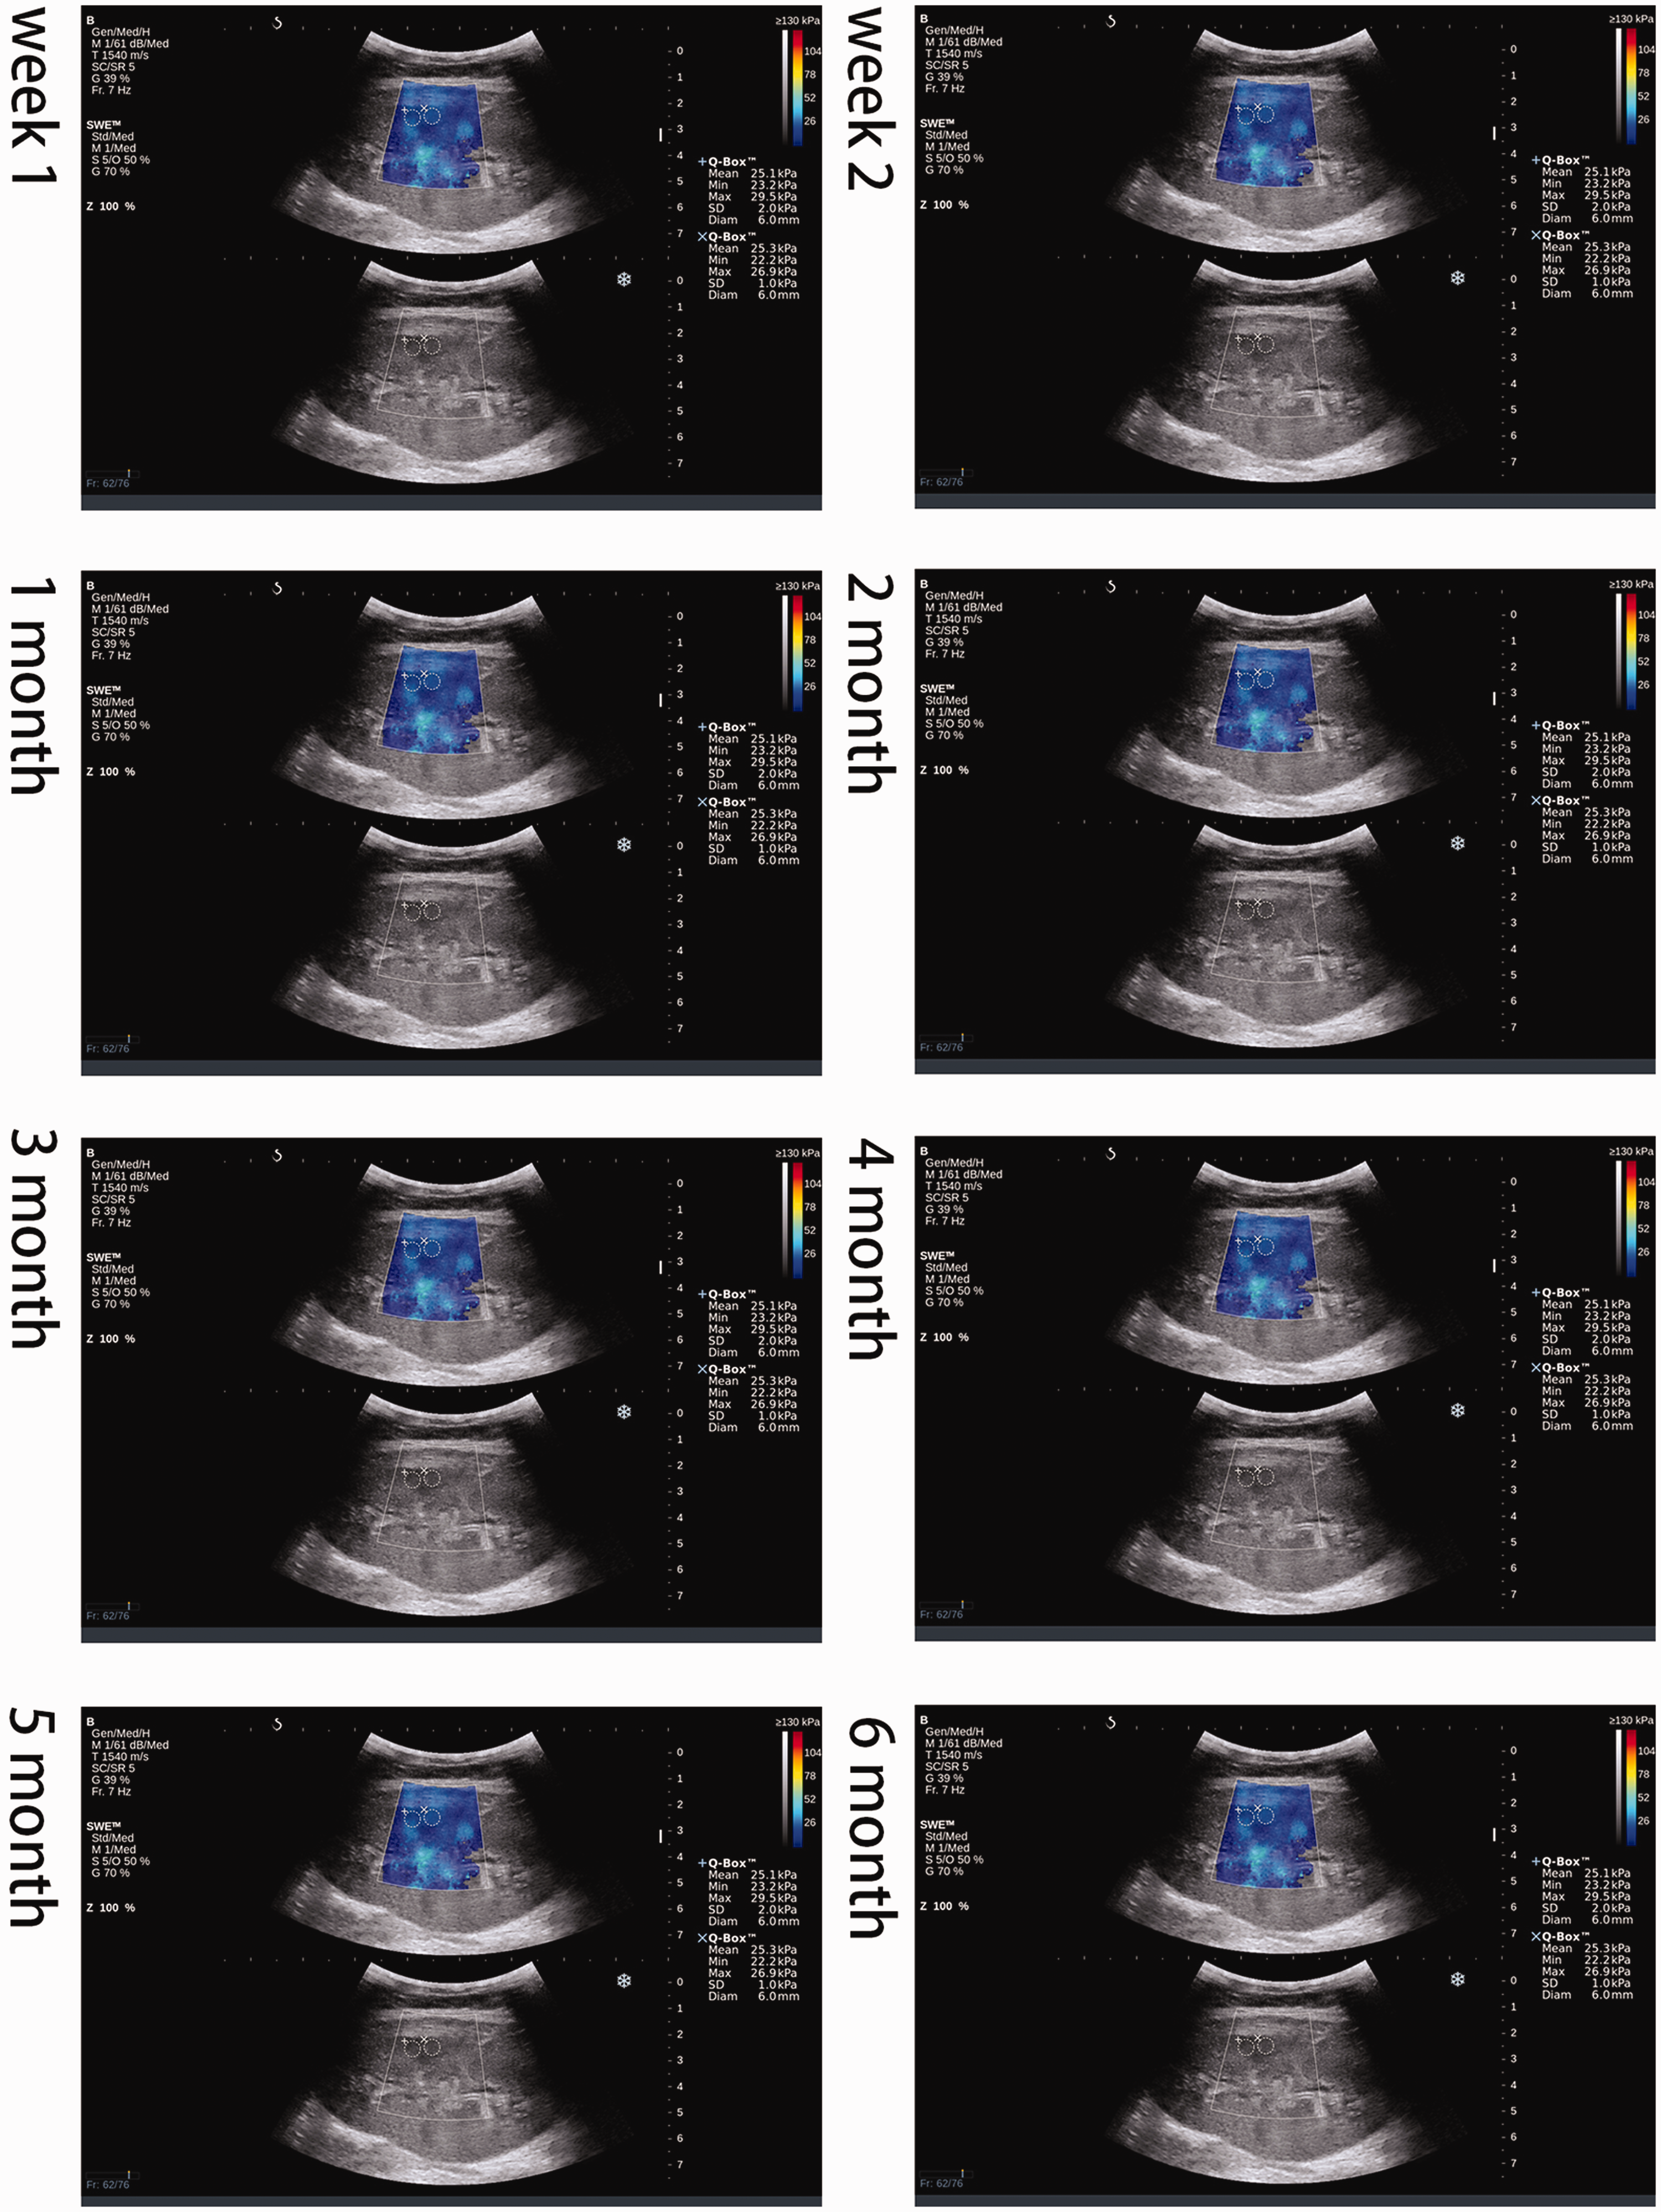
We performed consecutive observations on 10 renal transplant patients with normal renal function recovery after surgery (Fig. 2). The results showed that the Emean of the renal cortex in the first week after surgery was high at 41.57 ± 2.30 kPa. The stiffness of the transplanted kidneys decreased rapidly within one month after surgery. A relatively stable level was reached at one month after surgery, with a value of 32.69 ± 2.30 kPa. There was a slight fluctuation in the Emean of the transplanted renal cortex within three months after surgery. Three months after the operation, the Emean value of the transplanted renal cortex began to stabilize at 30.41 ± 3.00 kPa. Repeated-measures analysis of variance showed that the Emean of the renal cortex gradually decreased from the first week to the sixth month after surgery, and the difference was statistically significant (P < 0.05). The changes in Emean in the transplanted renal cortex are shown in Fig. 3.
From the first week to the sixth month after renal transplantation, the stiffness of the transplanted kidney in patients with stable renal function was 41.57 ± 2.30 kPa, 38.03 ± 1.90 kPa, 32.67 ± 2.30 kPa, 33.00 ± 3.50 kPa, 30.41 ± 3.00 kPa, 30.62 ± 2.50 kPa, 29.21 ± 2.20 kPa, and 29.11 ± 2.20 kPa, respectively.
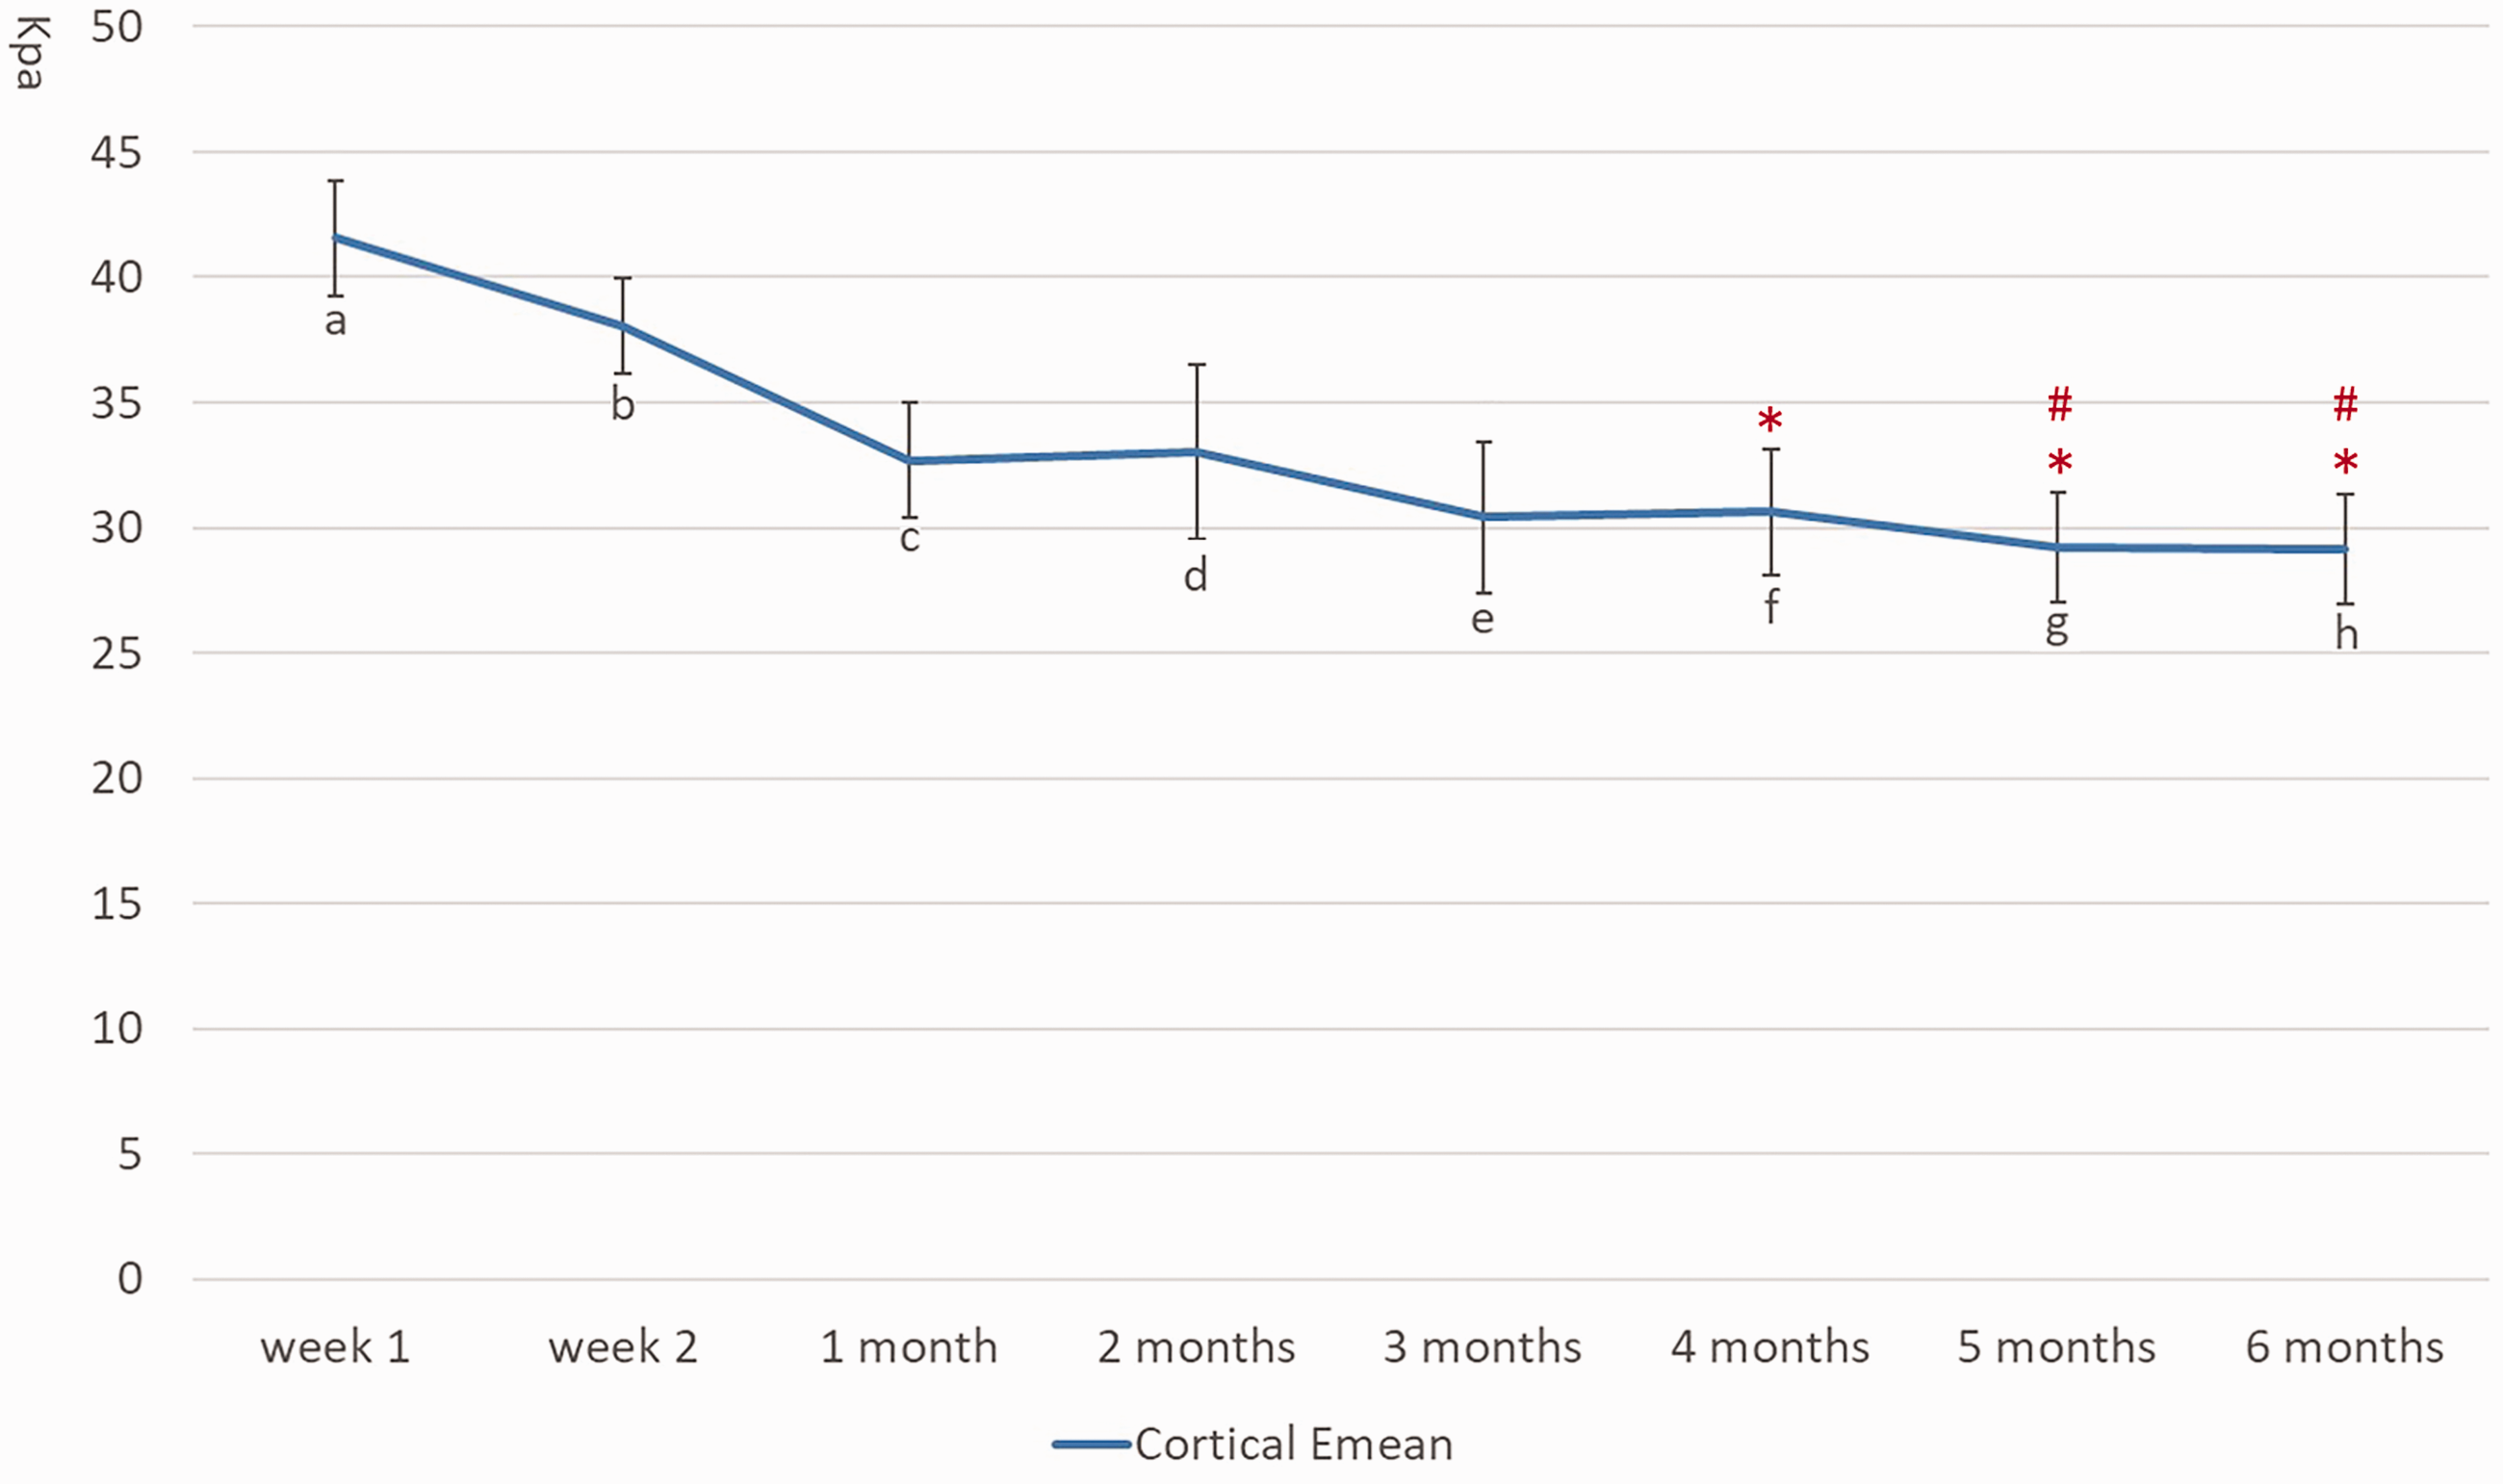
Cortical Emean curves in patients with stable renal function after renal transplantation. *The difference between points f, g, h and point a is statistically significant. #The difference between points g, h and point b is statistically significant.
The changes in blood creatinine of these 10 patients are shown in Fig. 4. From the figure, we can see that the blood creatinine decreased steadily after kidney transplantation, and the blood creatinine tended to be stable at almost one week after kidney transplantation. Due to the differences in patients’ basic blood creatinine levels, there are also certain differences in the blood creatinine levels when they reach a stable level. This is the reason why we chose to perform repeated SWE measurements on the transplanted kidney from the first week after kidney transplantation.
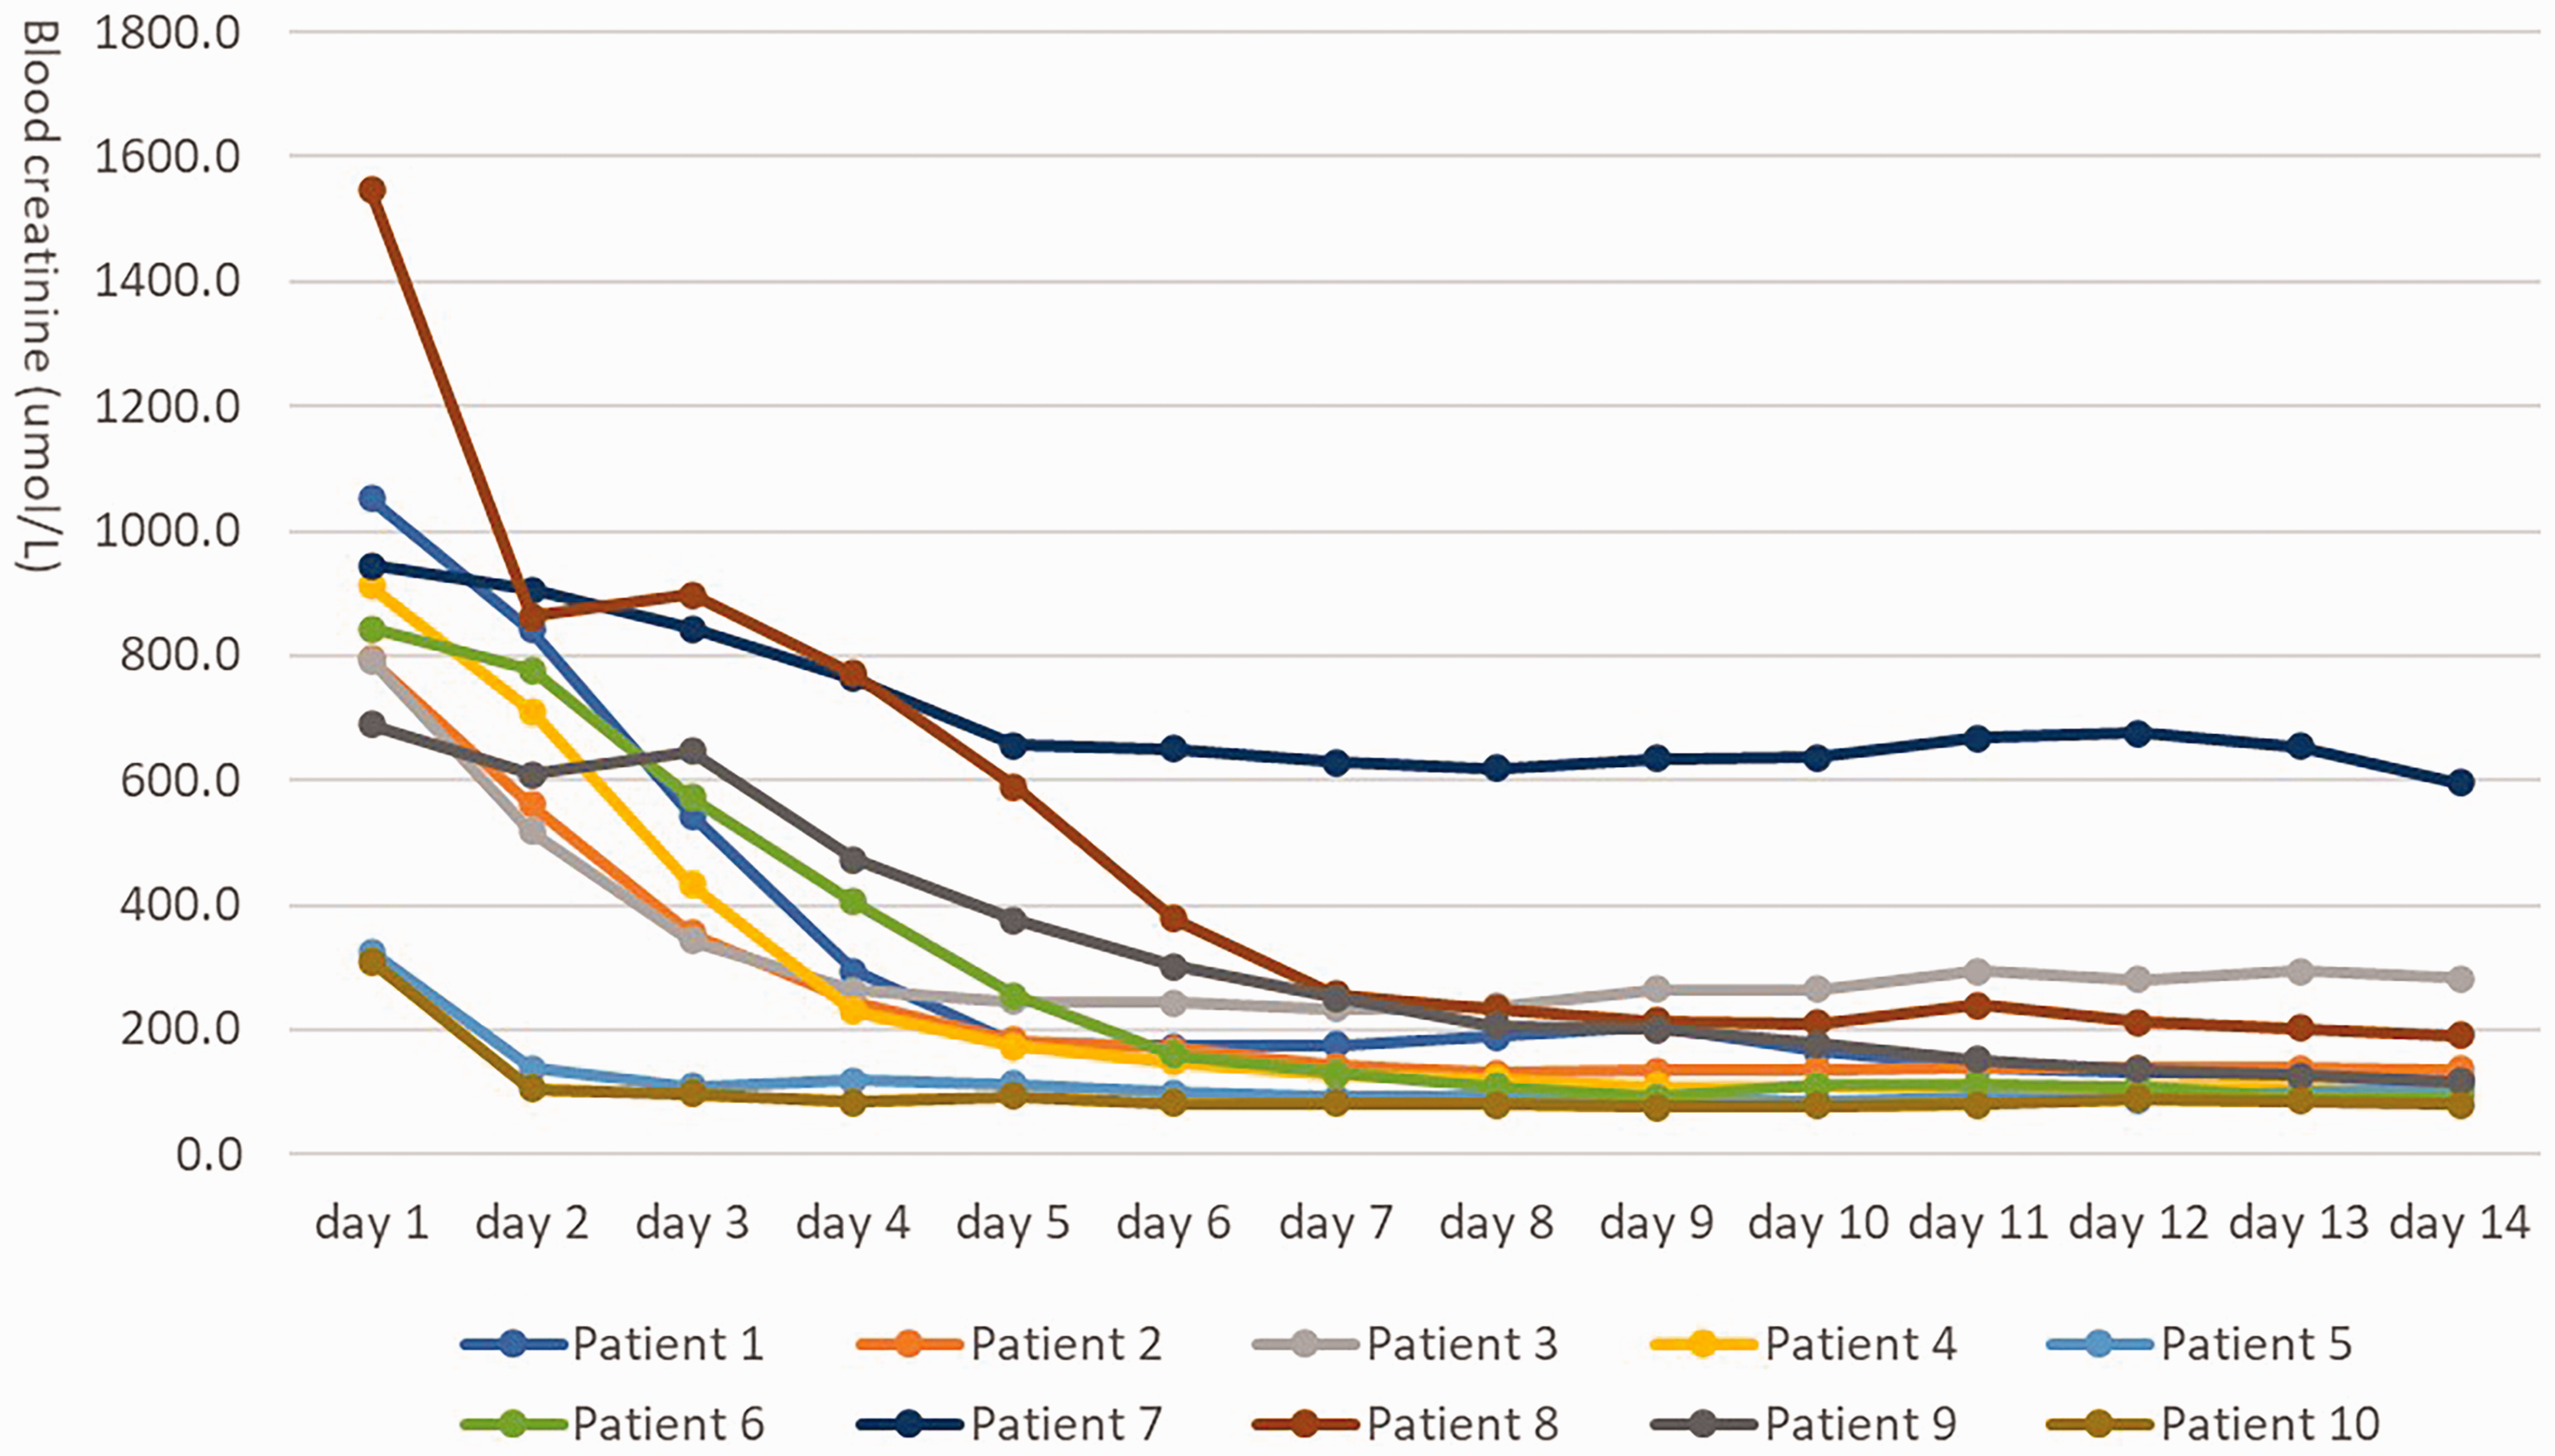
Changes of blood creatinine in patients with stable renal function recovery.
Single measurement of transplanted kidneys
In the present study, there were 49 male patients and 37 female patients. The median time after transplantation of the subset of 86 patients was 17.0 months (range = 1–158 months). There was no significant difference in the quantitative parameters of transplanted kidney stiffness between different sexes (P > 0.05). The quantitative analysis of SWE is shown in Table 1.
Quantitative analysis of SWE in male and female patients (units are kPa).

In the present study, we divided the participants into four groups according to age. We compared the stiffness of transplanted kidneys in patients of different ages, and the results showed that the difference in transplanted kidney stiffness between the groups was not statistically significant (P > 0.05). The SWE measurements of each group are shown in Table 2.
Quantitative analysis of SWE in different age groups, Unit: KPa

In addition, we analyzed the correlation between transplanted kidney stiffness and eGFR, and the results showed that the SWE values of the transplanted renal cortex and medulla were not significantly correlated with eGFR (P > 0.05). We also compared the blood creatinine of the 86 patients before kidney transplantation and at the time of examination, and the results showed that the patients’ blood creatinine was significantly lower than that before kidney transplantation (P < 0.05), which indicated that the patients’ renal function recovered well.
Discussion
Renal failure is the end-stage manifestation of various kidney diseases. The main treatments for renal failure include peritoneal dialysis, hemodialysis, and kidney transplantation. At present, kidney transplantation is performed widely and greatly improves the quality of life of patients with renal failure. However, the long-term survival rate of transplanted kidneys still needs to be improved. Acute rejection, renal interstitial fibrosis, tubular atrophy, and chronic graft failure are the main reasons for impaired renal function. An effective method of monitoring the state of the transplanted kidney is needed so that we can identify abnormal kidneys. Early treatment can prevent the transplanted kidney from progressing to an irreversible stage. Studies on the elasticity of transplanted kidneys indicate that the stiffness of transplanted kidneys can reflect their status. We observed a change in the stiffness of the transplanted kidney after surgery. However, there is a lack of research on the pattern of changes in the stiffness of transplanted kidneys. In this study, patients with renal transplantation were followed up consecutively to explore the changes in the stiffness of transplanted kidneys after renal transplantation.
Ultrasound elastography is mainly divided into strain imaging and shear wave imaging. Strain imaging includes strain elastography (SE) and acoustic radiation force impulse (ARFI) strain imaging. Shear wave imaging is divided into point shear wave elastography (pSWE), 2D SWE, and transient elastography (TE). Among them, SE relies on the operator to manually press the probe on the tissue to obtain a qualitative hardness assessment of the tissue, and it has limitation in evaluating deeper tissue. TE is mainly used to assess the stiffness of liver fibrosis. pSWE does not show an image of stiffness. SWE is a quantitative measurement with real-time visualization of a color box, and it is less affected by the operator (9,10).
In the present study, 10 patients with stable renal function recovery after surgery were followed up. Routine ultrasound and SWE were performed in the first week, second week, first month, second month, third month, fourth month, fifth month, and sixth month after surgery. This study showed that there was a change in the stiffness of the transplanted kidney cortex. The Emean of the transplanted kidney cortex was highest in the first week, and it decreased rapidly within the first month. After the first month, the Emean of the transplanted renal cortex tended to be stable, but there was still some fluctuation within the third month. It reached a stable value in the third month after the operation. The cause of this change may be that during kidney transplant surgery, the delicate supply and demand balance of oxygen is disrupted by hypoxia. When the kidney is transplanted into the human body to restore blood flow, the cytokines released by the inflammatory cells in the kidney during ischemia-reperfusion injury activate the coagulation pathway, causing capillary occlusion and microcirculatory dysfunction. This reaction leads to an increase in intrarenal pressure, which leads to a higher Emean in the renal cortex. As the transplanted kidney function recovered, the cortical Emean also gradually decreased to a stable value (11,12). More research is needed on the mechanism of postoperative renal stiffness changes.
The pattern of change in the stiffness of the transplanted kidney after surgery suggests that physicians should evaluate the stiffness of the transplanted kidney in stages. Within one month of surgery, the stiffness of the transplanted kidney is still in a downward trend. We should make a plan to repeatedly observe the stiffness of the transplanted kidney and observe its downward trend. At one month after surgery, the stiffness of the transplanted kidney tends to be stable. If the stiffness of the transplanted kidney suddenly changes, it may indicate the possibility of disease in the transplanted kidney. At this time, the clinician should observe the transplanted kidney in more detail.
Ultrasound elastography is an emerging technology that has matured in recent years and can be used to assess tissue stiffness. He et al. (13) used ARFI to compare 52 patients with stable renal function and 50 patients with renal dysfunction, and the results showed that the average shear wave velocity of transplanted kidney was significantly higher in the dysfunction group than in the stable group. Stock et al. (14) used ARFI to compare the average shear wave velocity between the acute renal allograft rejection group and other types of pathological groups. The results showed that the mean shear wave velocity of the pathologically confirmed acute rejection group was > 15% higher than that of other pathological types (calmodulin inhibitor toxicity, acute tubular necrosis). Previous studies have shown that ultrasound elastography can be applied to assess the stability or abnormality of transplanted kidneys. In the literature, we found that a reference value for SWE measurement of transplanted kidneys in patients with stable renal function is still lacking. Therefore, patients with stable renal function were selected to analyze the SWE measurements. Since our previous study showed that the stiffness of the transplant kidney tended to be stable after one month of surgery, patients within one month of surgery were excluded.
Our results showed that the SWE measurements of the transplanted renal cortex were higher than those of the medullary cortex in patients with stable renal function, which may be related to the anatomy of the kidney itself. The renal parenchyma is divided into the cortex and medulla. The cortex is rich in blood vessels and glomeruli. The glomerulus is a capillary composed of a capillary network. The ends are connected to the afferent arteries and the outlet arterioles; the medulla is composed of 8–18 kidney medullary rays, the main components of which are renal tubules and collecting ducts. The structure of the cortex is more complicated than that of the medulla. According to the formula of Young’s modulus E=3ρc2, the components of the transplanted kidney cortex and medulla are different, so their shear wave propagation speeds and stiffness values are different. In this study, the mean renal cortical and pyramidal stiffness measurements of patients with stable renal function were 28.48 ± 4.27 kPa and 21.97 ± 3.90 kPa, respectively, which provided a reference for the diagnosis of transplanted kidney disease in our daily work. When the renal cortex and medullary stiffness increase significantly, the possibility of pathological changes in the transplanted kidney should be considered.
Our results showed that for patients with stable renal function, the level of eGFR does not affect the elasticity of the transplanted kidney cortex and medullary. Grenier et al. (15) used SSI to compare the stiffness of the transplanted kidney parenchyma in 43 patients with abnormal renal function. The results showed that there was no significant relationship between the parenchymal stiffness of the transplanted kidney and eGFR. The study by He et al. (13) showed that there was a significant negative correlation between the SWE value of the transplanted kidney and the eGFR. The results of Nakao et al. (5) suggested that there was a negative correlation between the stiffness of the transplanted kidney and eGFR, and the average stiffness value was significantly lower in patients with eGFR > 50 mL/min. The study by Lukenda et al. (3) also found that transplanted kidney stiffness was significantly negatively correlated with the GFR. There was a significant difference in stiffness values between eGFR > 50 mL/min and eGFR < 50 mL/min (28.02 ± 2.70 kPa and 33.90 ± 5.50 kPa, respectively). To date, the relationship between the stiffness of the transplanted kidney parenchyma and eGFR remains controversial. A possible reason is that the elastography techniques used in the above studies are different, including SWE, TE, and ARRI, which may lead to different results. In addition, the participants observed in each study are different. This study included patients with stable renal function after renal transplantation, while other studies included patients with allograft dysfunction, acute rejection, and interstitial fibrosis. The difference in renal function between patients is also one of the possible reasons for inconsistent results.
The present study has some limitations. First, the sample size of the consecutive measurement group was small. Second, the stiffness of transplanted kidneys with other types of pathology, such as acute rejection and chronic renal allograft, was not measured consecutively.
In conclusion, SWE is an effective tool for assessing the stiffness of transplanted kidneys. The stiffness of the transplanted kidneys decreased rapidly within one month of surgery. After that, the stiffness of transplanted kidneys tends to be stable. These findings emphasize the importance of evaluating the stiffness of transplanted kidneys in stages. When the function of the transplanted kidney is abnormal, the stiffness of the transplanted kidney increases. Consecutive stiffness measurement is an effective method for monitoring the function of transplanted kidneys. With the further in-depth study and the increase in the sample size of the study, the number of abnormal patients will further increase. Perhaps SWE will provide an early prediction imaging index for diseases such as acute rejection. Of course, this requires a larger sample size and further research in a multicenter study.
Footnotes
Declaration of conflicting interests
The author(s) declared no potential conflicts of interest with respect to the research, authorship, and/or publication of this article.
Funding
The author(s) received no financial support for the research, authorship, and/or publication of this article.