
Abstract
Background
Patients with urolithiasis undergo radiation overexposure from computed tomography (CT) scans. Improvement of image reconstruction is necessary for radiation dose reduction.
Purpose
To evaluate a deep learning-based reconstruction algorithm for CT (DLIR) in the detection of urolithiasis at low-dose non-enhanced abdominopelvic CT.
Material and Methods
A total of 75 patients who underwent low-dose abdominopelvic CT for urolithiasis were retrospectively included. Each examination included three reconstructions: DLIR; filtered back projection (FBP); and hybrid iterative reconstruction (IR; ASiR-V 70%). Image quality was subjectively and objectively assessed using attenuation and noise measurements in order to calculate the signal-to-noise ratio (SNR), absolute contrast, and contrast-to-noise ratio (CNR). Attenuation of the largest stones were also compared. Detectability of urinary stones was assessed by two observers.
Results
Image noise was significantly reduced with DLIR: 7.2 versus 17 and 22 for ASiR-V 70% and FBP, respectively. Similarly, SNR and CNR were also higher compared to the standard reconstructions. When the structures had close attenuation values, contrast was lower with DLIR compared to ASiR-V. Attenuation of stones was also lowered in the DLIR series. Subjective image quality was significantly higher with DLIR. The detectability of all stones and stones >3 mm was excellent with DLIR for the two observers (intraclass correlation [ICC] = 0.93 vs. 0.96 and 0.95 vs. 0.99). For smaller stones (<3 mm), results were different (ICC = 0.77 vs. 0.86).
Conclusion
For low-dose abdominopelvic CT, DLIR reconstruction exhibited image quality superior to ASiR-V and FBP as well as an excellent detection of urinary stones.
Introduction
Urolithiasis is a common health problem, and its estimated lifetime risk is 5%–10% in Europe and the United States (1). An increase in incidence and prevalence of the disease has been reported. Computed tomography (CT) provides a rapid and accurate examination with high sensitivity and specificity (96% and 98%, respectively) for the detection of urinary stones (2). CT has emerged as the reference diagnostic modality in this indication (3) because of the low detection rate of other imaging modalities, including radiography and ultrasonography and its ability to detect other cause of abdominal pain and complications. However, due to repeated CT examinations during treatment and the relatively high recurrence rate of urolithiasis, the patient’s cumulative lifetime exposure to ionizing radiation may be high, especially in young patients (3–8). Many investigators have developed strategies for reducing radiation dose, using a low-dose approach that results in an estimated effective dose in the range of 0.9–3 mSv. Lowering the effective dose decreases the quality of the image due to the excessive image noise, potentially causing a decrease in diagnostic performance and confidence (9,10). The use of low-dose CT protocols in urolithiasis is well-established. Images are noisier but diagnostic confidence is maintained due to the inherent high contrast between urinary stones and the background soft tissues (11). Iterative reconstruction (IR) algorithms have been developed to decrease the image noise and allow-dose reduction while maintaining image quality (11–14). Several generations of IR algorithms have emerged including hybrid IR, statistical IR, and model-based IR (MBIR) algorithms. Many clinical studies have shown that these IR algorithms are effective in reducing the radiation dose (15,16) but the non-linear and non-stationary properties of IR algorithms make the spatial resolution dependent on contrast and radiation dose. In addition, the use of IR algorithms changes the amplitude of the noise and the texture of the image. It is often reported that the noise texture appears smooth or plastic looking. The image quality obtained with these algorithms can have an impact on the interpretation, which limits the use of the highest iterative levels and therefore the potential for dose reduction in clinical practice.
Nowadays, artificial intelligence is increasingly used and has demonstrated its potential in medical imaging. Among machine learning techniques, deep learning has recently shown great potential to reconstruct CT images while reducing noise without changing noise texture. Consequently, some CT manufacturers have developed a new generation of CT image reconstruction based on deep learning (17,18). The deep learning image reconstruction (DLIR) algorithm developed by GE Healthcare (TrueFidelity™, GE Healthcare Milwaukee, Wis) has been trained with high-quality filtered back projection (FBP) images at high level X-ray dose (19–21).
The aim of the present study was to evaluate the diagnostic performance of CT images reconstructed with DLIR and to compare the quantitative and qualitative image quality with images reconstructed with adaptive statistical iterative reconstruction (ASIR-V) and FBP on non-enhanced abdominopelvic low-dose CT scan in the context of suspected or known urolithiasis.
Material and Methods
Study population
This retrospective study was conducted from November 2019 to June 2020 and received approval from the institutional review board. As the study was retrospective and observational, written informed consent from patients was waived. We assessed data from consecutive patients who had undergone a non-enhanced abdominopelvic low-dose CT scan in the context of suspected or known urinary stone disease. Patients with metallic hip prostheses were excluded to avoid bias in noise measurements. A total of 75 patients were included (40 men, 35 women; mean age = 49.3 ± 18.1 years; age range = 17–85 years). Body weight and body height were obtained from patient records at the time of CT, and the body mass index (BMI) was calculated. The dose-length product (DLP) and the volume CT dose index (CTDIvol) were extracted from the CT report. In addition, effective radiation doses were calculated as mSv with a conversion factor of 0.015.
CT examination protocol
All patients underwent a non-enhanced abdominopelvic low-dose CT scan in the supine position with the scanning range from the dome of the diaphragm to the pubic symphysis, using a 256-slice scanner (Revolution CT, GE Healthcare) using the following parameters: tube voltage = 100 kV; tube current modulation range = 50–200 mA; noise index = 30; slice acquisition = 128 × 0.625 mm; gantry rotation time = 600 ms; and pitch = 1.375. Three axial reconstructions were generated for each acquisition with a slice thickness of 0.625 mm and slice interval of 0.625 mm according to the standard algorithm: FBP 70% ASIR-V and high-strength DLIR (TrueFidelity™, GE Healthcare).
CT image analysis
All reconstructed images were reviewed on a commercially available workstation (AWServer 3.2, GE Healthcare) in native slice thickness of 0.625 mm using soft tissue window (window width [WW] = 400 HU, window level [WL] = 40 HU) for stone detection and bone window (WW = 2000 HU, WL = 500 HU) to count stones. No display filter was used for image analysis.
Quantitative analysis
Quantitative image quality was assessed by a single-blinded reader with five years of experience in interpreting abdominal CT. Six identically sized regions of interest (ROIs) of 1 cm2 in area were placed in the same location on each axial reconstruction. Four ROIs were drawn on the axial image, in the lower pole of the right kidney, the right psoas muscle, the retroperitoneal fat on the right side, and in the air about 1 cm from the anterior wall of the abdomen. Two other ROIs were drawn within the spleen and the bladder on different axial images (Fig. 1). In the case of a right nephrectomy, all of these measurements were performed on the left side. For each ROI, minimum, maximum, and average attenuation (in HU) and the standard deviation (representing objective image noise) were recorded. Signal-to-noise ratio (SNR), absolute contrast, and contrast-to-noise ratio (CNR) were calculated (11,22,23).
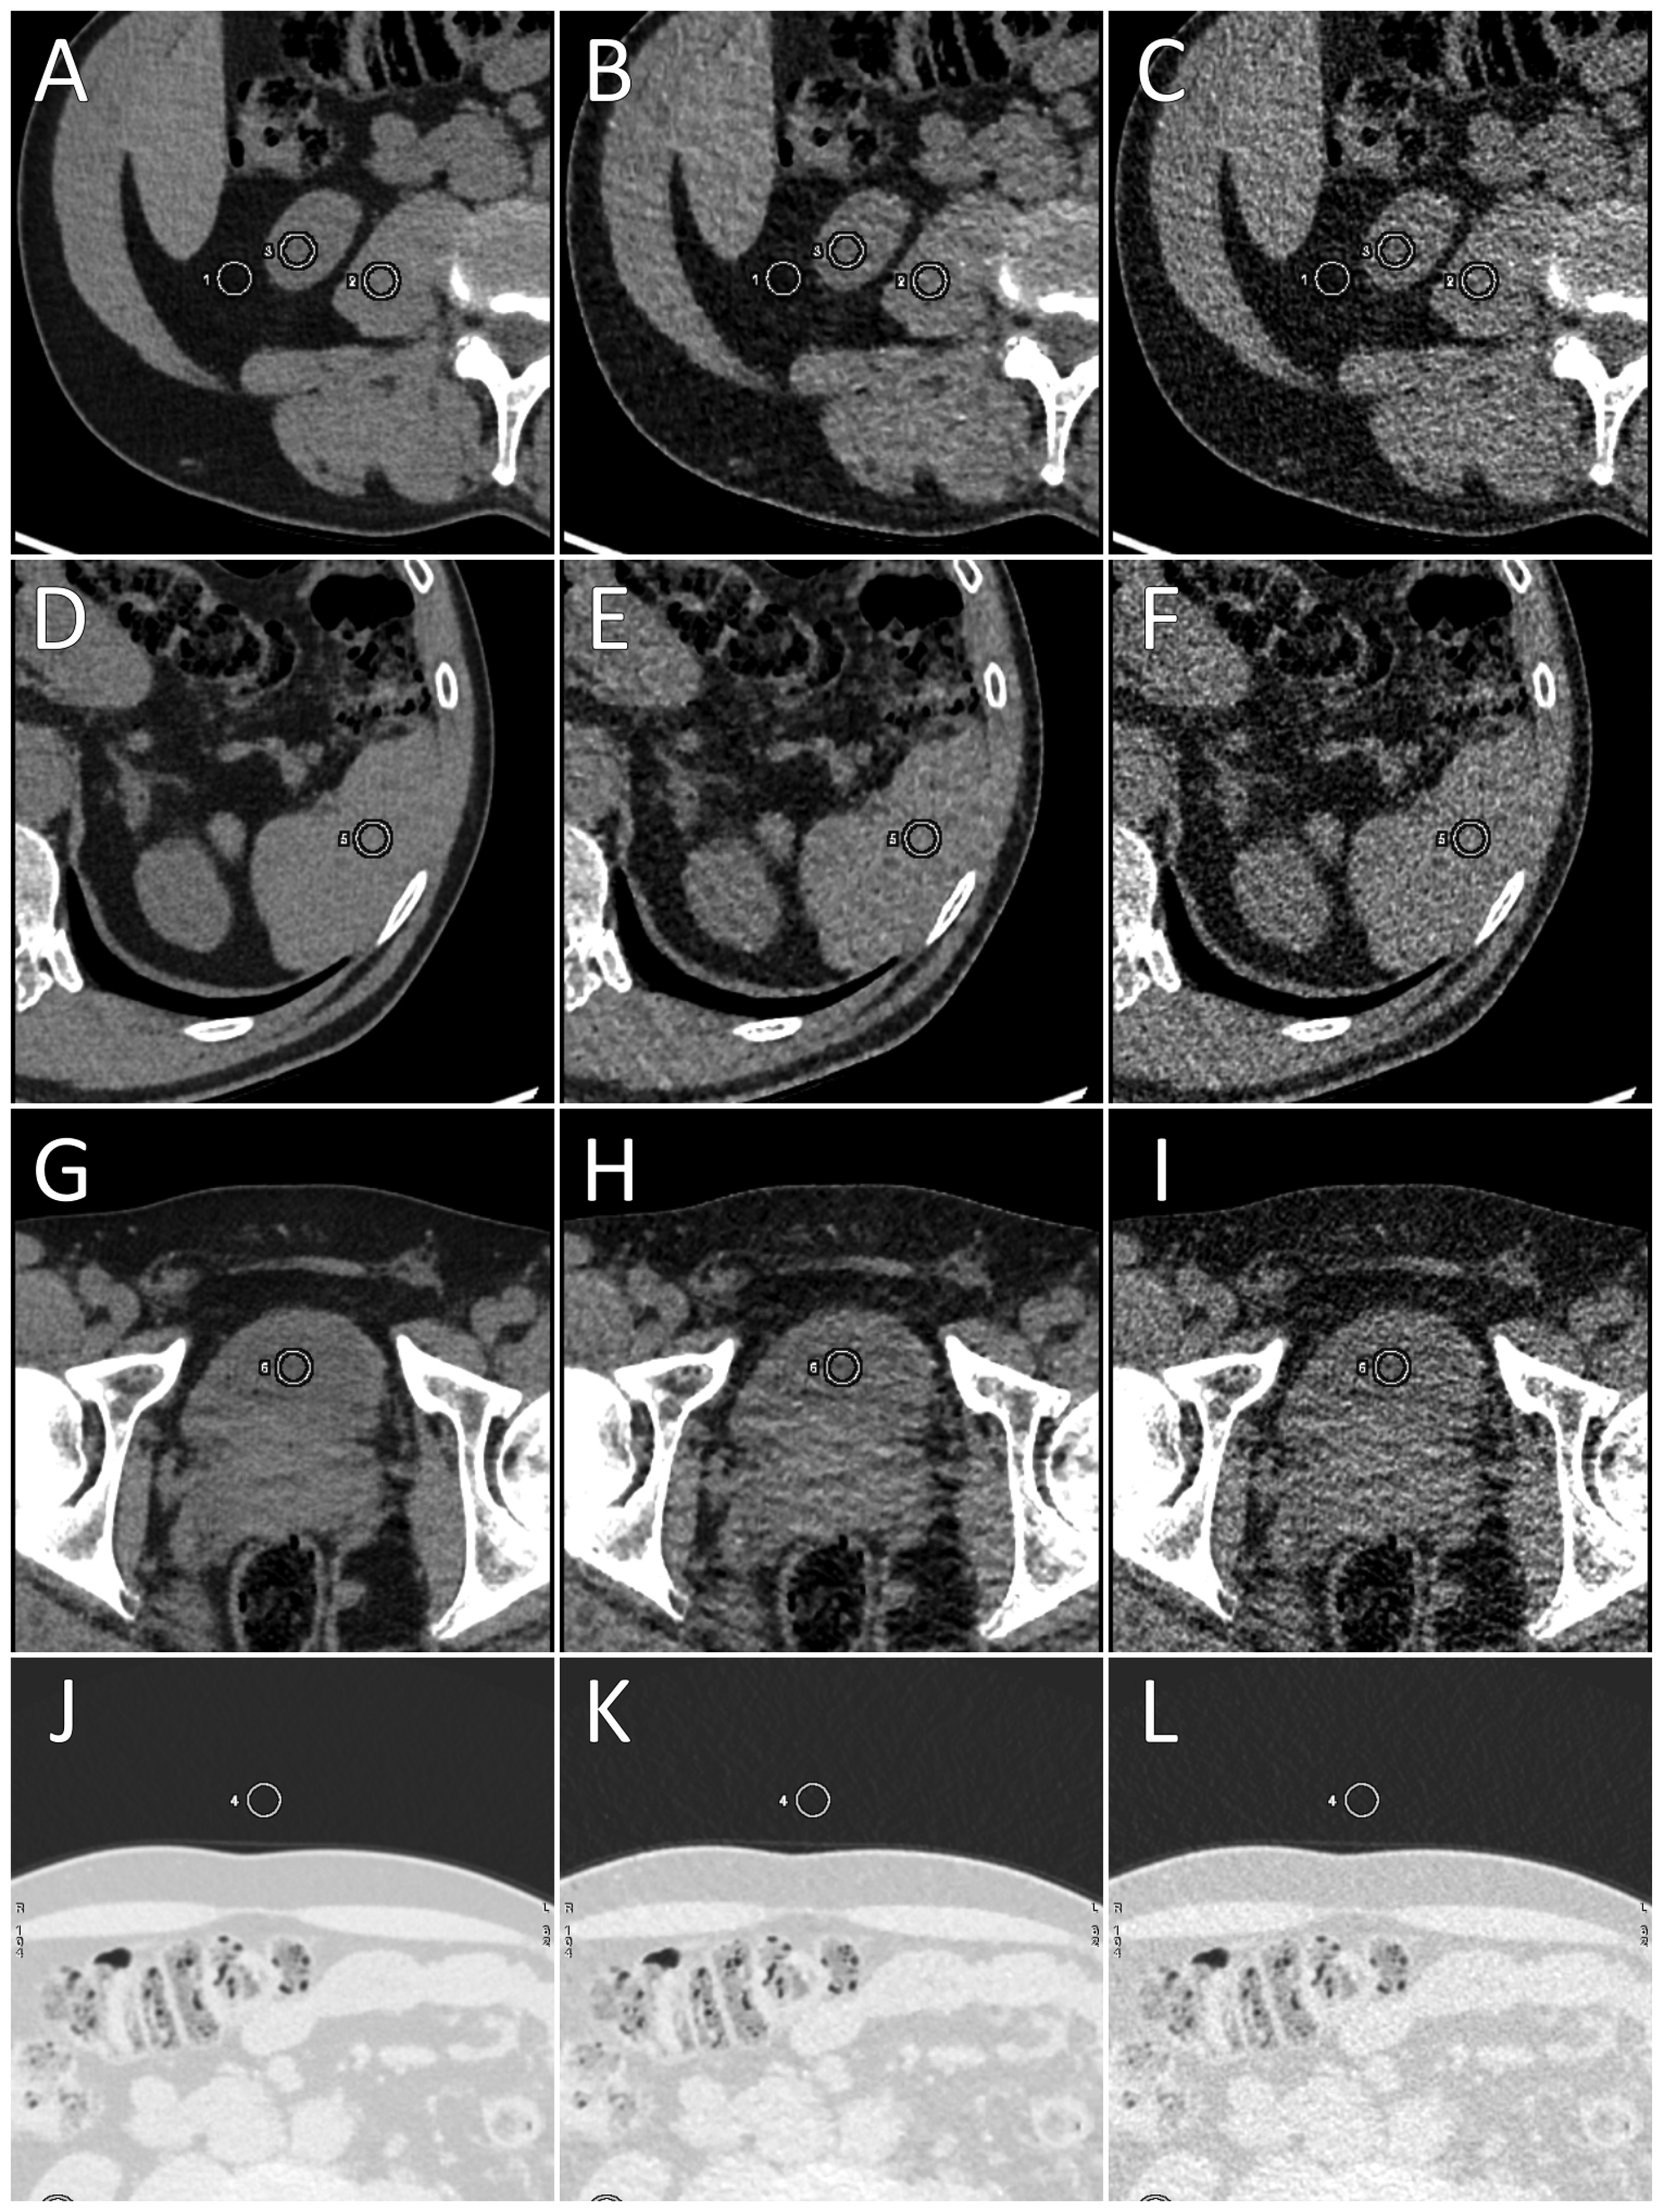
Regions of interest (white circles) on axial images at the level of: (a–c) lower pole of the right kidney; (d–f) spleen; (g–i) bladder; (j–l) region of interest in the air. Left column = deep learning image reconstruction, middle column = adaptive statistical iterative reconstruction, right column = filtered back projection.
SNR for each structure was calculated using this formula where HU corresponds to the mean attenuation of the structure and Noise corresponds to the noise within an empty signal structure, like air:
Two pairs of organs were used to calculate the absolute contrast and the CNR: spleen/kidney and retroperitoneal fat/kidney, according to these two formulas where HUSp corresponds to the mean attenuation in the spleen and HUK corresponds to the mean attenuation in the kidney.
The maximum attenuation in HU of the largest stone for each patient was obtained on each reconstruction using a ROI (24).
Qualitative analysis
Two independent and blinded radiologists, with five and 15 years of experience in genitourinary radiology, assessed image quality using a visual scale by assigning a score in the range of 0–3 (0 = not interpretable, 1 = difficult analysis with partial study of the urinary tract, 2 = correct analysis with almost complete study of the urinary tract, 3 = easy interpretation with perfect study of the urinary tract). The reading of the three different reconstructed series for each patient was performed with a minimal time interval of two weeks. All reconstructions were anonymized and randomized independently
Detection of urinary stones
For the diagnostic performance, detection of urinary stones was independently and blindly assessed by the two previous readers. The number, size (<3 or ≥3 mm), and location (right kidney, right ureter, left kidney, left ureter, and bladder) of urinary stones were recorded on randomized and anonymized DLIR series. During a second reading session, the two experienced radiologists determined a reference stone map based on the concomitant analysis of the FBP and ASiR-V series. This consensus served as a reference standard for the evaluation of diagnostic performance.
Statistical analysis
Statistical analysis was performed using Microsoft Excel 2016 and XL-STAT (Addinsoft). Descriptive statistics for the characteristics of the population were produced and data were expressed as mean ± SD. Noise in the air, SNR, and CNR of DLIR versus FBP and ASiR-V were compared using a Student’s t test for paired samples. A power calculation showing that a power value of 0.8 is reached for an effect size d = 0.32 (where d = mean(difference)/SD(difference) for paired samples) was performed using R software (https://www.R-project.org/). Pearson’s correlation test was used to assess the correlation between quantitative variables. To assess the detectability of urinary stones by observers against the defined consensus, an intraclass correlation coefficient (ICC) was used whose values were interpreted as follows: <0.19 = poor correlation; 0.20–0.39 = fair correlation; 0.40–0.59 = moderate correlation; 0.60–0.79 = substantial correlation; 0.80–1.00 = almost perfect correlation. Sensitivity, specificity, negative predictive value, and positive predictive value were calculated based on the presence or absence of urinary stones by anatomical region and patient, regardless of their size. Inter-observer comparison of image quality was performed using Cohen’s Kappa with weighted values. The significance threshold was set at 5%.
Results
Population
The mean body mass index (BMI) in the 75 patients was 27.2 ± 5.6 kg/m2 (range = 17.9–46.3 kg/m2). In total, 51 patients (68%) had a BMI <30 kg/m2 and 24 patients (32%) had a BMI ≥30 kg/m2. Patients’ characteristics are listed in Table 1. The mean effective dose delivered was 1.98 mSv, the mean CDTIvol was 2.57 mGy, and the mean DLP was 132.5 mGy.cm.
Population characteristics.
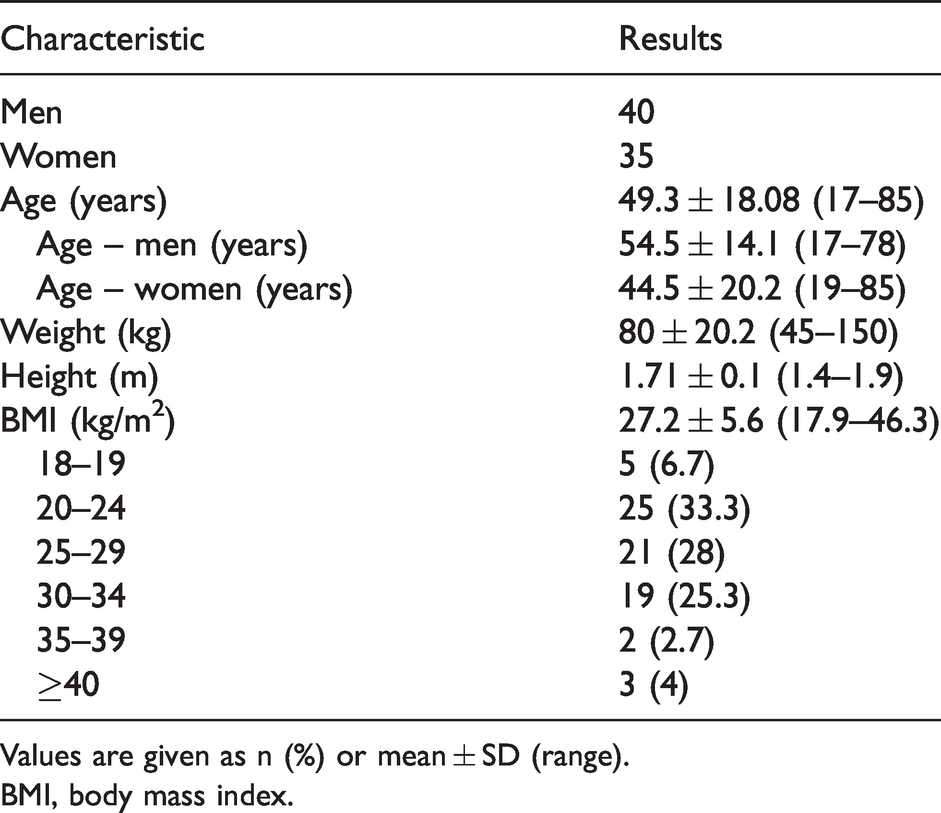
Values are given as n (%) or mean ± SD (range).
BMI, body mass index.
Diagnosis of urolithiasis
A total of 192 urinary stones were detected, including 75 stones in the right kidney, 13 stones in the right ureter, 87 stones in the left kidney, 13 stones in the left ureter, and four stones in the bladder. Of them, 74 stones measured <3 mm. An illustrative case showing the detectability of stones for the three reconstruction methods is depicted in Fig. 2.
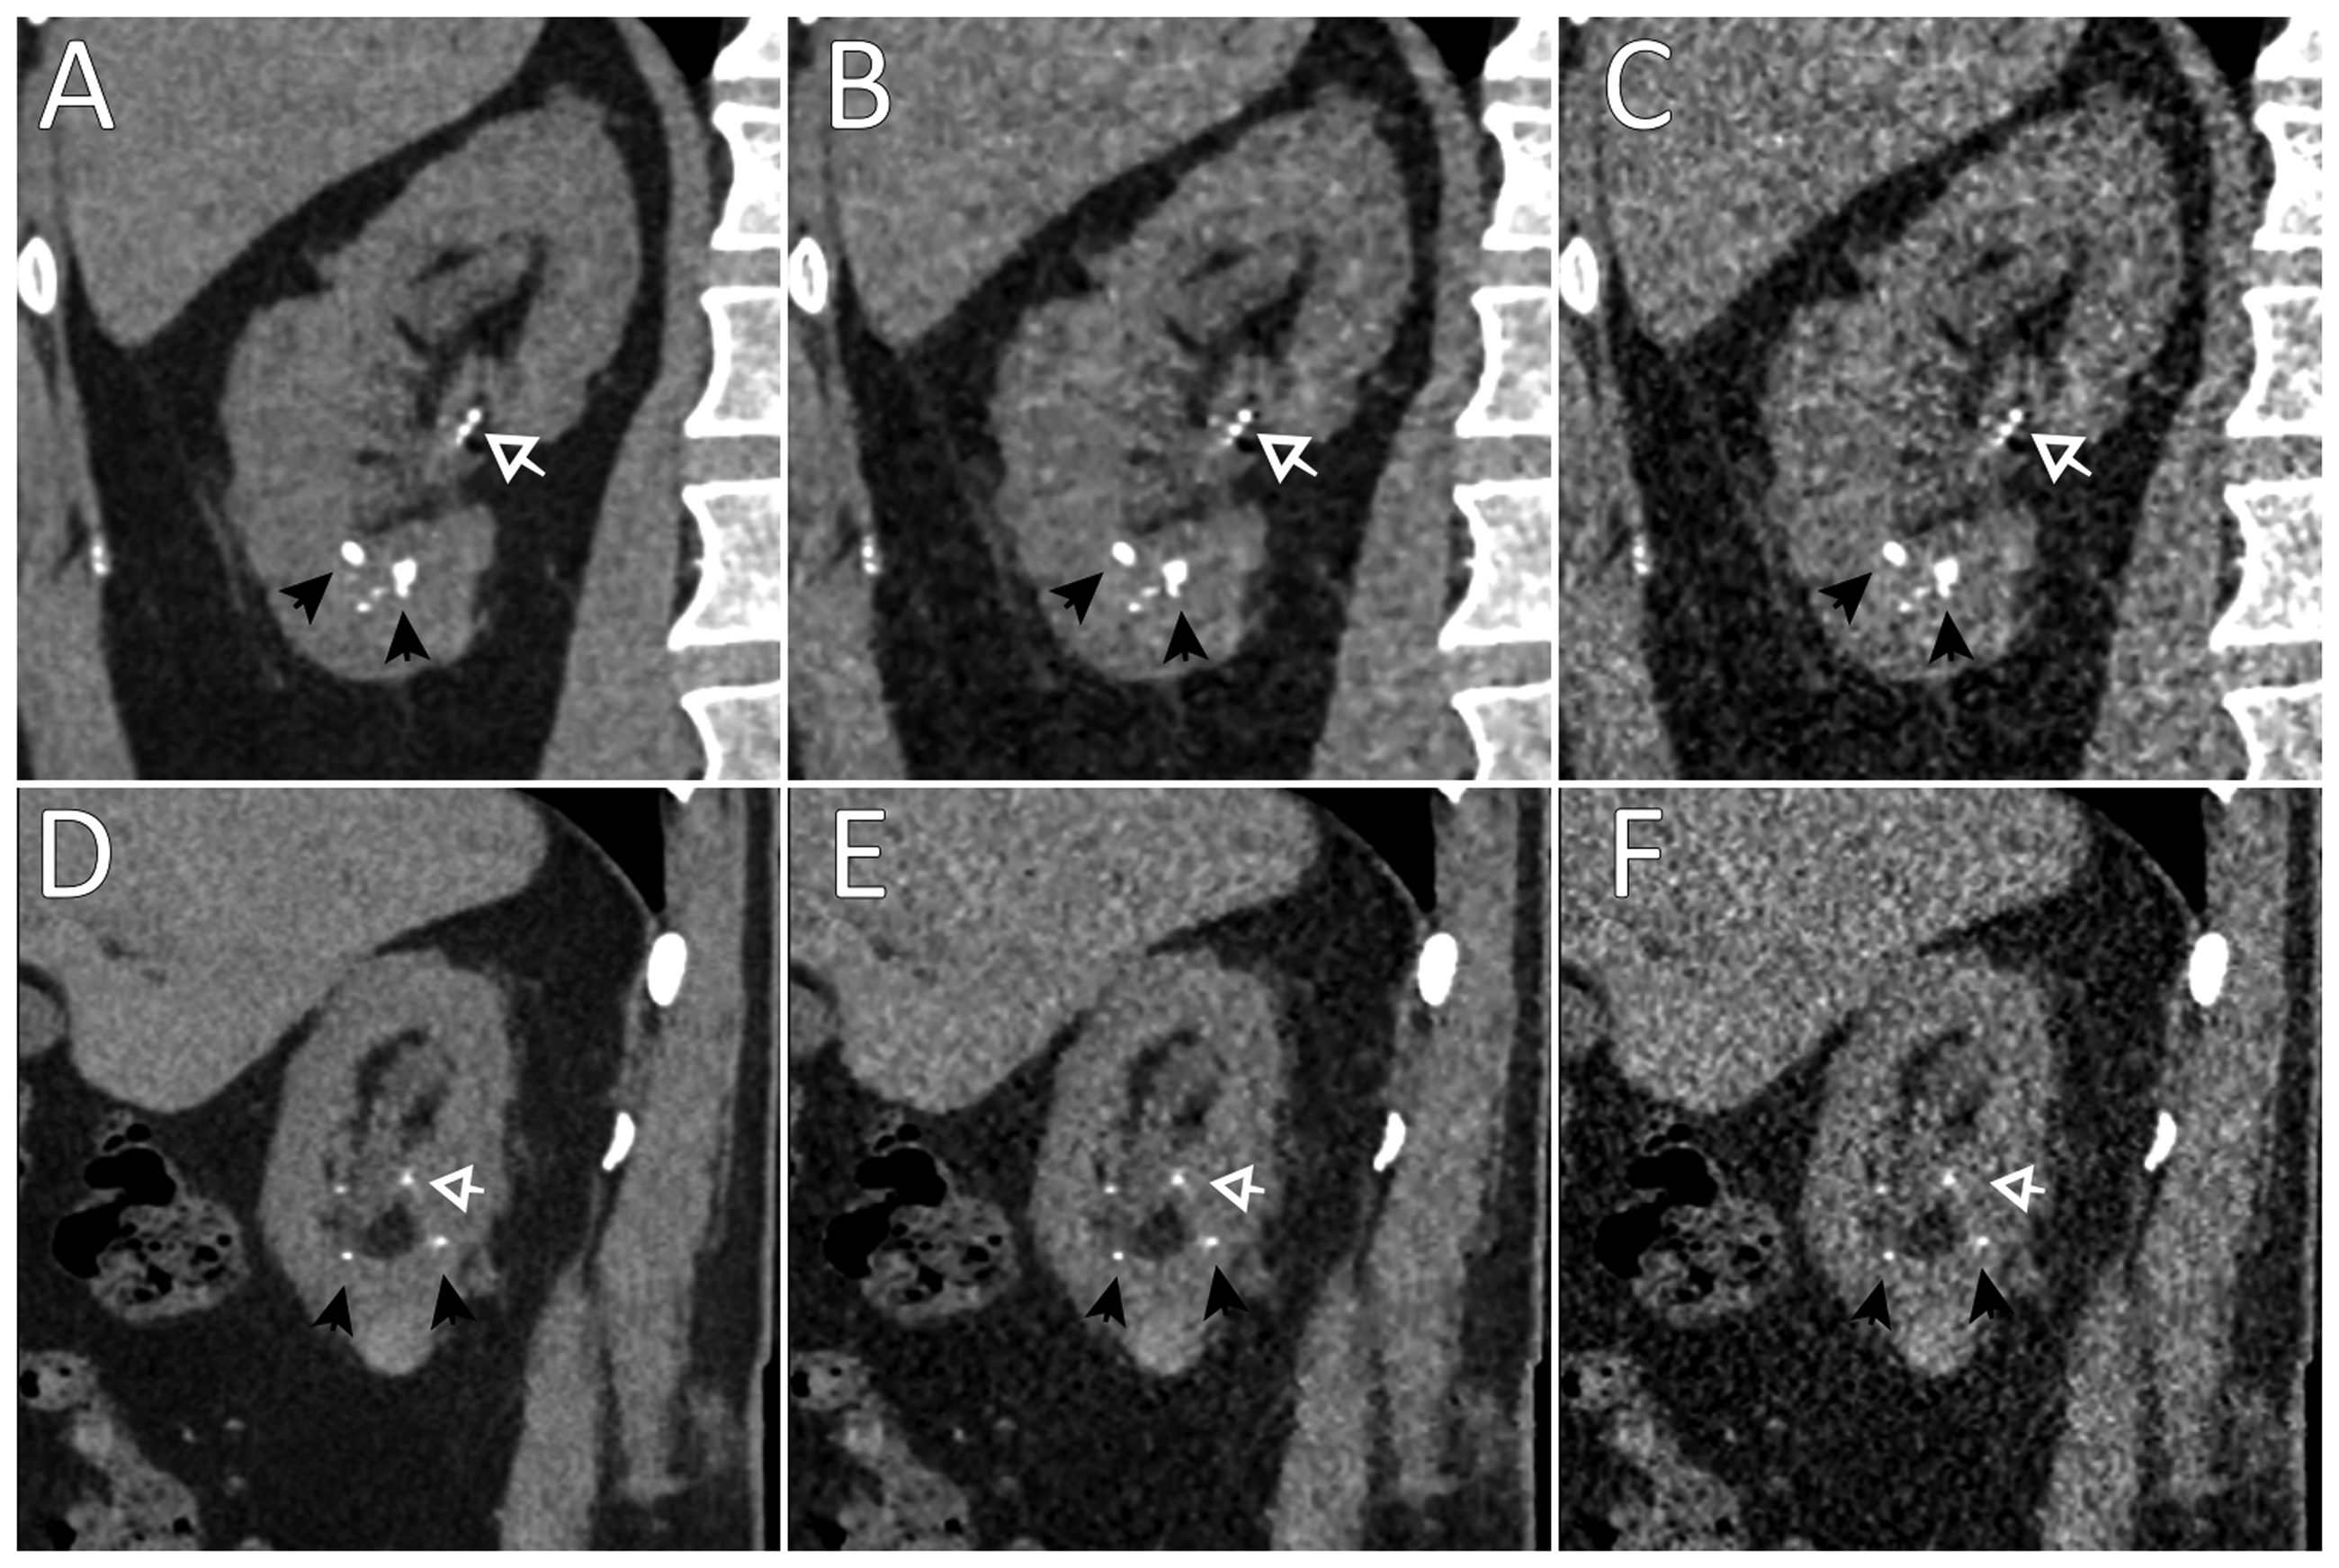
Computed tomography images of a 69-year-old man with both urinary stones (black arrows) and vascular calcifications (withe arrows): (a–c) coronal view; (d, e) sagittal view; (a, d) deep learning image reconstruction; (b, e) adaptive statistical iterative reconstruction; (c, f) filtered back projection.
The concordance between DLIR and consensus reconstructions, for detecting all stones, was excellent for both observers (ICC > 0.97; P < 0.001). Concerning the detection of stones according to their size, we observed a better detection of stones >3 mm for the two observers with the DLIR method (ICC = 0.95 and 0.99 vs. 0.77 and 0.85). Detailed results by anatomical region are listed in Table 2.
Detection of stones according to their size with deep learning iterative reconstruction.
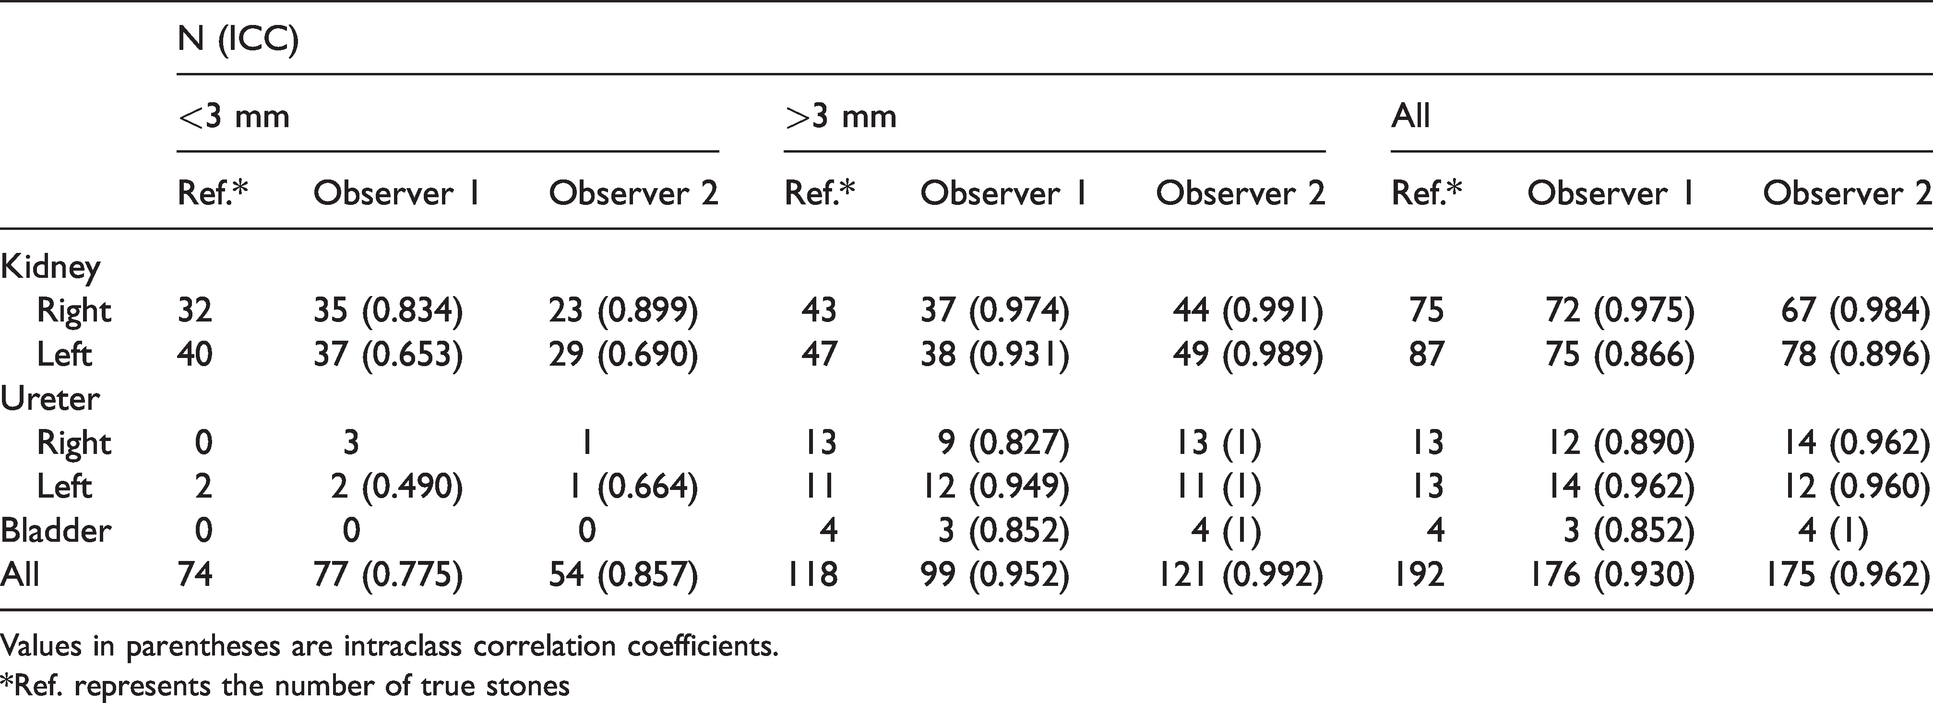
Values in parentheses are intraclass correlation coefficients.
*Ref. represents the number of true stones
For the diagnostic performance of stone detection regardless of their size, the sensitivity of DLIR was 0.80 and 0.90 for the first and second observers, respectively. Specificity was excellent for the two observers (>0.97). For urinary stones <3 mm, sensitivity and specificity were 0.73 and 0.95 for the first observer, and 0.76 and 0.99 for the second observer, respectively. For urinary stones >3 mm, the sensitivity and specificity values were 0.83 and 1 and 0.99 and 0.99 for observers 1 and 2, respectively.
The mean maximum attenuation of the largest stones was 956.0, 978.7, and 973.9 with DLIR, ASIR-V, and FBP reconstructions, respectively. On the DLIR series of two patients, the marked decrease in the stone attenuation rendered it almost undetectable. An example is illustrated in Fig. 3. The maximum attenuation of stones was significantly lower in DLIR images when compared to ASiR-V (P = 0.004) and FBP (P = 0.039) methods.
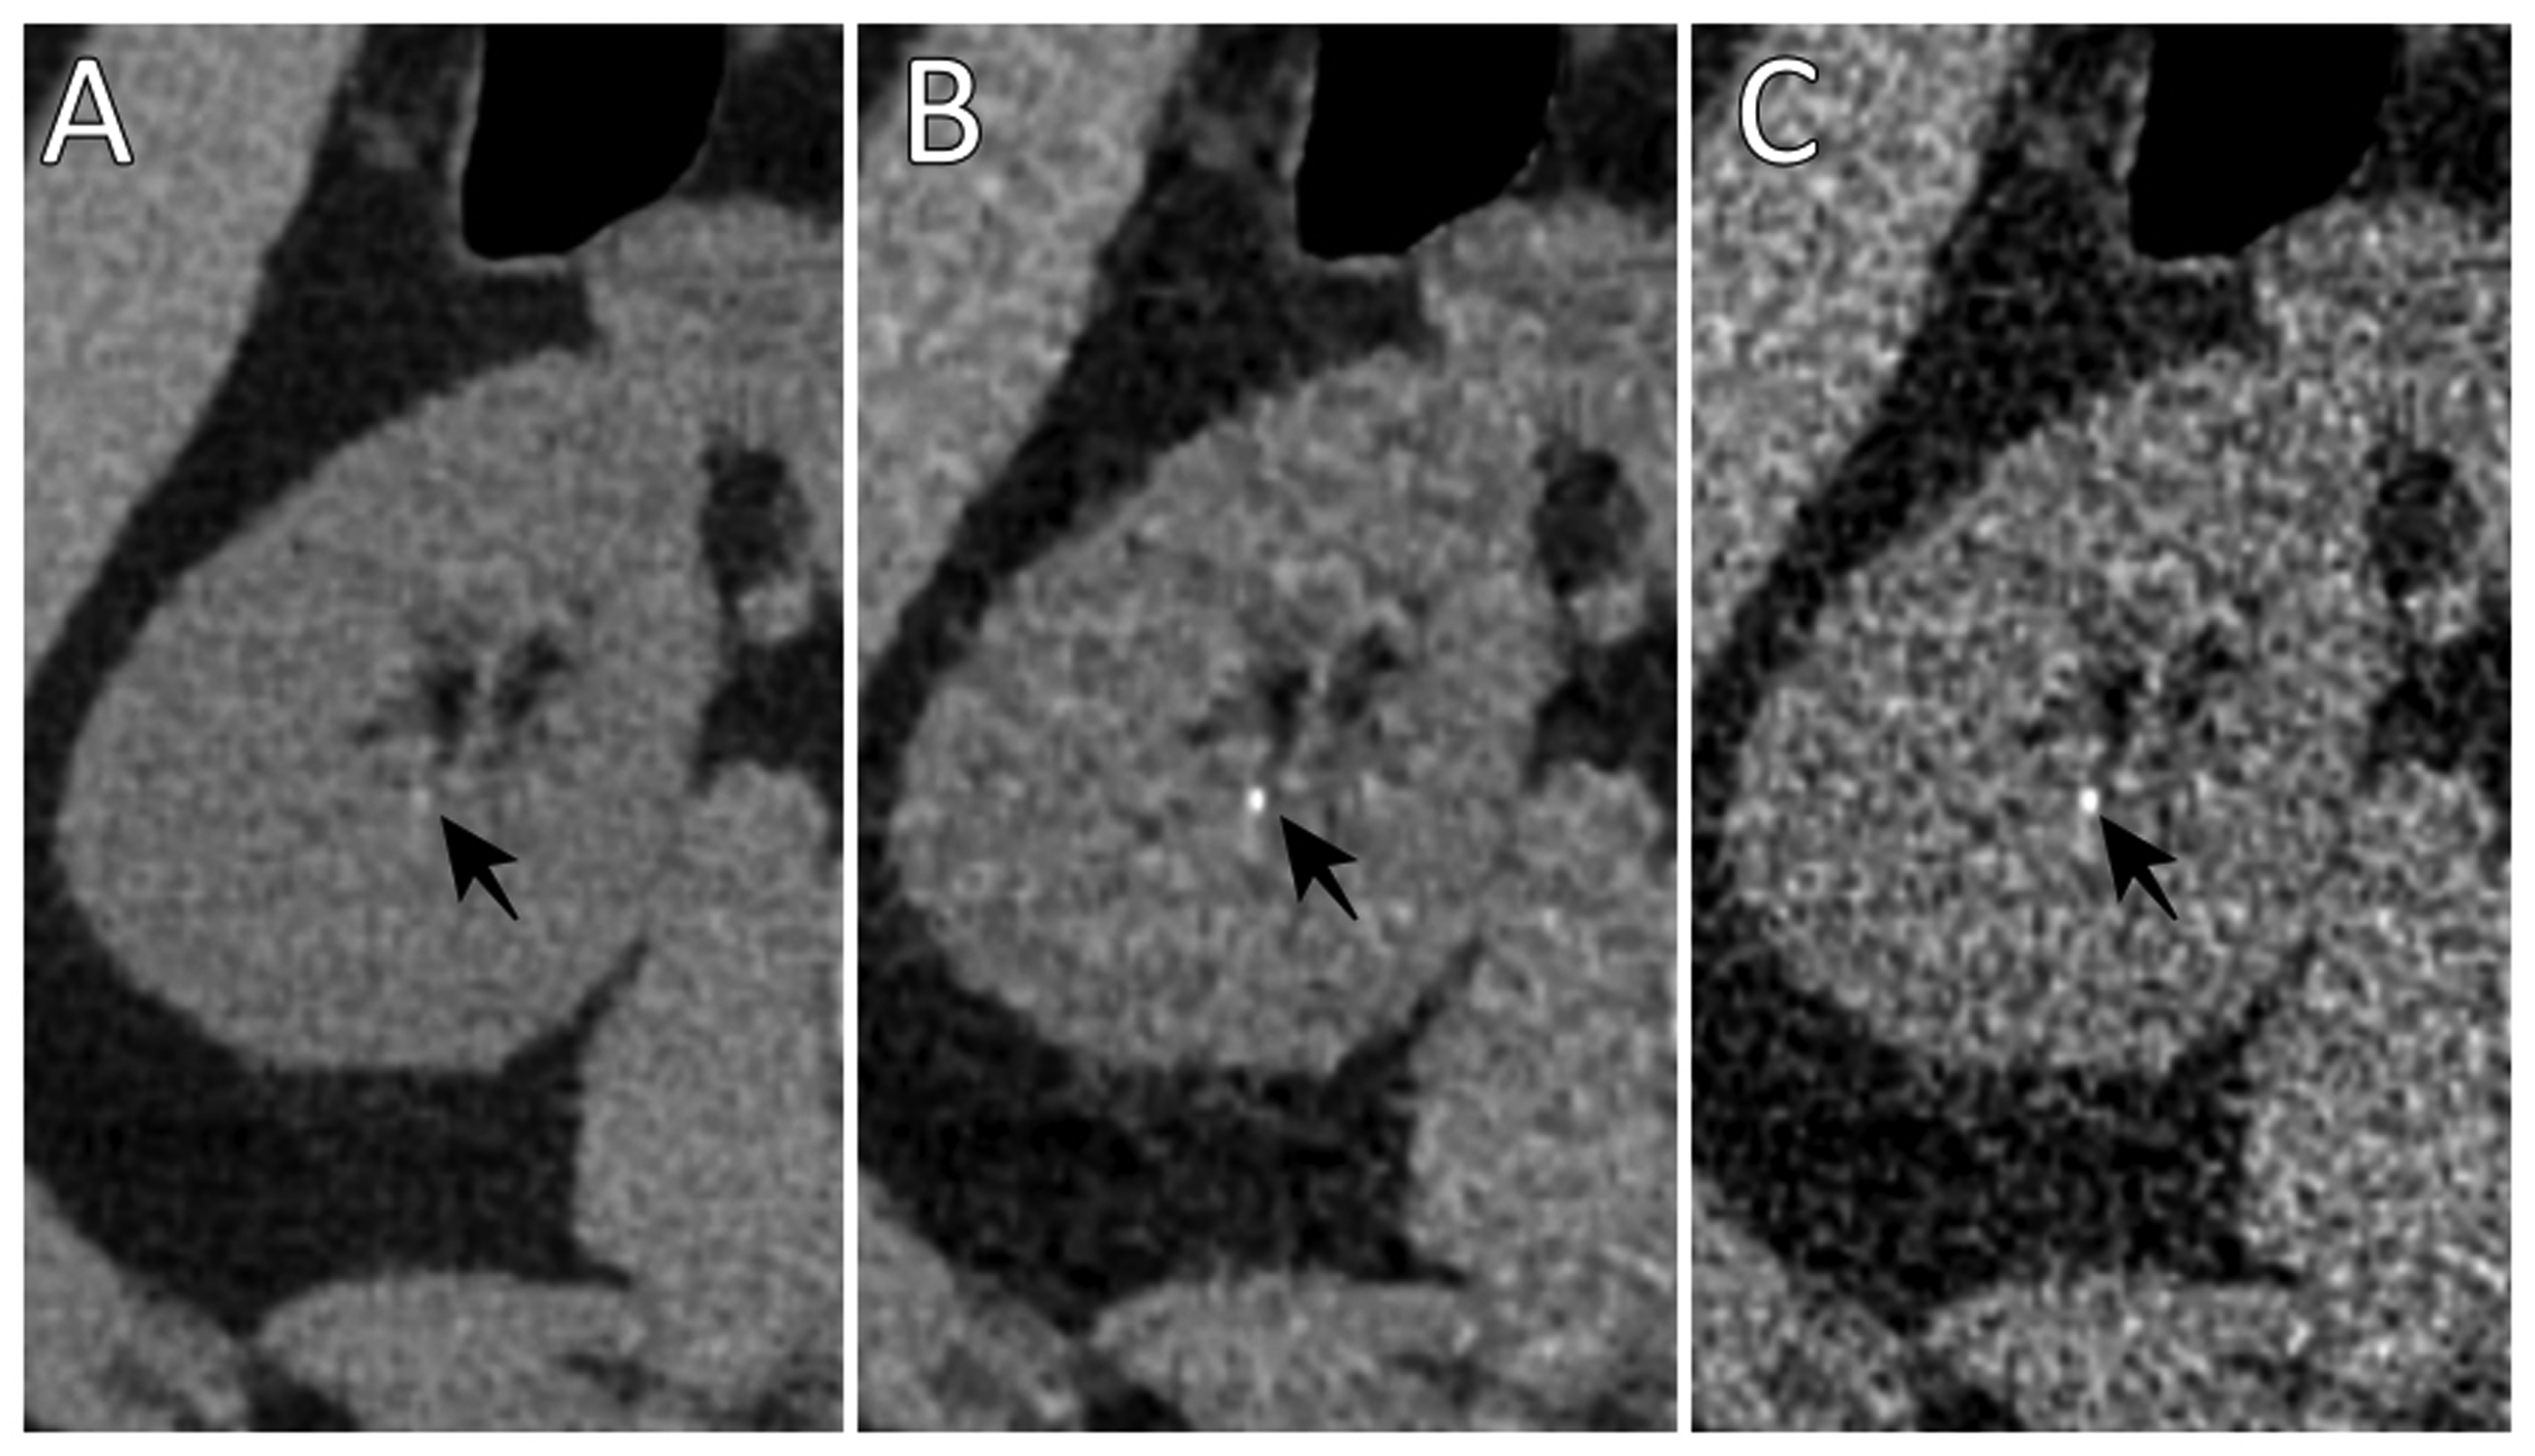
Computed tomography images of a 31-year-old man with a small urinary stone of the lower pole of the right kidney on the three image reconstructions showing the significant decrease of the attenuation of the stone on the DLIR. (a) DLIR; (b) adaptive statistical iterative reconstruction; (c) filtered back projection. DLIR, deep learning iterative reconstruction.
Quantitative analysis
Means of minimum, maximum, mean attenuation, noise, and SNR by anatomical structure and reconstruction method are summarized in Table 3. No significant difference between the reconstruction was observed in the mean attenuation. There was a statistically significant difference in the SNR measurements between each reconstruction at the different anatomical regions.
Attenuation, noise, and SNR in each structure and according to each reconstruction.
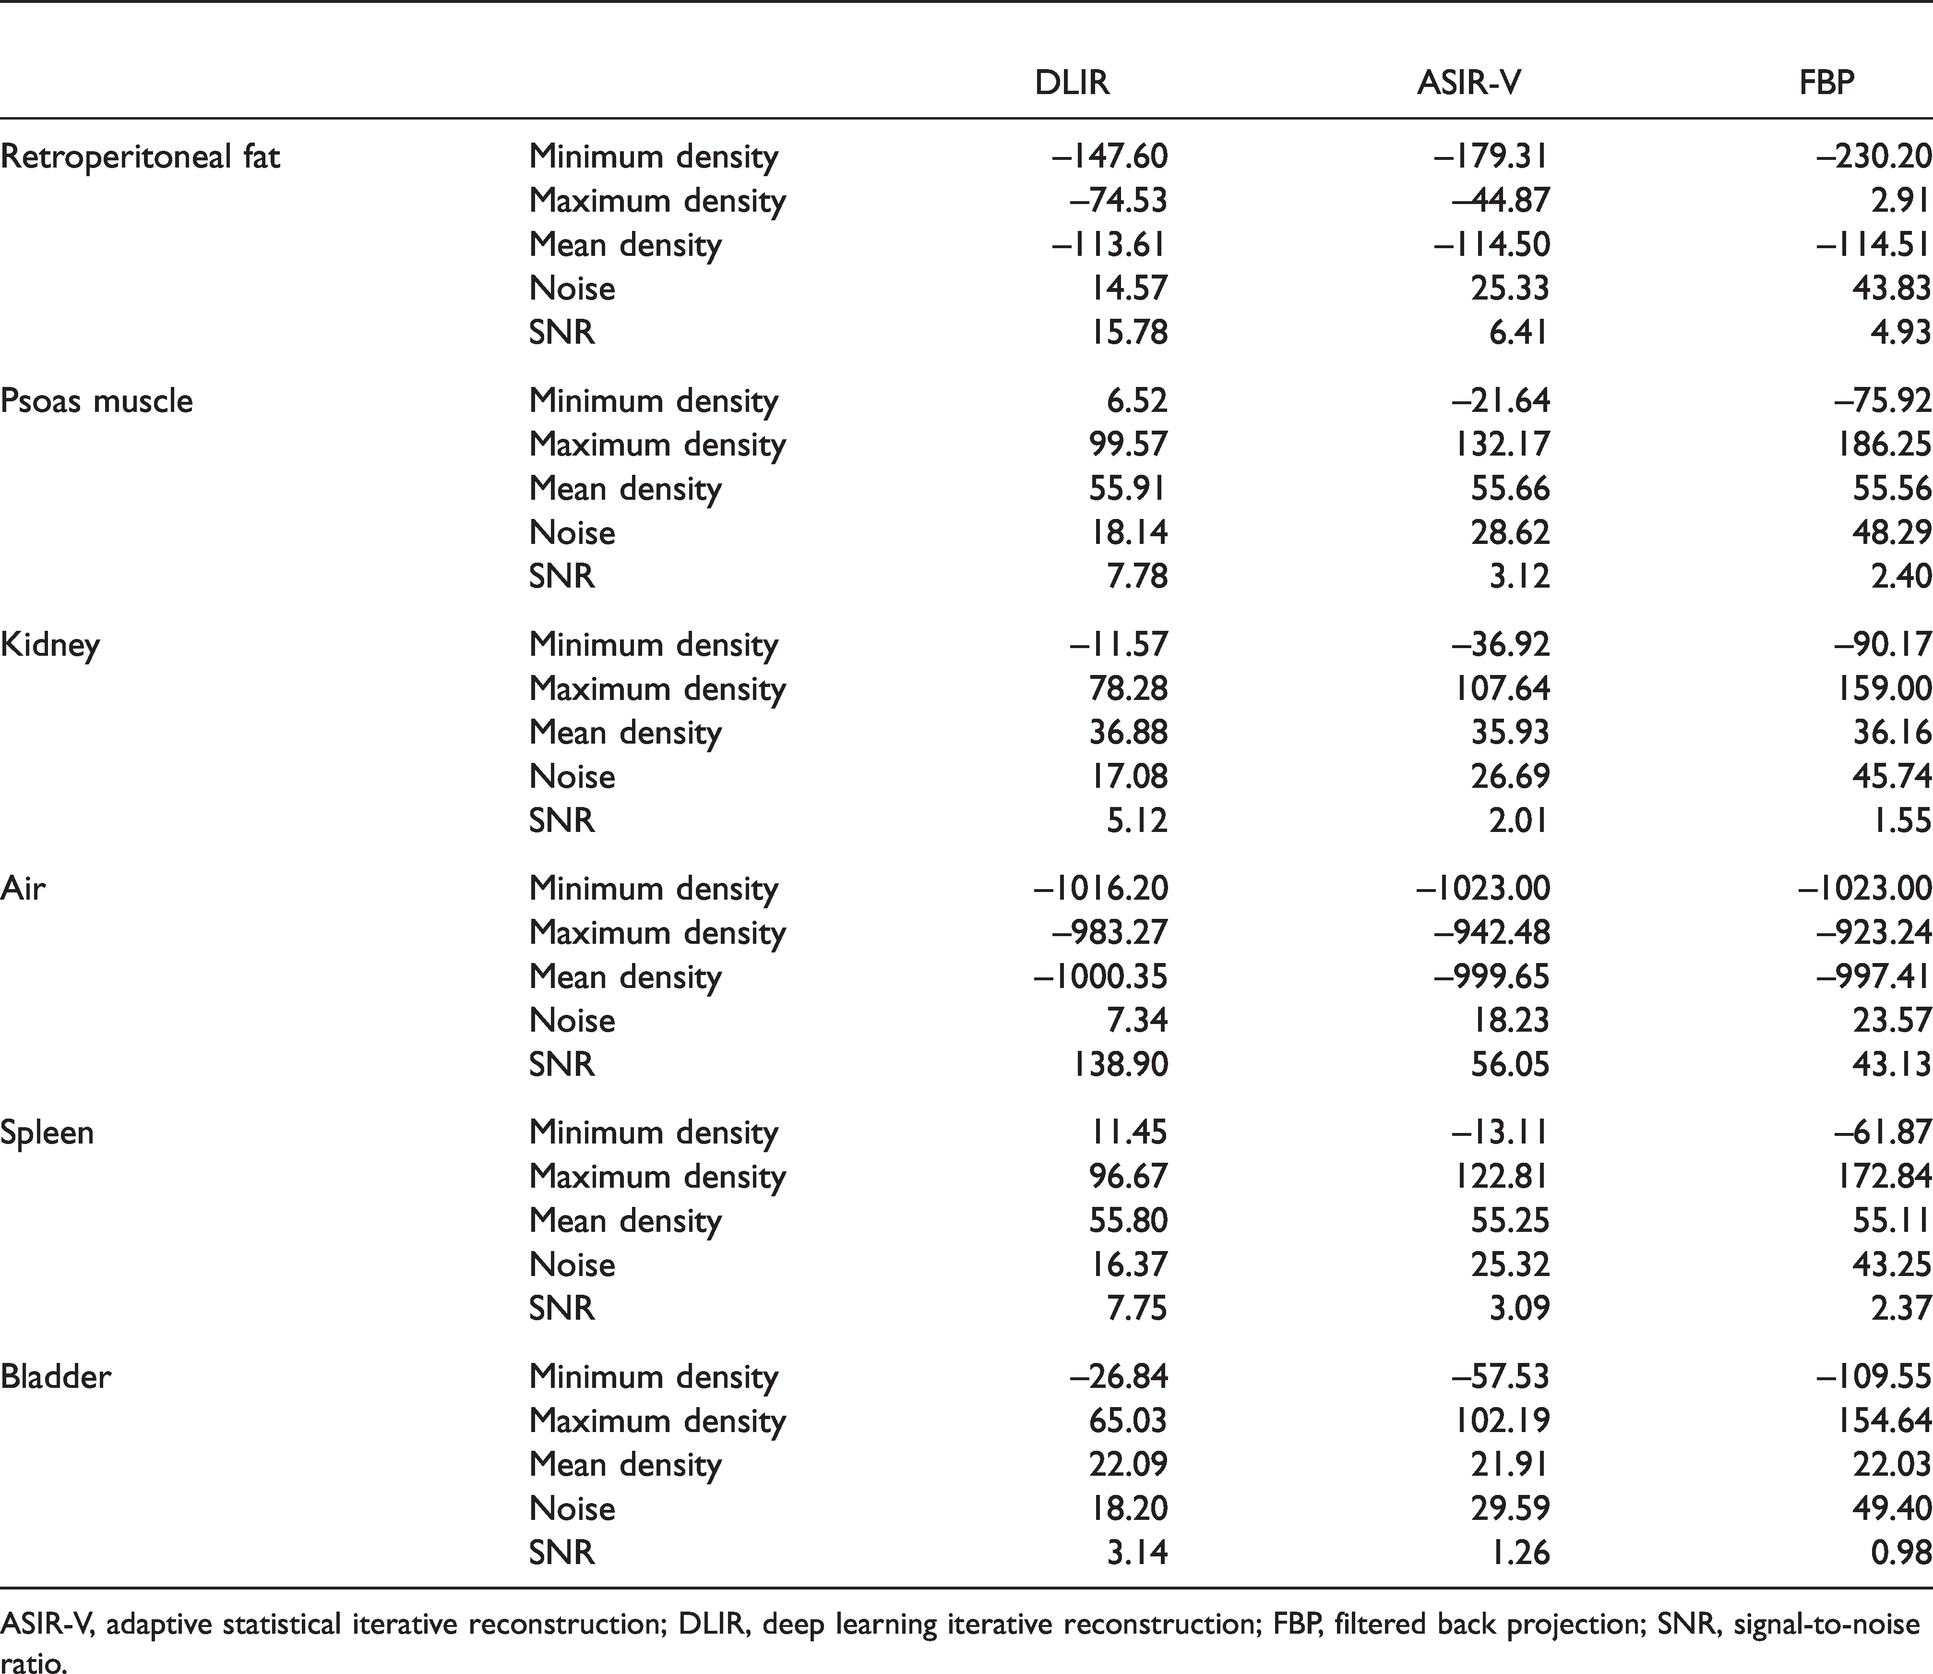
ASIR-V, adaptive statistical iterative reconstruction; DLIR, deep learning iterative reconstruction; FBP, filtered back projection; SNR, signal-to-noise ratio.
The noise measured in ambient air was significantly lower with DLIR in comparison with the other reconstruction methods (P < 0.001). There was a significant noise correlation between DLIR series and FBP (0.88; P < 0.001) or ASIR-V (0.83; P < 0.001) series. Though the mean values observed were close, the contrast between spleen and kidney (Table 4) using the DLIR and ASIR-V methods were significantly different (P = 0.01), which actually reflected a difference in the distribution of data. Conversely, there was no difference between DLIR and FBP (P = 0.26). For the kidney and retroperitoneal fat, a higher contrast was observed with DLIR compared to the other reconstructions (P < 0.001 and P = 0.01 for ASiR-V and FBP, respectively). CNR calculated for each reconstruction were statistically different for the two regions (P < 0.001).
Absolute contrast and CNR between kidney and spleen and between kidney and RPF.
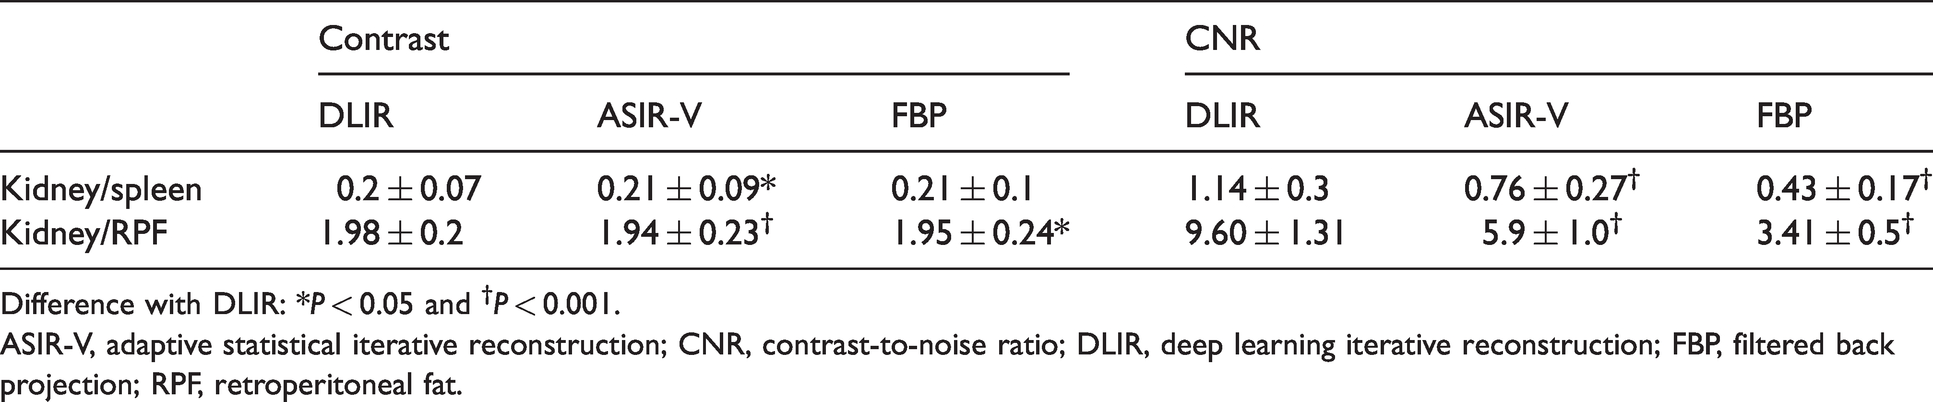
Difference with DLIR: *P < 0.05 and †P < 0.001.
ASIR-V, adaptive statistical iterative reconstruction; CNR, contrast-to-noise ratio; DLIR, deep learning iterative reconstruction; FBP, filtered back projection; RPF, retroperitoneal fat.
Qualitative analysis
Image quality was improved on the DLIR series (2.45 and 2.37) for the two observers compared to the ASIR-V (1.81–1.85) and FBP (1.81–1.95) reconstructions. No examination had a null score corresponding but the image quality inter-observer agreement was quite poor for the three reconstruction algorithms: moderate for DLIR (kappa = 0.53) and very low for standard reconstructions (kappa = 0.16).
Discussion
The present study evaluated the diagnostic performance of DLIR on unenhanced low-dose abdominopelvic CT for urolithiasis and compared quantitative and qualitative image quality with FBP and ASiR-V. To our knowledge, this is the first study evaluating DLIR in this indication.
In the present study, DLIR had better overall quantitative and qualitative image quality and lower noise than FBP and 70% ASiR-V. Many authors have evaluated the image quality of IRs for most clinical indications (25,26). However, several studies have demonstrated the limits of IRs in terms of dose optimization, degradation of image quality, and diagnostic performance, with the modification of the texture of the image giving an artificial appearance (27). This is not the case with DLIR, the image preserving a texture similar to that obtained in FBP images (21). In a retrospective study, Jensen et al. (28) reviewed cases of adults undergoing oncologic staging with portal venous phase abdominal CT and compared 30% ASiR-V with DLIR at low, medium, and high strengths. High-strength DLIR was associated with a 47% reduction in noise, resulting in a 92%–94% increase in CNR compared with that of 30% ASiR-V. For overall image quality and image noise and texture, DLIR scored significantly higher than 30% ASiR-V with significantly higher scores as DLIR strength increased. In a further recent study on 43 patients undergoing coronary CT angiography reconstructed with DLIR (TrueFidelity) and ASiR-V, Benz et al. (29) found that DLIR significantly reduced noise compared to ASiR-V while providing superior image quality and equal diagnostic accuracy. In a prospective study on 59 patients referred for standard-dose chest or abdominopelvic CT, Singh et al. (30) performed an additional low-dose CT acquisition to evaluate the image quality and diagnostic performance of another Deep Learning algorithm: Advanced Intelligent Clear-IQ Engine (AiCE®, Canon Medical Systems). They concluded that submillisievert chest and abdominopelvic CT reconstructed with AiCE provided acceptable image quality and that all pulmonary nodules detected at standard dose were also detected at low-dose with DLIR, unlike statistical and model-based IR. Akagi et al. (18) also showed that Deep Learning reconstructions (AiCE®) for injected abdominopelvic scanners had decreased noise and improved SNR compared to iterative hybrid reconstructions and MBIR reconstructions.
In a phantom study from Higaki et al. (31), the AiCE algorithm was compared to MBIRs (31). Using dose levels in the range of 1.2–18.7 mGy, the authors observed that MBIRs provided better spatial resolution at higher doses but deep learning images had lower noise and higher task-based detectability (32). The noise and spatial resolution properties of CT images reconstructed with DLIR (True Fidelity®) have been investigated in other phantom studies (20,21,32). Calculating NPS and TTF features at different dose levels for DLIR, ASIR-V, and FBP reconstructions, the authors showed better results for DLIR reconstructions. In addition, they established that DLIR reconstructions provided higher detectability of low- or high-contrast lesions (21,32).
Attenuation of the largest stone was noted in each patient in order to assess the ability to characterize the nature of stones with DLIR. There was a significant decrease in the maximum attenuation with DLIR, without altering its characterization. However, in two patients, this was responsible for the virtual disappearance of the stone on DLIR images without clinical impact due to its millimeter size.
In the present study, there was a good correlation for the detection of urinary stones of all sizes and for urinary stones > 3 mm with the consensus reference. However, there is a decreased correlation for stones < 3 mm, in the two observers. This limit has been already observed especially in the meta-analysis by Rob et al. (33) listing prospective studies, which compare abdominopelvic scans performed with ultra-low-dose or low-dose protocols for urolithiasis with standard dose protocols. Indeed, the authors observed, for the examinations at low-dose and very low-dose, an overall sensitivity of 90%–100% and a specificity of 86%–100% with certain limitations such as the detection of stones < 3 mm and patients having a BMI > 30 kg/m2. Similar results were observed in the study by den Harder et al. (33).
In the present study, the mean effective dose was 1.98 mSv, the mean CDTIvol was 2.57 mGy, and the mean DLP was 132.5 mGy.cm, which corresponds to the effective doses stated in the literature for low-dose acquisition in this type of indication (31,33,34).
The present study has some limitations. The first is that our reference standard relies on the concomitant analysis of the FBP and ASiR-V by the two readers. However, we believe that this is the best compromise in such retrospective studies with absence of standard dose CT as reference. The second limitation stands in the difficulty of accurately measuring stones with a size close to 3 mm, which can affect the diagnostic performance of size-based stone detection. In this study, we did not consider the impact of individual parameters such as BMI on radiation dose or image quality. Finally, the difference in image texture from the three series that could be detected by experienced radiologists may introduce a potential bias in the subjective image quality assessment.
Future prospective studies will be needed to evaluate DLIR in urolithiasis on ultra-low-dose abdominal CT (same dose as abdominal radiograph) and to compare it to low-dose CT (31,35). MBIRs have already shown good diagnostic performance on ultra-low-dose abdominal CT but the reconstruction time is incompatible with routine clinical practice (33,34,36).
In conclusion, the deep learning-based DLIR technique improves both objective and subjective image quality, compared to FBP and ASIR-V, on unenhanced abdominal CT for urolithiasis, and provides good diagnostic performance, although the detection of urinary stones <3 mm remains difficult.
Footnotes
Declaration of conflicting interests
The author(s) declared no potential conflicts of interest with respect to the research, authorship, and/or publication of this article.
Funding
The author(s) received no financial support for the research, authorship, and/or publication of this article.
Supplemental material
Supplemental material for this article is available online.