
Abstract
OBJECTIVES:
To evaluate the performance of deep learning image reconstruction (DLIR) algorithm in dual-energy spectral CT (DEsCT) as a function of radiation dose and image energy level, in comparison with filtered-back-projection (FBP) and adaptive statistical iterative reconstruction-V (ASIR-V) algorithms.
METHODS:
An ACR464 phantom was scanned with DEsCT at four dose levels (3.5 mGy, 5 mGy, 7.5 mGy, and 10 mGy). Virtual monochromatic images were reconstructed at five energy levels (40 keV, 50 keV, 68 keV, 74 keV, and 140 keV) using FBP, 50% and 100% ASIR-V, DLIR at low (DLIR-L), medium (DLIR-M), and high (DLIR-H) settings. The noise power spectrum (NPS), task-based transfer function (TTF) and detectability index (d’) were computed and compared among reconstructions.
RESULTS:
NPS area and noise increased as keV decreased, with DLIR having slower increase than FBP and ASIR-V, and DLIR-H having the lowest values. DLIR had the best 40 keV/140 keV noise ratio at various energy levels, DLIR showed higher TTF (50%) than ASIR-V for all materials, especially for the soft tissue-like polystyrene insert, and DLIR-M and DLIR-H provided higher d’ than DLIR-L, ASIR-V and FBP in all dose and energy levels. As keV increases, d’ increased for acrylic insert, and d’ of the 50 keV DLIR-M and DLIR-H images at 3.5 mGy (7.39 and 8.79, respectively) were higher than that (7.20) of the 50 keV ASIR-V50% images at 10 mGy.
CONCLUSIONS:
DLIR provides better noise containment for low keV images in DEsCT and higher TTF(50%) for the polystyrene insert over ASIR-V. DLIR-H has the lowest image noise and highest detectability in all dose and energy levels. DEsCT 50 keV images with DLIR-M and DLIR-H show potential for 65% dose reduction over ASIR-V50% withhigher d’.
Introduction
Dual-energy spectral Computed Tomography (DEsCT) is an advanced medical imaging technique that has found expended applications in diagnostics and research [1–3]. Especially, the monochromatic energy images of DEsCT at low electron volts (keV) can enhance the contrast degree of iodine, which may improve the detection rate of lesions and diagnostic confidence.
However, there are some application challenges in DEsCT [4–7]. First, at low keV levels, image noise increases, ultimately affecting image quality and lesion detection. While the most significant improvement in contrast enhancement is observed at 40 keV, in practical clinical settings, many researches choose to utilize 50 keV or even higher, such as 60 keV images to balance image noise and contrast enhancement [8, 9]. The need to use low radiation dose, especially for pediatric patients [10], exacerbates the noise problem, making it harder to use low keV images in DEsCT. It is thus desirable to reduce image noise, especially noise of low keV images to fully take advantages of DEsCT.
Iterative reconstruction algorithms, such as the adaptive statistical iterative reconstruction-Veo (ASIR-V) by GE HealthCare, have been used to combat image noise in both single tube voltage (kVp) CT and dual-energy CT applications with some success. However, studies also indicated that the use of high strength iterative reconstruction algorithms may sometimes change the noise texture of images, causing over-smoothing and plastic-looking image artifacts. A few years ago, a Deep Learning Image Reconstruction (DLIR) was developed to address this issue and has been widely adopted for medical imaging. The DLIR algorithm, constructed on the understanding of the CT system design, is integrated within a Deep Neural Network (DNN). Many studies have demonstrated the effectiveness of DLIR in the traditional single kVp CT [11–17]. Recently, DLIR has been incorporated into DEsCT and a limited studies have approved its clinical usefulness in improving image quality and lesion conspicuity and detectability [18–20]. However, there is still lacking systematic performance evaluation for DLIR, especially its performance in low radiation dose conditions and for low energy (keV) DEsCT images [21–24]. Therefore, the objective of our study was to evaluate the performance of DLIR algorithm in DEsCT as a function of radiation dose and monochromatic image energy level, in comparison with the traditional filtered-back-projection (FBP) and the state-of-the-art ASIR-V algorithms using a phantom and the method proposed by the American Association of Physicists in Medicine task group report-233 (AAPM TG-233). We hope this investigation could provide valuable insights into the benefits and limitations of DLIR especially in using low keV images in DEsCT, and the potential radiation dose reduction capability using the clinically more relevant parameter of lesion detection index as the basis for comparison.
Materials and methods
Phantom
An ACR464 phantom (The Phantom Laboratory Inc. Gammex, WI, USA) was used. The module 1 has four inserts: Teflon, Acrylic, Polystyrene, and air, and was used to evaluate the task-based transfer function (TTF). The module 3 which contains a uniform, tissue-equivalent material was used to compute the noise power spectrum (NPS). The module 1 and module 3 were both used to compute detectability index (d’).
CT systems, acquisition, and reconstruction parameters
All scans were acquired on a 256 row CT (GE Revolution CT, IL, America) using the fast tube voltage switching DEsCT imaging mode at four different dose levels (volume CT dose indexes: CTDIvol of 3.5 mGy, 5 mGy, 7.5 mGy and 10 mGy, determined on a 32-cm diameter reference phantom) with fixed tube currents (Table 1). Standard kernel was used in all image reconstructions. Five sets of virtual monochromatic images (40 keV, 50 keV, 68 keV, 74 keV, 140 keV) were reconstructed with each of the following reconstruction algorithms: FBP, ASIR-V with 50% (ASIR-V50%) and 100% (ASIR-V100%) strength, and DLIR at low (DLIR-L), medium (DLIR-M), and high (DLIR-H) setting. The 68 keV and 74 keV energy levels represents the 100 kVp-like and 120 kVp-like images in the conventional single kVp CT imaging, respectively. All reconstructions were performed using a standard kernel and with an image slice thickness of 0.625 mm. The total research consisted of 30 image sets at each of the 4 dose levels.
Acquisition parameters at each of the four dose levels
Acquisition parameters at each of the four dose levels
An open-source software (imQuest, Duke University, Durham, NC, USA) was used to evaluate the image quality. NPS, TTF, and detectability index were measured and calculated using the method suggested by the AAPM TG-233.
Noise power spectrum
The Noise Power Spectrum (NPS) calculation is a tool widely used to characterize the noise properties of CT imaging systems. The NPS is also used to measure the nature of the image noise and the spatial frequency distribution of the noise. Given the reconstruction FOV in the protocol, data were extracted from 5 consecutive slices of the module. On each slice, five 128×128-pixel regions of interests (default size in software) within axial images in phantom were calculated (Fig. 1B). This gave an ensemble of 25 ROIs in total over the 5 image slices. The two-dimensional Noise Power Spectrum (NPS) was computed by implementing the discrete Fourier transform on each Region of Interest (ROI), followed by averaging the results across the entire dataset. NPS was calculated using the following formula [25–29]:
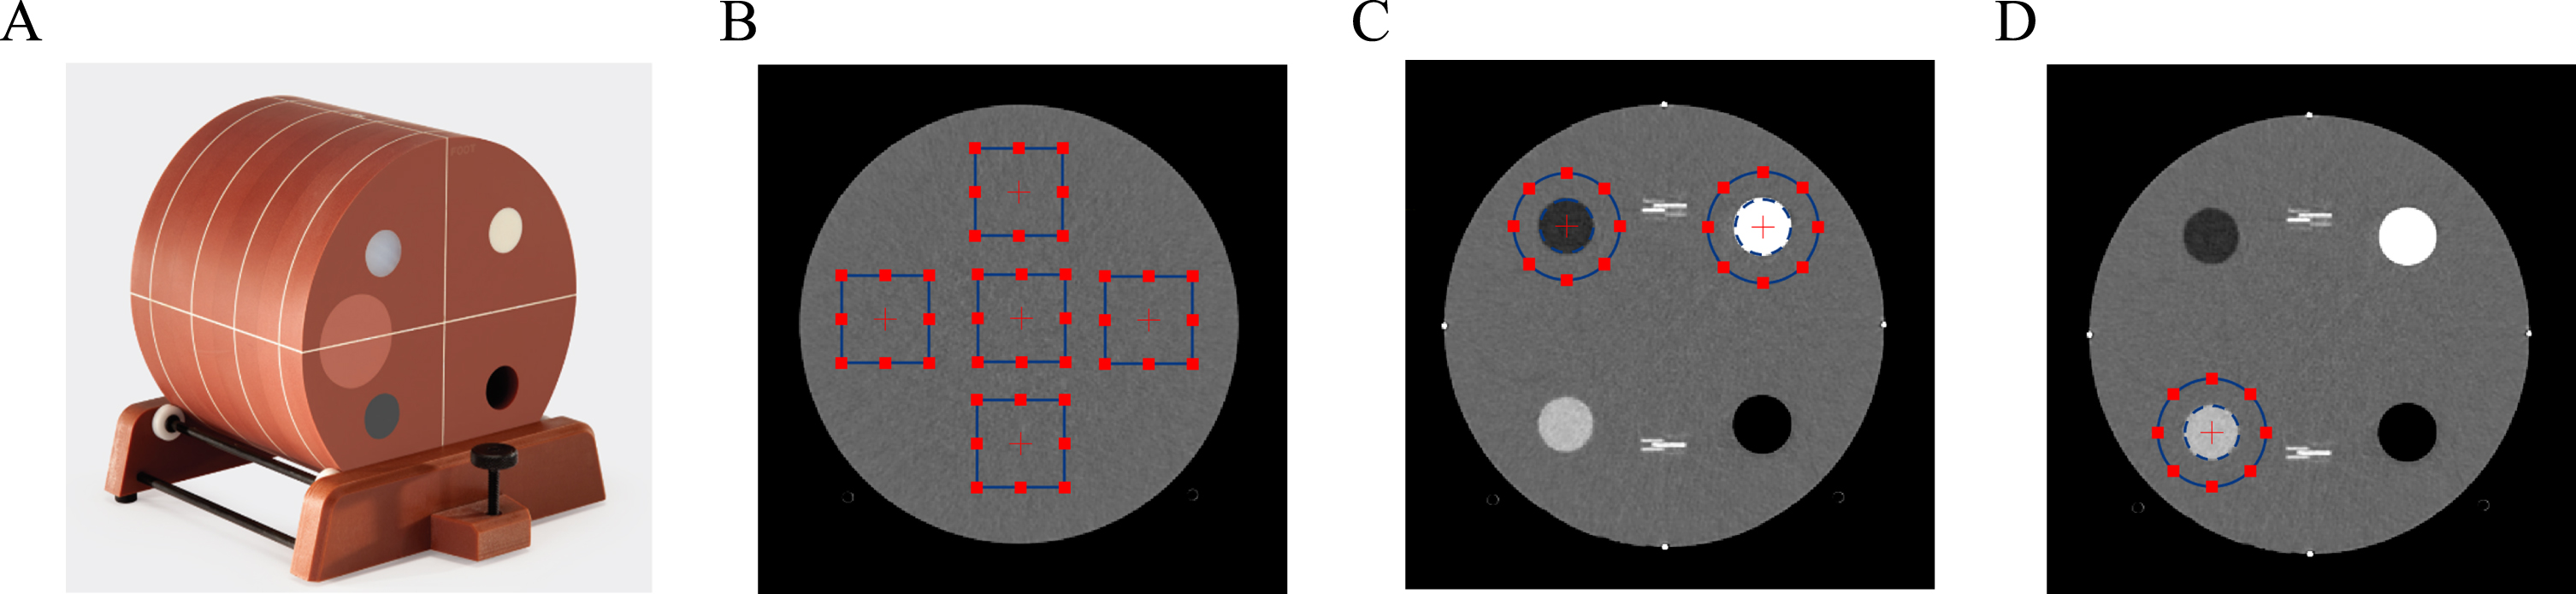
A. ACR464 Phantom. B. ROIs used for the noise power spectrum (NPS) calculation and normalized NPS calculation. C. ROI used to compute the task-based transfer function (TTF) (on Teflon and Polystyrene). D. ROI used to compute the detectability index (d’) (on Acrylic).
We made a comparison of noise characteristics across various reconstruction algorithms by evaluating factors such as: mean noise level, the area under the curve of the Noise Power Spectrum (NPS area, determined as the integral of the NPS), and the average frequency (favg).
Task-based transfer function calculations were performed on the inserts in module 1 (Fig. 1C), containing targets of different contrasts. The TTF reflects the CT system’s response to certain task details, such as edge sharpness, line pair resolution, etc. Considering the imaging task under study was focused on pediatric CT protocol, the Teflon (2 o’clock) and polystyrene (10 o’clock) inserts were chosen. Polystyrene represents low-contrast objects like nodules and mediastinal fat, whereas Teflon represents high-contrast lesions such as bone. TTF50% values, associated with 50% of the in-plane TTF, were reported. The TTF was evaluated using the “circular-edge” method as described by Richard et al. Specifically, a small ROI containing the circular rod was extracted from 8 consecutive slices [14–30].
Detectability index
Detectability Index (d’) is an important parameter for assessing image quality and discernibility, used to measure the ability to discern a target of specific size and contrast in the noise background. The calculation of this parameter involves the combined signal strength, noise power spectrum, and task-based transfer function. In practical applications, d’ can help optimize CT scanning and image reconstruction parameters, thus improving image quality and diagnostic rate.
We simulated lesions (5 mm diameter acrylic part in phantom |ΔHU|≈95 HU) with a Gaussian profile. d’ was calculated using the following formula [31–33]:
Subsequently, we plotted the CTDIvol with d’ values as the independent variable and fitted them to the equation CTDIvol = a×d’+b for all DLIR reconstruction algorithms at all the energy levels investigated. Using the d’ values of ASIR-V50% of these energy levels at 10 mGy as baselines, we could interpolate or extrapolate the dose level (DL) required for achieving the similar d’ value with DLIR-L, DLIR-M, DLIR-H algorithms from the corresponding fits. Finally, we calculated the potential dose reduction of the DLIR algorithms in comparison with ASIR-V50%. Dose reduction was calculated using the following formula [14]:
Results
Noise power spectrum
Table 2 reports noise characteristics, including NPS area and image noise, of different reconstruction algorithms for DEsCT images at four dose levels. The average frequencies of NPS for different reconstruction algorithms are summarized in the Supplementary Table 1. Figure 2 shows the NPS curves for all energy spectral images at 10 mGy. The trends of the curves under different radiation doses (3.5 mGy, 5 mGy, 7.5 mGy) were similar, as the radiation dose decreases, the area under the curve becomes larger, indicating higher noise levels.
Noise characteristics and NPS area of different reconstruction algorithm for spectral CT image in different dose levels
Noise characteristics and NPS area of different reconstruction algorithm for spectral CT image in different dose levels
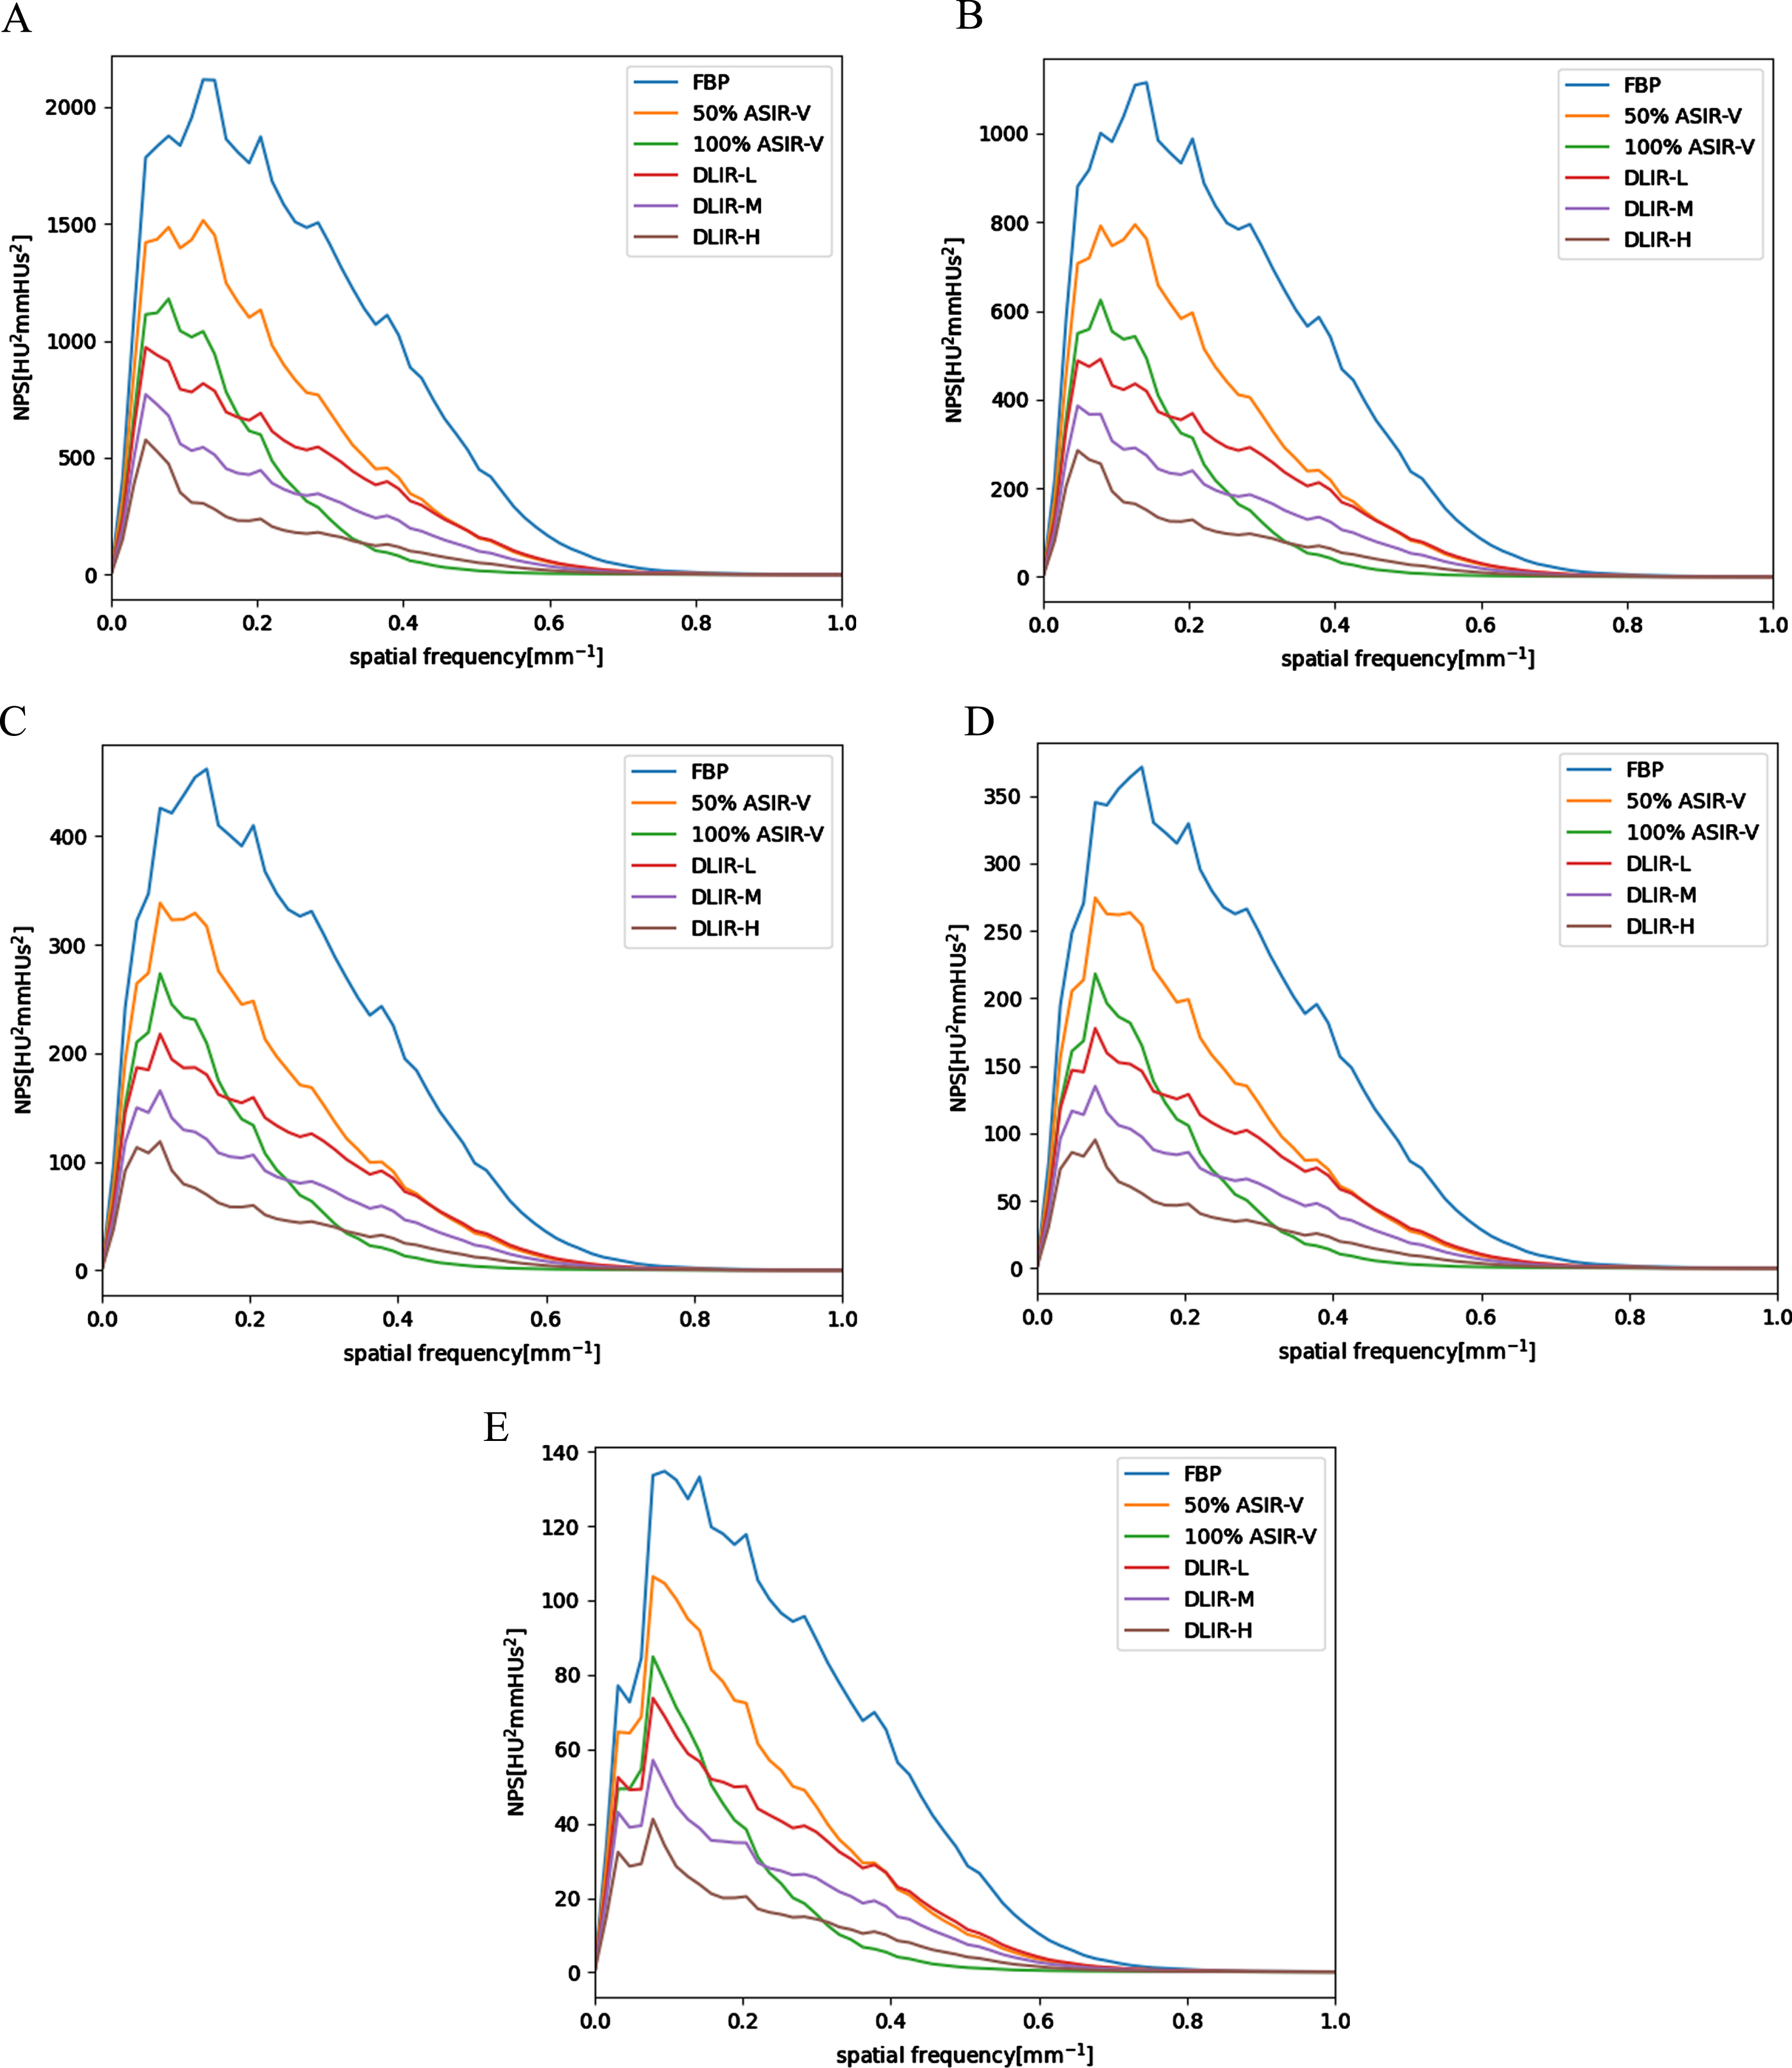
NPS curves obtained at 10 mGy in different energy spectral CT images. FBP: blue, ASIR-V50% : orange, ASIR-V100% : green, DLIR-M: purple, DLIR-L: red, DLIR-H: brown.
NPS area decreased as the energy level of the DEsCT virtual monochromatic image increased. NPS area were higher with the conventional ASIR-V50% than with all DLIR levels in all keV images. NPS areas and image noises with DLIR-H were the lowest (9–437 HU2 mm and 3.5–23.2 HU, respectively), which were lower than that of ASIR-V100% (15–778 HU2 mm and 3.9–28.4 HU, respectively). NPS average frequencies with DLIR-H (0.19–0.21 mm–1) were higher than ASIR-V100% (0.15–0.16 mm–1), and at the same level as ASIR-V50% (0.20–0.21 mm–1). The changes of the average frequency of NPS with the energy levels of DEsCT were nearly negligible. By applying the DLIR algorithm, it was possible to achieve comparable NPS area at lower dose and/or lower energy levels. For instance, the NPS area of a low energy 50 keV DLIR-H image at 3.5 mGy (237 HU2 mm) was comparable to that of a commonly used 120 kVp (74 keV) FBP image at 5 mGy.
Figure 3 shows changes in NPS area and image noise of different reconstruction algorithms as a function of energy level of the virtual monochromatic images. As the keV level decreases, the NPS area and noise values increased, and the curves dispersed. DLIR algorithms demonstrated much less noise increase than those of the FBP and ASIR-V images as the energy level decreases, as shown by the smaller ratios between the image noise of 40 keV images and 140 keV images in Fig. 3. This trend held true for all four dose levels. The ratio with DLIR-H were the lowest (3.15–3.43), which were lower than that of ASIR-V100% (3.85–3.94) and FBP (3.98–3.94).
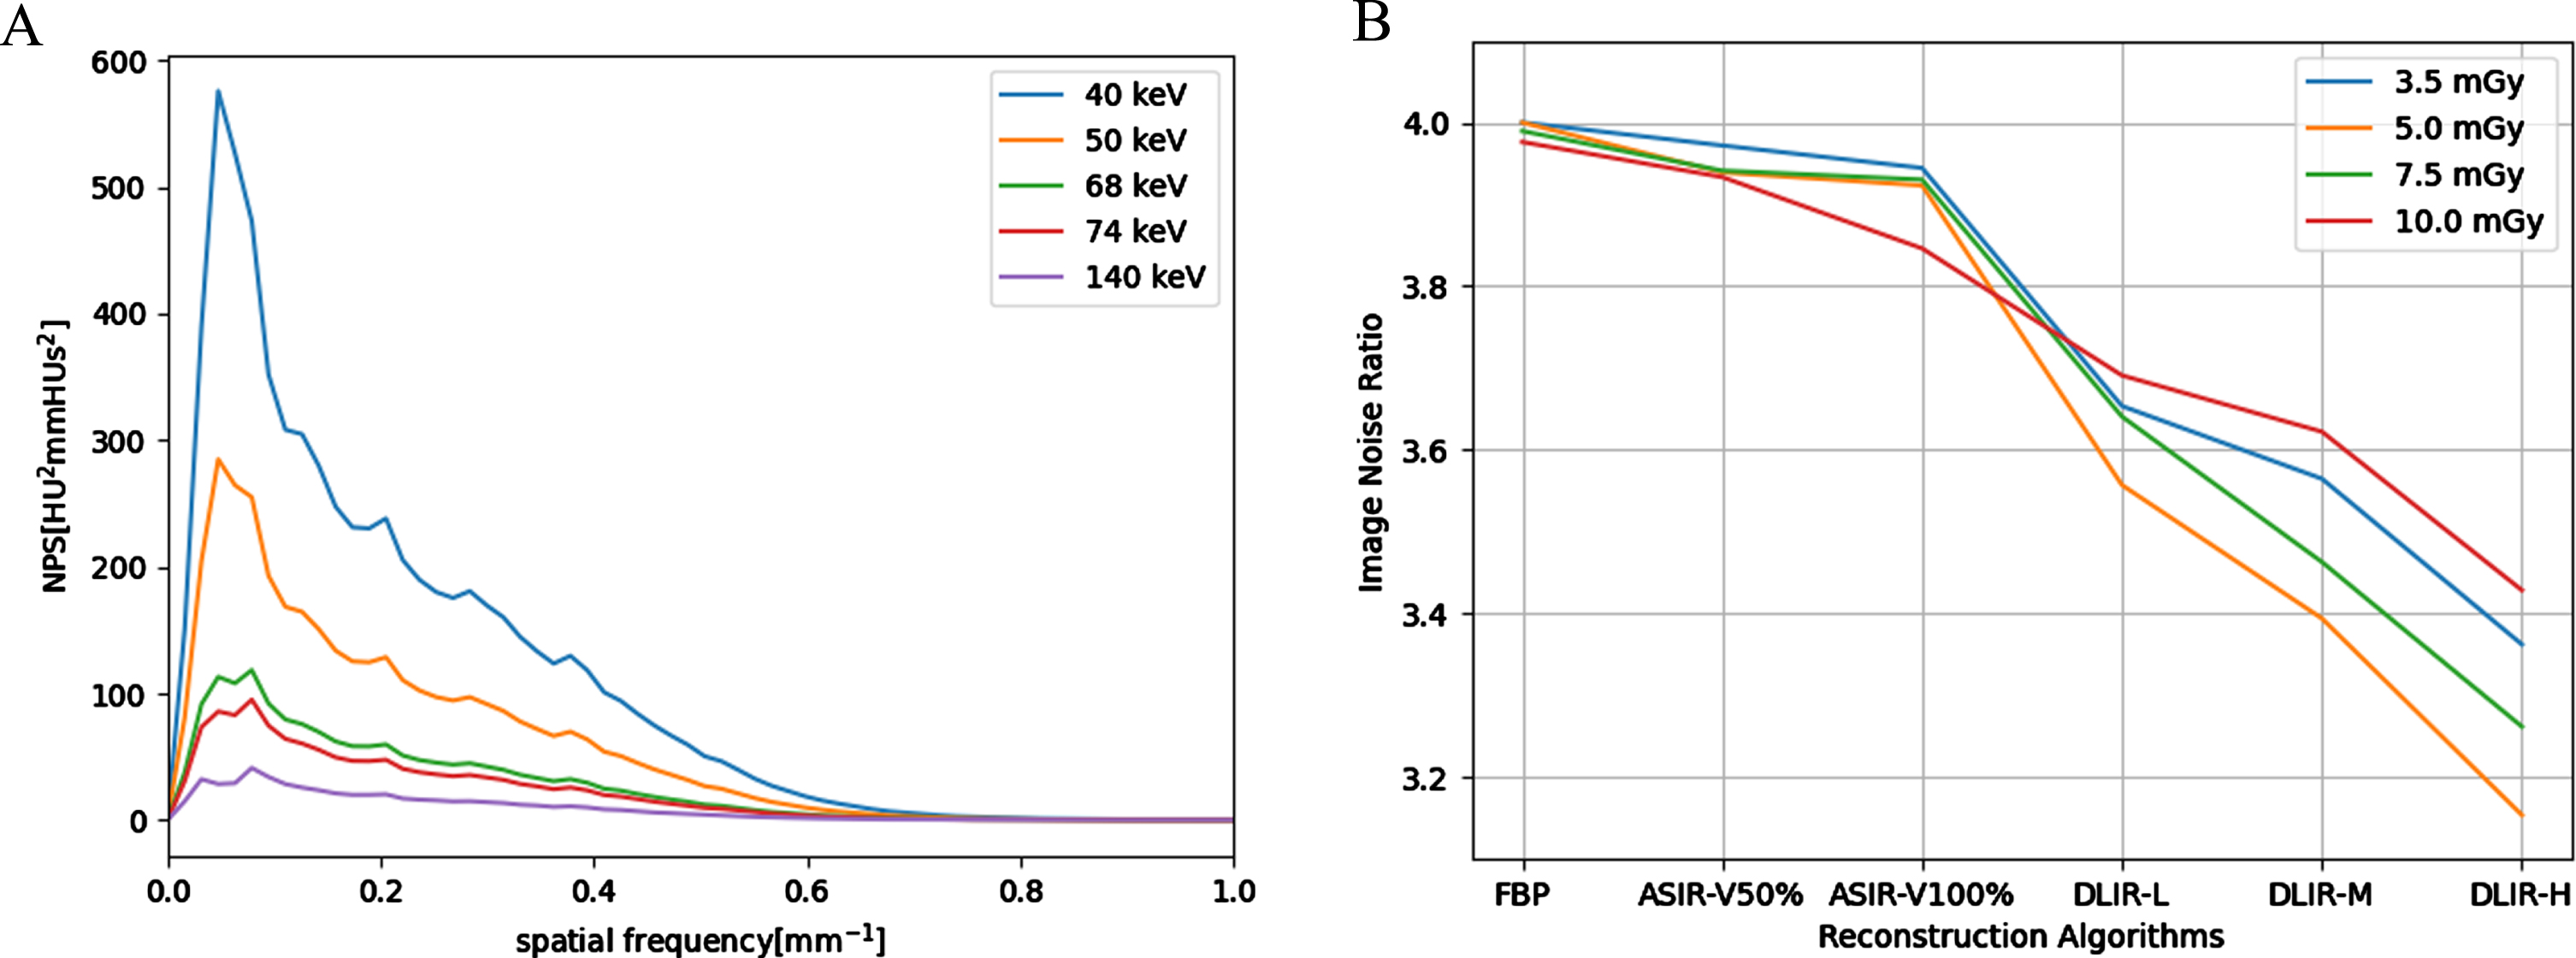
A. Image noise as function of energy level with different reconstruction algorithms acquired at 10 mGy; B. Image noise ratio between 40 keV and 140 keV images of different reconstruction algorithms at the four dose levels.
Table 3 reports the TTF50% values for the Teflon and polystyrene inserts. Figure 4A-4E depicts the TTF curves at 10 mGy. The trends of the curves under different radiation doses (3.5 mGy, 5 mGy, 7.5 mGy) were similar.
Values of TTF50% obtained for Teflon and polystyrene inserts different reconstruction algorithm for spectral CT image in different dose levels
Values of TTF50% obtained for Teflon and polystyrene inserts different reconstruction algorithm for spectral CT image in different dose levels
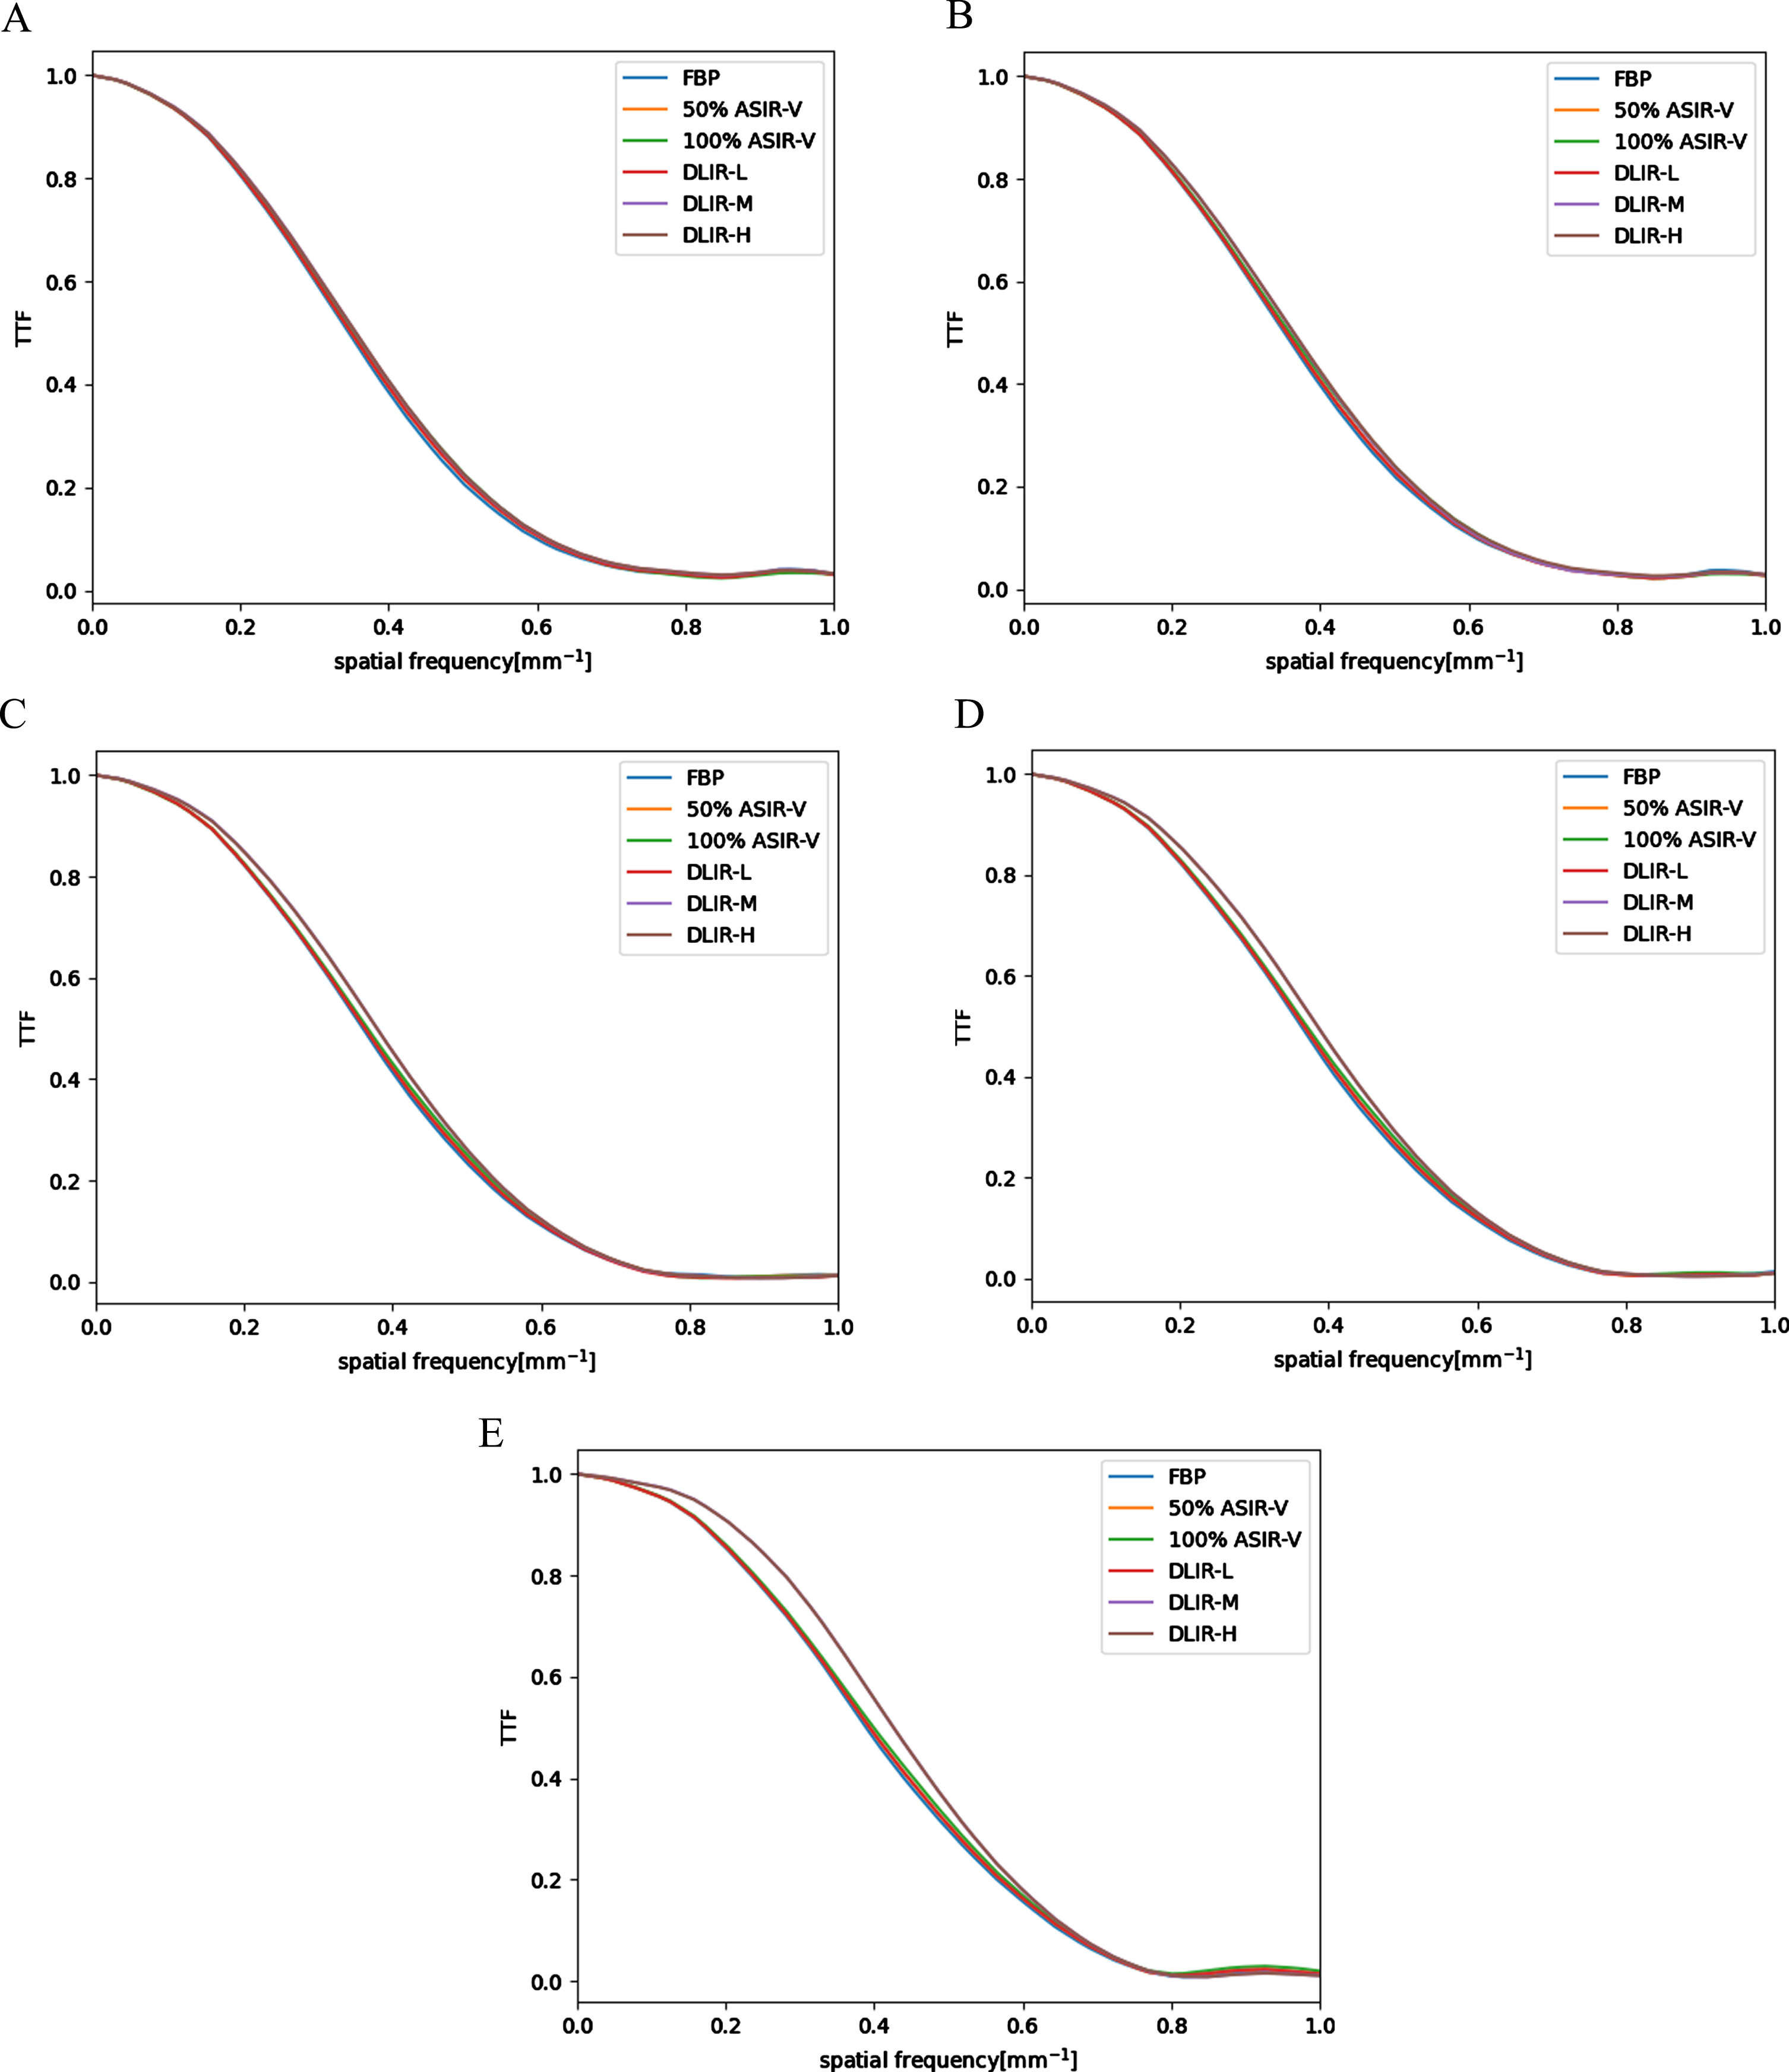
4A-4E, TTF curves for the Teflon (955HU) insert of various reconstructions at different energy levels at 10 mGy dose level (4A: 40 keV; 4B: 50 keV; 4C: 68 keV; 4D: 74 keV; 4E: 140 keV). 4F, TTF curves for Teflon of DLIR-H images at different energy levels obtained at 10 mGy dose level.
For the Teflon insert, TTF50% values of the spectral images were higher with DLIR-H (0.35–0.44 mm–1) than with ASIR-V100% (0.35–0.41 mm–1), ASIR-V50% (0.35–0.40 mm–1), and FBP (0.34–0.40 mm–1). TTF50% values with DLIR-H were higher than DLIR-M and DLIR-L. Similar TTF50% values were found between DLIR-L and ASIR-V100%.
For the polystyrene insert simulating adipose tissue, the DLIR also performed well, with the worst outcome being obtained with ASIR-V100% due to excessive image smoothing. TTF50% values were higher with DLIR-H (0.35–0.41 mm–1) than with ASIR-V100% (0.30–0.36 mm–1) and ASIR-V50% (0.32–0.38 mm–1). TTF50% values with DLIR-L (0.36–0.44 mm–1) and DLIR-M (0.36–0.44 mm–1) were slightly better compared to DLIR-H (0.35–0.41 mm–1). At lower radiation levels, similar TTF50% values were found among FBP, DLIR-L and DLIR-M. However, TTF50% values with DLIR-L (0.36–0.40 mm–1) and DLIR-M (0.36–0.40 mm–1) were higher than FBP (0.35–0.36 mm–1) at 10 mGy. Among the DLIR reconstructions, DLIR-L exhibited the least spatial resolution loss and provided better results compared to DLIR-H. Under high radiation dose conditions, these differences were nearly eliminated.
Figure 4F shows the TTF values for Teflon in DLIR-H reconstruction as a function of different keV values. As the keV increases, the TTF values increased. TTF50% values were highest at 140 keV at all dose levels.
Table 4 depicts the d’ values for acrylic insert in phantom determined by the detectability index tool of the imQuest software using different keV images at different dose levels obtained with FBP, ASIR-V and DLIR. The detectability indices (d’) were higher with DLIR than with ASIR-V100%, ASIR-V50% and FBP at every keV and dose levels. The d’ values for acrylic, polystyrene and Teflon inserts are summarized in Supplementary Table 2 and their dependences with photon energy (keV) are plotted in Fig. 5 for the results at the 3.5 mGy dose level. As demonstrated in the supplementary Table 2 and Fig. 5, for all inserts, DLIR provided higher d’ than the ASIR-V and FBP algorithms at every keV and dose levels. However, as the keV energy increases, d’ values for acrylic and polystyrene generally increased, while for Teflon, d’ stayed relatively flat at low keV levels and decreased slightly after 74 keV energy level.
Detectability index (d’) for acrylic insert of different reconstruction algorithms at different keV and dose levels
Detectability index (d’) for acrylic insert of different reconstruction algorithms at different keV and dose levels
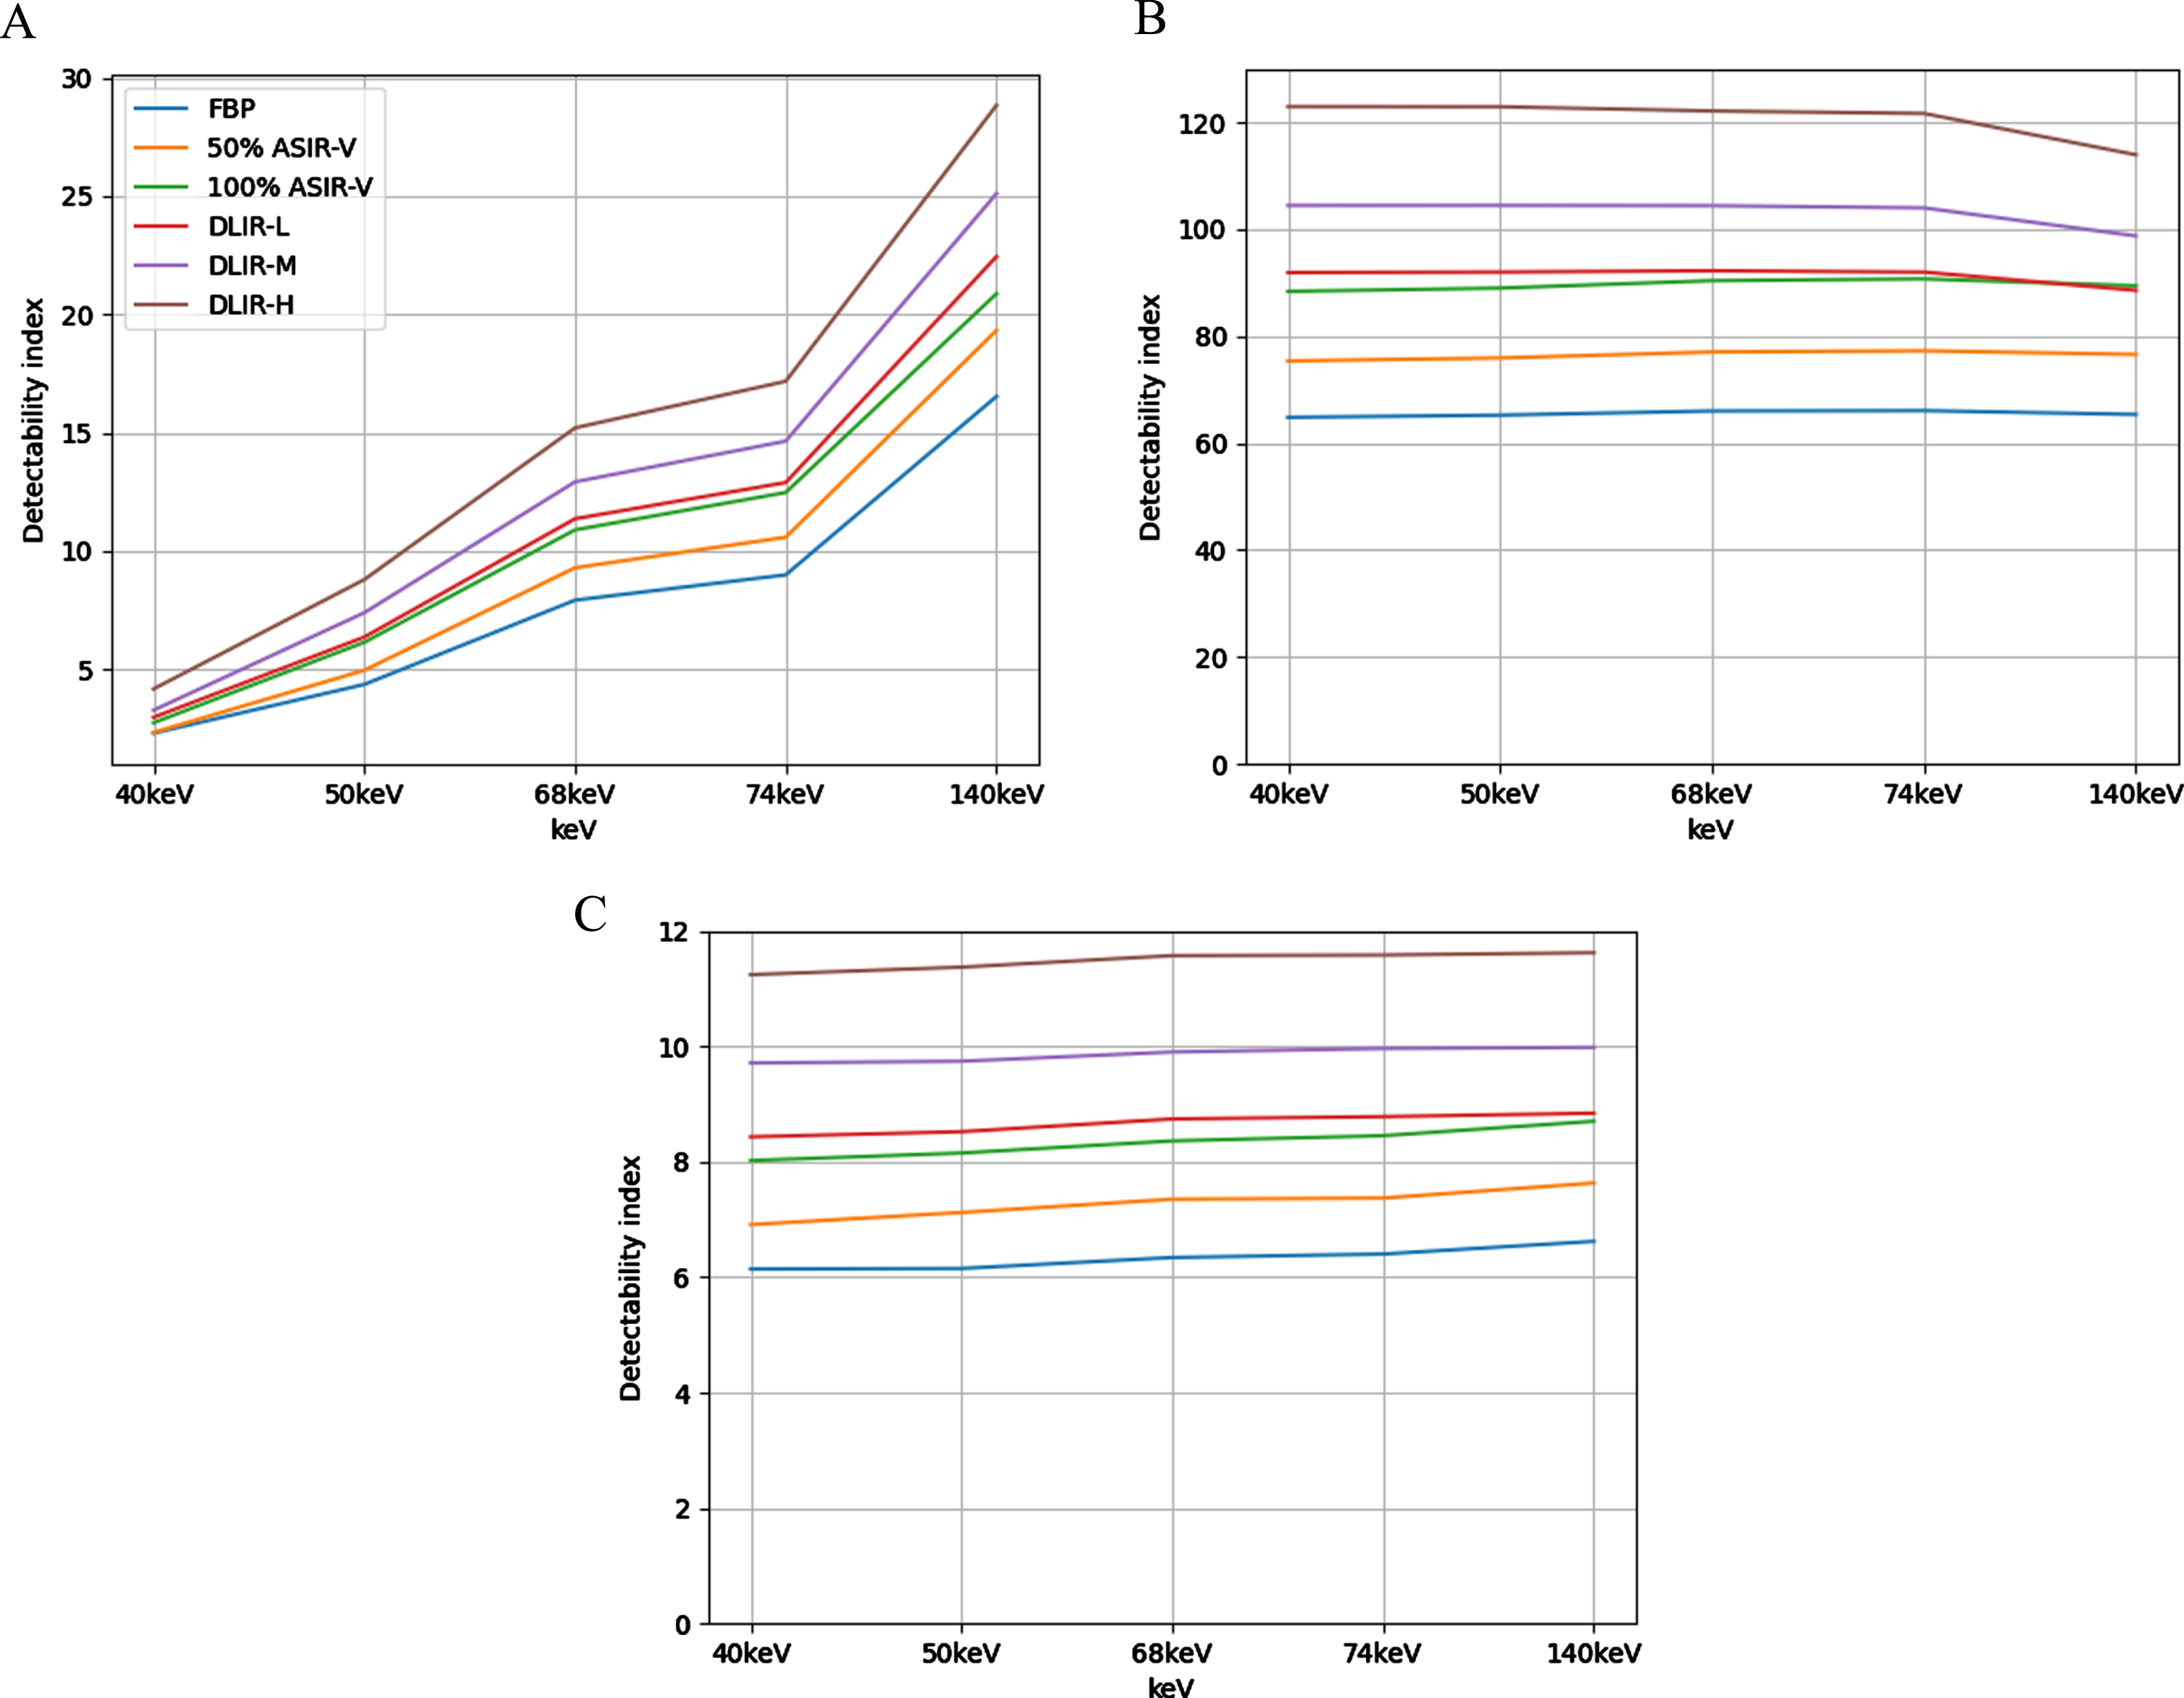
d’ as function of keV level at 3.5 mGy with different reconstruction algorithms (5A: acrylic insert; 5B: Teflon insert; 5C: polystyrene insert). FBP: blue, ASIR-V50% : orange, ASIR-V100% : green, DLIR-M: purple, DLIR-L: red, DLIR-H: brown.
For acrylic insert, to evaluate the potential dose reduction using DLIR, we estimated the CTDIvol required using DLIR algorithms to achieve the same d’ value of ASIR-V50% images at the same keV level using radiation dose of 10 mGy. For example, for the 40 keV images, the d’ value of ASIR-V50% images at 10 mGy was 2.97, the same d’ value could be achieved using DLIR-L images at 3.5 mGy dose level, with a potential dose reduction of 65.0%. For the DLIR-M and DLIR-H images, we had to extrapolate to lower dose levels of 3.18 mGy and 2.49 mGy, respectively since at 3.5 mGy the d’ values of DLIR-M and DLIR-H were already higher than 2.97. This resulted in a potential dose reduction of 68.2%, 75.1% with DLIR-M 40 keV images and DLIR-H 40 keV images, respectively. Table 5 reports the percentages of potential dose reduction with DLIR compared to ASIR-V50% for DEsCT images at different energy levels. It is apparent that the potential dose savings depend on the energy levels of DEsCT images.
Potential dose reduction with DLIR for achieving similar d’ in comparison with the commonly used ASIR-50% virtual monochromatic images of various energy levels for acrylic insert
In this study, we utilized phantom models at various radiation dose levels and objective parameter evaluation methods to conduct a comparative analysis of the effects of deep learning image reconstruction on dual-energy spectral CT imaging with the traditional FBP and the state-of-the-art ASIR-V algorithms. Our results indicated that DLIR-M and DLIR-H further reduced image noise compared to ASIR-V50% algorithm and all DLIR algorithms provided better noise containment for low keV images in DEsCT, extending their clinical usage, and higher TTF50% for the polystyrene insert over ASIR-V50% and ASIR-V100%. DLIR-H had the lowest image noise and highest detectability at all the respective radiation dose level and keV level. DEsCT 50 keV images with DLIR-M and DLIR-H showed potential for 65% dose reduction over the state-of-the-art ASIR-V50% with higher detectability index values for acrylic insert.
Previous research has demonstrated that ASIR-V can significantly enhance the quality of dual-energy spectral CT images and further broaden their clinical applications compared to the traditional FBP reconstruction algorithm [34]. Studies have also shown that DLIR provides significant benefits in further reducing the dose of traditional single tube voltage CT scans over traditional FBP algorithm [35]. Recently, research has also indicated that DLIR provides high degree of accuracy in quantitative measurements of CT values [22] and clinical usefulness in improving image quality and lesion conspicuity and detectability [18–20]. Since one of the distinct advantages of DEsCT over single kVp CT imaging is the creation of a set of virtual monochromatic images including low energy (keV) images to significantly improve image contrast resolution, our research extended the scope to evaluate the performance of DLIR as function of the virtual monochromatic image energy levels and at different radiation dose levels including low signal conditions. We used the objective indicators and evaluation method proposed by the American Association of Physicists in Medicine task group report-233 (AAPM TG-233) as the basis for comparison in our research and estimated the potential radiation dose reduction capabilities of DLIR in DEsCT using the clinically more relevant parameter of lesion detection index.
The NPS is a metric that describes the noise characteristics of CT images. At a radiation dose of 3.5 mGy, the absolute NPS area for the ASIR-V50% image at 40 keV was 1346, an increase of 1262 from 140 keV (84), with a percentage increase of 1502.4%. For the DLIR-H image at 40 keV, the absolute NPS area was 437, a rise of 401 from 140 keV (36), marking an increase of 1083.8%. By using DLIR-H the noise ratio between 40 keV and 140 keV decreased from 4.00 to 3.36. The phenomenon was the same at all dose levels. The noise increases from the 140 keV images to 40 keV images with ASIR-V50% and ASIR-V100% were in the ranges of 3.85 to 4.00 and were reduced to 3.15–3.69 with DLIR over all dose levels. It indicated that DLIR algorithm could better curb the image noise increases in the 40 keV images and enable a wider range of applications for the 40 keV images. With the application of the DLIR algorithm, the NPS area values for the 40 keV DLIR-H images were similar or less than that of the 74 keV FBP images at the same radiation dose level, while the average frequencies (favg) remained unchanged. This suggested that DLIR-H could enhance image contrast while further reducing image noise and at the same time not significantly altering image texture. The contrast increase in the low keV images could be used to potentially increase lesion detection rates or reduce contrast agent doses. Under various radiation dose conditions, DLIR-H consistently demonstrated similar noise reduction performance, making it applicable at any radiation level.
While ASIR-V100% also achieved noise reduction compared to DLIR-H, its performance was not as optimal as DLIR-H. Previous clinical studies in single kVp CT imaging typically suggested that ASIR-V100% performed similarly or even better than DLIR-H in terms of noise reduction. However, our research results indicated that in DEsCT, especially at the lowest supported 40 keV energy level, DLIR-H exhibited further image noise reduction. In addition, the NPS curve indicated a rapid decline in the high-frequency domain for ASIR-V100%, suggesting an over-smoothing of the images. In contrast, DLIR maintained higher values in the high-frequency domain, indicating its effectiveness in preserving high-frequency image edges and details. Our results were consistent with previous studies [15]. This ability of maintaining higher NPS values in the high-frequency domain was true across different keV values. We have introduced a new evaluation method, which involves comparing the image noise ratio between 40 keV and 140 keV images at four dose levels using different reconstruction algorithms. By using this method, we demonstrated that the DLIR algorithm significantly enhanced noise handling at lower energy levels such as the 40 keV energy level than other reconstruction algorithms which better enables DECT in contrast-enhanced imaging applications.
The TTF serves as an indicator for evaluating the spatial resolution of CT images, reflecting the responsiveness of the CT imaging system to specific tasks. For the bone-tissue contrast, the resolution of DLIR-H was the most superior, followed by DLIR-M. The resolution of DLIR-L was comparable to, if not exceeding, that of ASIR-V100%. When focusing on the fatty tissue, DLIR successfully enhanced the spatial resolution of the spectral images over ASIR-V algorithms at every keV levels. After processing with DLIR, the spatial resolutions of DLIR-L and DLIR-M stood out as the most pronounced, while DLIR-H was slightly behind. However, all of them surpassed both ASIR-V50% and ASIR-V100%. Notably, ASIR-V100% exhibited the weakest performance in handling soft tissue with fatty density. FBP also demonstrated a commendable performance in fatty tissue resolution as DLIR. At lower radiation doses, the spatial resolutions of DLIR-L and DLIR-M were on comparable with FBP. Y et at., a higher radiation dose of 10 mGy, DLIR-L and DLIR-M proved to be superior. For all materials, DLIR improved TTF more effectively than ASIR. This improvement was most noticeable in polystyrene material, which represents soft tissue, suggesting that DLIR could better enhance the resolution of soft tissues, which has clinical importance.
The detectability index (d’) provides a quantifiable measure of the ability to detect specific objects against a noisy backdrop. Our results indicated that reconstruction algorithms could be used to enhance the d’ value. For the acrylic insert, at 74 keV and 10 mGy dose level, the d’ for FBP images was 15.61. By employing ASIR-V50%, one could achieve a similar d’ value with at least 25% reduction in radiation dose (17.14 at 7.5 mGy). With DLIR-H, similar d’ (14.64) could be obtained at 3.5 mGy, leading to an anticipated reduction of up to 65% in radiation dose. In the low keV range (40–50 keV), DLIR-H offered more superior d’ values compared to other reconstruction algorithms, ensuring detection efficiency. At both 40 keV and 50 keV, 3.5 mGy DLIR-H images were superior to the 10 mGy ASIR-V50% images of the same keV, facilitating a significant reduction in radiation dosage. As indicated by the study of Greffier et al. [34] and shown in our study, objects of different densities exhibited different dependency of d’ on energy levels. In general, for low density objects (acrylic, polystyrene, and liver metastasis), lowering the keV reduced d’, compromising detectability. While for high density objects (Teflon and hepatocellular carcinoma), d’ maintained high values at low energy levels and decreased slightly at high energy levels due to the preferential higher attenuation of high atomic number objects towards low energy photons. This phenomenon may provide us with guidance on how to optimize the use of monochromatic images of different energy levels in dual-energy CT to maximize the detection of certain types of lesions. On the other hand, our experimental results also showed the robustness of DLIR algorithms in lesion detection, especially when multiple lesions of different characteristics existed. Our results revealed that for the low-density object of acrylic, the 50 keV DLIR-H images at 3.5 mGy were equivalent to the 68 keV FBP images at 5 mGy in achieving the same d’. This is tantamount to a 30% radiation dose reduction while simultaneously achieving higher contrast resolution should there are contrast-enhanced high-density lesions during the same imaging task. The ability of using low keV images in DECT leaves a room for further iodine contrast agent dose reduction. The application of DLIR-H in DEsCT may either allow us to significantly improve diagnostic confidence and accuracy, or significantly reduce both radiation and contrast doses for similar diagnostic tasks in future clinical settings.
This study has certain limitations. Firstly, it was conducted only on the Revolution CT scanner manufactured by GE HealthCare. Our findings may not be generalized to other scanners or reconstruction algorithms. Additionally, A specific GSI preset and standard reconstruction kernel were used for image generation. The keV range was chosen based on actual clinical needs in our hospital and relevant literature. The detailed quality of various keV images needs to be further refined in subsequent studies. We only simulated three types of lesions of fixed sizes, not including different iodine contrast concentrations, which are crucial for evaluating image quality for CTA. Finally, while the X-ray absorption characteristics of the phantom’s various materials closely resemble those of actual patients, the phantom is composed of relatively uniform materials and cannot fully represent human anatomy.
Conclusion
Compared to the state-of-art ASIR-V50% algorithm, deep learning reconstruction algorithm improves the image quality of dual-energy spectral CT images, especially the low-energy (40 keV and 50 keV) images with better image noise containment (noise ratio of 40 keV/140 keV) and higher TTF(50%) for the low density objects. The DEsCT 50 keV images with DLIR-M and DLIR-H show potential for 65% dose reduction over ASIR-V50% with higher detectability index. DLIR-H provides the lowest image noise and highest detectability in all dose levels and energy levels and may provide the opportunity for both radiation dose and contrast medium dose reduction in clinical applications.
Footnotes
Acknowledgments
We thank Zhuoheng Liu and Wenhuan Li for their help to better understanding dual energy CT techniques.
Funding
Sponsored by Natural Science Foundation of Xinjiang Uygur Autonomous Region. code: 2022D01A306 (receiver: Jihang Sun). Beijing Municipal Administration of Hospitals Incubating Program. code: PX2022050 (receiver: Jihang Sun).