
Abstract
Background
Ligaments and tendons are difficult to differentiate on conventional magnetic resonance imaging (MRI). Ligaments and tendons are different histologically, and tendon graft ligamentization is known to occur after anterior cruciate ligament (ACL) reconstruction.
Purpose
To quantify and differentiate the ultrashort echo time T2* (UTE-T2*) values of normal knee ligaments and tendons using a 1.5-T MRI scanner.
Material and Methods
The right knees of 12 healthy volunteers (6 men, 6 women; mean age = 30.8 ± 9.6 years) were scanned using a UTE-T2* sequence and the UTE-T2* values of the proximal, middle, and distal portions of the ACL, posterior cruciate ligament (PCL), and patellar tendon (PT) were evaluated. Two doctors manually drew the regions of interest four times and intra- and inter-observer reliability were evaluated by intraclass correlation coefficients.
Results
The UTE-T2* values of ACL at the proximal, middle, distal, and mean were 12.0 ± 2.3, 11.3 ± 2.3, 12.3 ± 2.6, and 11.9 ± 2.4 ms, respectively. The UTE-T2* values of the PCL at each site were 6.9 ± 1.5, 9.0 ± 1.8, 8.8 ± 2.4, and 8.3 ± 2.1 ms, respectively. The UTE-T2* values of the PT at each site were 7.1 ± 1.7, 4.3 ± 1.7, 4.3 ± 1.8, and 5.2 ± 2.1 ms, respectively. Both intra- and inter-observer reliability showed high agreement rates. There were significant differences among the ACL mean, PCL mean, and PT mean, with a P value <0.01 in all cases.
Conclusion
This study confirms that UTE-T2* mapping can quantify the ACL, PCL, and PT, and tendons and ligaments can be differentiated using the UTE-T2* values in normal volunteer knee joints.
Introduction
Morphological evaluation of joints is mainly performed by magnetic resonance imaging (MRI). The joints contain many short T2 tissues such as ligaments, tendons, the meniscus, and the periosteum, which give a low signal with conventional MRI sequences. It is particularly difficult to distinguish tendons and ligaments from each other based on their low MRI signals. Tendons and ligaments are physically similar but have different roles. Tendons form links between muscle and bone, whereas ligaments form links between bones, serve to passively connect different parts of the skeleton, and stabilize the joint by preventing abnormal joint movements (1,2). Tendons and ligaments also differ histologically (3). Tendons are commonly used as grafts for reconstructive surgery in anterior cruciate ligament (ACL) ruptures, and tendon grafts are known to undergo a biological process called “ligamentization,” whereby they gradually lose tendon-specific features and start exhibiting more ligamentous-type histologic features (4).
New clinical techniques for detecting short T2 components in the knee joint have been developed, including ultrashort echo time (UTE) pulse sequences (5–7) that use a short radiofrequency pulse and acquire data as quickly as possible after excitation (8). This approach allows the detection of signal changes in the short T2 tissues that could not otherwise be detected by conventional MRI. Furthermore, by acquiring multiple echoes, these techniques can be used to calculate the UTE-T2* relaxation times of tendons and ligaments (9–11), which can provide a quantitative evaluation of even short T2 tissues. Although differences in the patellar tendon (PT), ACL, and posterior cruciate ligament (PCL) are difficult to identify with conventional MRI, the UTE-T2* sequence can recognize differences in ligaments and tendons. Therefore, the aim of the present study was to demonstrate the potential of three-dimensional (3D) UTE-T2* imaging for ligaments and tendons and to determine whether UTE-T2* values can be used to discriminate between tendons and ligaments in the knee joints of normal volunteers using a clinical 1.5-T MRI scanner.
Material and Methods
Twelve healthy volunteers (six men and six women; mean age = 30.8 ± 9.6 years) were enrolled to investigate the clinical feasibility of 3D multi-echo UTE-T2* imaging techniques using a clinical, whole-body 1.5-T scanner. All scans were conducted on the same MRI scanner at our hospital.
Written informed consent and approval from the hospital's institutional review board were obtained before the scans. The inclusion criteria for the volunteers were no history of knee joint pain and no metal implants or pacemakers.
All procedures performed in studies involving human participants were in accordance with the ethical standards of the institutional and/or national research committee and with the 1964 Helsinki declaration and its later amendments or comparable ethical standards.
MRI scan and image analysis
The imaging was performed on a clinical 1.5-T MRI scanner (Ingenia 1.5 T CX; Philips Healthcare, Best, The Netherlands), and an eight-channel receive knee coil was used on all volunteers. The UTE-T2*maps were calculated via the mono-exponential fitting of a series of T2*-weighted MR images, which were acquired using the 3D fast-field echo technique. The typical acquisition parameters were as follows: field of view = 160 mm; repetition time = 29 ms; echo time (TE) = 0.14, 4.74, 9.34, and 13.94 ms; flip angle = 25°; acquisition matrix = 272 × 272; slice thickness = 3 mm (slice gap: − 1.5 mm) with 45 slices obtained; bandwidth = 522 Hz; and total scan time = 9 min 31 s. The four sets of images were obtained from a single four-echo UTE acquisition.
Images were obtained from a picture archiving and communication system. The regions of interest (ROIs) were set at the proximal, middle, and distal portions on the ACL, PCL, and PT of the volunteers’ right knee joints, and the mean values were measured at each ligament and tendon. Using oblique sagittal images, the proximal, middle, and distal portions were selected by referring to T2-weighted images of the same slice with more distinct ligamentous structures. The diameter of the ROI was set at 5–10 mm2 and was as large as possible without including the surrounding adipose tissue. Quantitative assessments were performed by drawing ROIs on the UTE-T2* map (Fig. 1). The UTE-T2* values for the ROIs were recorded for analysis and evaluation by an orthopedic surgeon (Observer 1) and an orthopedic radiologist (Observer 2) (KT and MO). The T2* maps were directly calculated on a pixel-by-pixel basis using the scanner's mono-exponential fitting algorithm. The equation is expressed as follows (Figs. 2–5):

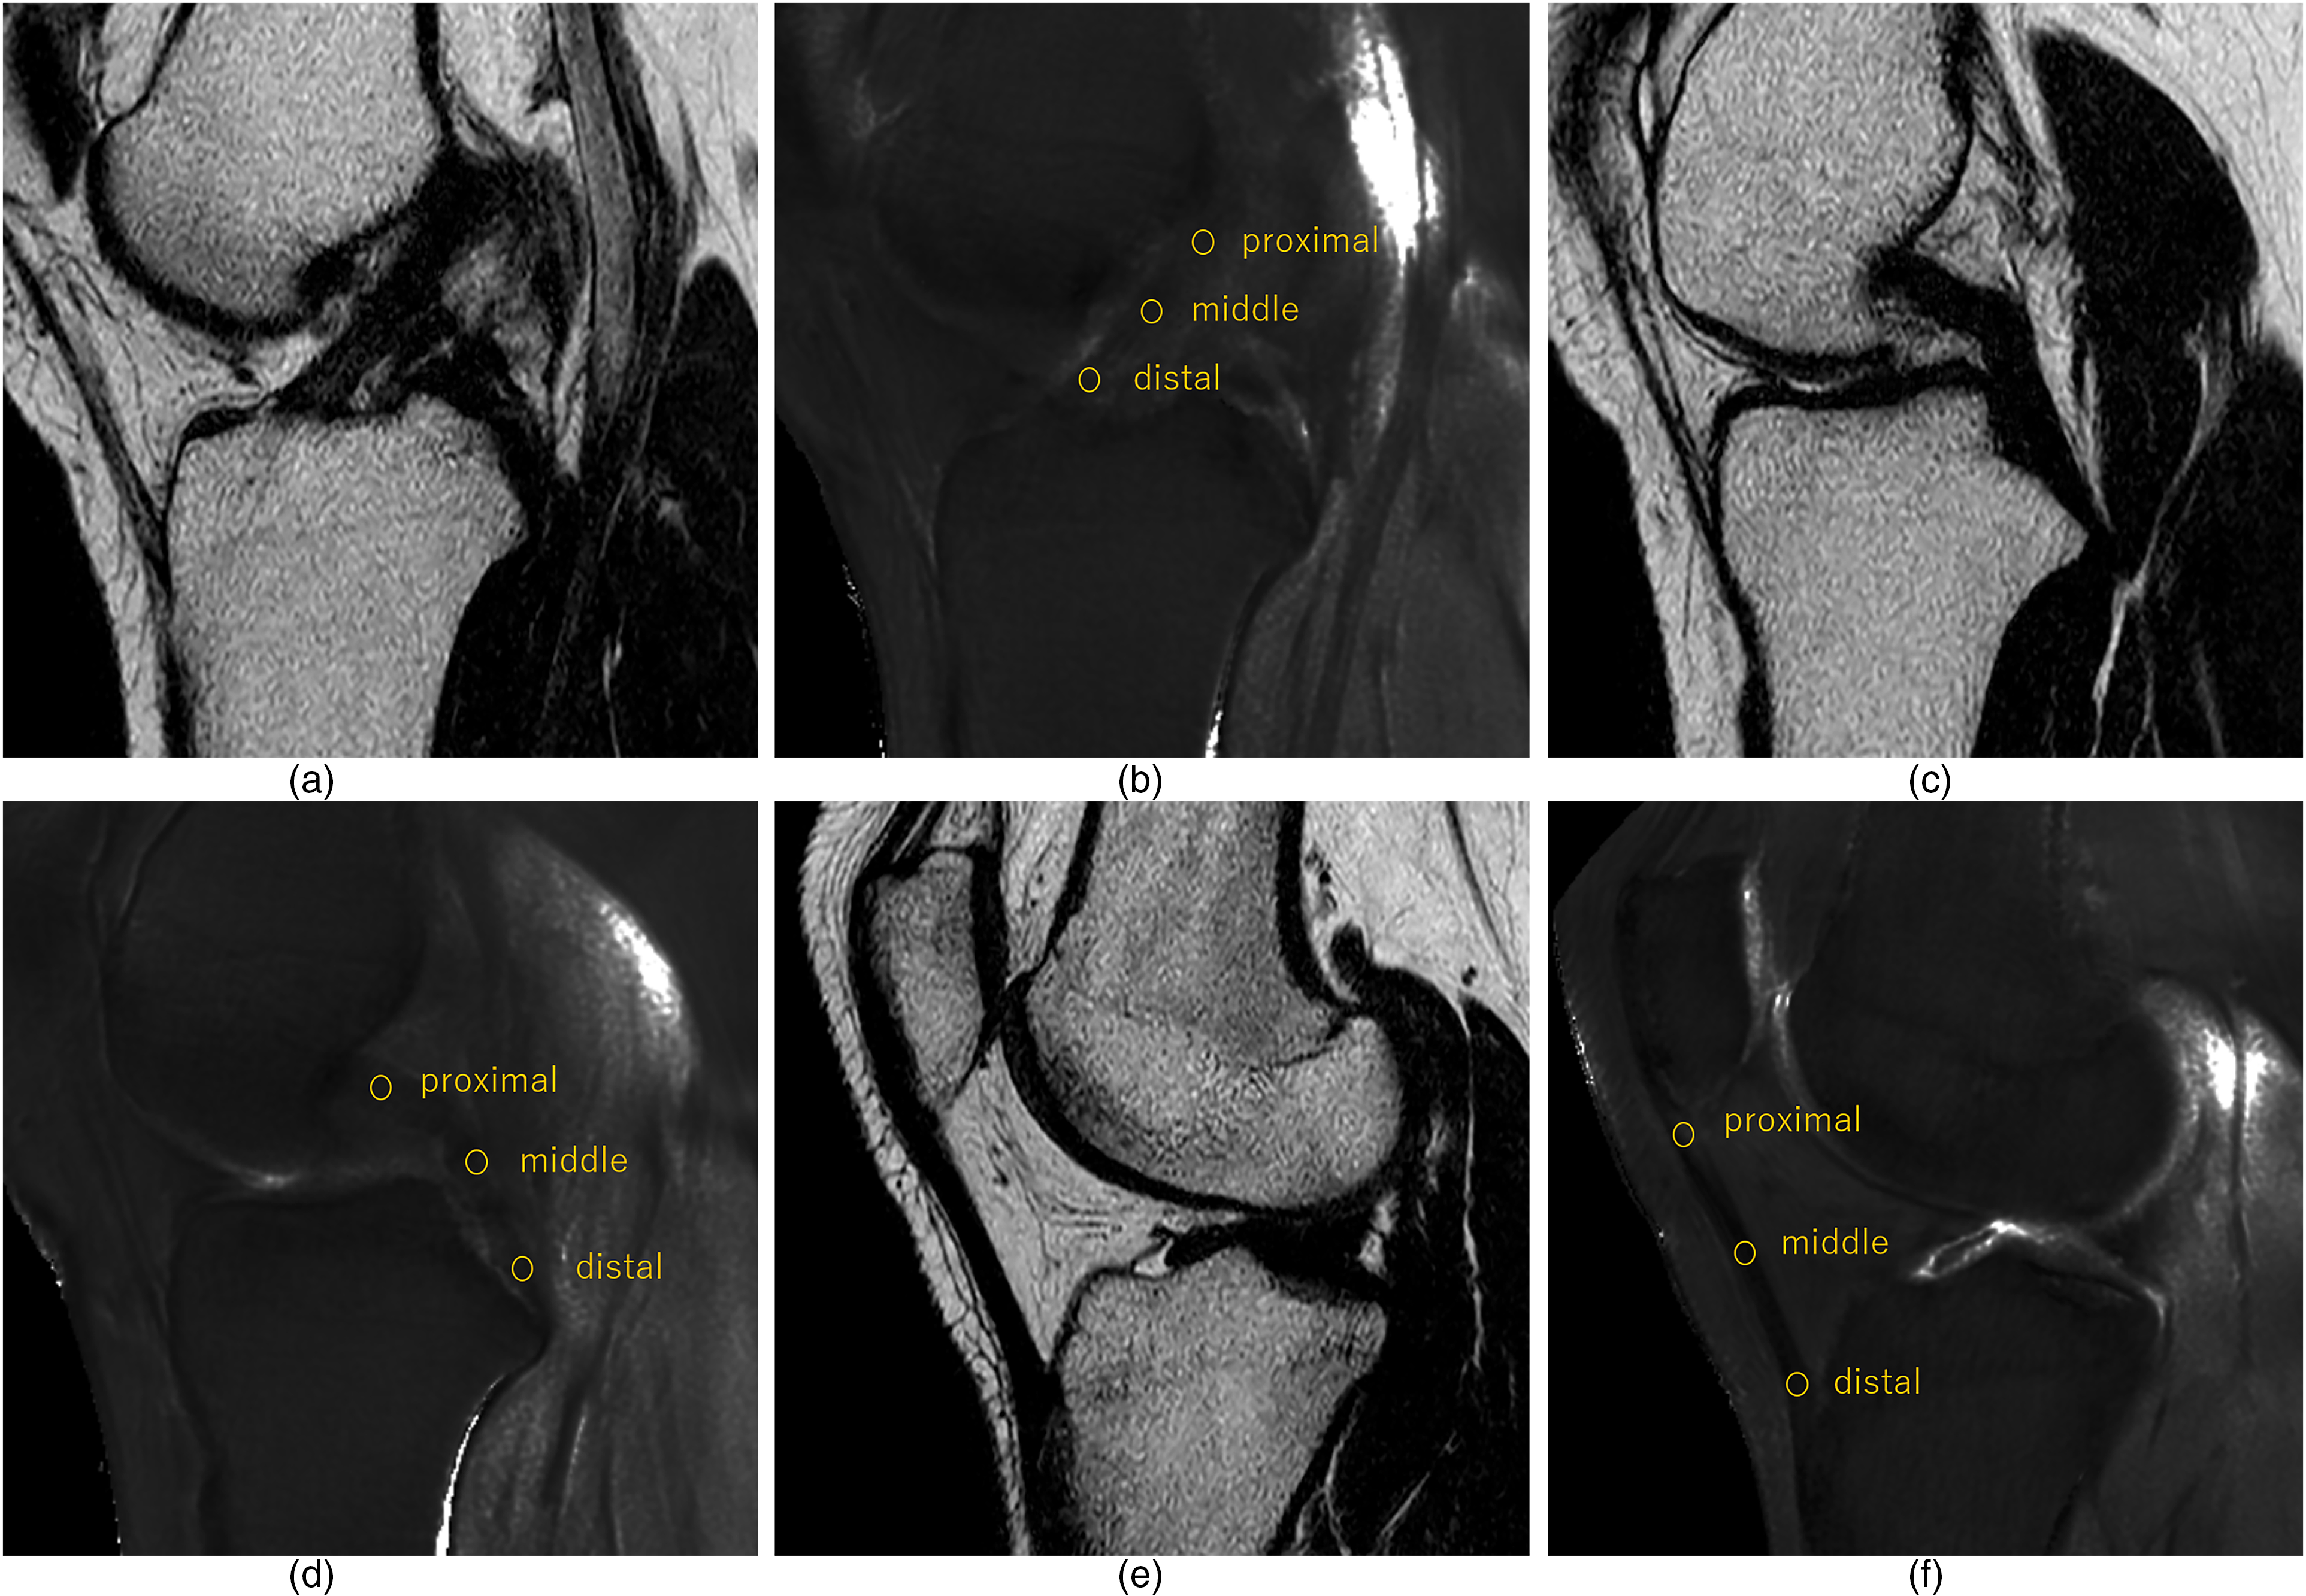
Knee joint of a healthy 34-year-old man. Oblique sagittal T2* maps acquired at TE 0.14/4.74/9.34/13.94 ms, with ROIs set at (a, b) three locations in the ACL, (c, d) three locations in the PCL, and (e, f) three locations in the PT with reference to the T2-weighted image. ACL, anterior cruciate ligament; PCL, posterior cruciate ligament; PT, patella tendon; ROI, region of interest; TE, echo time.
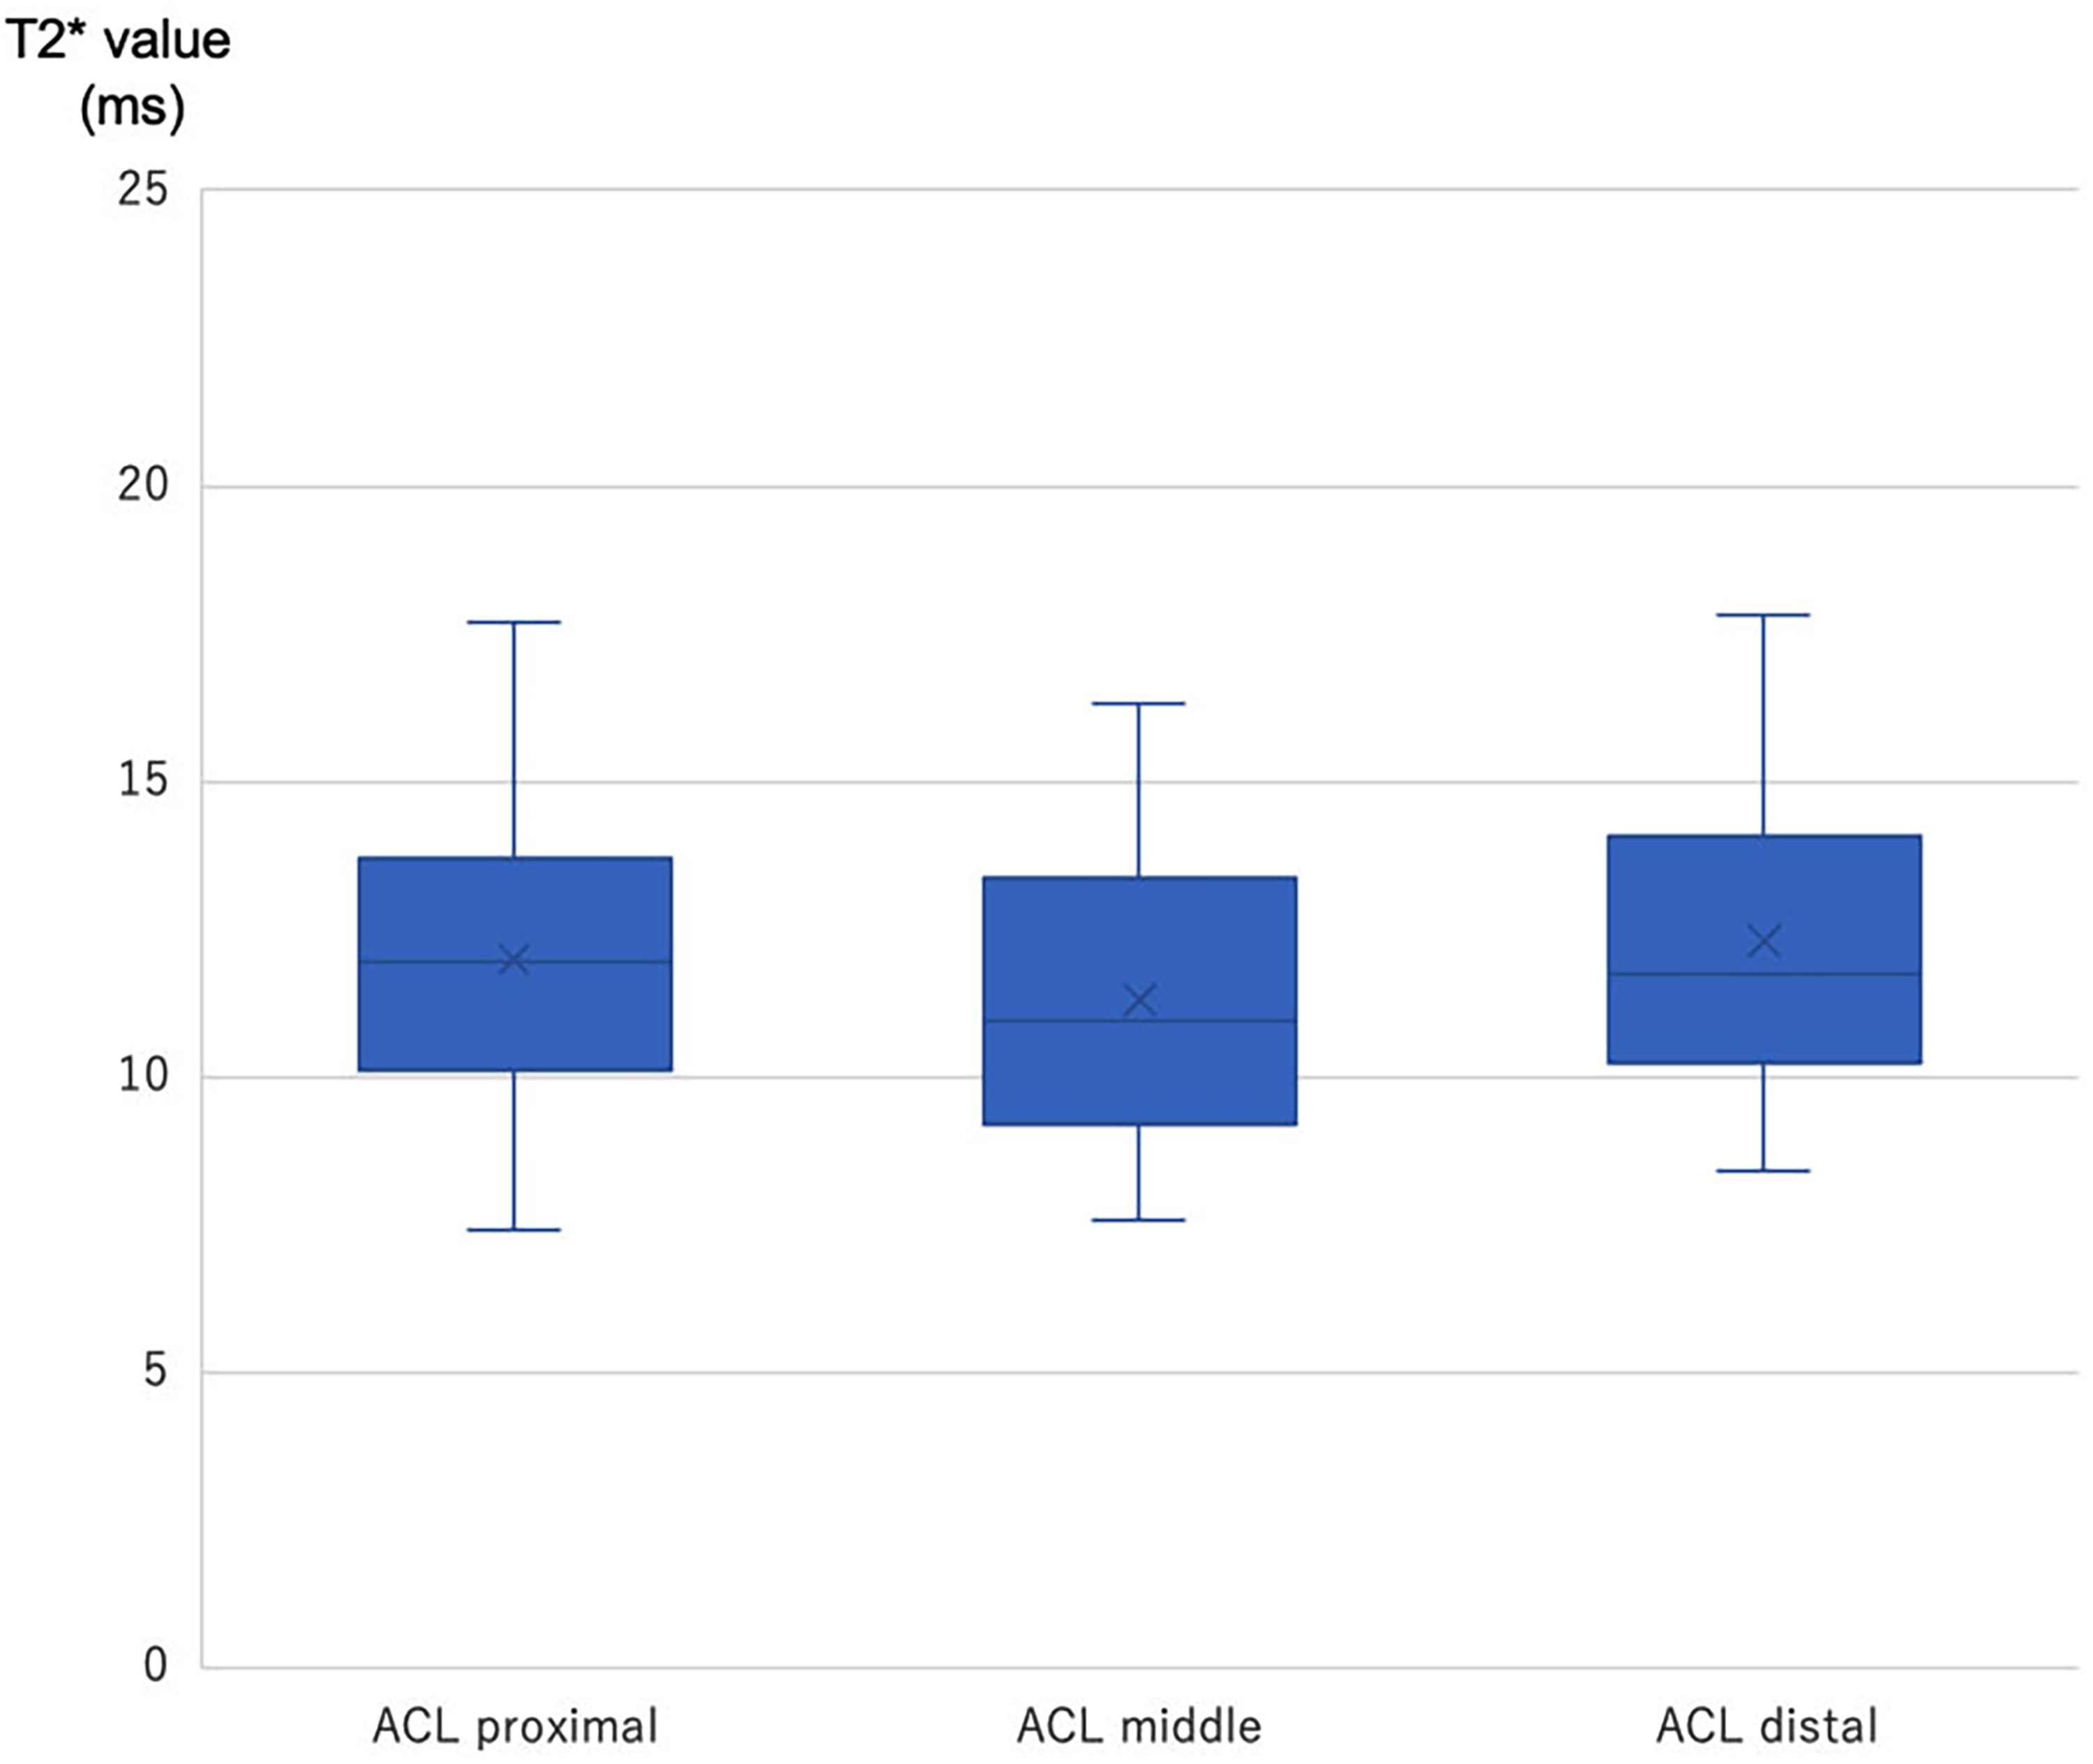
Box plot of T2* value in proximal, middle, and distal ACL. Top and bottom of boxes represent 25th and 75th percentiles of the T2* value. No statistical significance was found among all measurements. ACL, anterior cruciate ligament.
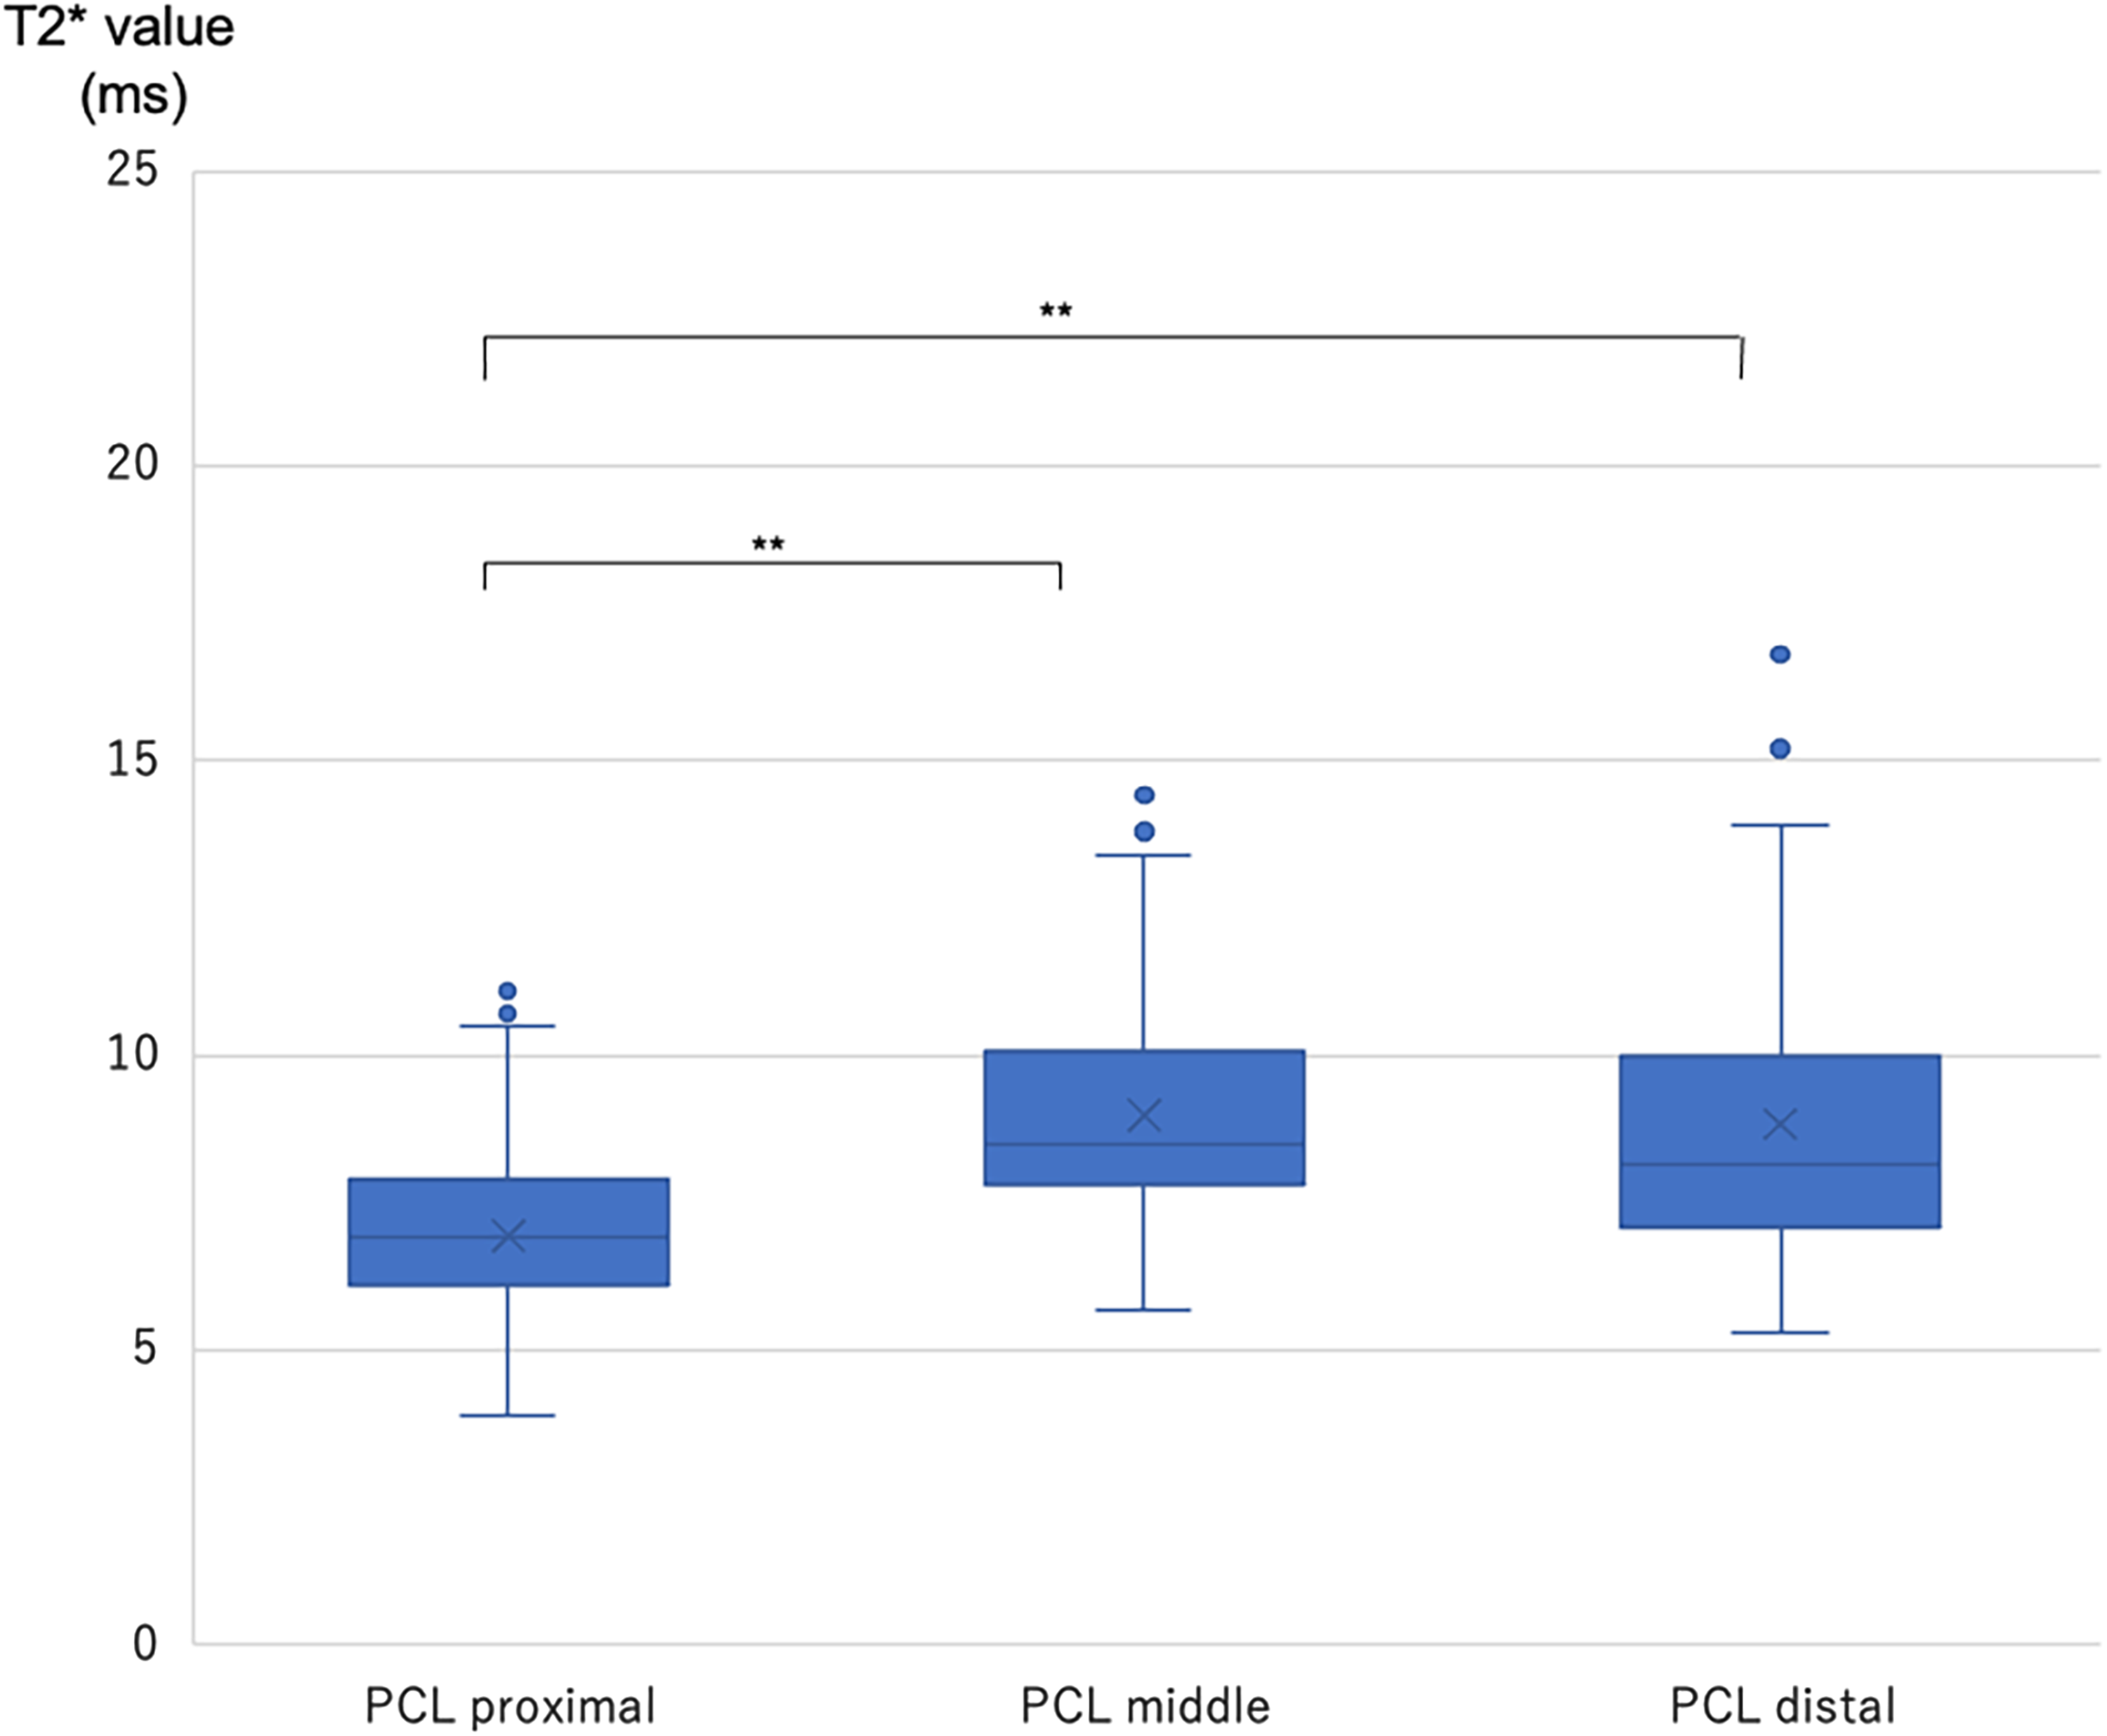
Box plot of T2* value in proximal, middle, and distal PCL. Top and bottom of boxes represent 25th and 75th percentiles of the T2* value. **P values of <0.01 are highly statistically significant. PCL, posterior cruciate ligament.

Box plot of T2* value in proximal, middle, and distal PT. Top and bottom of boxes represent 25th and 75th percentiles of the T2* value. **P values of <0.01 are highly statistically significant. PT, patella tendon.
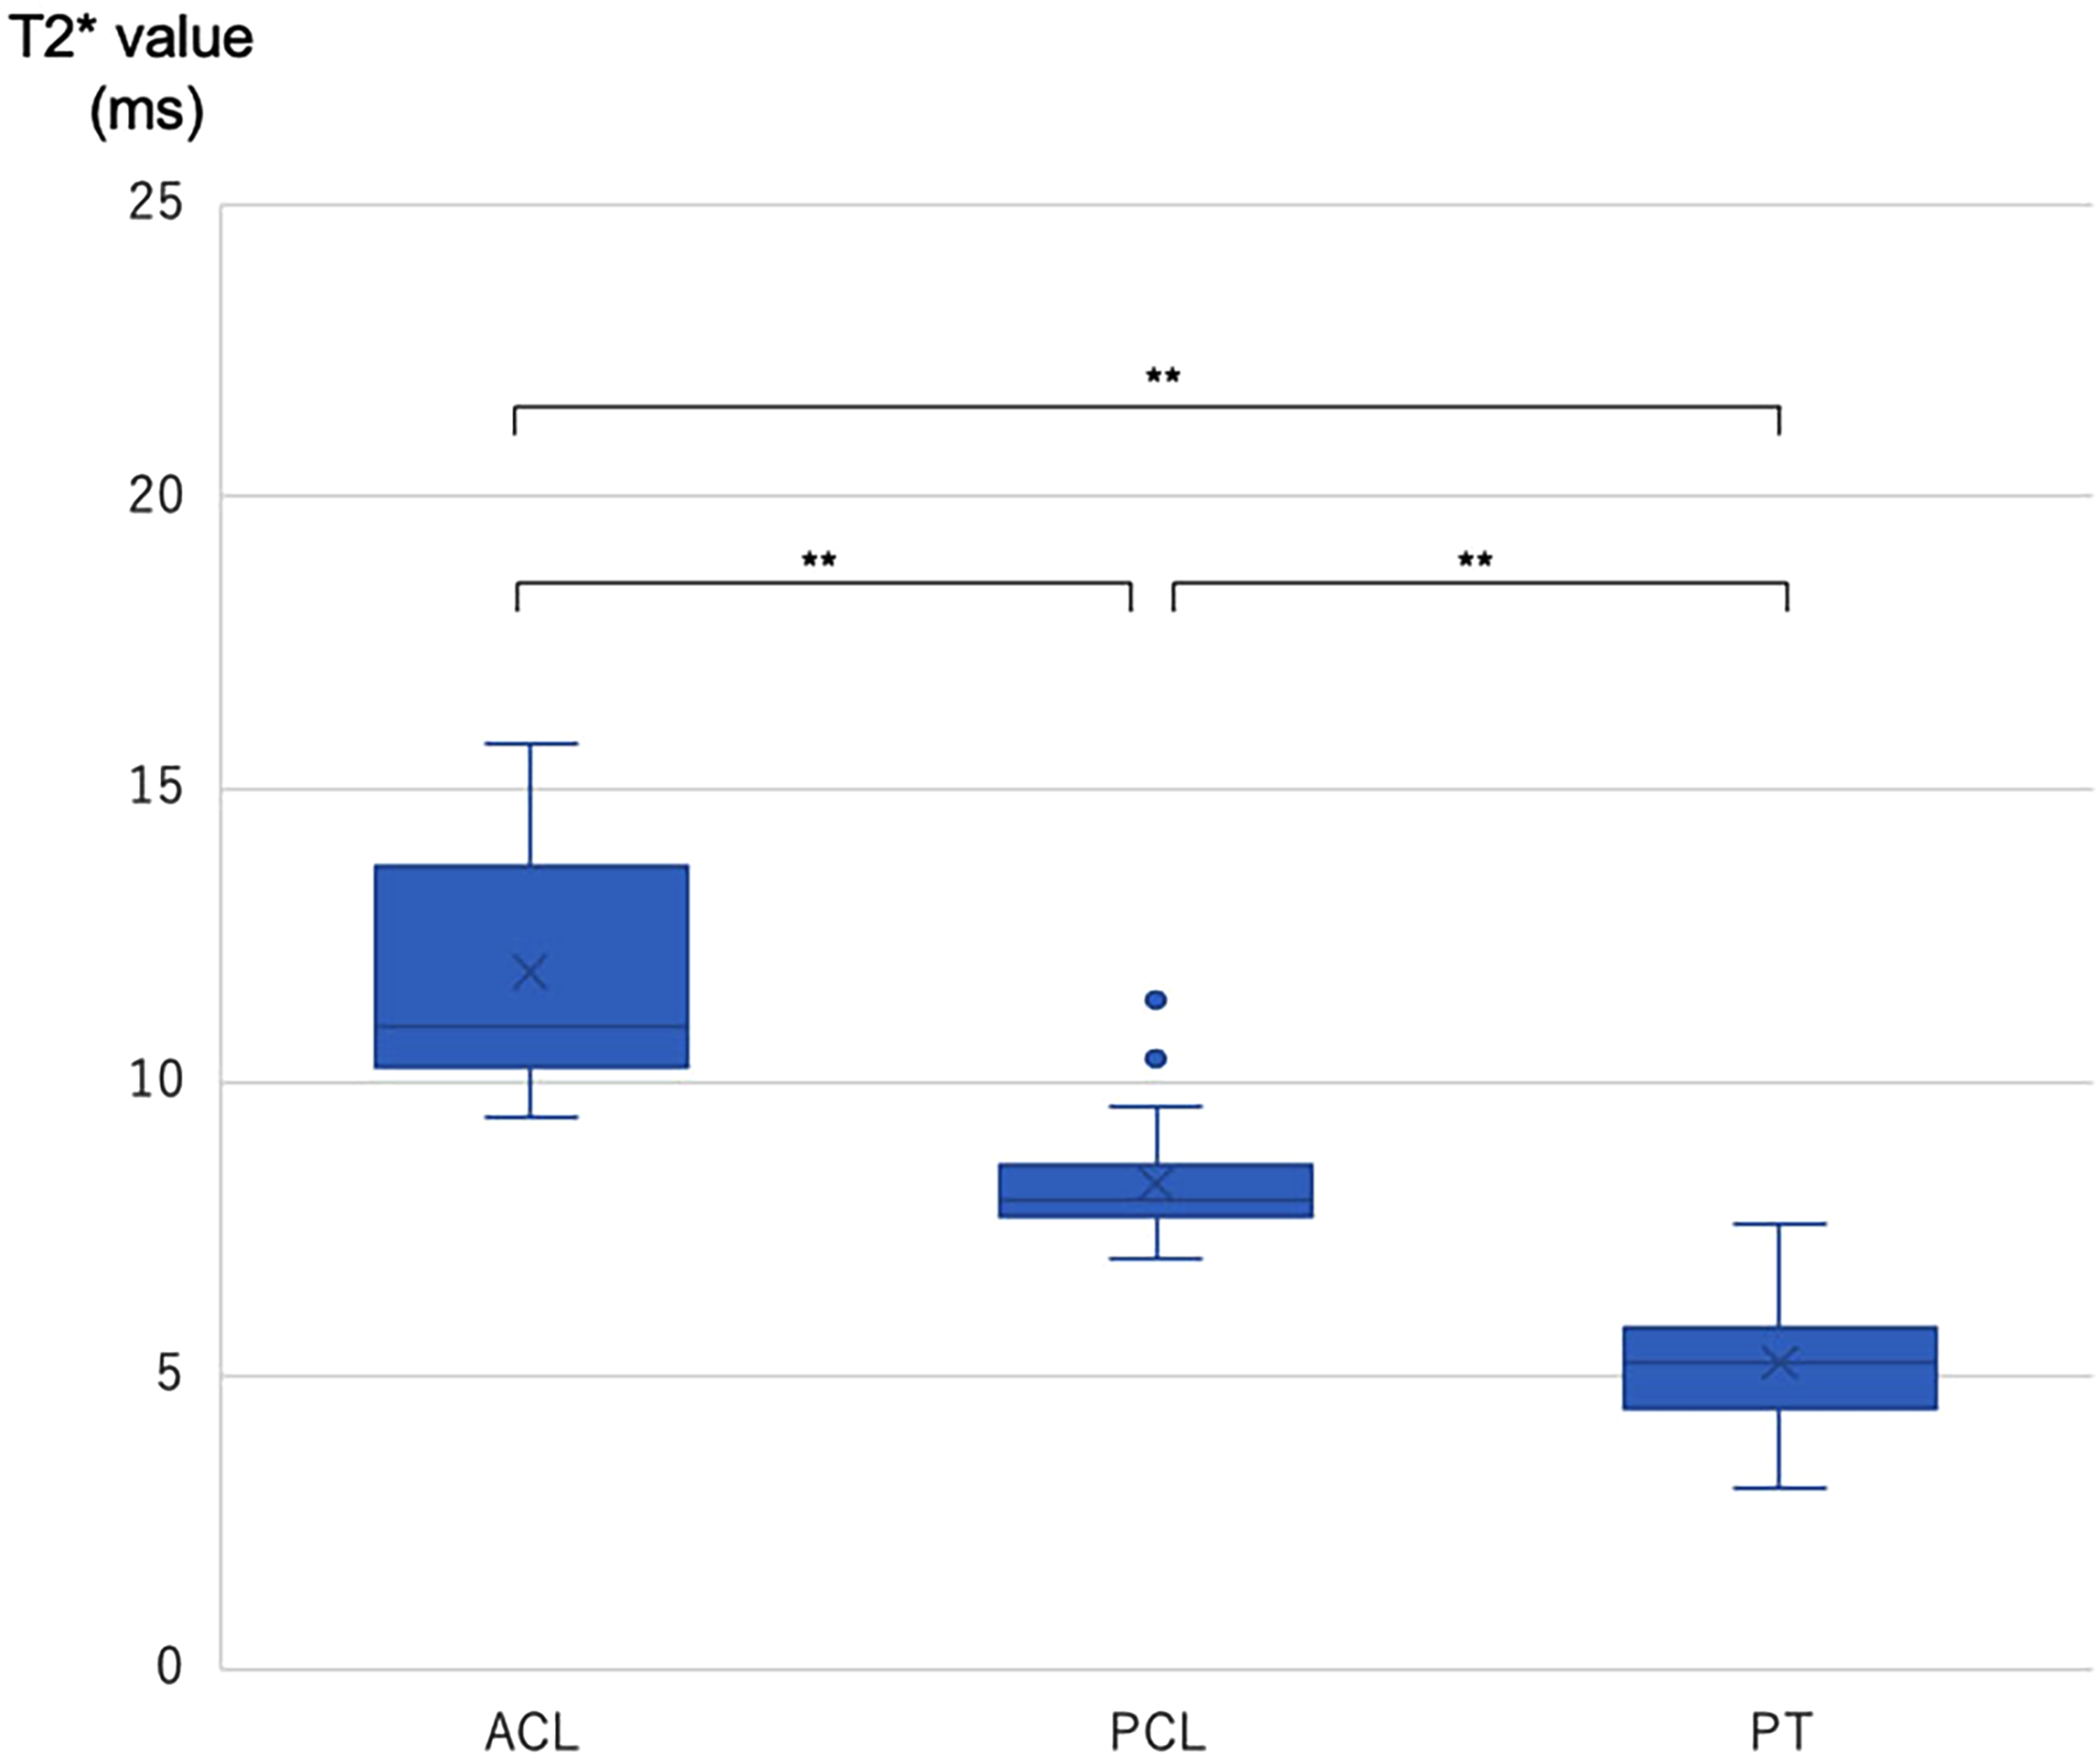
Box plot of T2* value in whole ACL, PCL, and PT. Top and bottom of boxes represent 25th and 75th percentiles of the T2* value. **P values of <0.01 are highly statistically significant. ACL, anterior cruciate ligament; PCL, posterior cruciate ligament; PT, patella tendon.
To assess inter-observer reliability, the images were independently measured in a blinded fashion by two doctors. Additionally, two independent observers performed all measurements four times to assess intra-observer reliability.
Statistical analyses
All statistical analyses were performed with SPSS version 25 for Windows (IBM Corp., Armonk, NY, USA), and statistical significance was set at P < 0.05. Data normality was assessed using the Shapiro–Wilk test The intra- and inter-observer reliabilities (intraclass correlation coefficient [ICC]) of the T2* values were calculated, and the measured value was considered reliable if the ICC was >0.80. For statistical analysis, one-way analysis of variance was performed to compare the ACL, PCL, and PT, with post hoc analysis performed using Tukey's honestly significant difference test.
Results
The study group comprised 12 healthy volunteers whose MR images showed no knee joint abnormalities.
Tables 1 and 2 show the ICCs with their respective 95% confidence intervals and the descriptive level (P value) for each pair of observers. The results showed strong agreement (ICC > 0.80) when the observer measured each UTE-T2* value four times. For the intra-observer reliability, the ICC (1,4) was higher than the ICC (1,1), and all ICCs (1,4) were >0.80 (P < 0.05) (Table 1), showing a high level of agreement. For the inter-observer reliability, the ICC (2,2) was >0.70 (P < 0.05) (Table 2), again showing a high level of agreement.
Intra-observer reproducibility of T2* value.

ACL, anterior cruciate ligament; CI, confidence interval; ICC, intraclass correlation coefficient; Obs, observer; PCL, posterior cruciate ligament; PT, patellar tendon.
Inter-observer reproducibility of T2* value.

ACL, anterior cruciate ligament; CI, confidence interval; ICC, intraclass correlation coefficient; PCL, posterior cruciate ligament; PT, patellar tendon.
Table 3 shows the mean UTE-T2* values for the ACL (proximal, middle, distal, and mean value), the PCL, and the PT. The UTE-T2* values of the ACL at the proximal, middle, distal, and mean were 12.0 ± 2.3, 11.3 ± 2.3, 12.3 ± 2.6, and 11.9 ± 2.4 ms, respectively. The UTE-T2* values of the PCL at the proximal, middle, distal, and mean were 6.9 ± 1.5, 9.0 ± 1.8, 8.8 ± 2.4, and 8.3 ± 2.1 ms, respectively. The UTE-T2* values of the PT at the proximal, middle, distal, and mean were 7.1 ± 1.7, 4.3 ± 1.7, 4.3 ± 1.8, and 5.2 ± 2.1 ms, respectively (Table 3).
Mean UTE T2* value (ms).
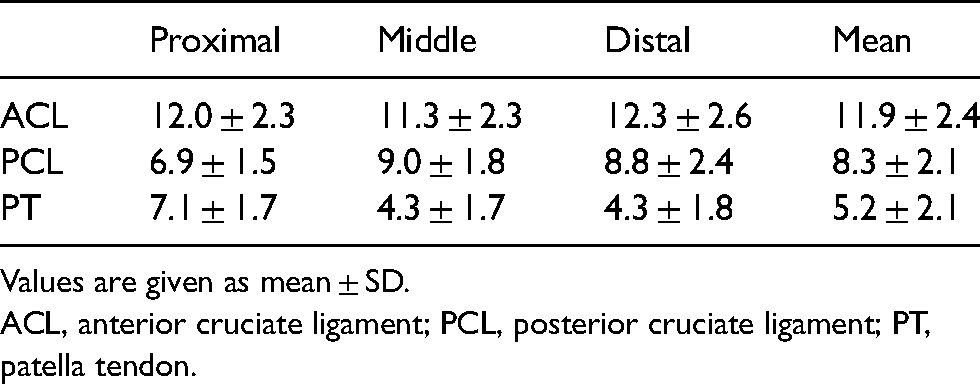
Values are given as mean ± SD.
ACL, anterior cruciate ligament; PCL, posterior cruciate ligament; PT, patella tendon.
There were no significant differences among the sites of the ACL (proximal, middle, distal) for proximal versus middle (P = 0.57), middle versus distal (P = 0.32), or distal versus proximal (P = 0.90). However, in the PCL, the T2* values were significantly higher in the middle (P = 0.001) and distal (P = 0.004) portions than in the proximal portion, and no significance was found in the middle and distal portions (P = 0.95). In the PT, the T2* values were significantly higher in the proximal than middle (P < 0.001) and distal portions (P < 0.001), and no significance was found in the middle and distal (P = 0.98). There were significant differences among the ACL mean, PCL mean, and PT mean, with a P value of <0.01 in all cases.
Discussion
Previous studies of UTE-T2* analysis in tendons (9,10,12,13), cartilage (11,14), and the meniscus (15,16) have suggested that this technique can detect subtle changes such as inflammation, degeneration, and microinjuries. UTE-T2* mapping has been shown to be sensitive to subsurface cartilage matrix changes that can occur acutely after ACL injury and that would be undetectable with conventional MRI (11). Kijowski et al. (10) suggested that UTE-T2* parameters can detect micro-degenerative changes in the PT. Chang et al. (17) showed that UTE-T2* mapping could potentially reflect the biological composition and structural integrity of ligaments and tendons during the early stages of degeneration.
Our study has shown that a UTE MRI sequence with single-component T2* analysis can be successfully implemented, particularly because both the inter- and intra-observer reliability showed strong agreement. This suggests that our study protocol can provide T2* values with sufficient objectivity. Few studies have reported on single-component and bi-component T2* analysis values in tendons or ligaments (9,10,12), and our results showed similar values to these.
In this study, we measured the ACL, PCL, and PT at proximal, middle, and distal locations. Visually, the signals differed depending on their location, and the measurement values also showed differences. No significant difference was observed in the ACL, but the PCL showed significantly higher values in the middle and distal regions than in the proximal region, and the PT showed higher values in the proximal region than in the middle and distal regions. The reason for the signal variation within the same ligament and tendon is thought to be the “magic angle” effect. In other words, it is assumed that the orientation is more likely to be affected by the magic angle in the middle and distal regions for the PCL and proximal region for the PT. The magic angle effect describes the orientational dependence of tissue with well-ordered collagen fibers, where the signal intensity of tendons and ligaments that happen to be at 55° to B0 tends to increase (18). Additionally, the UTE sequence is more susceptible to the magic angle effect than are traditional MRI sequences because of its extremely short TE, and Du et al. (19) found that the T2* value of the Achilles tendon increased from 1.94 to 15.25 ms under the influence of the magic angle, showing that there is such a difference within the same tendon.
In our study, the T2* value of the PT was significantly lower than the values for both the ACL and PCL. At present, it is almost impossible to differentiate between the T2* values of tendons and ligaments using conventional MRI. Tendons and ligaments are histologically different, although the PT and ligaments have similar water percentages of 60%–70% and 55%–65%, respectively (3). Some studies have demonstrated that although tendons and ligaments comprise similar proteins, they contain different proportions of extracellular matrix macromolecules. Little et al. (20) compared protein expression in the ACL and PT and showed that the ACL contained less type I and more type III collagen than PT. Furthermore, the bundles of collagen fibers are more aligned in the PT than in ligaments, while the collagen fibrils in ligaments tend to have a smaller diameter than those in tendons (2). In addition to these histological differences, the longitudinal, transverse, and oblique orientations of the collagen fibers may also highlight differences between tendons and ligaments and may explain why the T2* values were higher for the ACL and PCL than the PT in our study. Moreover, we found that the T2* values of the ACL and PCL differed significantly from each other. Ligaments in different locations around the knee joints, such as the inter-articular ACL and extra-articular medial collateral ligament, reportedly have different levels of collagen (21). However, because the ACL and PCL are both inter-articular ligaments, we are currently unable to explain the difference in T2* values between the ACL and PCL in terms of whether the ligaments are inter- or extra-articular. Additionally, this study showed that the intra- and inter-observer reliabilities were high at all sites; thus, the differences in the values were unlikely to be caused by errors in data measurement. One reason for this is the partial volume effect. The PCL is anatomically thicker and stronger than the ACL, and a normal ACL has an anatomically fan-shaped structure on the tibial side. Another possible reason is the magic angle effect, as mentioned above. Du et al. (19) reported that the T2* value of the Achilles tendon gradually increased toward an angle of 55° relative to the B0 field and decreased as the angle increased from 55°, suggesting that the entire ACL is located at an angle close to 55° to B0; this may cause an overall signal increase. Thus, the difference in T2* values between the ACL and PCL may be due to the magic angle effect and partial volume effect, but considering the characteristics of ligamentous running and these effects, T2* values are fully applicable as an evaluation tool for the same region.
ACL reconstruction using tendon autografts has become a common procedure. Tendon grafts are known to undergo a biological process of “ligamentization,” and this remodeling process is supposed to take 6–12 months. Lane et al. (22) reported changes that occurred by the fourth year of a semitendinosus ACL autograft in a clinical case as well as changes in the collagen crimp pattern, cell type, glycosaminoglycan composition, and collagen cross-linking that were present between the ACL autograft and the hamstring tendon. In their study, the graft was harvested during a total knee replacement; however, the tissue is not usually taken from the reconstructed ACL only to assess graft maturity. It is difficult to evaluate the remodeling process by conventional MRI because of the short T2-relaxation time of tendons, and there are currently no quantified criteria based on images for the time taken for athletes to return to competition after ACL reconstruction. This study showed that tendons and ligaments exhibit different T2* values, and this UTE-T2* mapping technique will allow for a non-invasive assessment of the graft maturation process by observing temporal changes in T2* values that reflect the histological and biological changes occurring in a transplanted tendon. Because the UTE-T2* sequence can be obtained for approximately 10 min using a standard MRI scanner, it is hoped that the T2* value transition can be objectively estimated by adding it to the routine examination after ACL reconstruction.
The present study has some limitations. First, our sample size was small because it comprised data from only 12 healthy volunteers. Second, we only evaluated single-component UTE-T2* mapping techniques. Juras et al. (12) suggested that bi-component analysis is more able to distinguish between healthy and abnormal tendons. Additionally, other studies have suggested that bi-component UTE-T2* analysis of tendons has many potential advantages over single-component UTE-T2* analysis (9,10). However, one of the disadvantages of bi-component analysis is that it typically requires a long scan time to allow for the acquisition of all images at different TEs and to process the complex algorithms. Therefore, single-component UTE-T2* analysis can be performed quickly and easily in addition to routine MRI examinations. The third limitation is the magic angle effect, which is inevitable in the running of the target ligament.
In conclusion, this study has confirmed that UTE-T2* mapping is able to quantify the T2* values of the ACL, PCL, and PT when using a clinical 1.5 T MRI scanner and that the T2* value of UTE can quantitatively discriminate between normal tendons and ligaments, which cannot be distinguished by conventional MRI, with a significant difference. It is hoped that the results of this study will be useful for making objective evaluations of graft maturity assessments after ACL reconstruction.
Footnotes
Declaration of conflicting interests
The author(s) declared no potential conflicts of interest with respect to the research, authorship, and/or publication of this article.
Funding
The author(s) received no financial support for the research, authorship and/or publication of this article.