



Abstract
Background
Accurate assessment of lymph node metastasis (LNM) is important for the selection of the optimal therapeutic strategy in patients with papillary thyroid carcinoma (PTC).
Purpose
To develop and validate a radiomics nomogram based on computed tomography (CT) for predicting LNM in patients with early-stage PTC.
Material and Methods
A total of 92 patients with pathologically confirmed PTC were divided into a training cohort (n = 64) and validation cohort (n = 28). Radiomic features of the tumor and peritumoral interstitium were extracted from contrast-enhanced CT images. The radiomic signature was constructed and the radiomic score (Rad-score) was calculated. Combined with the Rad-score and independent clinical factors, a radiomic nomogram was constructed and its performance was assessed by receiver operating characteristic (ROC) curves and calibration plots. The comparison of ROC curves was performed with DeLong's test
Results
A combined nomogram model of the thyroid tumor and peritumoral interstitium was constructed based on the Rad-score, tumor location, maximum diameter, and T stage, and it had areas under the ROC curve of 0.956 (95% confidence interval [CI] = 0.913–1.000) and 0.876 (95% CI = 0.741–1.000) in the training and validation cohorts, respectively. Decision curve analysis suggested that the combined nomogram model had better clinical usefulness than the other models.
Conclusion
A CT-based radiomics nomogram incorporating the radiomic signature and the selected clinical predictors can be a reliable approach to preoperatively predict the LNM status in patients with early-stage PTC, which is helpful for treatment decisions and prognosis.
Introduction
The incidence of papillary thyroid carcinoma (PTC) has increased substantially over the past few decades (1). Cervical lymph node metastasis (LNM) has been reported in up to 60%–70% of patients with PTC and is considered an important risk factor for locoregional recurrence (2). Although differentiated PTC has a good prognosis and low mortality rate (3,4), the presence of LNM usually manifests as a deterioration in the survival rate. In addition, central lymph node metastasis (CLNM) is common, and nearly 50% of patients with PTC present with CLNM when routine prophylactic central lymph node dissection is performed (5,6). Nevertheless, the misdiagnosis and false-negative rates of the preoperative prediction of LNM still remain matters of concern. Therefore, accurate preoperative prediction of LNM has important guiding significance for preventive or diagnostic neck lymph node dissection, avoiding the behavior of blindly expanding the scope of surgery due to an unclear diagnosis.
Imaging evaluation of LNM is particularly important. Although ultrasound has been used as the primary imaging approach for the preoperative evaluation of cervical lymph nodes in PTC, its accuracy for the detection of LNM has been reported to be only 0.782 (7). Currently, computed tomography (CT) is considered a favorable tool to assist in the diagnosis of thyroid LNM with a sensitivity of 0.734 and specificity of 0.625 (8,9). Nie et al. (10) found that in univariate analysis, age, tumor size, tumor spread, extrathyroidal extension, primary tumor location, and central lymph node status were significantly related to LNM, but are based on clinicians’ experience and visual inspection.
Radiomics is a new emerging and promising research field based on quantitative imaging techniques and is a non-invasive method aimed at utilizing the full potential of medical imaging to reflect tissue heterogeneity, which can improve the diagnosis, evaluation, and prediction of tumors. Radiomics has been proven to be useful for the preoperative assessment of LNM in not only PTC (11), but also other tumors, such as breast cancer, non-small-cell lung cancer, and intrahepatic cholangiocarcinoma (12–14). Liu et al. (7) used ultrasound images to predict the lymph node status and identified areas under the receiver operating characteristic (ROC) curves (AUCs) of 0.782 and 0.727 in the predictive and testing cohorts, respectively. Wei et al. (15) showed that radiomic nomograms improved the preoperative predictive performance of cervical LNM in PTC, with a high accuracy of 86.7%. Furthermore, a radiomic nomogram for the preoperative prediction of LNM in patients with colorectal cancer by CT showed good discrimination and calibration (16). Although several studies have proposed predictive models for LNM in patients with PTC, these studies only focused on the tumor, and the interstitium around the tumor was not considered in the analyses. This might limit the clinical application of the predictive models for predicting the probability of LNM because peritumoral tissue has been confirmed to play a crucial role in the process of LNM (16).
Therefore, the aim of the present study was to construct and validate radiomics nomogram based on thyroid tumors and peritumoral interstitium for the preoperative prediction of LNM in patients with early PTC (EPTC) at the T1 or T2 stage without thyroid capsule violation or LNM on CT images. Moreover, we developed an inclusive nomogram that incorporated the radiomics signature and clinical risk factors for providing an individual, preoperative assessment of the risk of LNM in patients with EPTC.
Material and Methods
Patients
Ethical approval was obtained from the institutional review board for this retrospective analysis. In total, 92 patients with PTC who underwent surgery between August 2016 and April 2019 were enrolled in this study according to specified inclusion and exclusion criteria (Fig. 1). The inclusion criteria were as follows: (i) pathologically confirmed early PTC (T1–2); (ii) no preoperative treatment; (iii) standard CT scan of the neck performed before surgery; and (iv) radical thyroidectomy performed within a short period of time (within one week) after enhanced CT examination. The exclusion criteria were as follows: (i) other tumor diseases or metastases occurring in the same period; (ii) incomplete or poor quality of CT images; (iii) LNM on CT images; (iv) nodules involving the thyroid capsule and isthmus; (v) multiple nodules; and (vi) nodules diameter <6 mm or >30 mm.
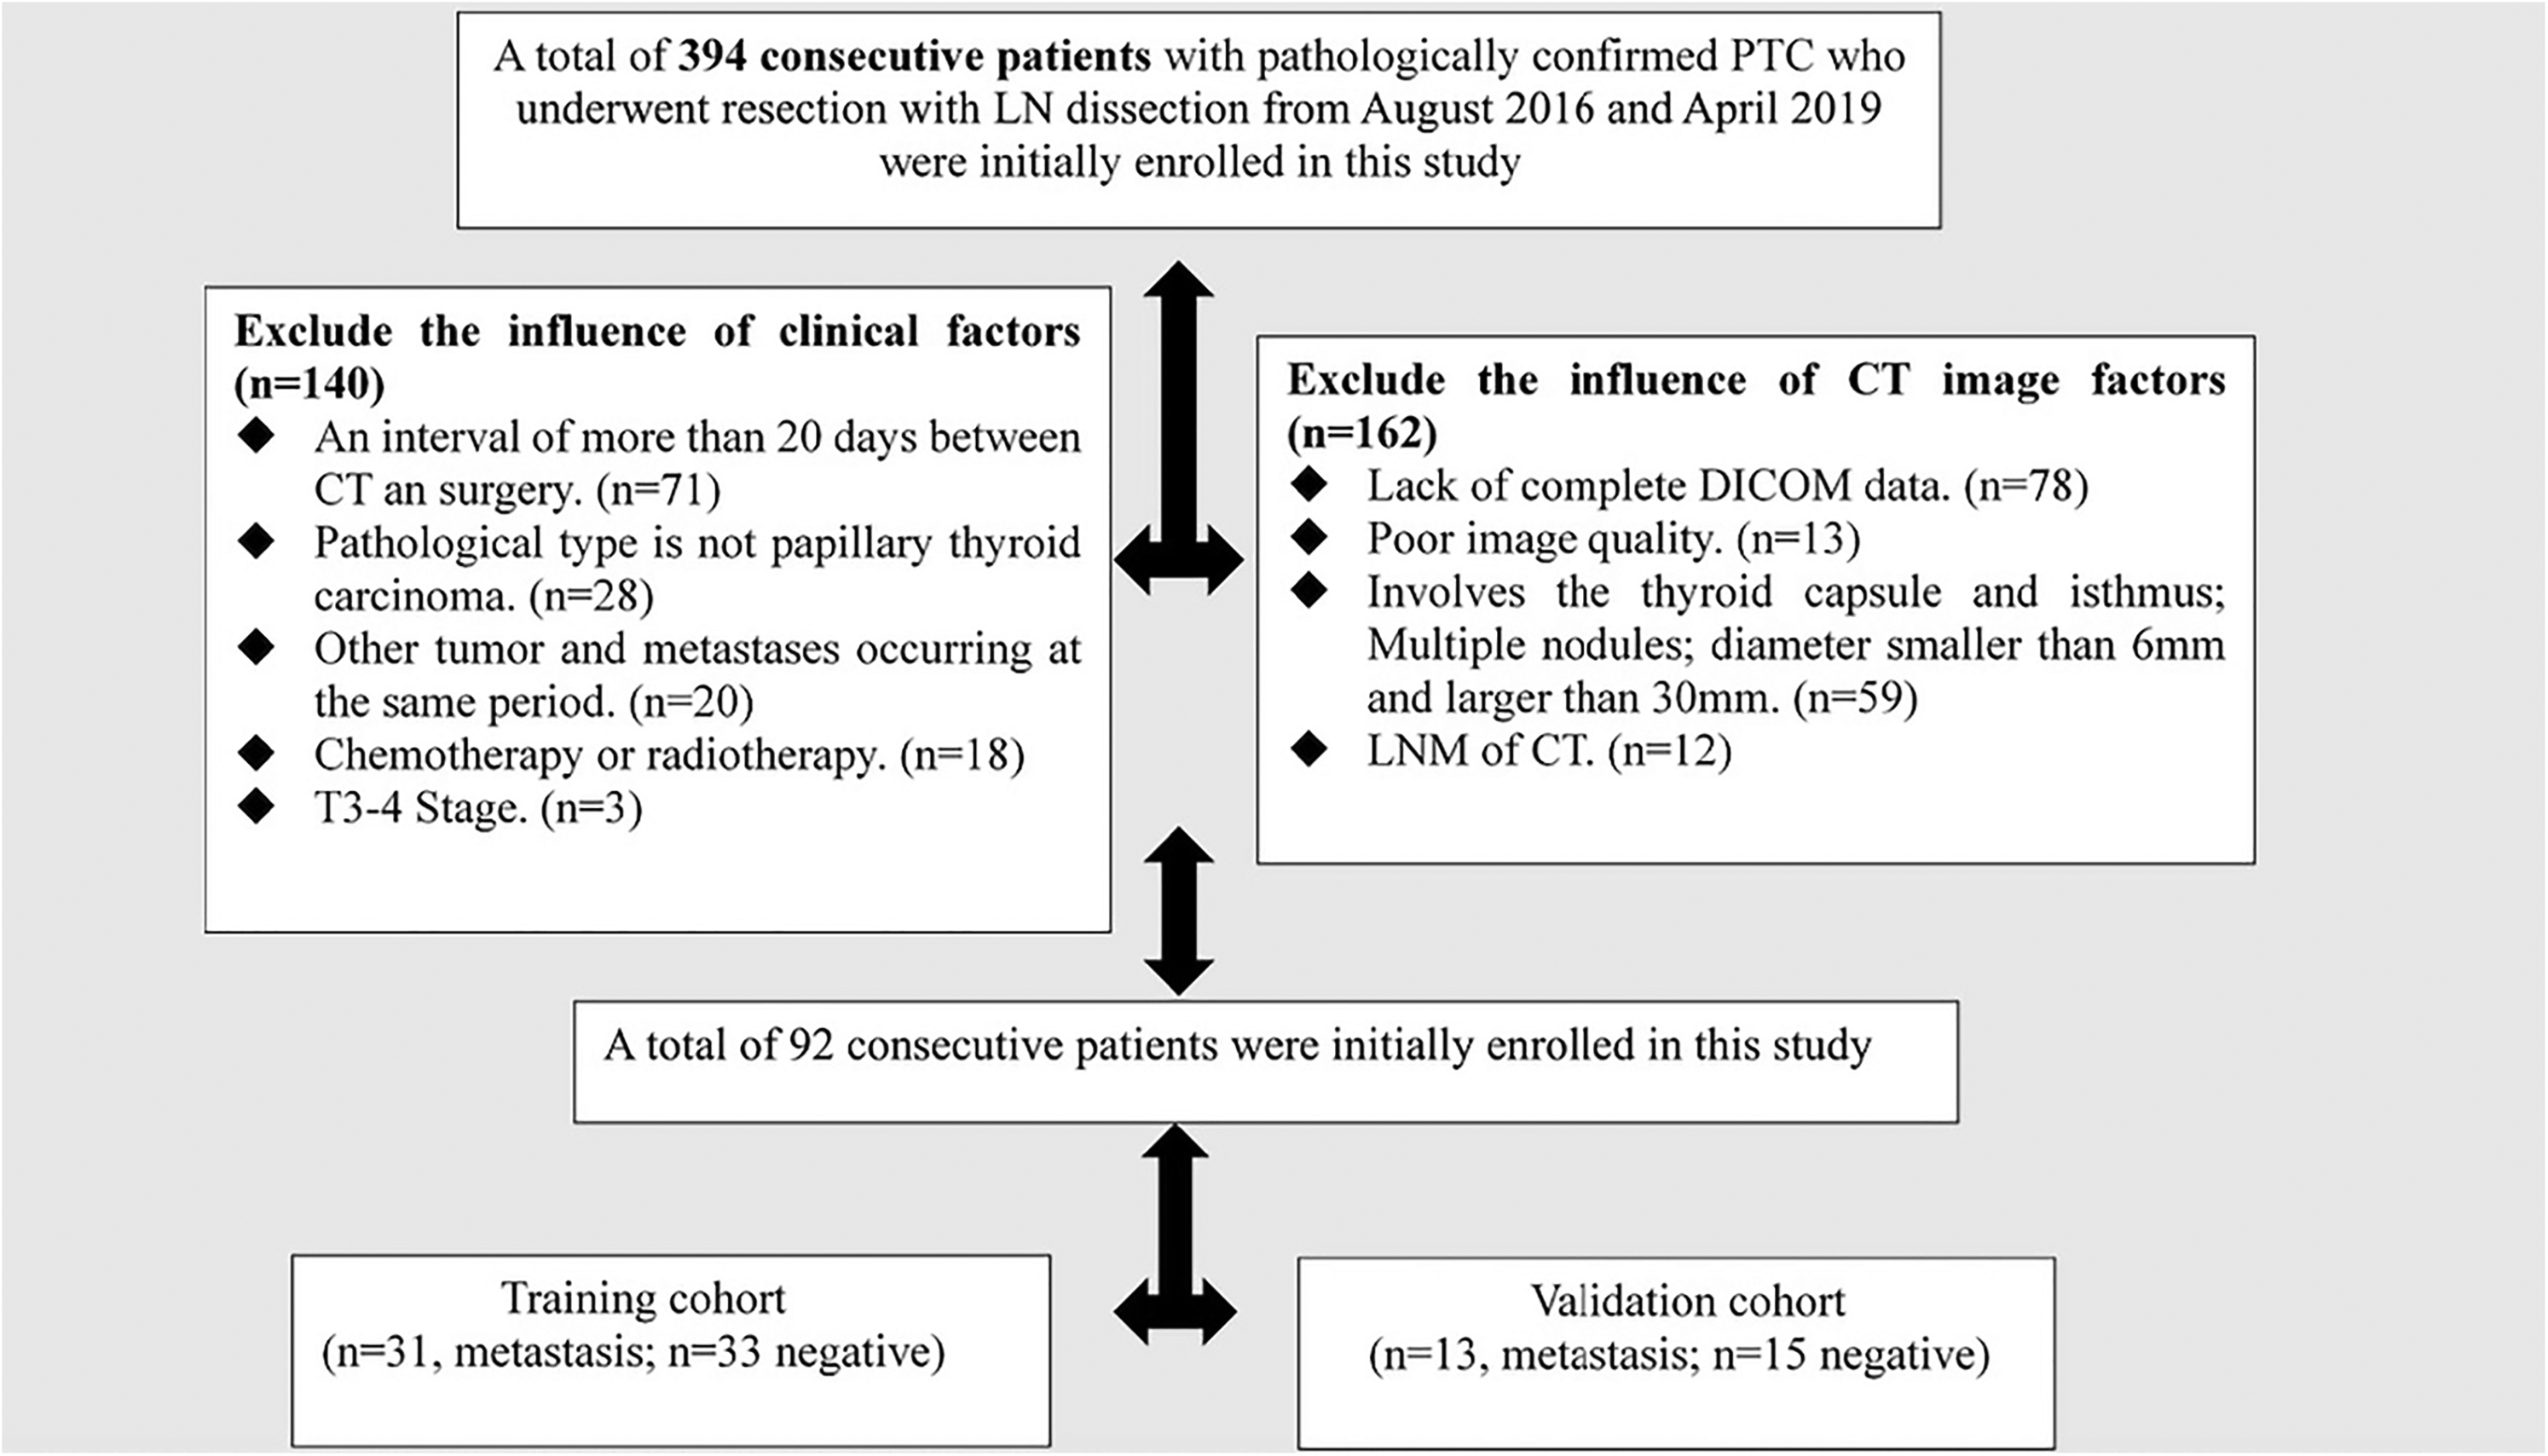
The patients’ recruitment pathway.
All enrolled patients were randomly divided into the following two groups: a training cohort (31 patients with positive LNM and 33 with negative LNM) and a validation cohort (13 patients with positive LNM and 15 with negative LNM) by step sampling with a ratio of 7:3. Tumor staging was defined according to the American Joint Committee on Cancer (AJCC) TNM staging system (8th edition) by two radiologists (with 7 and 16 years of experience, respectively) who were blinded to the pathological data. Baseline clinical data, such as gender and age, were derived from the medical records. CT data, including lesion size, location, position, and calcification, were recorded by two radiologists (with 7 and 16 years of experience, respectively) in neck CT interpretation. Any disagreement was resolved by consultation.
Image acquisition, volume-of-interest segmentation, and radiomic feature extraction
All patients underwent contrast-enhanced CT before surgery with a 320-row spiral CT scanner (Sensation 320; Toshiba, Tochigi, Japan). The CT scan parameters were as follows: tube voltage = 120 kVp; tube current = 100 mAs; pitch = 1; rotation time = 1.0 s; matrix = 256 × 256; and slice thickness = 0.5 mm. All patients underwent enhanced scanning. The iodinated contrast material dose of 1.5–2 mL/kg at a rate of 3 mL/s was delayed for 40 s. All images were exported in DICOM (Digital Imaging and Communications in Medicine) format for image feature extraction.
The regions of interest (ROI), including thyroid lesions with or without surrounding interstitium (3–5 mm) on enhanced CT images, was extracted slice-by-slice using the publicly available ITK-SNAP software (https://download.csdn.net/download/anshiquanshu/9696136) by two radiologists (with 7 and 16 years of experience in cervix imaging, respectively) who were blinded to the clinical and histopathological data independently. First, the scope of the lesion was determined in DICOM software, and the number and scope of the involved layers were recorded. Second, the ROIs were accurately placed on thyroid nodules to cover the maximum range of lesions with or without the surrounding interstitium in ITK-SNAP software by adjusting the window width and window level; then a 3D model was automatically generated. All pixels within the 3D model were extracted and mean data were acquired finally

Study workflow.
Intraclass correlation coefficients (ICCs) were used to assess the reproducibility of the radiomic features, and an ICC (coefficient) >0.75 was considered to indicate moderate agreement, with a value of ≥0.90 required for excellent agreement.
Radiomic feature selection and radiomic signature construction
The least absolute shrinkage and selection operator (LASSO) method was used to obtain the most significant features for predicting LNM in the primary cohort. The radiomic score (Rad-score) was outputted using a formula weighted by selected radiomic features for each patient, which may reflect the risk of LNM.
Model establishment and data analysis
Multivariable logistic regression with a backward stepwise procedure based on the Akaike information criterion was applied to identify independent risk factors for LNM. Then, these independent predictors were selected to develop different models for predicting LNM.
According to the different ROIs and risk factors, we designed the following six models: clinical data (C model); enhanced CT image signs (E model); thyroid tumor radiomics (T model); thyroid tumor and peritumor interstitial radiomics (TI model); thyroid radiomics combined with clinical data and enhanced CT image signs (TCE model); and thyroid tumor and peritumor interstitial radiomics combined with clinical data and enhanced CT image signs (TICE model).
Statistical analysis
Clinical statistical method descriptions used the chi-square test, Fisher's test, Kruskal–Wallis H-test, or Mann–Whitney U test. The chi-square test or Fisher's exact test was used for categorical variables. The Kruskal–Wallis H-test was used for ordinal variables. The Mann–Whitney test was used for continuous variables with an abnormal distribution.
The ROC curves of the six models were plotted, and the performance of each model was evaluated using the AUC, sensitivity, specificity, and accuracy. Decision curve analysis (DCA) was employed to determine the clinical usefulness of the combined radiomic nomogram by quantifying the net benefits at different threshold probabilities in the entire dataset. The comparison of ROC curves was performed with the DeLong's test using R v. 3.5.1 (R Foundation, Vienna, Austria).
All statistical analyses were performed using R v. 3.5.1 and Python v. 3.5.6. A two-tailed P value <0.05 was considered to indicate statistical significance.
Results
Clinical and CT image features
The clinical and CT image characteristics of the training and validation cohorts are summarized in Tables 1 and 2. No significant differences were found between the metastatic group (patients with cervical LNM) and non-metastatic group (patients without cervical LNM) in terms of age, gender, tumor location, and isthmus violation in both the training and validation cohorts (P > 0.05). However, tumor position, calcification, T stage, and maximum diameter were significantly different between the patient groups in the training cohort (P < 0.001, P = 0.013, P = 0.011, and P = 0.002, respectively). Moreover, tumor position and calcification were significantly different between the patient groups in the validation cohort (P = 0.011 and P = 0.024, respectively).
Characteristics of patients in the training and validation cohorts.

Values are given as n (%) or mean ± SD.
Signs of the examination in the training and validation cohorts.

Values are given as n (%) or median (range).
Clinical, enhanced CT image, thyroid tumor radiomic, and thyroid tumor combined with surrounding interstitial radiomic models
The ROC curves of the C, E, T, and TI models are shown in Fig. 3. The T model yielded a sensitivity, specificity, and AUC of 90.3%, 57.5%, and 0.755, respectively, for discriminating between the metastatic and non-metastatic patient groups in the training cohort, and 69.2%, 40.0%, and 0.620, respectively, in the validation cohort. The T model yielded better diagnostic performance than the C model with respect to AUC, but a lower AUC and sensitivity compared with the E model (Table 3).

ROC curves and DeLong's test (P value) of prediction models in the (a, c) training and (b, d) validation cohorts. C, clinical model; E, enhanced CT image model; T, thyroid tumor radiomics model; TCE, thyroid radiomics combined with clinical data and enhanced CT image signs model; TI, thyroid tumor combined with peritumor interstitial radiomics model; TICE, thyroid tumor and peritumor interstitial radiomics combined with clinical data and enhanced CT image signs model.
Predictive performance of the radiomics signatures for lymph node metastasis.

ACC, accuracy; AUC, area under curve; C, clinical model; E, enhanced CT image signs model; SEN, sensitivity; SPE, specificity; T, thyroid lesions model; TCE, thyroid clinical enhanced CT image signs model; TI, thyroid interstitium model; TICE, thyroid interstitium clinical enhanced CT image signs model.
The TI model yielded a sensitivity, specificity, and AUC of 87.0%, 78.7%, and 0.856, respectively, for discriminating between the metastatic and non-metastatic patient groups in the training cohort, and 69.2%, 60.0%, and 0.748, respectively, in the validation cohort. The TI model yielded better diagnostic performance than the C, E, or T model with respect to AUC and accuracy (Table 3).
Feature selection and radiomic signature building
Of the 396 radiomic features extracted from CT images, 396 were shown to have moderate or excellent consistency, with ICCs in the range of 0.750–0.985. Eight features were selected through the LASSO method in the training cohort; then, the Rad-score was calculated via a linear combination of selected features weighted by their respective coefficients.
Development and validation of the radiomic nomogram
Tumor location, T stage, maximum diameter, and Rad-score were incorporated into construction of the TICE radiomic nomogram (Fig. 4). The radiomic nomogram of the TICE model yielded the highest AUC of 0.956 (95% confidence interval [CI] = 0.913–1.000) and 0.876 (95% CI = 0.741–1.000) in the training and validation cohorts, respectively, and displayed good performance for predicting LNM (Fig. 4). Additionally, DeLong's test showed that the values were significantly higher than those of the other four models (P < 0.001, P < 0.001, P < 0.001, P = 0.01, P = 0.07) except for the TCE model (P = 0.07) in the training cohort and significantly higher than the clinical model in the validation cohort (P = 0.01) (Fig. 3).

Radiomics nomogram for the prediction of LNM. The radiomics nomogram was developed in the training cohort, with the gender, T stage, age, lesion-location, max diameter of lesion, and Radscore incorporated. When applied to a specific case, each predictor can get a score by finding the specific value of the case on each predictor axis and drawing a vertical line from predictor axis to the “Points” axis. The total score is obtained by summing each predictor score. Then, a vertical line is drawn from the total score position of “Total Points” to the “Probability” axis. The corresponding value on the “Probability” axis is the probability of LNM. LNM, lymph node metastasis.
With regard to the comparison between different prediction methods, the DCA findings for the C, E, T, TI, TIC, and TICE models were performed in the training and validation cohorts. DCA curves showed that the combined radiomic nomogram of the TICE model had the most clinical utility for threshold probability >5% in predicting LNM in patients with PTC compared with the C, E, T, and TI models.
Discussion
In the present study, we constructed and validated a quantitative nomogram that incorporated the radiomic signature and clinical and CT image signature for non-invasive and individualized prediction of LNM in patients with EPTC before surgery. The radiomic nomogram showed good predictive ability of LNM in both training (AUC = 0.956) and validation cohorts (AUC = 0.876). Furthermore, we demonstrated that our radiomic nomogram of the TICE model was superior to that of the other five developed models. The DCA also demonstrated the potential application value of our radiomic nomogram.
In the present study, although the diagnostic efficiency of the T model was lower than that of the E model in the training and validation cohorts, the value of the TI model was higher than that of both the T and E models. Furthermore, the TICE model, which was superior to the other five models, was an optimal model. It is speculated that the ROI outlined by the TI model contains not only the information of the primary tumor, but also the information of the surrounding stromal or vascular lymph, which can provide a certain hint for thyroid cancer lesions with LNM. Consistent with our study, Liu et al. (17) found that radiological characteristics combining the interstitial condition can effectively predict lymphatic vessel invasion in patients with invasive breast cancer before surgery. Wu et al. (18) found that the combination of imaging features and surrounding tissues of the tumor can be potentially applied in the preoperative prediction of LNM in patients with locally advanced cervical cancer.
Many studies have demonstrated that radiomic models yielded many results pertaining to the predictive values of tumor diagnosis and LNM. Compared with the C model and T model, the E model had the highest benefit for predicting LNM status in our study. Furthermore, the results implied that the E model was reliable with regard to the prediction of LNM in PTC. In the current study, tumor location, maximum diameter, T stage, and Rad-score were used to construct the nomogram. The nomogram successfully stratified patients according to their risk of CLNM and yielded excellent performance, especially in male and younger female cohorts. Different from published studies, the originality of our study is that the individual probability of CLNM can be evaluated preoperatively and non-invasively based on the T model. Although the T model exhibited low predictive efficiency for the LNM of PTC, it exhibited better performance especially when combined with the C model. Furthermore, preoperative maximum diameter and calcification were positively correlated with LNM. In addition, it has been previously reported that large tumor diameter is one of the preoperative factors associated with LNM (19,20). However, T stage is still one of the key factors in the preoperative estimation of LNM. Some previous studies reported that T stage was significantly higher in patients with LNM (21–23). The debatable aspect is the manual cutting of the tumor boundary. The uncertainty of the tumor boundary will affect the modeling of radiomics features and further affect the predictive diagnostic efficiency.
The combined model performed better than the single model, especially TICE model, which had the best net benefit regardless of the threshold probability. Based on the current research, there are limited reports on the evaluation of LNM in PTC. Lu et al. (15) explored the feasibility of using radiomics to preoperatively predict cervical LNM in PTC patients with AUC of 0.807–0.867 in the training cohort and AUC of 0.795–0.822 in the validation cohort. Chen et al. (24) designed a new many-objective radiomic model and a 3D convolutional neural network to provide a more accurate way for predicting LNM using positron emission tomography (PET) and CT. Unlike the previous studies, our study mainly developed the radiomic nomogram model to better predict LNM of PTC lesions involved in thyroid tumors and peritumoral interstitium. In addition, we chose patients with a relatively early stage of PTC (T1 or T2) without thyroid capsule violation or obvious LNM on CT images.
The present study has some limitations. First, since this was a retrospective study with limited patients, there may inevitably be some biases that affected our analysis. A large number of patients is required for prospective multicenter validation to obtain advanced evidence for further clinical application. Second, owing to the lack of pathologically confirmed lymph node size data, we cannot determine whether the nomogram can detect the size of LNM, and it is necessary to be confirmed in the future. Third, the lower performance in the validation set compared to the very high reported AUC in the training set suggests overfitting of parameters. Furthermore, the range of surgical treatment may be larger than what we saw, which will cause another kind of bias. Finally, recent studies have shown that gene mutations are associated with a higher rate of LNM, which we did not mention.
In conclusion, this study proposes a non-invasive predictive tool based on radiological characteristics and clinical risk factors (the final radiomic nomogram), which shows good performance in predicting preoperative LNM in patients with EPTC and also needs to be validated with a large sample size in future study.
Footnotes
Declaration of conflicting interests
The author(s) declared no potential conflicts of interest with respect to the research, authorship, and/or publication of this article.
Funding
The author(s) received the following financial support for the research, authorship and/or publication of this article: The work was supported by the National Key Research and Development Plan of China under Grant (grant No. 2019YFC0118805) (XHW), National Science Foundation of China (grant No. 81871846) (XHW), the Featured Clinical Technique of Guangzhou (grant No. 2019TS46) (XHW), the Guangzhou Planned Project of Science and Technology (grant No. 202102010028) (LSL), Guangzhou Planned Project of Science and Technology (grant No. 202102010031) (YYL) and the Special Fund for the Construction of High-level Key Clinical Specialty (Medical Imaging) in Guangzhou.
