
Abstract
Background
Gemstone spectral computed tomography (GSCT) has been used to measure bone mineral density (BMD) in human vertebrae and animal models gradually.
Purpose
To investigate the effect of scanning protocols for BMD measurements by GSCT using the European spine phantom (ESP) and its accuracy and precision.
Material and Methods
The ESP number 145 containing three hydroxyapatite (HAP) inserts with densities of 50, 100, and 200 mg/cm3 were labeled as L1, L2, and L3, respectively. Quantitative CT (QCT) protocol and 14 groups of scanning protocols configured by GSCT were used to repeatedly scan the ESP 10 times. Their measurements were compared with the true values of ESP and their relative standard deviation and relative error were calculated.
Results
The measured values of the three inserts at different exposure levels were statistically significant (P < 0.05). The measured values in the 0.8 s/r 260 mA group, 0.5 s/r 630 mA group, and 0.6 s/r 640 mA group were not significantly different from the actual ESP values for L1 and L2. However, the measured values at all the parameters were significantly different from the actual values for the L3.
Conclusion
CT gemstone spectral imaging can accurately and quantitatively measure the HAP value of ESP, but the results of BMD will be affected by the scanning protocols. The best scanning parameter of ESP measured by GSCT was 0.8 s/r 260 mA, taking dose into consideration, and the measurement accuracy of vertebrae with low BMD was higher than that of QCT under this parameter.
Keywords
Introduction
Osteoporosis is one of the most common chronic metabolic diseases, which has no clinical manifestations until there is a fracture. Therefore, the early diagnosis and prevention of osteoporosis is important and measuring bone mineral density (BMD) is the most common clinical method of diagnosis (1).
BMD can be measured using a variety of techniques. Currently, dual-energy X-ray absorptiometry (DXA) and quantitative computed tomography (QCT) were considered as preferred methods for measuring BMD (2,3). DXA has been recognized by the World Health Organization as a gold standard for the assessment of osteoporosis (3,4). With the advantages of short scanning time, low exposure dose, and low cost, DXA has been widely used in many regions. However, it measures areal (two-dimensional) BMD (aBMD; g/cm2), which cannot distinguish cortical bone from cancellous bone, so the results can be affected by vertebral size (5) and degenerative changes of the spine (6). It is generally accepted that QCT has become an established and sensitive technique to detect osteoporosis, which measures the BMD of the vertebrae by scanning the vertebrae with a known BMD standard model. QCT measures the true volumetric (three-dimensional) BMD (vBMD; g/cm3), so it can selectively measure the trabecular, cortical, or integral bone, centrally or peripherally. However, the radiation dose delivered by a QCT scan is significantly higher than DXA (200 μSv vs. 15 μSv) (7). In addition, QCT requires a dedicated in-scan calibration phantom and specialized software for BMD measurement and analysis (8), and the technique has a high cost compared to DXA, complexity in quality control, and needs a well-trained operator to carry out the scan (8,9). Therefore, its promotion is limited to some extent.
In addition to these two methods, quantitative ultrasound (QUS) uses the attenuation and reflection of the measured bone to ultrasound to reflect the situation of BMD (10), and magnetic resonance imaging (MRI) indirectly reflects the BMD by measuring factors such as the fat fraction in the vertebrae and the diffusion of water molecules (11). Both these methods can assess the osteoporosis of patients to a certain extent, but neither of them can directly provide the BMD value. In addition, their quality control is not yet perfect, and the standards are not yet unified.
Spectral CT is a developing direction of current CT technology. It can realize multiparameter CT imaging by simultaneously and collecting high-energy X-ray and low-energy X-ray data in the same direction, which enriches the diagnostic information obtained by CT scan (12,13). Since all substances have their own attenuation characteristic absorption curves for X-ray, spectral CT can represent the X-ray attenuation of any substance by that of two basic substances, so as to separate and quantify the substance. Spectral CT also measures the true volumetric BMD, and there is no need for a dedicated in-scan calibration phantom and specialized software. However, spectral CT has higher radiation than conventional CT. Tube current and rotation speed are two important parameters of CT scanning, which are closely related to the radiation dose received by the patient. However, no uniform standards of the scanning parameters are available for BMD measurements by gemstone spectral CT (GSCT) to date.
The aim of the presents study was to use CT gemstone spectral imaging (GSI) and QCT protocol to scan the European spine phantom (ESP) with hydroxyapatite (HAP) inserts of known density, in order to investigate the influences of scanning parameters on BMD measured by GSI, and compare the accuracy, precision, and radiation dose between GSI under different scanning parameters with QCT.
Material and Methods
Data of the ESP
A single ESP (number 145) produced by the ORM Company (Germany) was used in this study. The ESP was composed of a certain ratio of epoxy resin, HAP, and other components, which is mainly used for standardizing and mutual calibration of BMD measuring instruments (14,15). while the X-ray attenuation in the ESP was equal to the mixture of H2O and HAP. The ESP included three vertebra-like structures of different BMD in cancellous bone, which were labeled L1, L2, and L3 from top to bottom, and the HAP content in the cancellous bone was 50, 100, and 200 mg/cm3, respectively (Fig. 1).

Sagittal scan of ESP. The HAP content of spongy bone from top to bottom was 50, 100, and 200 mg/cm3, respectively. ESP, European spine phantom; HAP, hydroxyapatite.
BMD measured by GSI
Scanning was performed using 64-layer gemstone spectral CT (Discovery 750 HD, GE Healthcare, Waukesha, WI, USA). The ESP was placed on the scanner frame, and the spectral scanning mode was adopted for the continuous scanning of the ESP, with the parameters as follows: bed height = 130 cm; tube voltage of instantaneous switching (0.5 ms) between high and low power (140 kVp and 70 kVp); detector width = 40 mm; screw pitch = 0.984:1. The system is equipped with 14 different combinations of tube rotation speed and tube current. Each condition was scanned 10 times, independently.
The reconstructed image with layer thickness and interlayer spacing of 1.25 mm was transferred to an AW4.6 (GE Healthcare) image postprocessing workstation and the GSI Viewer software was used to browse and process the data. Taking HAP-H2O as the base material pair, the base material image of HAP (H2O) was reconstructed. The middle layer of each vertebral body was selected, and a region of interest (ROI) large enough and fixed at 417.56 mm2 was used to measure the content of HAP in the central image of the series (Fig. 2).
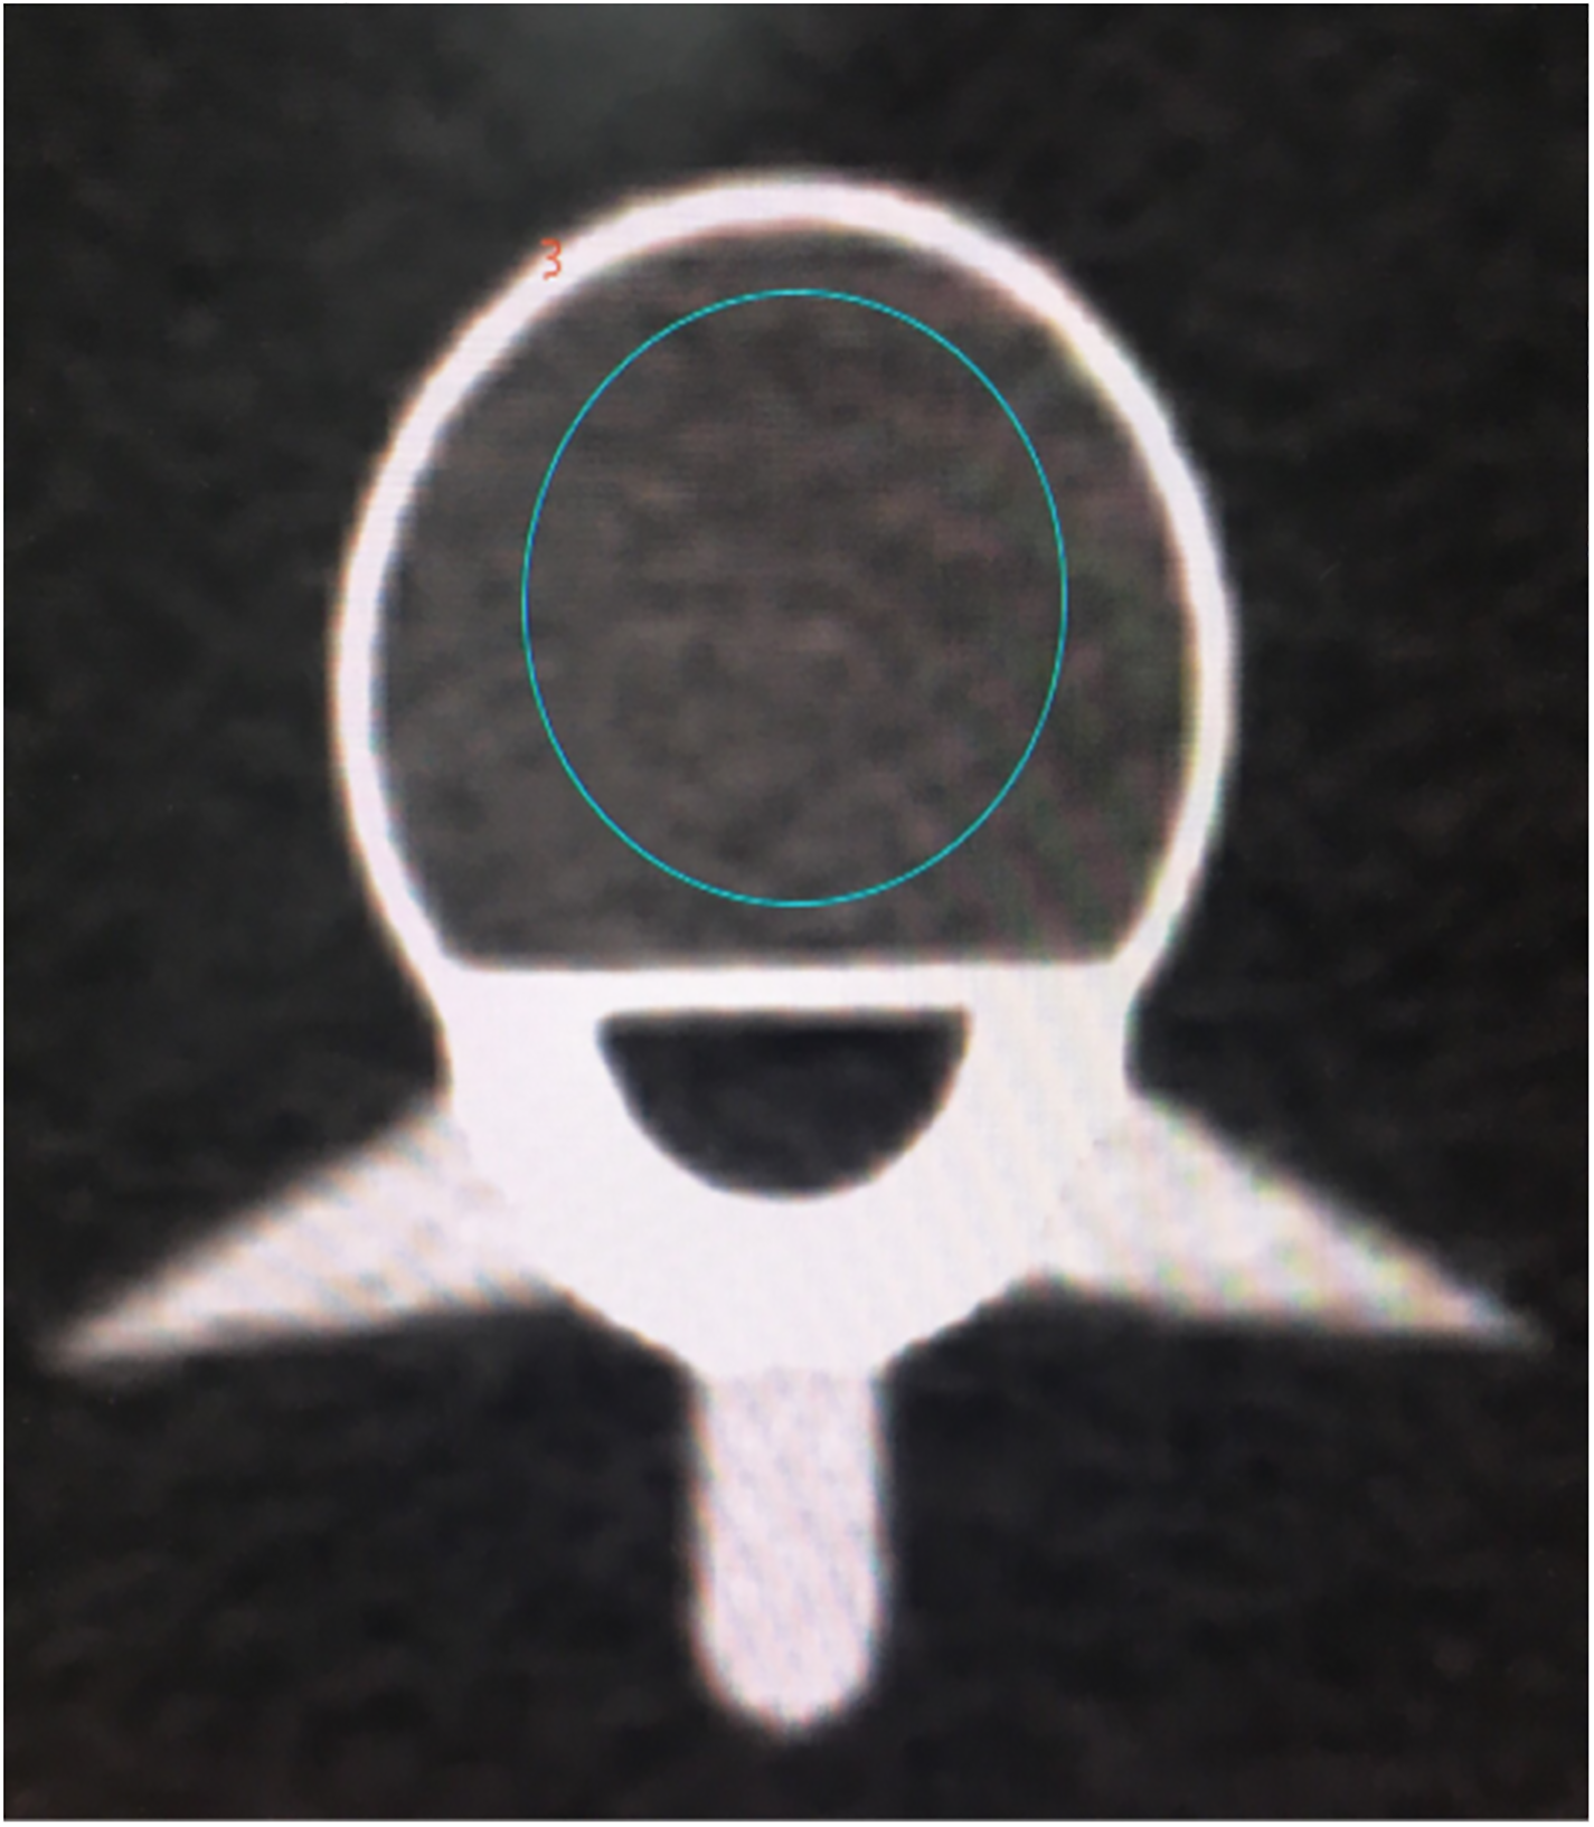
The region of interest in spectral computed tomography.
BMD measured by QCT
The same gemstone spectral CT was used for QCT scans. Quality assurance (QA) procedures were taken before the scans. The QCT images were acquired using the following parameters: tube voltage = 120 kV; tube current = 125 mAs; X-ray tube rotation speed = 0.6 s/r; pitch = 0.984; scanning field of view (SFOV) = 50 cm; and bed height = 143 cm. The same examiner performed 10 scans without reposition. Recombination layer thickness and layer spacing were set as 1 mm, with a matrix of 512 × 512, and displaying field of view (DFOV) of 40 cm. Scan data were uploaded to the Mindways BMD workstation. QCT PRO analysis software (Mindways Software Inc., Austin, TX, USA) was used to automatically generate the ROI and calculated BMD measurements (mg/cm3) of each vertebral body (Fig. 3).

The region of interest in quantitative computed tomography.
Statistical analysis
One-way analysis of variance (ANOVA) was used to compare the scanning results of the 14 scanning parameter groups configured by GSCT. The difference between the measured values and actual values in the ESP were compared with one-sample t test. Quantitative data were described with
Relative error (RE) and relative standard deviation (RSD) were used to evaluate the accuracy and precision of ESP BMD measured by GSCT and QCT, respectively (15,16): RE = (measured value − true value)/true value × 100%; RSD = standard deviation/average value × 100%.
Results
All measurements are shown in Table 1. The measured values of the three inserts at different levels of exposure were statistically significant (P < 0.05). The radiation dose of GSCT at all scanning conditions was higher than that of QCT.
Spectral CT measurements under different scanning protocols and QCT measurements (sort by CTDIvol from lowest to highest).

Values are given as mean ± SD unless otherwise indicated.
CTDIvol, computed tomography dose index; HAP, hydroxyapatite; QCT, qualitative computed tomography.
The results of the statistical analysis are shown in Table 2. The measured values in the 0.7 s/r 260 mA group, 0.8 s/r 260 mA group, 0.5 s/r 630 mA group, and 0.6 s/r 640 mA group were not significantly different from the actual ESP values for L1 (50 mg/cm3), and the measured values in the 0.8 s/r 260 mA group, 0.5 s/r 630 mA group, and 0.6 s/r 640 mA group were not significantly different from the actual ESP values for L2 (100 mg/cm3). However, the measured values at all the parameters were significantly different from the actual ESP values for L3 (200 mg/cm3) (P < 0.05). In contrast, there was no statistical difference between the measured BMD values and the actual values in L3, while the measured values and the real values in L1 and L2 showed statistical difference in QCT.
Statistical results between the measurements and actual values.
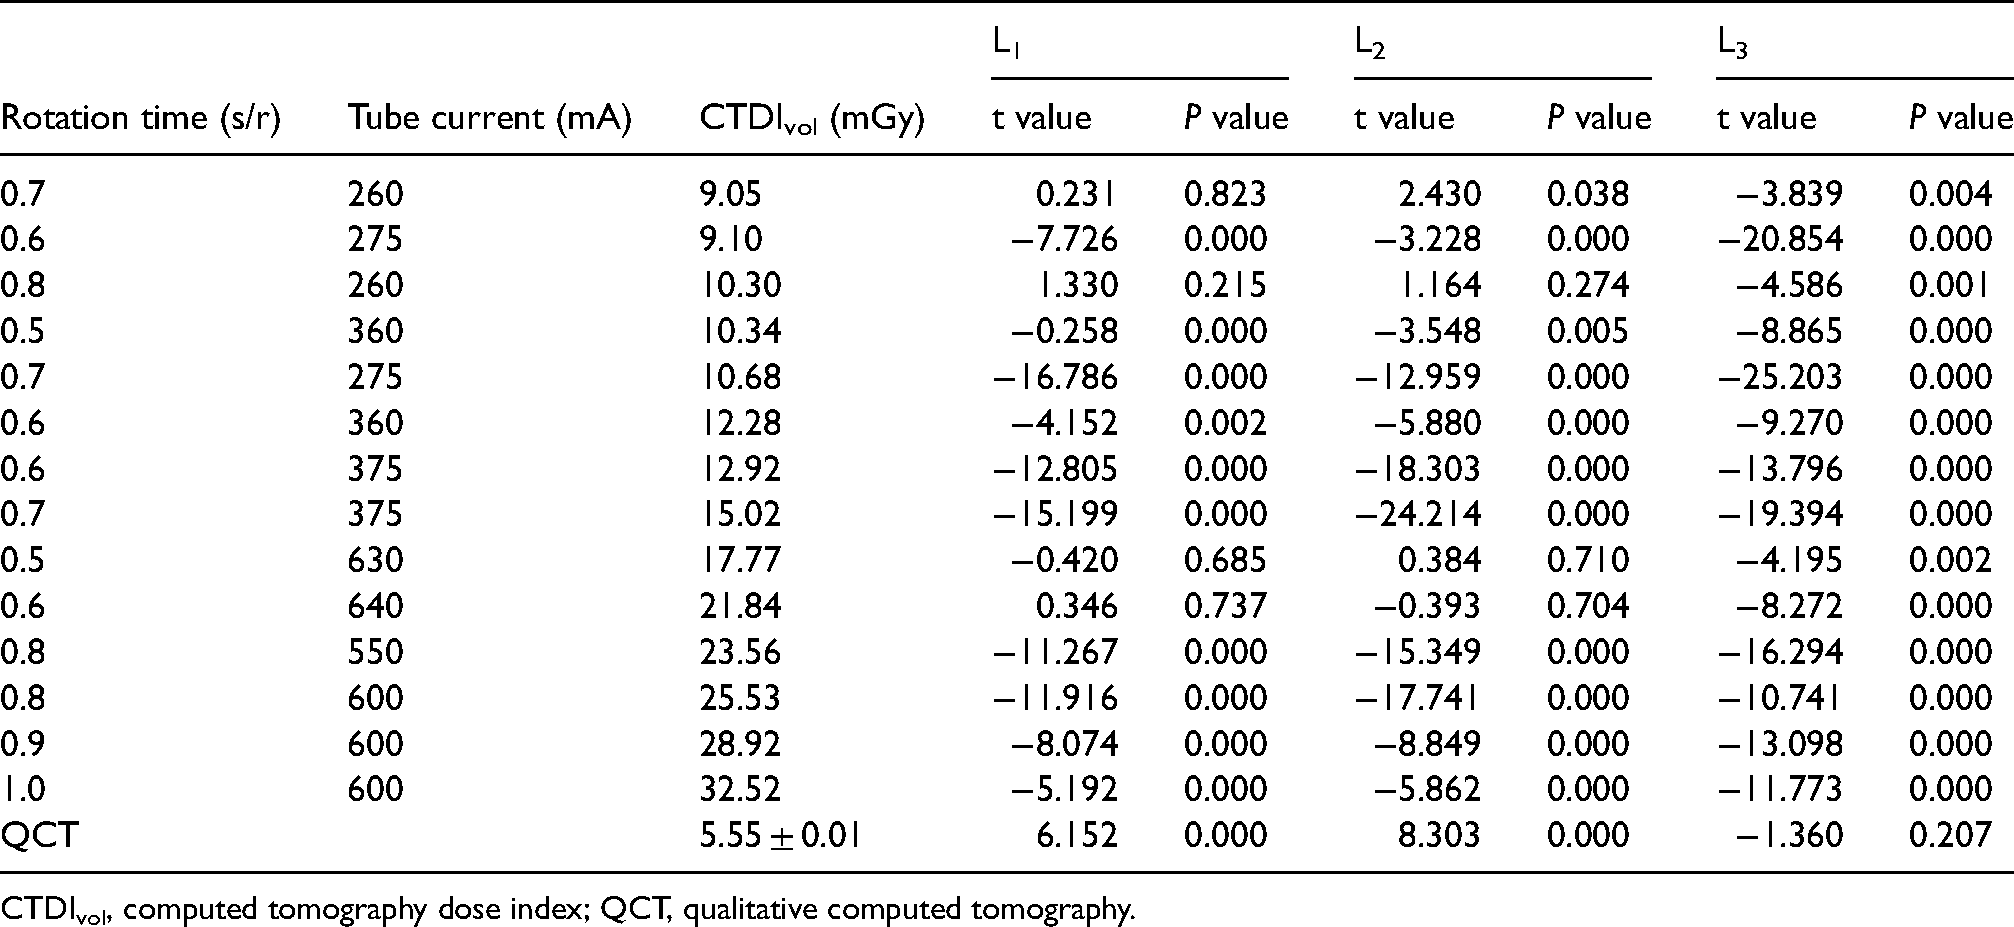
CTDIvol, computed tomography dose index; QCT, qualitative computed tomography.
The accuracy and precision of GSCT and QCT measurements are shown in Table 3. The accuracy and precision of ESP measured by GSCT vary greatly under different scanning protocols. When QCT was used to measure ESP BMD, RSD and RE decreased with the increase of vertebral BMD.
The accuracy and precision of spectral CT measurements under different scanning protocols and QCT measurements.
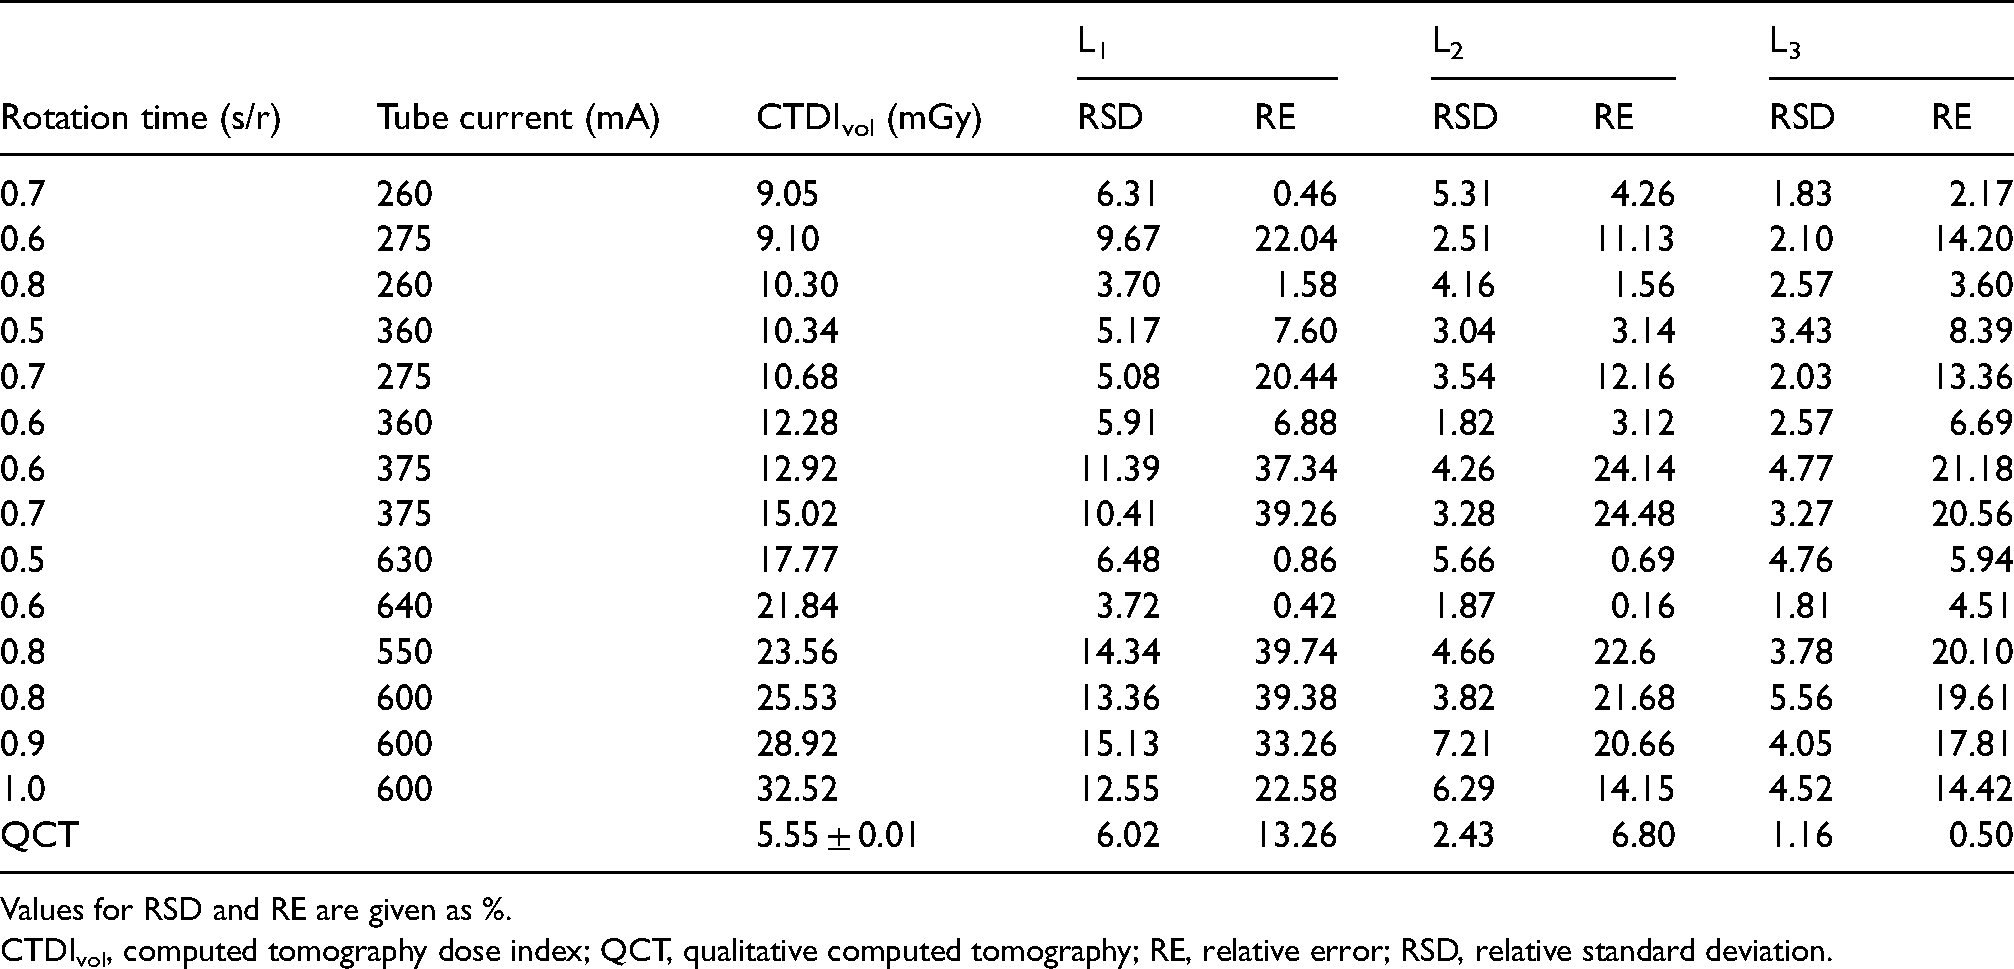
Values for RSD and RE are given as %.
CTDIvol, computed tomography dose index; QCT, qualitative computed tomography; RE, relative error; RSD, relative standard deviation.
Discussion
As early as in the 1980s, some researchers used dual-energy CT to evaluate BMD (17–19). However, limited by the technical conditions at that time, problems such as high radiation dose, long scanning time, slow imaging speed, and difficult postprocessing appeared. With medical device manufacturers introducing commercial CT with a spectral imaging function over the last decade or so, a number of studies have verified the feasibility of spectral CT to measure BMD by using substance separation technology. According to the study by Roski et al. (20), the measurements of the phantom scanned by spectral CT were on par with that of QCT, and spectral CT and QCT showed strong correlations in in vivo measurements (r = 0.987; P < 0.0001). Wesarg et al. (21) demonstrated that spectral CT allows for assessment and 3D display of spatial BMD distribution, facilitating a more detailed evaluation of focal bone solidity compared with DXA. Mei et al. (22) used spectral CT with a double-layer detector to measure BMD of the model with an error in the range of −1.3% to 4.8%, showing good consistency and correlation with QCT measurements (r = 0.987). Shao and Liu (23) compared the association of sex and age with the GSI-measured Ca2+-water density, and Yue et al. (24) investigate age-related change of Ca2+-water density of a chosen lumbar vertebra in adult women with spectral CT and the correlation between the Ca2+-water density and BMD of DXA. They all concluded that GSI could be used as a method of measuring the vertebral adult BMD.
In this study, when using appropriate scanning protocols to measure lower density vertebral bodies, such as using the 0.8 s/r 260 mA group, 0.5 s/r 630 mA group, and 0.6 s/r 640 mA group to measure 50 mg/cm3 and 100 mg/cm3 vertebral bodies, its measurement error is 0.16%–1.58%, and the difference between the measurement and the true value is not statistically significant. This indicates that BMD can be measured accurately by CT GSI material separation technology when scanning protocols and BMD of the object are appropriate.
Tube current and rotation speed are very important parameters in CT, which are closely related to the radiation dose received by patients. The radiation dose increases with the increase in tube current, and the longer it takes for the tube to rotate one round, the more information is collected and the higher the radiation dose. This study shows that the scanning parameters have a great influence on the measurements. The study by Wang et al. (25) showed that when the rotation time was 0.8 s/r and 1.0 s/r, there was a positive linear correlation between the measured iodine concentration and the real value, and the difference between the two values was not statistically significant. At 0.6 s/r, the error rate of iodine concentration measurement was larger in the low concentration range, while the error rate in the high concentration range was similar to that at 0.8 s/r and 1.0 s/r, which may be caused by the limited amount of data acquisition when the tube rotates fast, indicating that the lower the concentration, the longer the rotation time of the tube is needed to measure accurate information. When Van Hamersvelt et al. (26) found that the average measurement error would increase as the tube current decreased, he speculated that lowering the tube current decreases the number of photons emitted, thereby decreasing the number of photons that hit the detector, which could influence the accuracy of the mass attenuation coefficient across monochromatic energies and thereby the accuracy of BMD quantification; this view is consistent with that of Mei et al. (22). However, this study has not found that the measurement error increases with the decrease of tube current when other conditions remain unchanged. Therefore, the specific action rules of tube current and tube speed need to be studied further.
Although the use of the 0.8 s/r 260 mA group, 0.5 s/r 630 mA group, and 0.6 s/r 640 mA group could accurately measure the 50 mg/cm3 and 100 mg/cm3 vertebral bodies, the radiation dose of the 0.5 s/r 630 mA group and 0.6 s/r 640 mA group was significantly higher than that of the 0.8 s/r 260 mA group. Therefore, the scanning condition of 0.8 s/r 260 mA is recommended to measure BMD in GSCT. Under this condition, the accuracy of spectral CT in measuring ESP vertebral bodies with low BMD value is higher than that of quantitative CT. However, when measuring vertebral bodies with high BMD values, the accuracy is not as good as that of QCT. This suggests that there may be a certain threshold value for the measurement of BMD by spectral CT, and when the interval with high reliability is exceeded, the deviation of substance concentration may occur in the spectral quantitative analysis.
The measurement results of QCT showed that the greater the vertebral BMD of ESP, the better the measurement accuracy and precision; conversely, the lower the vertebral BMD, the greater the measurement error and the worse the precision. Since the BMD value of QCT for the diagnosis of low bone mass is in the range of 80–120 mg/cm3, the BMD value for the diagnosis of osteoporosis is <80 mg/cm3, which may suggest that QCT is more accurate in the normal population, while in the population with low bone mass and osteoporosis, the measurements may be higher than the true values.
In this study, the precision of spectral CT was worse than that of QCT, suggesting that the reproducibility of BMD measurement by spectral CT was slightly poor currently. The radiation dose of all scanning protocols of GSI was higher than that of QCT; even using the 0.8 s/r 260 mA scanning protocols, the radiation dose is nearly twice that of QCT. Therefore, it is only recommended for patients taking the BMD measurement together with routine clinical spine or abdominal CT examinations to avoid additional radiation.
The present study has some limitations. First, the study was only conducted using GSCT, and the optimal conditions obtained in this study may not be applicable for other CT models with spectral functions. Second, because of the need to scan repeatedly, only ESP was used in this study, of which the components are different from the actual components of human vertebral bodies; therefore, the optimal scanning conditions for the human body need to be further verified in more studies. Finally, the influences of tube rotation speed and tube current on the BMD measured by spectral CT were not clarified in this study.
In conclusion, the findings of this study showed that when the BMD of the materials to be measured was in the appropriate range, using appropriate scanning parameters could allow GSCT to correctly measure the BMD. When comprehensively considering the radiation dose, it is recommended to adopt the condition of 0.8 s/r 260 mA for the measurement of BMD when using GSCT.
Footnotes
Declaration of conflicting interests
The author(s) declared no potential conflicts of interest with respect to the research, authorship, and/or publication of this article.
Funding
The author(s) received no financial support for the research, authorship and/or publication of this article.