
Abstract
Background
Computed tomography (CT) can avoid interference factors and has been imported into some software to measure proptosis clinically as the golden standard.
Purpose
To establish a new method for semi-automatically measuring the proptosis on CT and evaluate its accuracy and reproducibility.
Material and Methods
A total of 50 orbital CT images were collected of healthy individuals, 25 patients with Graves ophthalmopathy (GO), and 25 patients with orbital fracture (OF). A new image processing software, MedrawHDC, was developed to semi-automatically measure the proptosis (MedrawHDC method). The classic radiological (CR) method (measuring proptosis with the software called Mimics) and MedrawHDC method were applied in all three groups (measured by observer S). Hertel's exophthalmometer (HE) method was also applied in the GO group. Moreover, two other observers were asked to measure the proptosis using MedrawHDC, to evaluate its reproducibility.
Results
The MedrawHDC method was highly consistent with the CR method in measuring proptosis (normal group: intraclass correlation coefficient [ICC] = 0.989; GO group: ICC = 0.979; OF group: ICC = 0.979). In the GO group, the value of proptosis measured by two radiological methods were consistent with that measured by the HE method (CR method: ICC = 0.703; MedrawHDC method: ICC = 0.697). Bland–Altman plots showed similar results. The measurements obtained by three observers were highly reproducible (ICC = 0.995).
Conclusion
The newly established MedrawHDC method, with high accessibility, convenience, and repeatability, is reliable in assessing proptosis. It shows high potential for wide application, having clinical value for scientific evaluation of proptosis.
Keywords
Introduction
Proptosis is a critical parameter to evaluate the relative position of the eyeball to the orbital rim. In some orbital diseases, such as Graves ophthalmopathy (GO), orbital fracture (OF), and cavernous hemangioma, it is widely used to assess the severity of the disease and whether surgery is needed. Hertel's exophthalmometer (HE) is the most common device used to measure the value, which is convenient and radiation-free. However, this method has insurmountable problems. First, there are diverse HE devices with various structures and based on different measuring principles, which affect the measurement of proptosis. In the study by Sleep et al., the different structures of the HE resulted in a difference of up to 3.2 mm in measurement while the accuracy of the HE measurement method was approximately 1 mm. In addition, it can be seen when the patient's proptosis differs >2 mm in the clinic (1). Moreover, the accuracy and repeatability of the HE method depends on the proficiency of the operator (2–5) and could be influenced by the location of the orbital margin and the thickness of soft tissue (6,7).
Therefore, computed tomography (CT) is used to measure proptosis and is considered the gold standard in some studies (8–10). The measurement on three-dimensional (3D) images is highly consistent with HE measurement and more reliable compared to that of two-dimensional (2D) images (11,12). In 2D CT measurements, the results will be affected due to the influence of eyeball displacement, or when the line between the corneal apex and bilateral canthus is not in the same plane. However, professional software often means high cost. Digital photography is a simple and non-invasive alternative method that has been used to assess proptosis; however, a study has demonstrated that compared to clinical HE exophthalmometry, this method has greater variance and lower correlation with the radiological tool (13). Conversely, many different methods have been applied to evaluate the radiology method based on 3D CT images, and almost all studies have arrived at a similar conclusion: that the radiology method is accurate and reproducible to measure proptosis and exhibited a high correlation with the HE method. Therefore, measurement on 3D images seems to be reliable. However, the 3D CT images should be input into the software, followed by a complex operation. The operator needs to reconstruct the 3D model and define the calculation method of proptosis, which is time-consuming and requires proficiency (9,14–21). Therefore, we developed semi-automatic software, which requires a simple operation and little training, with high generalizability. We evaluated its consistency with the clinical method and the CR method. At the same time, we compared the results of three observers to verify its reproducibility.
Material and Methods
This is a retrospective, observational, and analytical study with digital data collected from the database of our institution. Orbital CT images from 50 healthy individuals, 25 patients with GO, and 25 patients with OF were included in this study. The inclusion criteria of healthy individuals were as follows: (i) age ≥18 years; (ii) absence of previous ocular or orbital abnormalities; and (iii) no history of ocular or orbital operation. The inclusion criteria of patients with GO were as follows: (i) age ≥18 years; (ii) diagnosis of GO; and (iii) no history of ocular or orbital operation. The inclusion criteria of patients with OF were as follows: (i) age ≥18 years; (ii) diagnosis of OF without lateral wall damage; and (iii) no history of ocular or orbital operation. Low-quality images were excluded. This study protocol was approved by the ethics committee of Ninth People's Hospital, Shanghai Jiao Tong University School of Medicine (certificate no. SH9H-2019-T8-1).
Image set acquisition
All orbital CT scans were collected by a multislice CT scanner (LightSpeed 16; GE Medical Systems, Milwaukee, WI, USA); 16 × 1.25 mm slices were evaluated. The reconstructed thickness of the slice was 1.25 mm and the increment was 1.25 mm. All CT images were loaded in DICOM format.
Classic radiological exophthalmometry (CR method)
Several different methods have been reported to measure proptosis using CT (22–24). We chose a classic method that measured the distance between the plane of the cornea and the orbital rim after reconstruction (11,25,26). The CT images were imported into Mimics (Materialize, Leuven, Belgium) and a new coordinate system was defined to ensure the same measurement environment. The axial plane was redefined as the plane parallel to the Frankfurt plane. The sagittal plane passed through the midpoint of the nasion, sella turcica, and foramen magnum, while the coronal plane passed through the most posterior point of the lateral orbital rim.
Newly established radiological exophthalmometry (MedrowHDC method)
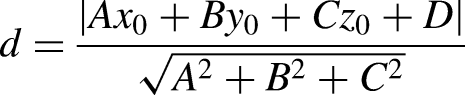
Herein, we developed a new image processing software called MedrawHDC to semi-automatically measure proptosis, according to the method described by Ji et al. (27). The right porion (PoR) and left porion (PoL) indicated the highest point of the right and left osseous external auditory canals, respectively. The right orbitale (OrR) and left orbitale (OrL) indicated the lowest point of the right and left orbits, respectively (PoR and OrR were not shown) (Fig. 1). The Frankfort plane could be determined as ax + by + cz + d = 0 (a, b, c, and d were known as constants) based on the coordinates of these four points. The horizontal reference plane (HRP), which was parallel to the Frankfort plane and passed the midpoint of the prechiasmatic groove (P (0, 0, 0)), was determined as ax + by + cz = 0. The median sagittal reference plane (MRP), which was perpendicular to HRP, and passed the concave point of nasofrontal suture (Na) and point P, was determined as gx + hy + iz + j = 0 (ag + bh + ci = 0). Next, the coronal reference plane (CRP), which was established as a plane passing point P and perpendicular to both HRP and MRP, was determined as αx + βy + γz = 0 (aα + bβ + cγ = 0, αg + βh + γi = 0). Subsequently, a reference plane X was defined as a plane parallel to CRP and passing through the lateral rim of both orbits determined as αx + βy + γz + d = 0. The coordinates of the bilateral centroid of eyeballs, (x0, y0, z0), (x1, y1, z1), could be obtained by using two standard spheres to indicate the position and size of the eyeball. Finally, the proptosis could be calculated as the sum of the half axial length and the distance (d) between the centroid of the eyeball and plane X as the following equation:

The critical points are marked on computed tomography. (a) Three-dimensional model. (b) The horizontal plane. (c) The sagittal plane. (d) The coronal plane.
The operation of this software included five steps. First was to import the DICOM data into MedrawHDC. Second was to reposition the images (Fig. 2a). The yellow detection area was adjusted to the appropriate range. Three anatomical landmarks of cockscomb, foramen magnum center, and occipital eminence should be on the same horizontal plane. The external auditory meatus on both sides and the lower edge of the left orbital should be on the same sagittal plane. Third was to reconstruct the images, and then the quality control procedure started to activate and showed whether the correction of the position is completed adequately (Fig. 2b). If not, the program would return to the second step. Fourth was to mark the positioning points mentioned above (Fig. 1) and draw two spheres to represent the eyeballs (Fig. 2c and d). Finally, the value of proptosis could be output automatically.

(a) Repositioning of the 3D orbital model. (b) Quality-control procedure to verify whether the position is correct. (c) Acquisition of the positioning points by dragging the corresponding green points. (d) Identification of the size and location of the eyeball.
Clinical exophthalmometry (HE method)
The examination was performed in the primary position with the patients in a standing position. The operator ensured that his eyes were at the same horizontal plane as those of the patients while reading the value. All the measurements were carried out twice to obtain the mean value.
Statistical analysis
The statistical analysis and statistical mapping were performed using SPSS version 25.0 (IBM Corp., Armonk, NY, USA) and Medcalc version 15.2.2 (MedCalc Software Ltd, Ostend, Belgium). The data collected from the three different methods (HE, CR, and MedrawHDC method) were compared with paired t-tests. Intraclass correlation coefficients (ICC) and Bland–Altman plots were used to estimate the consistency. The Bland–Altman graph is a 2D scatter plot. Each point in the graph corresponds to a measurement object, with the abscissa of the point being the average of the two measurement results of the object, and the ordinate being the difference between the two measurement results. The limits of agreement (LOA) value represents 1.96 × standard deviation, and the point between two LOA values is within the 95% consistency limit. The level of statistical significance was set at 5% (P < 0.05). ICC was used to evaluate the consistency of the proptosis values measured by three observers.
Results
We compared the value of proptosis measured by three methods. Table 1 showed the value of measurement using the mean ± standard deviation (SD).
Proptosis measured using three methods in three groups.
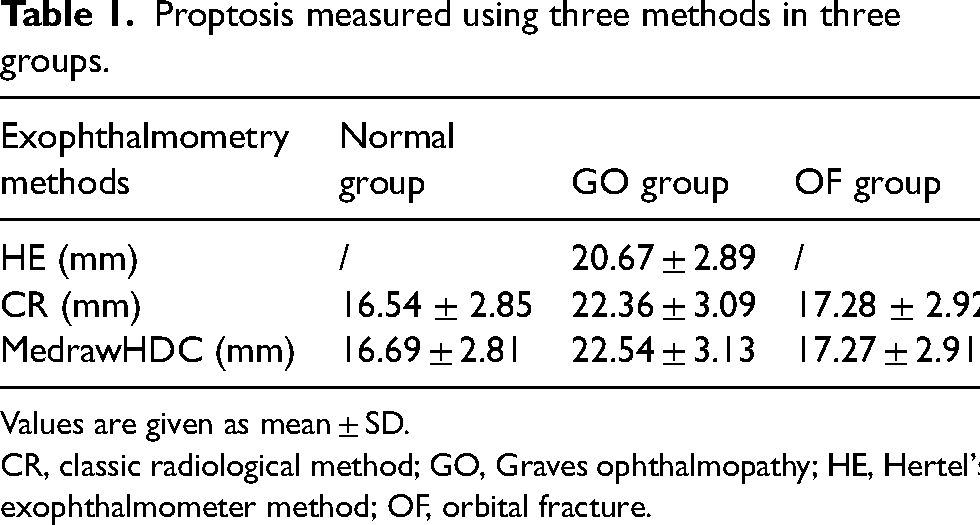
Values are given as mean ± SD.
CR, classic radiological method; GO, Graves ophthalmopathy; HE, Hertel's exophthalmometer method; OF, orbital fracture.
In the normal group, the proptosis measured using the MedrawHDC method was higher than that measured by the CR method (t = 3.712, P < 0.001). Nevertheless, a good correlation was established between them with a high ICC value of 0.989. On the Bland–Altman plot, LOA was −0.9 and 0.6 mm, representing high consistency (Fig. 3).

(a) Correlation of proptosis measured by the CR and MedrawHDC methods in the normal group. (b) Bland–Altman plot comparing proptosis in the normal group. CR, classic radiological.
In the GO group, the proptosis measured using either the CR method (t = −6.505, P < 0.001) or the MedrawHDC method (t = 7.527, P < 0.001) was higher than that measured using the HE method. Although there was a difference between the CR method and MedrawHDC method measured on CT (t = 2.123, P = 0.039), a high consistency was established (ICC = 0.979). The CR method had a high ICC value of 0.703 with the HE method and the MedrawHDC method had an ICC value of 0.697 with the HE method. On the Bland–Altman plot, the LOA were −1.6 mm and 5.3 mm in the MedrawHDC method versus the HE method. Simultaneously, the LOA were −1.9 mm and 5.3 mm in the CR method versus the HE method (Fig. 4). It could be seen that the two radiological methods were consistent with the HE method.
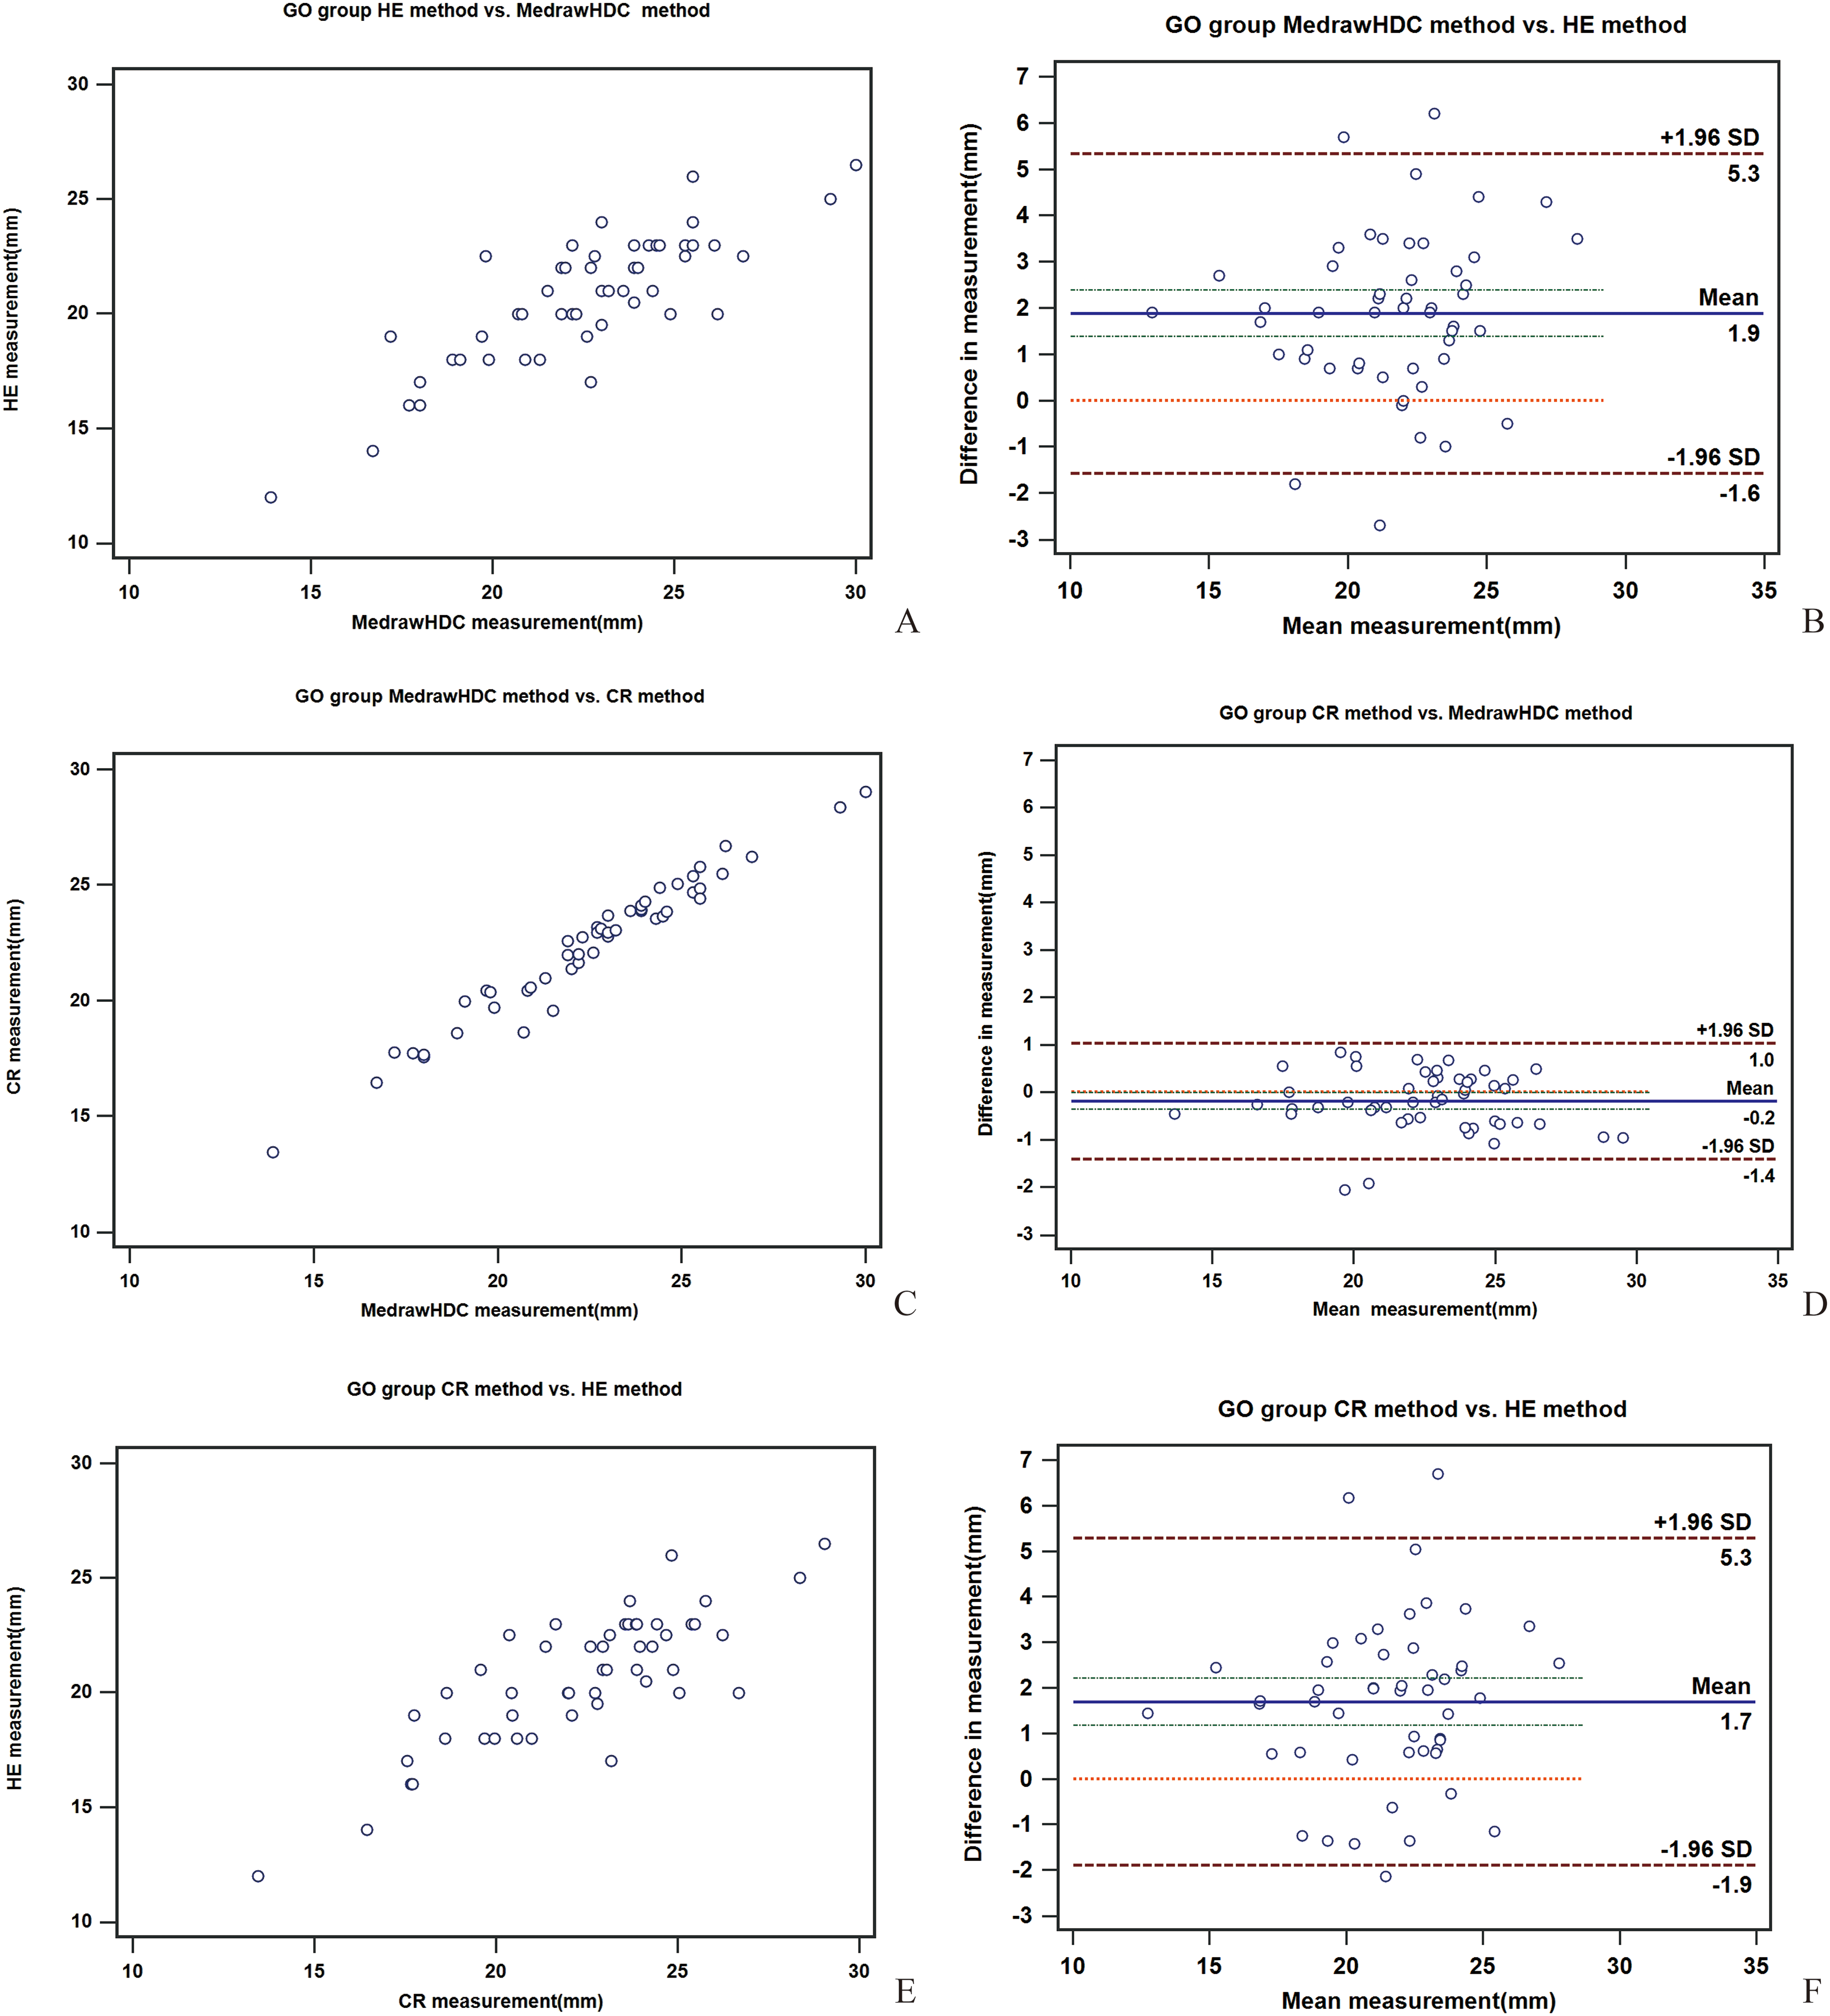
(a, b) Correlation and Bland–Altman plots among proptosis measured using the HE and MedrawHDC methods in the GO group (c, d) Correlation and Bland–Altman plots among proptosis measured using the MedrawHDC and CR methods in the GO group (e, f) Correlation and Bland–Altman plots among proptosis measured using the CR and HE methods in the GO group. CR, classic radiological; GO, Graves ophthalmopathy; HE, Hertel’s exophthalmometer.
In the OF group, the proptosis measured using the MedrawHDC method showed no difference from that measured by the CR method (t = −0.131, P = 0.896). Nevertheless, a good correlation was established between them with a high ICC value of 0.979. On the Bland–Altman plot, LOA was −1.2 and 1.2 mm, representing high consistency (Fig. 5).
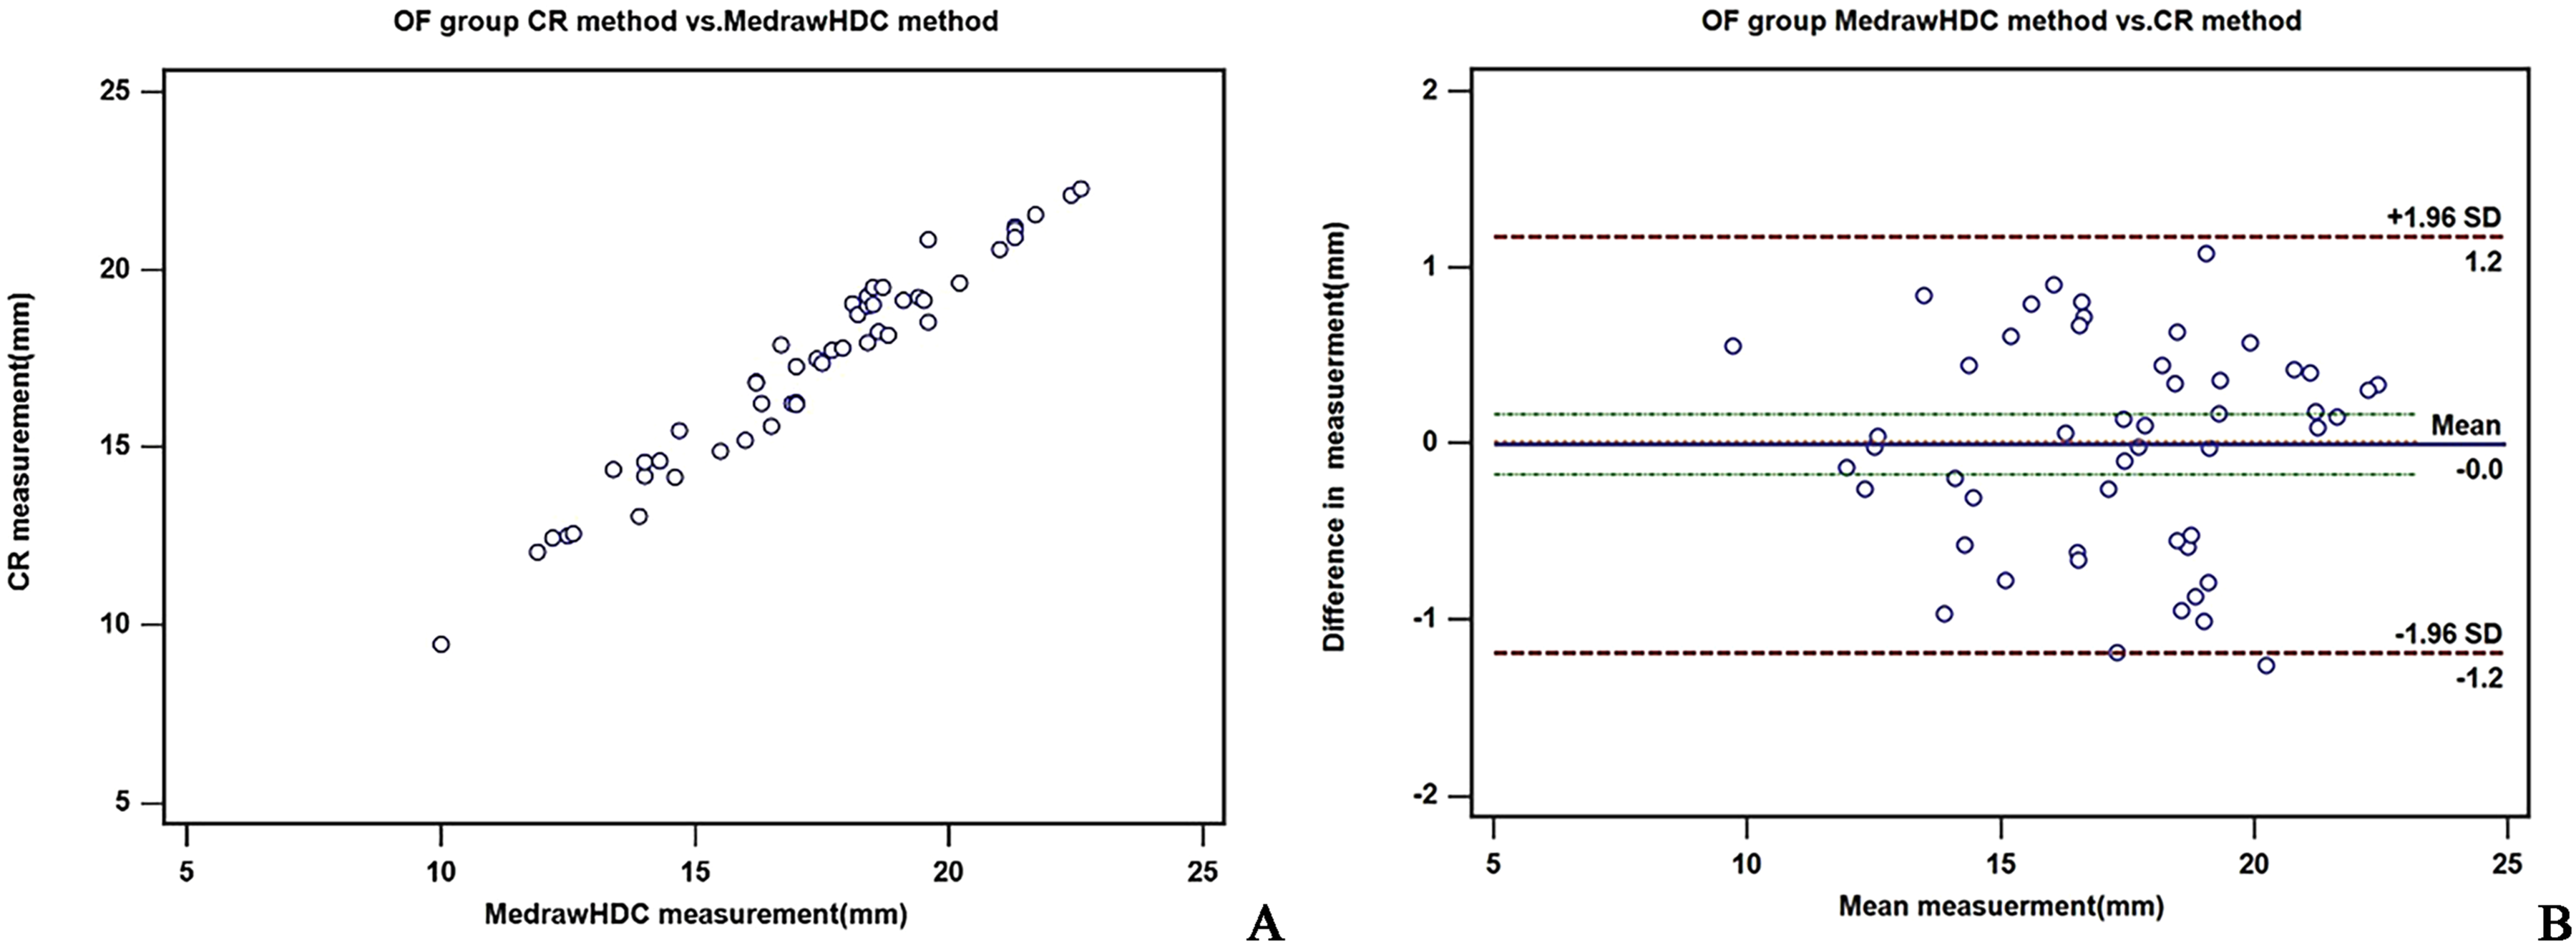
(a) Correlation of proptosis measured using the CR and MedrawHDC methods in the OF group. (b) Bland–Altman plot comparing proptosis in OF group. CR, classic radiological; OF, orbital fracture.
Moreover, we analyzed the proptosis measured by the three observers (S, F, and H) using the MedrawHDC method. We found that a good correlation was established among them with a high ICC value of 0.995 (normal group: ICC = 0.989; GO group: ICC = 0.993; OF group: ICC = 0.996), which showed the reproducibility of this newly established software.
Discussion
Proptosis is a significant way of diagnosing some orbital diseases and evaluating their severity and surgical indications. As mentioned above, the HE method of measuring proptosis is still the most common method used in clinic due to the popularization of equipment, simplicity of use, and being radiation-free, but the HE method has individual difference and poor repeatability, reducing the accuracy and credibility of the value (13).
The radiological method is considered to be more repeatable and less affected by objective factors than HE method, and hence, is applied in many diseases with enophthalmos or exophthalmos (28–30). As for the radiation of CT, the amount per measurement is generally ∼28 mgy, which does little harm to the human body. Although the measurement on CT is an optimal choice for measuring proptosis, specific software is not yet available. Therefore, clinicians have to master non-specific software used for general purposes and define the calculation method for measuring proptosis. In addition, software, such as Mimics 16.0, is relatively expensive, at approximately US$120,000. Other software, such as iPlan, was applied to measure proptosis but with poor popularity (11). They also have problems, such as strong professionalism and difficult to operate, which also creates an obstacle to the popularization of the CT method for measuring proptosis. The aim of the present study was to develop new and specific software for measuring proptosis, which only needs a short training time and is easy to operate. To overcome the subjective influence while defining proptosis by measuring the distance between the surface of the cornea and the orbital rim, we chose an objective way to measure the distance between the centroid of the eyeball and the “coronal reference plane.”
Currently, we found that the MedrawHDC method was highly consistent with the CR method in measuring exphthalmos of the healthy individuals and patients with GO and OF, which showed that the increase or decrease of proptosis would not affect the consistency between the two radiological methods. The mean difference between proptosis measured by two radiological methods was 0.15 ± 0.4 mm (range = −0.66 to 1.32 mm) in the normal control group, −0.01 ± 0.6 mm (range = −1.26 to 1.08 mm) in the OF group, and 0.19 ± 0.62 mm (range = −0.85 to 2.06 mm) in the GO group. Therefore, we thought that even if there was a statistical difference in the proptosis values obtained from two radiological measurements in the normal and GO groups, their values were too small to have clinical significance and could be ignored. Therefore, the CR and MedrawHDC methods could basically replace each other, and the error between the obtained values was small. In our study, it can be seen that most of the points in the Bland–Altman plots comparing proptosis measured by two radiological methods were within the 95% consistency limit in the normal, GO, and OF groups, with a minimum LOA value of −1.4 mm and a maximum of 1.2 mm. The maximum difference is clinically acceptable. In clinical practice, considering different measurement principles and the subjective impact of repeated measurements, a difference of <2 mm is acceptable by using two measurement methods. Therefore, we believe that these two methods have good consistency and can be replaced with each other. However, in the GO group, when comparing two radiological methods with the clinical method, the LOA values were 5.3, −1.9 mm and 5.3, −1.6 mm; although most points were still within the 95% consensus limit, the difference exceeded the clinical acceptance range. We identified the CT images corresponding to the points with significant differences and found that their soft tissue swelling was very severe or very thin at the orbital margin. In clinical practice, HE cannot be placed close to the lateral orbital margin when measuring patients with severe GO with orbital soft tissue swelling and eyelid edema, and the patient may be unable to open their eyes due to compression. Therefore, we believe that although using HE to measure proptosis is convenient and radiation-free, it is greatly affected by the thickness of soft tissue at the orbital margin. Radiological measurement methods can be unaffected by this and obtain more stable and reliable data. Therefore, we thought the MedrawHDC software was a reliable method for practical application. At the same time, we also verified the high reproducibility of the software due to the high consistency of the value of proptosis measured by three different observers, which demonstrated that MedrawHDC could be applied widely in clinic.
Nowadays, artificial intelligence (AI)-related image interpretation has made significant progress. However, in the field of orbit, only one study reporting the automatic recognition of the orbital fracture has been published (31). As a large disease category, the reason for such few related studies is the lack of a usable database for AI instead of the absence of cases or digital data. In the clinical study, the accuracy and repeatability of the primary endpoint determine the quality of the study. The MedrawHDC method avoids the limitation of timeliness when using the HE method. Moreover, a related database can be set up. Our group has established a method for the automatic calibration of orbital CT images (32), based on which MedrawHDC effectuates the transformation from data verification to accurate numerical output.
The present study has some limitations. Our MedrawHDC method should be applied to other related diseases to verify whether this newly developed software is suitable for all diseases with enophthalmos or exophthalmos. Moreover, it should be confirmed that the training time for the MedrawHDC method is shorter than with other software, such as Mimics. In the follow-up study, we plan to randomly distribute several volunteers with no experience in measuring proptosis on CT to learn MedrawHDC and other non-specialized software. After systematic training, we can evaluate the accuracy and duration of the operation. Moreover, CT is used to measure other orbital parameters, such as global position, globe area, and orbital area (33–35). The digital images have also been utilized to assess the eyelid position, mediopupilar aperture, lateral height, and distance from the iris edge to the lateral boundary of the palpebral fissure (36,37). This technique can be used in clinical practice, as well as research in radiomics and image quality assessment (38–41). Therefore, our newly established software can be further improved to output other orbital data.
In conclusion, we found that our MedrawHDC method has high consistency with the HE and CR method. Its high accessibility, convenience, and repeatability also renders its potential for wide application. Currently, this software could be utilized to measure proptosis. In the future, it could be further improved to measure relevant parameters by total automation.
Footnotes
Acknowledgements
Thanks to Yingwei Medical Technology (Shanghai) Co., Ltd. for providing us with technical support in developing software MedrawHDC.
Declaration of conflicting interests
The author(s) declared no potential conflicts of interest with respect to the research, authorship, and/or publication of this article.
Funding
The author(s) disclosed receipt of the following financial support for the research, authorship, and/or publication of this article: This work was supported by the Shanghai Key Clinical Specialty, Shanghai Eye Disease Research Center (grant no. 2022ZZ01003).