



Abstract
Background
Dynamic contrast-enhanced magnetic resonance imaging (DCE-MRI) with an extended Tofts linear (ETL) model for tissue and tumor evaluation has been established, but its effectiveness in evaluating the pancreas remains uncertain.
Purpose
To understand the pharmacokinetics of normal pancreas and serve as a reference for future studies of pancreatic diseases.
Material and Methods
Pancreatic pharmacokinetic parameters of 54 volunteers were calculated using DCE-MRI with the ETL model. First, intra- and inter-observer reliability was assessed through the use of the intra-class correlation coefficient (ICC) and coefficient of variation (CoV). Second, a subgroup analysis of the pancreatic DCE-MRI pharmacokinetic parameters was carried out by dividing the 54 individuals into three groups based on the pancreatic region, three groups based on age, and two groups based on sex.
Results
There was excellent agreement and low variability of intra- and inter-observer to pancreatic DCE-MRI pharmacokinetic parameters. The intra- and inter-observer ICCs of Ktrans, kep, ve, and vp were 0.971, 0.952, 0.959, 0.944 and 0.947, 0.911, 0.978, 0.917, respectively. The intra- and inter-observer CoVs of Ktrans, kep, ve, vp were 9.98%, 5.99%, 6.47%, 4.76% and 10.15%, 5.22%, 6.28%, 5.40%, respectively. Only the pancreatic ve of the older group was higher than that of the young and middle-aged groups (P = 0.042, 0.001), and the vp of the pancreatic head was higher than that of the pancreatic body and tail (P = 0.014, 0.043).
Conclusion
The application of DCE-MRI with an ETL model provides a reliable, robust, and reproducible means of non-invasively quantifying pancreatic pharmacokinetic parameters.
Keywords
Introduction
The concept of dynamic magnetic resonance imaging (MRI) after contrast-agent injection was proposed in the mid-1980s as a way to measure the impact of tissue perfusion and capillary permeability on the changes in the signal produced by the agent (1,2). This type of MRI technique can be used to non-invasively assess normal or diseased tissue perfusion and micro-vessel permeability through qualitative, semi-quantitative and quantitative methods (3–5). By incorporating arterial input function (AIF) and pharmacokinetic models, quantitative dynamic contrast-enhanced MRI (DCE-MRI) has been shown to be superior to qualitative or semi-quantitative methods in accurately acquiring pharmacokinetic parameters (6). However, differences in AIF and pharmacokinetic models can affect the reliability and reproducibility of DCE-MRI pharmacokinetic parameters (7–9). Of the available pharmacokinetic models, the extended Tofts linear (ETL) model, as a representative of a two-compartment model, can be recommended for quantitative assessment of physiological and pathological features and has produced reliable results (8,10). The pancreas is a crucial digestive organ that can develop various neoplastic and non-neoplastic lesions (11,12). Accurate evaluation of the pancreas using DCE-MRI is helpful in diagnosis and differential diagnosis. However, the pancreas is susceptible to respiratory motion and gastrointestinal peristalsis, and it needs to be further explored whether the pancreatic pharmacokinetic parameters derived from DCE-MRI with ETL model are robust.
The pancreas is divided into the head, body, and tail, and each region has a different blood supply source (13). In addition, the ratio of pancreatic parenchyma can vary with age due to changes in atrophy and fat replacement (14). Certain pancreatic tumors also tend to be sex-specific. In the past, studies using DCE-MRI to assess pancreatic lesions have used adjacent non-lesioned tissue on the same patient or healthy controls as a reference (15,16). However, these previous studies have neglected to consider the impact that different pancreatic regions, age, and sex may have on the pharmacokinetic parameters obtained through DCE-MRI. It is important to understand if these parameters are consistent across different pancreatic regions, age groups, and sexes before conducting further studies on pancreatic disease or selecting a control group.
Thus, the aim of the present study was to examine the reliability and reproducibility of pancreatic pharmacokinetic parameters obtained from DCE-MRI with an ETL model. In addition, we investigate the relationship between pancreatic DCE-MRI parameters and three factors (pancreatic region, sex, and age) to provide a reference for future study of pancreatic disease and selection of normal control groups.
Material and Methods
This study was conducted in compliance with the 1964 Helsinki Declaration and its subsequent amendments or comparable ethical standards. The study was approved by the ethics committee of the AAA Hospital of Air Force Military Medical University. Informed consent was obtained from all participants before collecting information. Data were analyzed and interpreted by the authors. All the authors reviewed the manuscript and vouch for the accuracy and completeness of the data and for the adherence of the study to the protocol.
Participants
For this study, 66 volunteers were recruited between May 2021 and February 2022. To be eligible, participants needed to meet the following inclusion criteria: age >18 years; healthy and with normal pancreatic function; and no disease influencing pancreas. The exclusion criteria included common exclusion criteria for MRI scans and the use of Gd-related contrast agent, individuals with atherosclerotic disease influencing AIF, and poor DCE-MRI image quality. Poor image quality is defined as severe motion artifacts appearing in enhanced MRI scans and thus cannot be used for further evaluation. Out of 66 volunteers, four were excluded due to poor image quality and eight due to atherosclerosis, resulting in a final cohort of 54 participants.
All participants were divided into three groups owing to pancreatic region: pancreatic head (n = 54); body (n = 54); and tail (n = 54). Then, they were divided into three age groups: young (18 < age ≤ 40 years, median age = 31 years, n = 18), middle-aged (40 < age ≤ 60 years, median age = 52 years, n = 18), and old-aged (age > 60 years, median age 68 years, n = 18); and two additional groups based on sex: male (n = 29) and female (n = 25).
MRI protocol
Before MR scanning, participants were requested to fast at least 4 h. MR images of the pancreases were acquired on a whole-body 3.0 T MR scanner (Discovery MR750; GE Medical Systems, Chicago, IL, USA) with an eight-channel phased-array torso coil. Using variable flip angle T1 mapping, pre-contrast three-dimensional (3D) spoiled gradient recalled echo sequence series were performed with flip angles of 3°, 6°, 9°, and 12°. Other imaging parameters of T1 mapping were set as follows: repetition time (TR) = 3.2 ms; echo time (TE) = 1.5 ms; slice thickness = 4 mm; matrix = 260 × 160; and field of view (FOV) = 360 × 360 mm. Then, DCE-MRI scans were performed using a 3D fast spoiled gradient recalled echo sequence for liver acquisition with volume acceleration (LAVA) with the following parameters: TR = 3.2 ms; TE = 1.5 ms; flip angle = 12°; FOV = 360 × 360 mm; matrix = 260 × 160; slice thickness = 4 mm; and bandwidth = 83.33 KHz. It took 240 s to complete the DCE-MRI scanning with 40 phases acquired and 6 s for each phase. After three pre-contrast phases were obtained, 0.1 mmol/kg of gadodiamide (Omniscan; GE Healthcare Co., Ltd, Shanghai, PR China) was administrated with a venous cannula at a rate of 2 mL/s followed by a 20-mL saline flush at the same rate.
Data processing
The DCE-MRI scans were postprocessed using Markov random fields (MRF) 3D non-rigid registration algorithms to correct motion artifacts. The images were then transmitted to a workstation for quantitative analysis using DCE-MRI OK software package (Omni Kinetics, Version 2.00; GE Healthcare Co., Ltd). The analysis process has the following steps. First, the individual AIF was obtained from a region of interest (ROI) in the abdominal aorta. Second, ROIs were manually drawn on pancreatic enhanced images on multiple slices without reaching the perimeter to avoid partial volume effect, meanwhile without inclusion of vessel and main pancreatic duct. Finally, the ETL model (7,11) was used to calculate the quantitative parameters: Ktrans (volume transfer constant); kep (interstitium-to-plasma rate constant); ve (interstitial volume); and vp (plasma volume). The mean of each parameter in the ROIs was used for statistical analysis.
The first observer (Weiwei Zhao) measured DCE-MRI pharmacokinetic parameters thrice (by a time interval of at least one week to eliminate memory effect) to evaluate intra-observer reproducibility. Then, each of the three observers (observer 1, Weiwei Zhao; observer 2, Zhiyong Quan; and observer 3, Chenxi Liu) measured the parameters once to examine inter-observer reproducibility.
Statistical analyses
Intra- and inter-observer differences in pharmacokinetic parameters
Intra- and inter-observer differences were evaluated using one-way analysis of variance (ANOVA). Intra- and inter-observer agreements of pharmacokinetic parameters were evaluated using the inter-class correlation coefficient (ICC). Agreement was defined as good (ICC > 0.75), moderate (ICC = 0.5–0.75), or poor (ICC < 0.5). Coefficients of variation (CoV) were computed as the proportion of the standard deviation of the mean (standard deviation/mean, expressed as a percentage). For CoVs concerning the intra-observer variability, standard deviation was computed over three measurements by one observer. For CoVs describing the inter-observer variability, standard deviation was computed over each parameter obtained by all three observers.
Differences of pharmacokinetic parameters among different region, age, and sex groups
The Shapiro–Wilk test was used for the normality distribution test. If the data conformed to the normal distribution, a one-way ANOVA test and independent two-sample t-test were used to evaluate the differences between the pancreatic pharmacokinetic parameters obtained by observer 1. The former test was performed to evaluate the differences of pancreatic pharmacokinetic parameters among different pancreatic regions and different age groups; the latter was used to exam the differences of parameters between male and female groups.
All statistical analyses were performed using SPSS software version 20.0 (IBM Corp., Armonk, NY, USA). P < 0.05 was considered to indicate a statistically significant difference.
Results
Graphs of AIF, time-intensity curve (TIC), and images of quantitative parameters were achieved in all 54 participants. A series of representative graphs of a volunteer were shown in Fig. 1.

Images of a participant showing the process of DCE-MRI quantitative analysis. (a) Enhanced image showing the drawing of ROIs when calculating AIF and TIC; (b) graphs of AIF and TIC of relevant ROIs in panel a; (c) Ktrans image; (d) kep image; (e) ve image; and (f) vp image. AIF, arterial input function; DCE-MRI, dynamic contrast-enhanced magnetic resonance imaging; ROI, region of interest; TIC, time-intensity curve; Ktrans, volume transfer constant; kep, contrast transfer rate constant; ve, extravascular extracellular space volume fraction; vp, plasma volume fraction.
Intra- and inter-observer assessment for pharmacokinetic parameters
There were no statistically significant intra- or inter-observer differences for Ktrans, kep, ve, and vp (all P > 0.10) (Table 1).
Pancreatic pharmacokinetic parameters of DCE-MRI and intra- and inter-observer difference analysis.
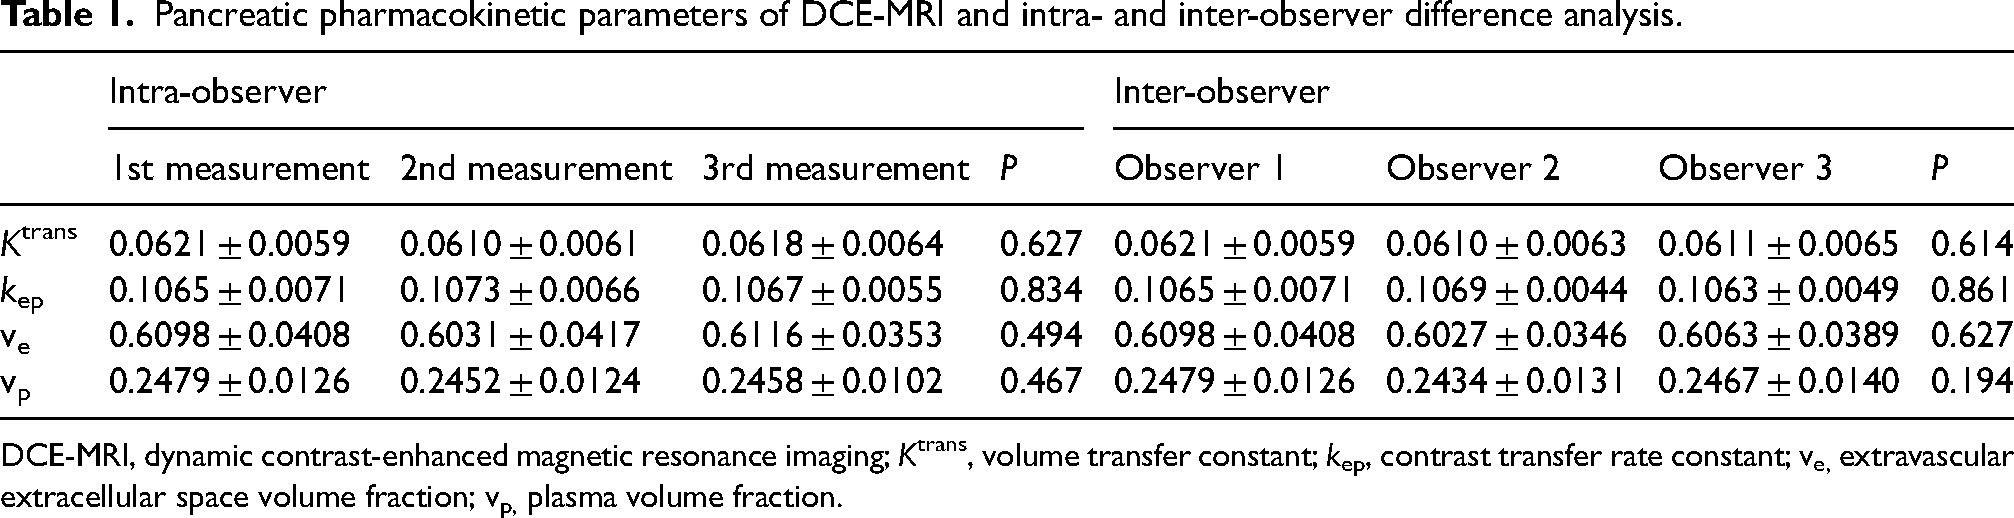
DCE-MRI, dynamic contrast-enhanced magnetic resonance imaging; Ktrans, volume transfer constant; kep, contrast transfer rate constant; ve, extravascular extracellular space volume fraction; vp, plasma volume fraction.
Agreement analysis: The intra- and inter-observer ICCs of Ktrans, kep, ve, and vp were 0.971, 0.952, 0.959, 0.944 and 0.947, 0.911, 0.978, 0.917, respectively. They were all greater than 0.90, which indicated excellent agreement (all P < 0.001) (Table 2).
Agreement analysis on pancreatic pharmacokinetic parameters of DCE-MRI.
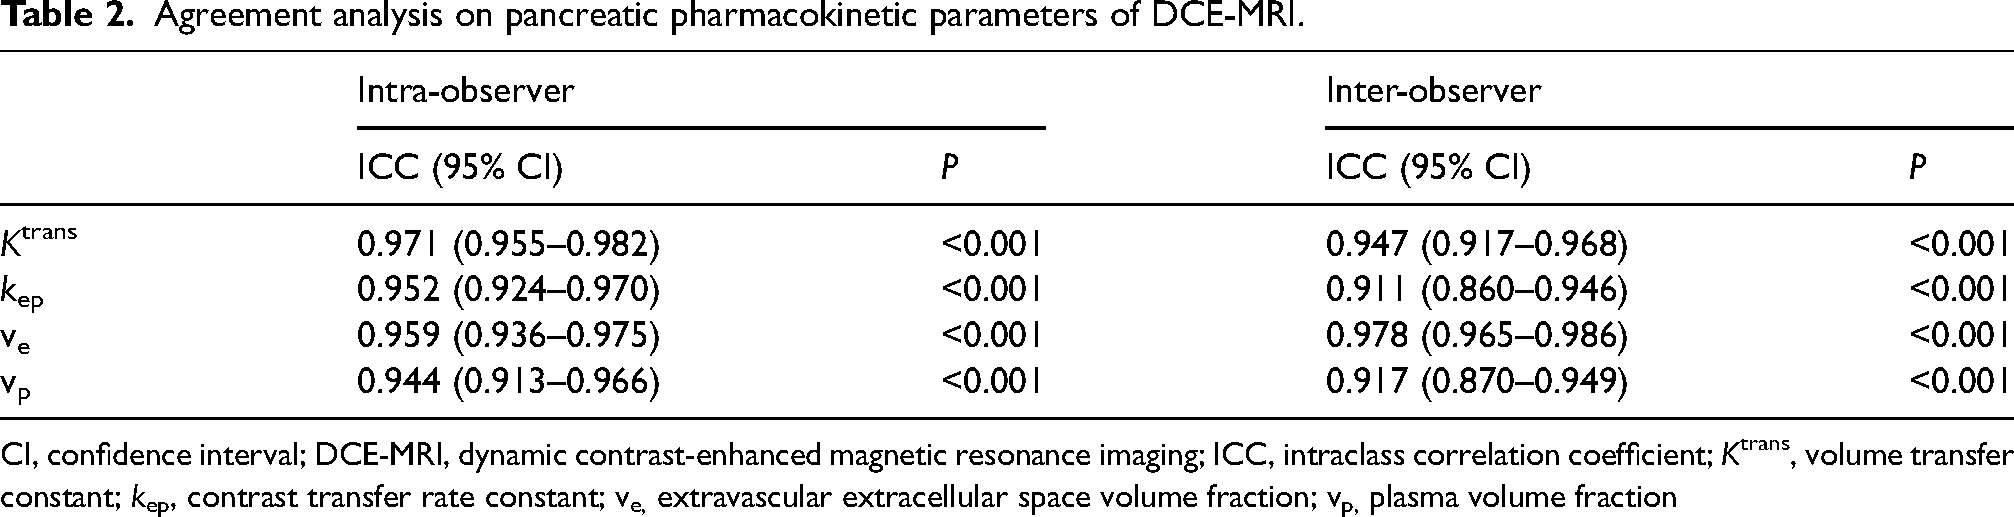
CI, confidence interval; DCE-MRI, dynamic contrast-enhanced magnetic resonance imaging; ICC, intraclass correlation coefficient; Ktrans, volume transfer constant; kep, contrast transfer rate constant; ve, extravascular extracellular space volume fraction; vp, plasma volume fraction
Variability analysis: In both the intra- and inter-observer analyses, the CoVs of Ktrans, kep, ve, and vp were 9.98%, 5.99%, 6.47%, 4.76% and 10.15%, 5.22%, 6.28%, 5.40%, respectively. They showed small variation (all CoVs <10%), except for the CoV of Ktrans in the inter-observer analysis (but only 10.15%) (Fig. 2).

Intra-observer and inter-observer variability analyses. (a) The intra-observer and (b) inter-observer CoV (%) values of Ktrans, kep, ve, and vp. All data are presented as means and 95% confidence intervals. CoV, coefficient of variation; Ktrans, volume transfer constant; kep, contrast transfer rate constant; ve, extravascular extracellular space volume fraction; vp, plasma volume fraction.
Differences of pharmacokinetic parameters among different region, age, and sex groups
There were no significant differences of Ktrans, kep, and ve among different pancreatic regions; the P values were all >0.10. However, vp of the pancreatic head was significantly higher than that of the pancreatic body and tail (P = 0.014, 0.043) (Table 3).
Comparison of pancreatic pharmacokinetic parameters among different pancreatic regions.
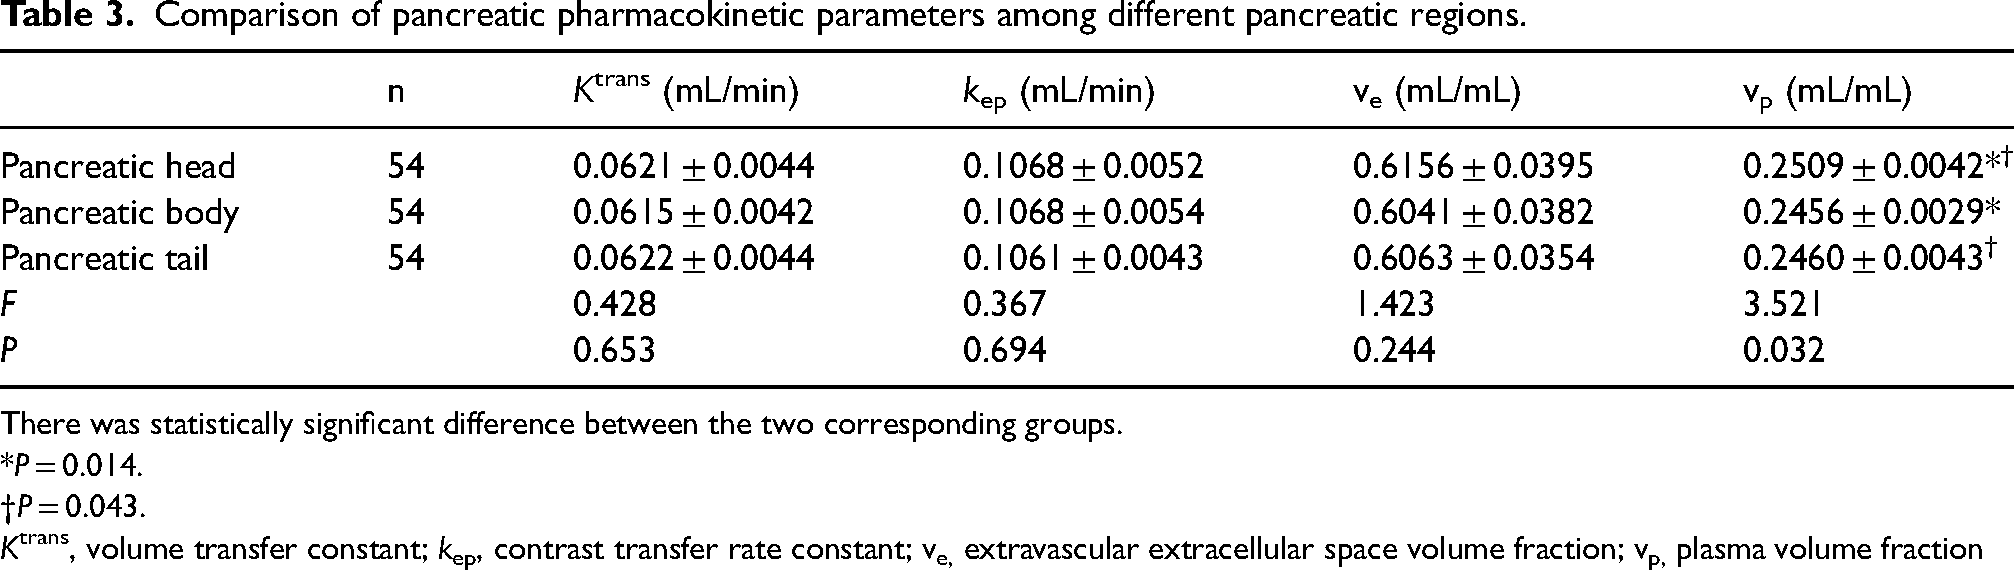
There was statistically significant difference between the two corresponding groups.
*P = 0.014.
P = 0.043.
Ktrans, volume transfer constant; kep, contrast transfer rate constant; ve, extravascular extracellular space volume fraction; vp, plasma volume fraction
There were no significant differences to Ktrans, kep, and vp among different age groups; the P values were all >0.10. However, the pancreatic ve of the old group was higher than that of the young and middle-aged groups (P = 0.042, 0.001) (Table 4).
Comparison of pancreatic pharmacokinetic parameters among different age groups.
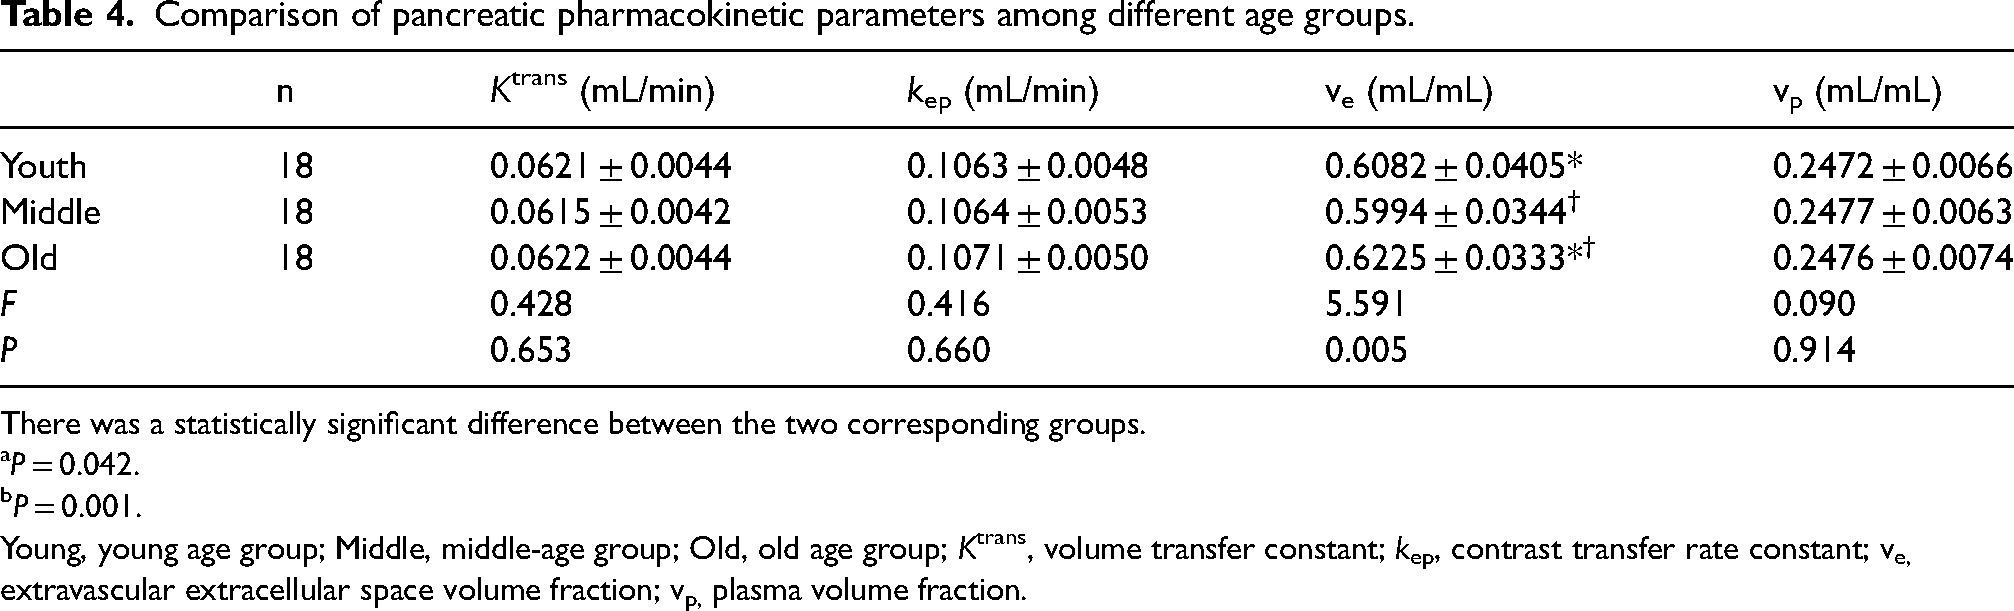
There was a statistically significant difference between the two corresponding groups.
P = 0.042.
P = 0.001.
Young, young age group; Middle, middle-age group; Old, old age group; Ktrans, volume transfer constant; kep, contrast transfer rate constant; ve, extravascular extracellular space volume fraction; vp, plasma volume fraction.
There were no significant differences to Ktrans, kep, ve, and vp between the male and female groups; the P values were all >0.10 (Table 5).
Comparison of pancreatic pharmacokinetic parameters between different sexes.

Ktrans, volume transfer constant; kep, contrast transfer rate constant; ve, extravascular extracellular space volume fraction; vp, plasma volume fraction.
Discussion
The use of contrast agents in DCE-MRI plays a crucial role in enhancing the visualization of pancreatic tissues and vascular structures, thereby aiding in diagnosis and treatment planning (17). Contrast agents used in DCE-MRI of the pancreas can be broadly categorized into two types: extracellular fluid (ECF) agents and organ-specific agents (18). ECF agents, such as gadopentetate dimeglumine (Magnevist) and gadoterate meglumine (Dotarem), distribute into the extracellular space after intravenous administration. They are not specific to any organ but provide a general enhancement of vascular structures and tissue vascularity. ECF agents are useful for evaluating the enhancement patterns of pancreatic lesions and for distinguishing between benign and malignant processes based on their vascularity and perfusion characteristics. For organ-specific agents, MultiHance (gadobenate dimeglumine) is an example. It has a high relaxivity and provides strong enhancement of the pancreas (19). This is due to its weak and transient interactions with serum proteins, which result in a higher T1 relaxivity compared to other gadolinium-based agents. With its high relaxivity, MultiHance may provide superior lesion conspicuity, potentially leading to improved detection and characterization of pancreatic tumors or other focal lesions. Moreover, a portion of the administered dose of MultiHance is taken up by functioning hepatocytes and excreted into the biliary system, which can be advantageous when evaluating liver lesions concurrently with pancreatic pathology. While contrast-enhanced imaging provides significant benefits, the choice of contrast agent for DCE-MRI of the pancreas should be tailored to the clinical question at hand, taking into account the specific properties of the agent, the diagnostic goals, and the patient's medical history. Meanwhile, the safety profile and the cost of the contrast agent are also important considerations.
In evaluating pancreatic DCE-MRI pharmacokinetic parameters, we utilized the ETL model, which is a two-compartment model commonly used for tissue and tumor characterization. It has been shown to be computationally faster and more repeatable than non-linear methods (20,21). In addition, a study by Jesper et al. found that the linear model was more stable when time resolution was reduced, compared to the non-linear model (22). Using the ETL model, we calculated pancreatic Ktrans, kep, ve, and vp values, and found them to have excellent reproducibility in both intra- and inter-observer analyses. Our results showed that Ktrans and kep were independent of pancreatic region, age, and sex in healthy volunteers. However, vp varied with pancreatic region and ve varied with age. These findings could provide a foundation for future studies on the perfusion and permeability of a diseased pancreas and the selection of a normal pancreas control group. The choice of the normal control group is relative broadness in Ktrans and kep assessment without considering the factors of pancreatic region, age, and sex. However, for ve and vp, the choice of the normal control group should be prudent.
In our study, ICCs of Ktrans, kep, ve, and vp were all >0.90, and CoVs of these pharmacokinetic parameters were all <10% for both intra- and inter-observer analyses, except for Ktrans in the inter-observer analysis, which was 10.15%. Our findings are consistent with previous studies in DCE-MRI assessment of tumors (23,24); however, we evaluated the parameters more comprehensively. Our ICCs for vp were higher and our CoVs of vp were lower than those reported by Wang et al. (24). This can be attributed to the measures we took to ensure the precision of DCE-MRI, including strict implementation of inclusion and exclusion criteria, MRI scan training for our technologists, respiratory training for patients, using a series of 3D LAVA sequences to reduce scanning time while maintaining a high signal-to-noise ratio, and a 3D non-rigid image registration method to correct motion artifacts. In addition, we drew identical ROIs on the abdominal aorta to obtain AIF, which was easier to operate and more stable. Furthermore, we chose the ETL model, which is more suitable and can provide more reliable and stable results (22). Our results differ from and are superior to those of other researchers (25,26), who used different software to calculate DCE-MRI parameters and evaluate reproducibility, highlighting the importance of using a single software in sequential studies to ensure very good reproducibility.
We found that the value of pancreatic vp varied among different regions, which could be attributed to the differences in their blood supply and blood vessels of the pancreatic islets in different regions. The arterial supplies of pancreas are complex, especially in the pancreatic head (13). The ratio of the capillary surface area to the volume of the islet capillaries was different between the pancreatic head and tail (27). These differences may explain why vp is highest in the pancreatic head group. A previous study by Bali et al. (28) used DCE-MRI to evaluate pancreatic perfusion in healthy volunteers with and without secretin stimulation. They found that the distribution fraction, which represents the volume fraction of tissue accessible to the contrast agent and corresponds to plasma and interstitial space, was significantly different between the head and body/tail without secretin stimulation. Our results, which showed the highest vp in the pancreatic head group, align with and expand upon these findings, indicating that the difference in distribution fraction may primarily be due to variations in plasma space.
In our study, the highest pancreatic ve value was found in the old age group. Several studies have shown a correlation between age, pancreatic volume, parenchymal volume, fat volume, fat/parenchyma ratio, and CT density (14,29–31). For instance, Caglar et al. (19) found that pancreatic volume reached its maximum at the age of 40 years and remained constant until the age of 60 years, and then decreased gradually. They also found that the CT density of the pancreas peaked at the age of 50 years. Yang et al. (31) found pancreatic fat fraction remained constant between 20 and 40 years of age, but significantly increased between 41 and 50 and 51 and 70 years. Hence, it is suspected that the ve value is related to pancreatic atrophy and fat replacement, as both increase with age.
The present study has some limitations. First, ethical restrictions prevent repeated injection of contrast agents to volunteers, so there is a lack of assessment of scan-rescan reproducibility. Second, there are still slight artifacts and noise present after registration due to the impact of pancreas position, respiration, and movement of surrounding organs. This is a technical challenge that is difficult to overcome, but advancements in motion-robust pulse sequences as well as hardware are expected to improve this issue in the future.
In conclusion, the application of DCE-MRI with an ETL model provides a reliable, robust, and reproducible means of non-invasively quantifying pancreatic pharmacokinetic parameters. Ktrans and kep of pancreas are independent of pancreatic region, age, and sex, while vp vary with pancreatic region and ve vary with age. Our study contributes to our understanding of the pharmacokinetics of a normal pancreas and can serve as a reference for future studies of pancreatic diseases.
Footnotes
Acknowledgments
Thanks to Dr Xiaocheng Wei and Dr Feipeng Zhu for their efforts in improving the fluency and readability of the manuscript.
Authors’ note
The article was jointly written by Zhiyong Quan and Yong Yang, both are co-corresponding author.
Declaration of conflicting interests
The authors declared no potential conflicts of interest with respect to the research, authorship, and/or publication of this article.
Funding
The authors disclosed receipt of the following financial support for the research, authorship, and/or publication of this article: The study was supported by the Health Commission Foundation of Shaanxi Province (No. 2022A02) and Health Commission Foundation of Xi’an City (No. 2022qn01).
