
Abstract
Background
Bone marrow lesions (BMLs) in knee osteoarthritis (OA) have been assessed histopathologically and by dynamic contrast-enhanced magnetic resonance imaging (DCE-MRI); however, a direct comparison of the results has not been reported.
Purpose
To evaluate and compare the findings by DCE-MRI and histopathology of subchondral BMLs in knee OA.
Material and Methods
In total, 19 patients with medial tibiofemoral knee OA undergoing total knee arthroplasty were analyzed. Preoperative MRI, including a DCE sequence, was performed, and bone biopsies were obtained from the resected specimens corresponding to BML areas. The contrast enhancement by DCE-MRI was analyzed using semi-quantitative (area under the curve [AUC]), peak enhancement [PE]), and quantitative (Ktrans, Kep) methods. Enhancement in the medial OA compartment was compared with similar areas in a normal lateral compartment, and the DCE characteristics of BMLs were correlated with semi-quantitatively graded histopathological features.
Results
AUC and PE were significantly higher in medial tibial and femoral BMLs compared with the values in the lateral condyles; Ktrans and Kep were only significantly higher in the tibial plateau. In the tibia, AUC and PE were significantly correlated with the grade of vascular proliferation, and PE also with the degree of marrow fibrosis. There was no significant correlation between AUC/PE and histopathological findings in the femur and no correlation between quantitative DCE parameters and histopathological findings.
Conclusion
BML characteristics by semi-quantitative DCE in the form of AUC and PE may be used as parameters for the degree of histopathological vascularization in the bone marrow whereas quantitative DCE data were less conclusive.
Introduction
Bone marrow lesions (BMLs) detectable by magnetic resonance imaging (MRI) are frequent in patients with knee osteoarthritis (OA), particularly in the weight-bearing parts. BMLs are associated with pain (1) and disease progression (2), which may ultimately lead to knee arthroplasty surgery (3).
The bright appearance of BMLs on fluid-sensitive fat-suppressed (FS) MRI sequences may indicate both edema (4) and increased vascularization due to angiogenesis and/or altered blood flow, including venous stasis (5–7). Vascular changes may be associated with inflammation, resembling osteitis changes in rheumatoid arthritis, and may contribute to the progression of knee OA and structural damages, including damage to the overlying cartilage (8). Alternatively, vascular changes may be a regenerative response to repetitive micro-injuries to the subchondral bone beneath damaged cartilage (9–11). Other changes reported in BMLs include necrotic and remodeled trabeculae (4,12) and increasing trabecular thickness (13).
Differentiating between edema and increased vascularization in BML areas is not possible by non-enhanced conventional knee MRI. Studies using dynamic contrast-enhanced MRI (DCE-MRI) have shown an increased perfusion of the subchondral bone in knee OA, especially in areas with BMLs (14,15). The contrast enhancement patterns of BMLs typically involve a rapid initial contrast uptake, followed by either washout (14), progressive slow enhancement (6,7), or a potential plateau (16). These enhancement characteristics, also known as time intensity curves (TIC) (16), reflect the rate of contrast entering the arteries, passing through the BML area intravascularly or distributed into the extravascular space, and subsequent venous drainage (17), believed to correspond to neo-angiogenesis, increased cellular bone density, and altered venous drainage. To our knowledge, no human studies exist comparing DCE-MRI findings with histopathological changes in BMLs. Analysis of perfusion characteristics with corresponding histological changes may improve the understanding of the role of BMLs in the pathogenesis of knee OA.
The aim of the present study was to investigate and compare DCE-MRI perfusion characteristics of BMLs in knee OA with histopathological findings of resection specimens obtained from patients undergoing total knee arthroplasty.
Material and Methods
Study population
A total of 20 patients with medial tibiofemoral knee OA undergoing total knee arthroplasty at the Department of Orthopedic Surgery, Regional Hospital Silkeborg, Denmark, were prospectively enrolled. The inclusion criteria were as follows: severe knee pain; impaired knee function; evidence of OA with loss of joint space detected by radiography performed standing on one leg (18); and consent to undergo preoperative MRI and allow the use of resected specimens for scientific purposes. The exclusion criteria were as follows: systemic inflammatory joint disease (e.g. rheumatoid arthritis); OA in the lateral tibiofemoral compartment; contraindications for MRI; contrast media allergy; and impaired renal function (creatinine clearance <30 mL/min).
One patient was excluded due to inadequate timing of contrast enhancement for DCE analysis. Furthermore, three tibial specimens were insufficient for histopathological analysis due to inadequate thickness of the biopsy or resected specimen and two femoral specimens were excluded, one due to an insufficient biopsy and one due to osteonecrosis. Thus, 16 tibial and 17 femoral specimens were available for comparison of DCE with histopathological findings.
MR protocol
Preoperative MRI was performed using a 3-T MR scanner (Achieva: Philips, Leiden, The Netherlands) with a dedicated knee coil. The following sequences were performed: coronal T1 (field of view [FOV] = 180 × 160 mm, matrix = 576, TR = 533 ms, TE = 8 ms, slice thickness = 3.0 mm, and slice gap = 0.6 mm), and coronal, sagittal, and axial proton density (PD) FS sequences (FOV = 160 × 160 mm, matrix = 576/512/512, TR = 7500 ms, TE = 30 ms, flip angle = 90°, slice thickness = 3.0 mm, and slice gap = 0.6/0.6/0.3 mm).
DCE-MRI was obtained using a sagittal FS 3D fast spoiled gradient echo sequence with 48 phases of 5 s (4 min). Intravenous contrast (0.1 mmol/kg; Dotarem, Guerbet, Paris, France) was administered using a power injector (2 mL/s), beginning after the second phase and followed by a saline flush. The parameters were as follows: FOV = 180 × 180 mm; matrix = 288; TR = 5.1 ms; TE = 2.5 ms; and flip angle = 30°.
Finally, postcontrast sagittal and axial T1 FS sequences (FOV = 180 × 180 mm, matrix = 512, TR = 550/650 ms, TE = 7 ms, flip angle = 90°, slice thickness = 3.0 mm, and slice gap = 0.6/0.3 mm) were performed.
Tissue sampling for histopathological analysis
During surgery, the resected specimens of the tibial plateaus and femoral condyles were placed in gauze with saline in separately marked boxes at 4°C with markers for anterior and posterior anatomical identification. Within 4 hours, the specimens from each knee were photographed in the correct anatomical positions and cylindrical biopsies were obtained from each specimen using a bone trephine with an internal diameter of 5 mm. The site of each biopsy of the two specimens from the medial compartment was determined by the preoperative MRI examination, localizing the most extensive BMLs on both fluid-sensitive and contrast-enhanced sequences in the coronal, sagittal, and axial planes, respectively. If no BMLs were present, biopsies were obtained from the center of the articular surface at the site of the most pronounced cartilaginous or osseous changes. The sites selected for biopsies were marked on the sagittal section and stored. The location of specimen biopsies was documented photographically. After fixation and dehydration in 70% ethanol, the biopsies were embedded in methylmetacrylate, and sections 8–10 µm thick were cut with a heavy-duty microtome (Jung Model K) and stained with hematoxylin and eosin and Goldner-Trichrome.
Image analysis
Two skilled radiologists (NE, FKN) evaluated radiographs collaboratively using a consensus-based approach. Their assessment focused on the extent of joint space narrowing in the medial tibiofemoral compartment, following the Ahlbäck scale (grade 0–5) (19). They also graded BML on PD FS and postcontrast T1 FS images, respectively, in accordance with the MOAKS (MRI Osteoarthritis Knee Score) grading system (20) (Fig. 1). Furthermore, the marking of sites for biopsies on sagittal MRI sections was performed in consensus.
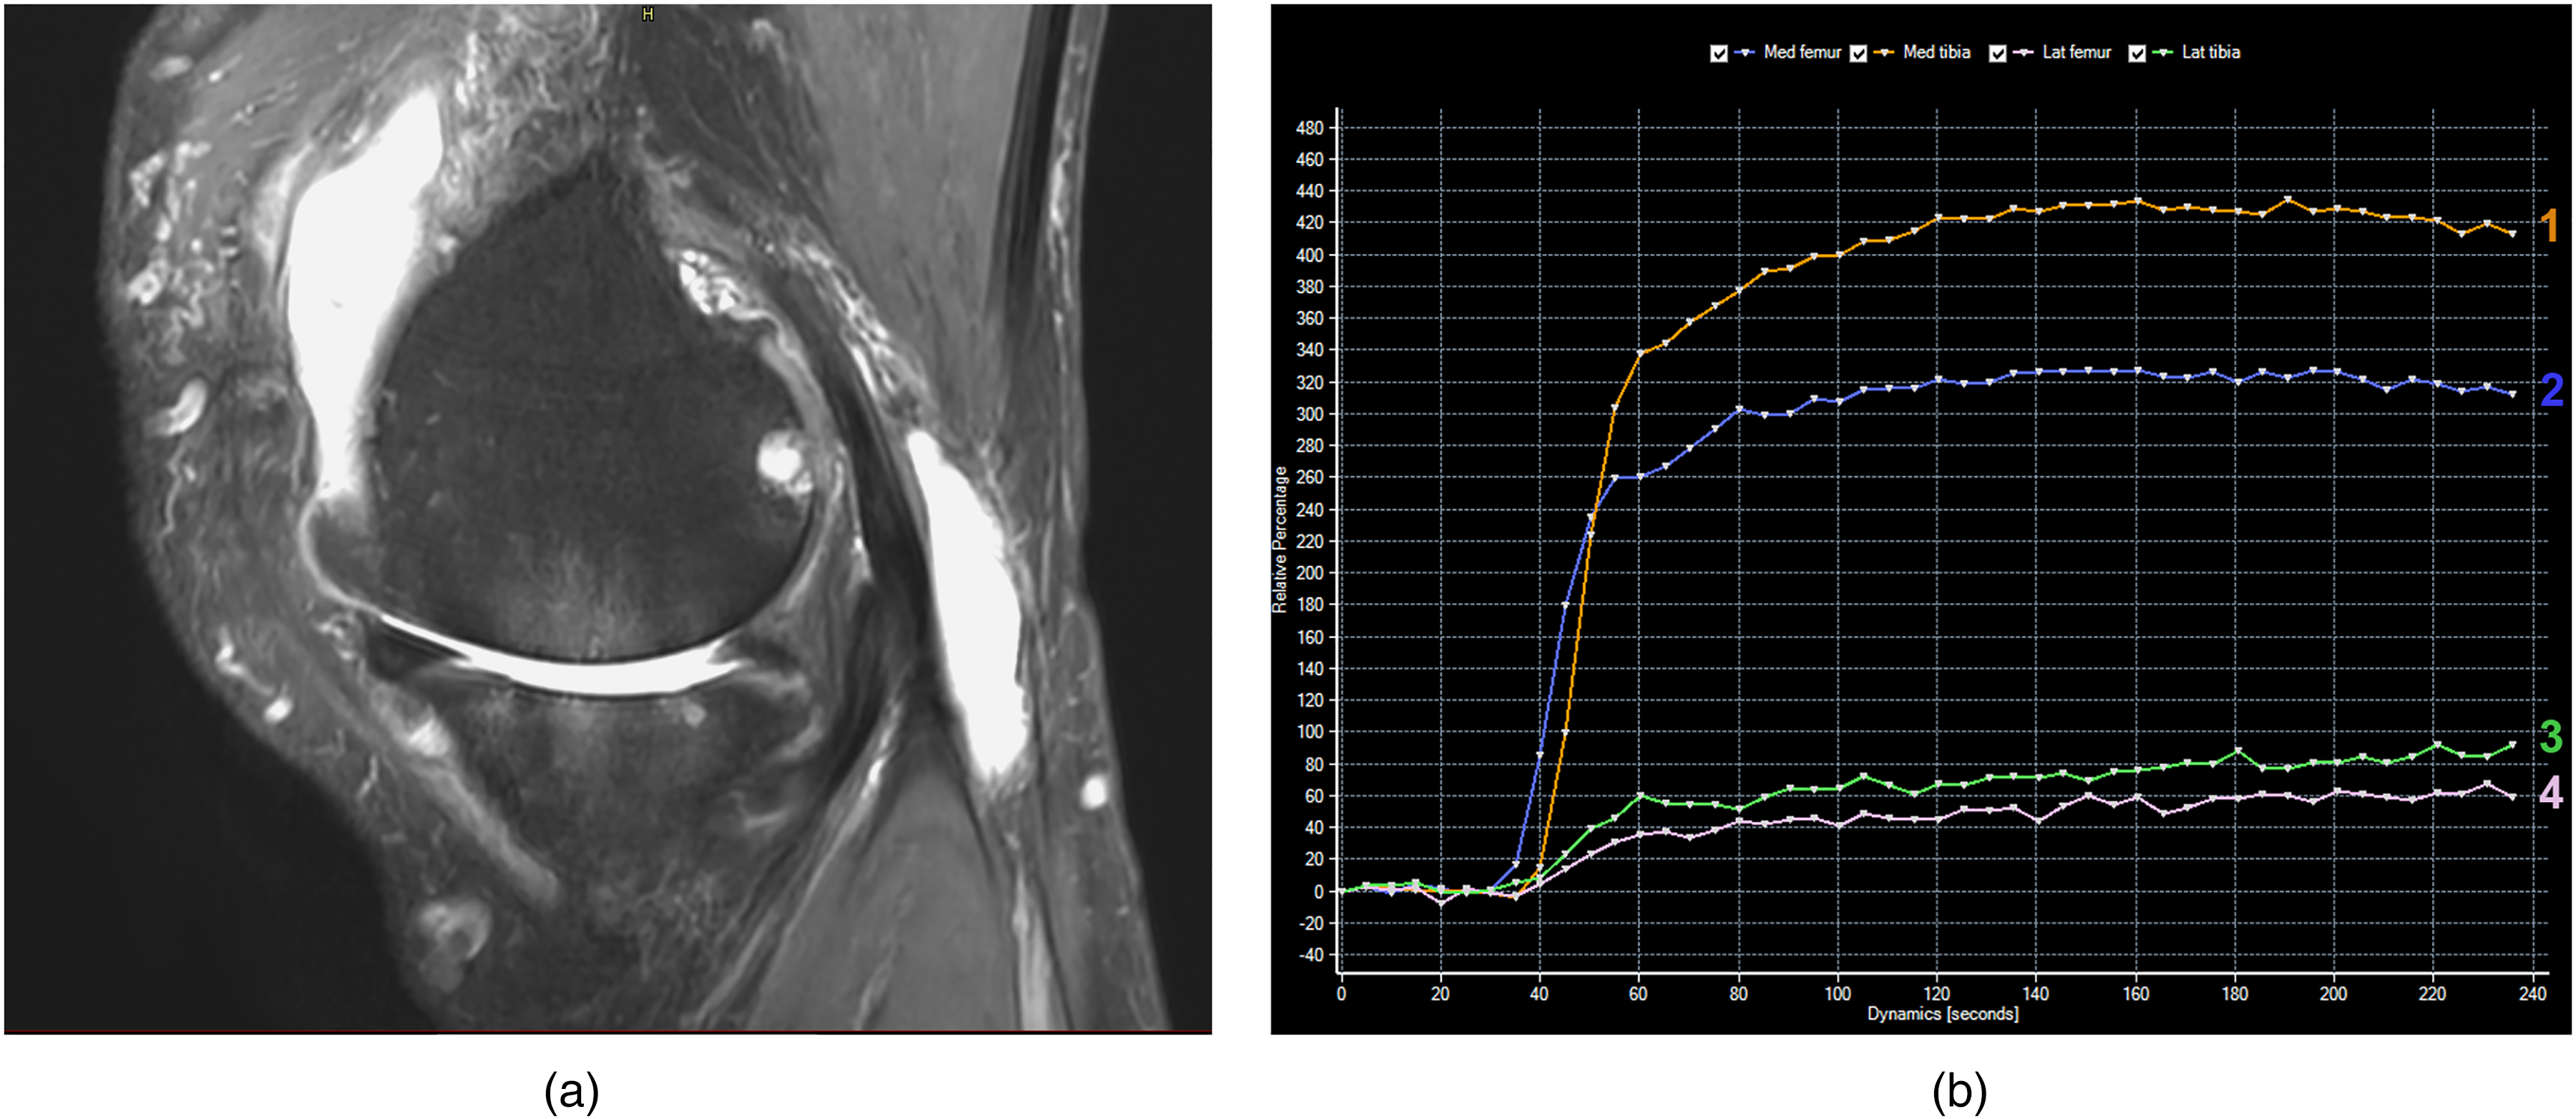
(a) Sagittal FS proton weighted MRI scan of a 73-year-old man with medial left-sided knee osteoarthritis, radiographically Ahlbäck stage 3, showing BMLs, MOAKS grade 3, in both the tibia and femoral bone (arrows). (b) Corresponding DCE curves illustrating the characteristic enhancement curves with an initial steep enhancement followed by a plateau with a minimal decrease (washout) during the measurement period. Orange curve (1) corresponding to the medial tibia plateau, blue (2) to the medial femoral condyle; the green (3) and rose (4) curves are the corresponding curves obtained laterally. The enhancement difference between the tibial and femoral BML areas may be due to the corresponding histopathological difference in vascularity (Fig. 2). BML, bone marrow lesion; DCE, dynamic contrast-enhanced; FS, fat-saturated; MRI, magnetic resonance imaging.
DCE-MRI analysis
The DCE sequences were analyzed by one experienced radiologist (FKN) as follows: based on the site of biopsy marked on the previously selected sagittal MRI section, a rectangular region of interest (ROI), measuring 50 mm2, was placed at the same site and used for the DCE-MRI analysis. A semi-quantitative perfusion analysis was performed using the MR T1 perfusion module in Intellispace version 11.1 (Philips Healthcare, Amsterdam, Netherlands) resulting in TICs as well as peak enhancement (PE) and area under the curve (AUC) parameters.
Quantitative analyses were performed using DCE-Tool version 2.2 (an open-source software developed by Kyung Sung, Body MRI research group, Stanford University, CA, USA) on an Osiris DICOM workstation (21). T1 was predefined to 1.443 ms, and arterial input function was determined by drawing a ROI in the popliteal artery. Permeability parameters were calculated using the extended Toft pharmacokinetic model (14,22,23). Two quantitative perfusion parameters were calculated: volume transfer constant (Ktrans [min−1]) reflecting the rate at which contrast was delivered from the blood plasma to the extravascular extracellular space (EES), and the efflux rate constant (Kep [min−1]) for the back flux from the EES to the plasma.
Histopathological analysis
The histopathological assessment was performed by a senior consultant pathologist specialized in musculoskeletal abnormalities (FBS) and blinded to the findings by MRI. The histological evaluation included cartilage, the subchondral bone plate (≥90% thickened subchondral trabeculae), and the subchondral bone marrow. The subchondral bone marrow was divided into two zones: zone 1 included the bone marrow immediately distal to the subchondral plate; and zone 2 represented the bone marrow peripheral to zone 1.
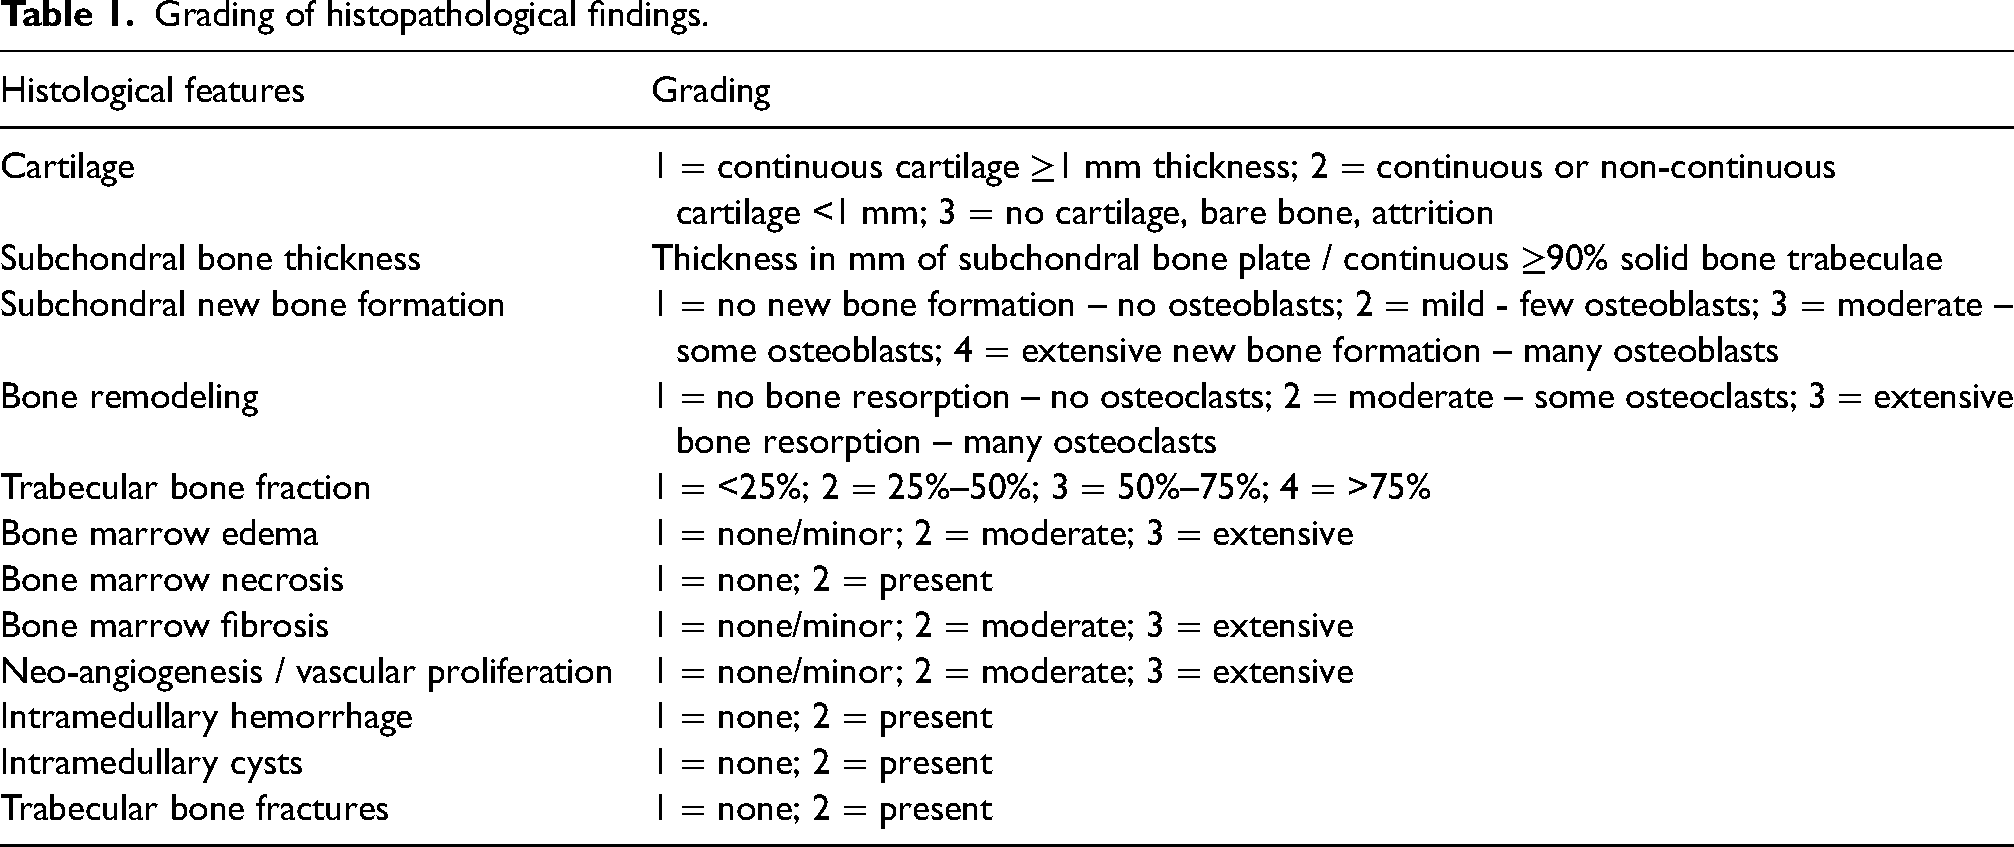
The histological features analyzed and graded semi-quantitatively are summarized in Table 1 and illustrated in Fig. 2. The trabecular bone fraction was estimated semi-quantitatively and corresponds to the area of trabecular bone relative to the total cancellous tissue area (24). Bone marrow edema was estimated based on the presence of swollen fat cells with disintegration of eosinophile interstitial fluid; bone marrow necrosis was based on the presence of fat cell necrosis. Bone marrow fibrosis was characterized by inter-trabecular proliferation of connective tissue cells. Neo-angiogenesis and vascular proliferation were estimated based on the presence of inter-trabecular vascular spaces with endothelial luminal covering.
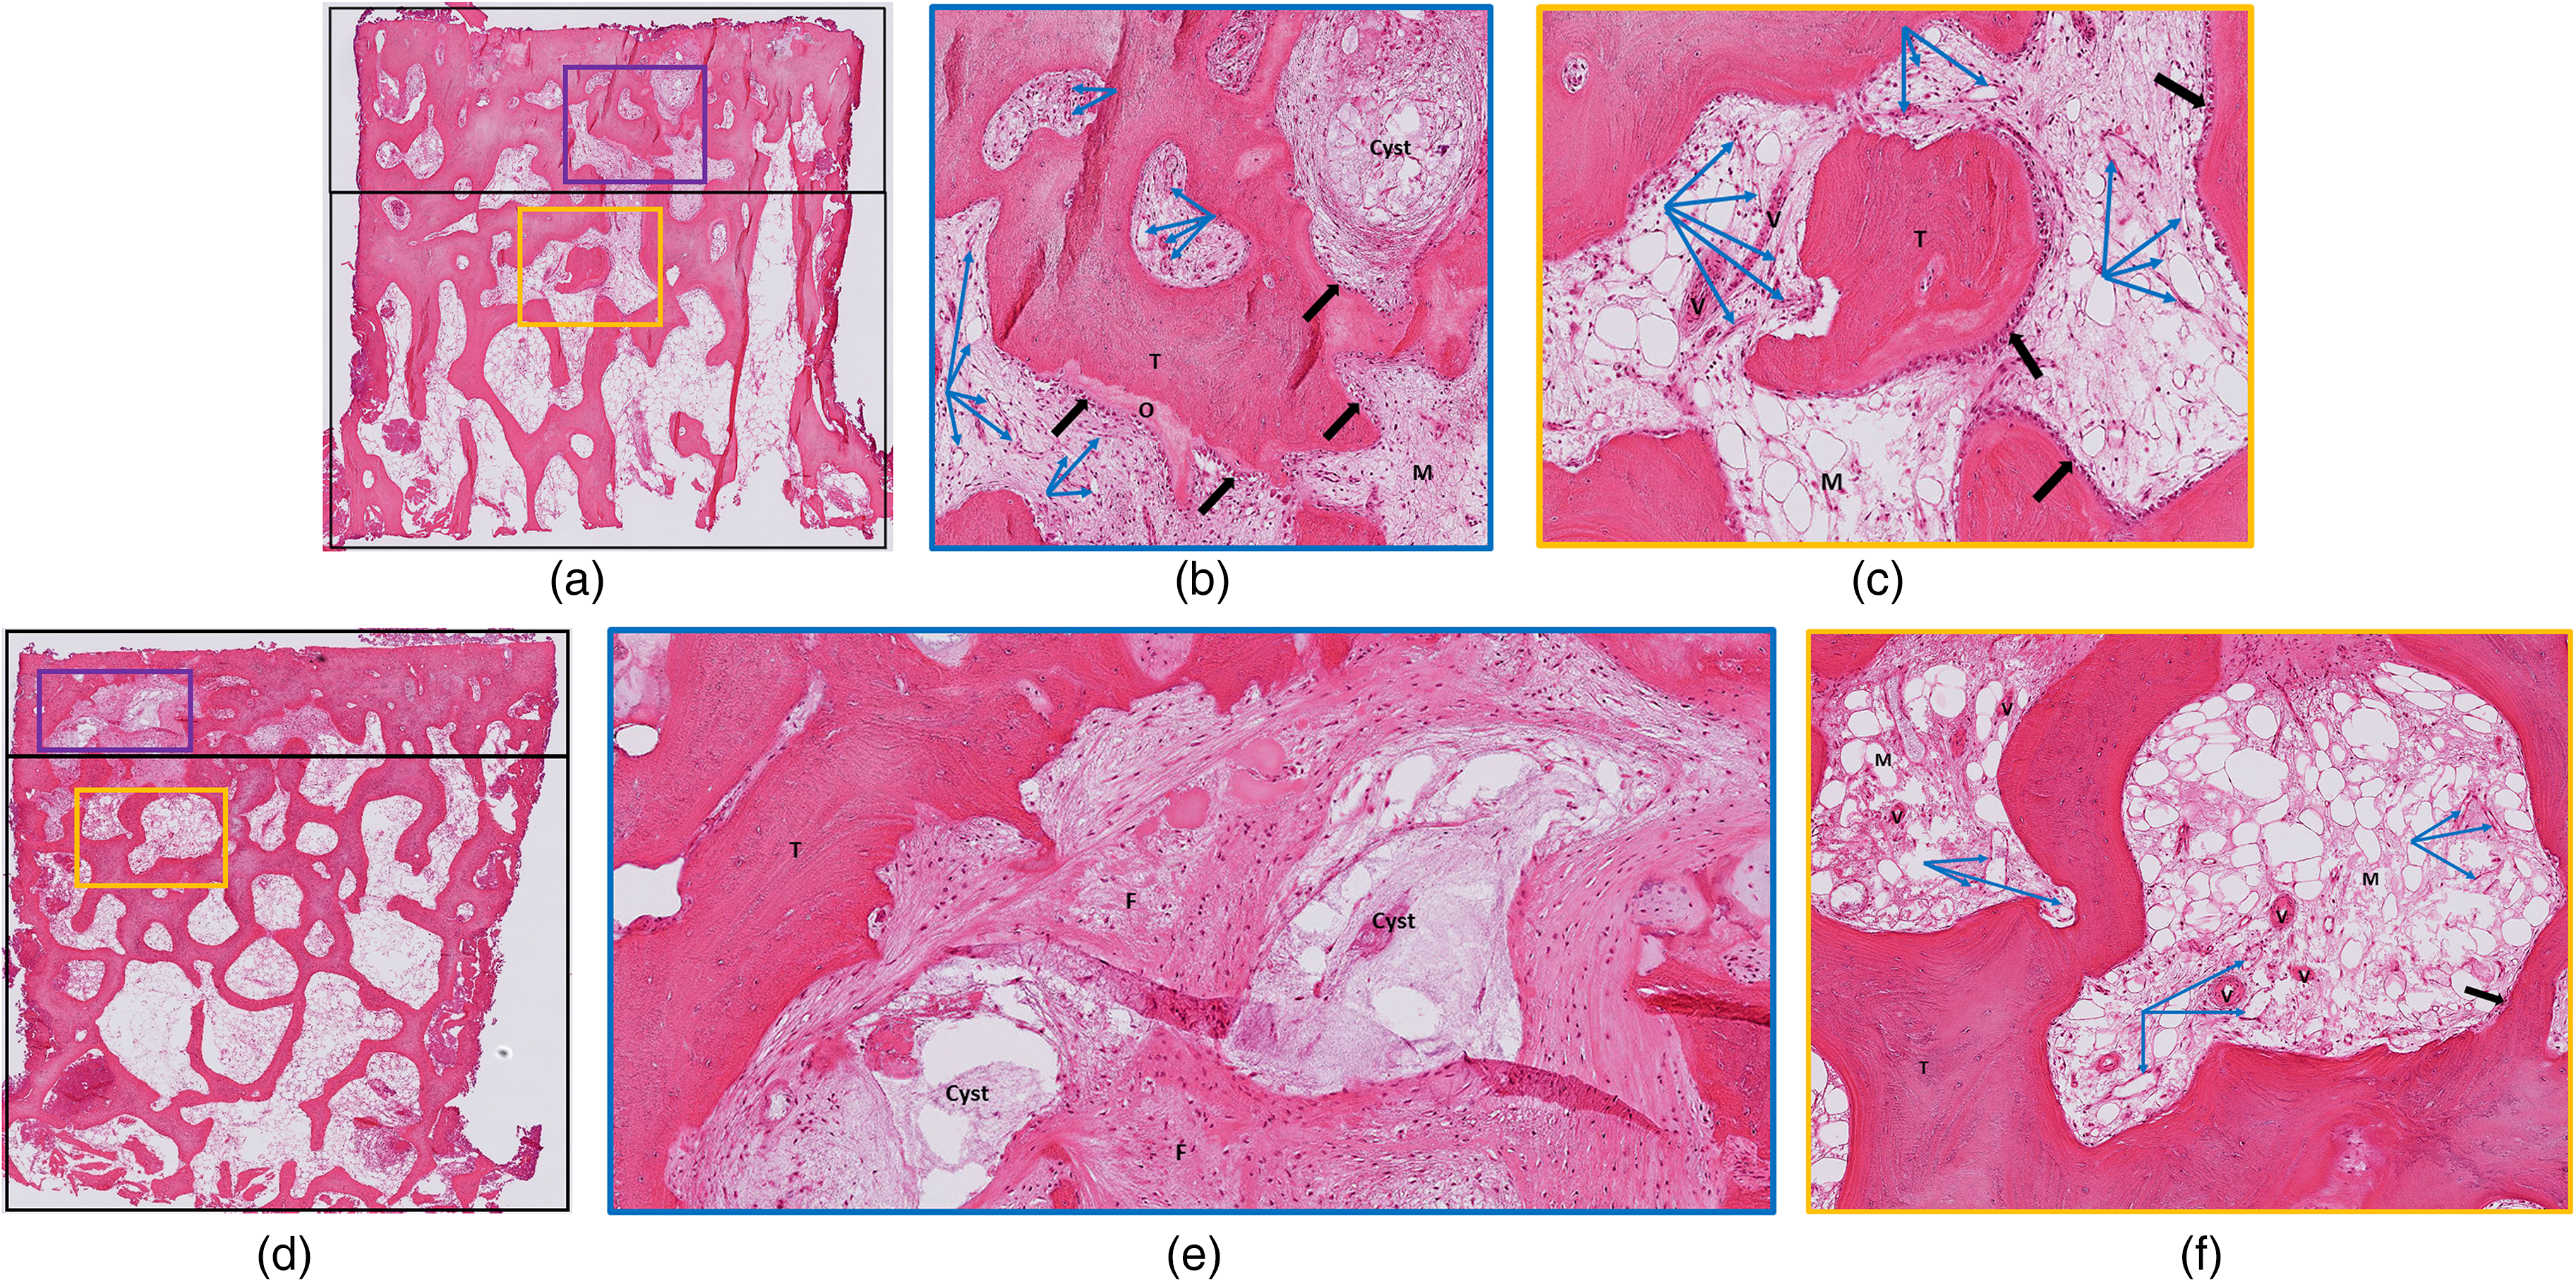
Histopathological findings in the biopsies from the patient illustrated in Fig. 1. (a–c) Medial tibial plateau; (d–f) medial femoral condyle. (a, d) The overviews (orig. magn. 15×) depict the arbitrary zones 1 and 2 (marked with boxes), from both of which segments are shown in panels b and e (blue squares) and panels c and f (orange squares), respectively. Note, zone 1 may partly overlap with non-osseous parts of the subchondral plate. Articular cartilage is missing on both the tibial plateau and the femoral condyle. (b) In the tibial zone 1 (orig. magn. 75×), a small cyst is seen in the edematous medullary space (M), and osteoid (O) is formed by numerous osteoblast (black arrows) on the surface of the trabecular bone (T). Abundant newly formed vascular spaces (blue arrows). (c) In zone 2 (orig. magn. 75×), there is lesser formation of osteoid and vascular spaces, whereas more mature vessels with muscular walls are seen (V). (e) In femoral zone 1 (orig. magn. 60×), there are two cysts and areas in the subchondral edematous medullary space filled with fibroblast-rich connective tissue (F). Only minor osteoid (O) formation takes place on the surface of the trabecular bone (T), and the number of newly formed vascular spaces is low in this zone. (f) Zone 2 (orig. magn. 60×) shows lesser frequency of newly formed vascular spaces (blue arrows) with a background of more mature vessels with muscular walls (V) than in zone 1.
Grading of histopathological findings.
Ethics approval and consent
The study was approved by the Central Denmark Region Committee on Health Research Ethics and the Data Protection Agency (1-10-72-118-17) and was conducted in accordance with the Declaration of Helsinki II and subsequent revisions. Written informed consent was obtained from all participants as well as permission to use and publish anonymized study results.
Statistical analysis
DCE-MRI data were non-normally distributed and expressed as medians (25th, 75th quartiles). A comparison of DCE-MRI data between the medial and lateral compartments was performed using the Wilcoxon rank-sum test. DCE-MRI parameters and histopathological findings were compared using the Kruskal–Wallis test. A P value <0.05 was chosen for statistical significance. Analyses were performed using the stats.blue software (stats.blue, CA, USA).
Results
The mean age of the 19 patients was 69 years (range = 54–82 years), and the mean body mass index (BMI) was 28.4 kg/m2 (range = 23–38 kg/m2). All patients had moderate to severe OA on radiography as well as BMLs located to 15 tibial plateaus and 17 femoral condyles (Table 2).
Imaging characteristics of the study participants with radiographic grading of the medial tibiofemoral joint compartment according to Ahlbäck and MOAKS BML grading.
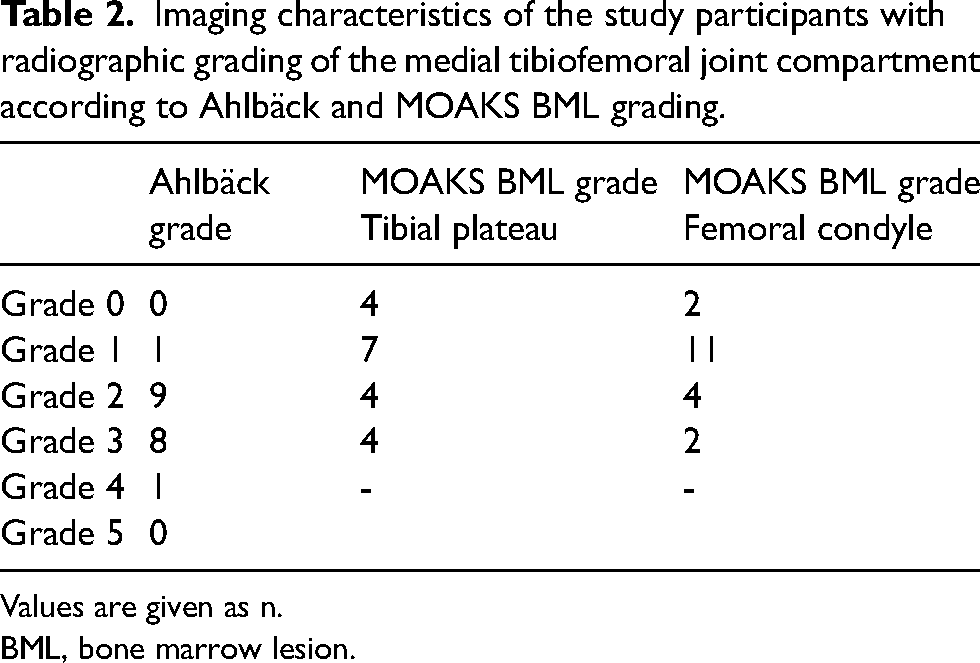
Values are given as n.
BML, bone marrow lesion.
The semi-quantitative analyses / TICs of DCE-MRI sequences demonstrated a significant difference in PE and AUC between the medial and lateral tibial plateaus and femoral condyles. The demonstrated differences were due to highly significant differences between the 15 tibial plateaus and 17 femoral condyles with BML areas and their corresponding lateral plateaus/condyles (Table 3), whereas PE and AUC in the medial plateaus/condyles without BMLs did not differ significantly from the values obtained in the lateral compartment. Signs of minimal contrast washout were only observed in five curves (Fig. 1).
DCE-MRI results of the semi-quantitative (PE and AUC) and the quantitative (Ktrans and Kep) method presented for all tibial plateaus/femoral condyles and divided according to the presence or absence of BML in the medial plateaus/condyles.
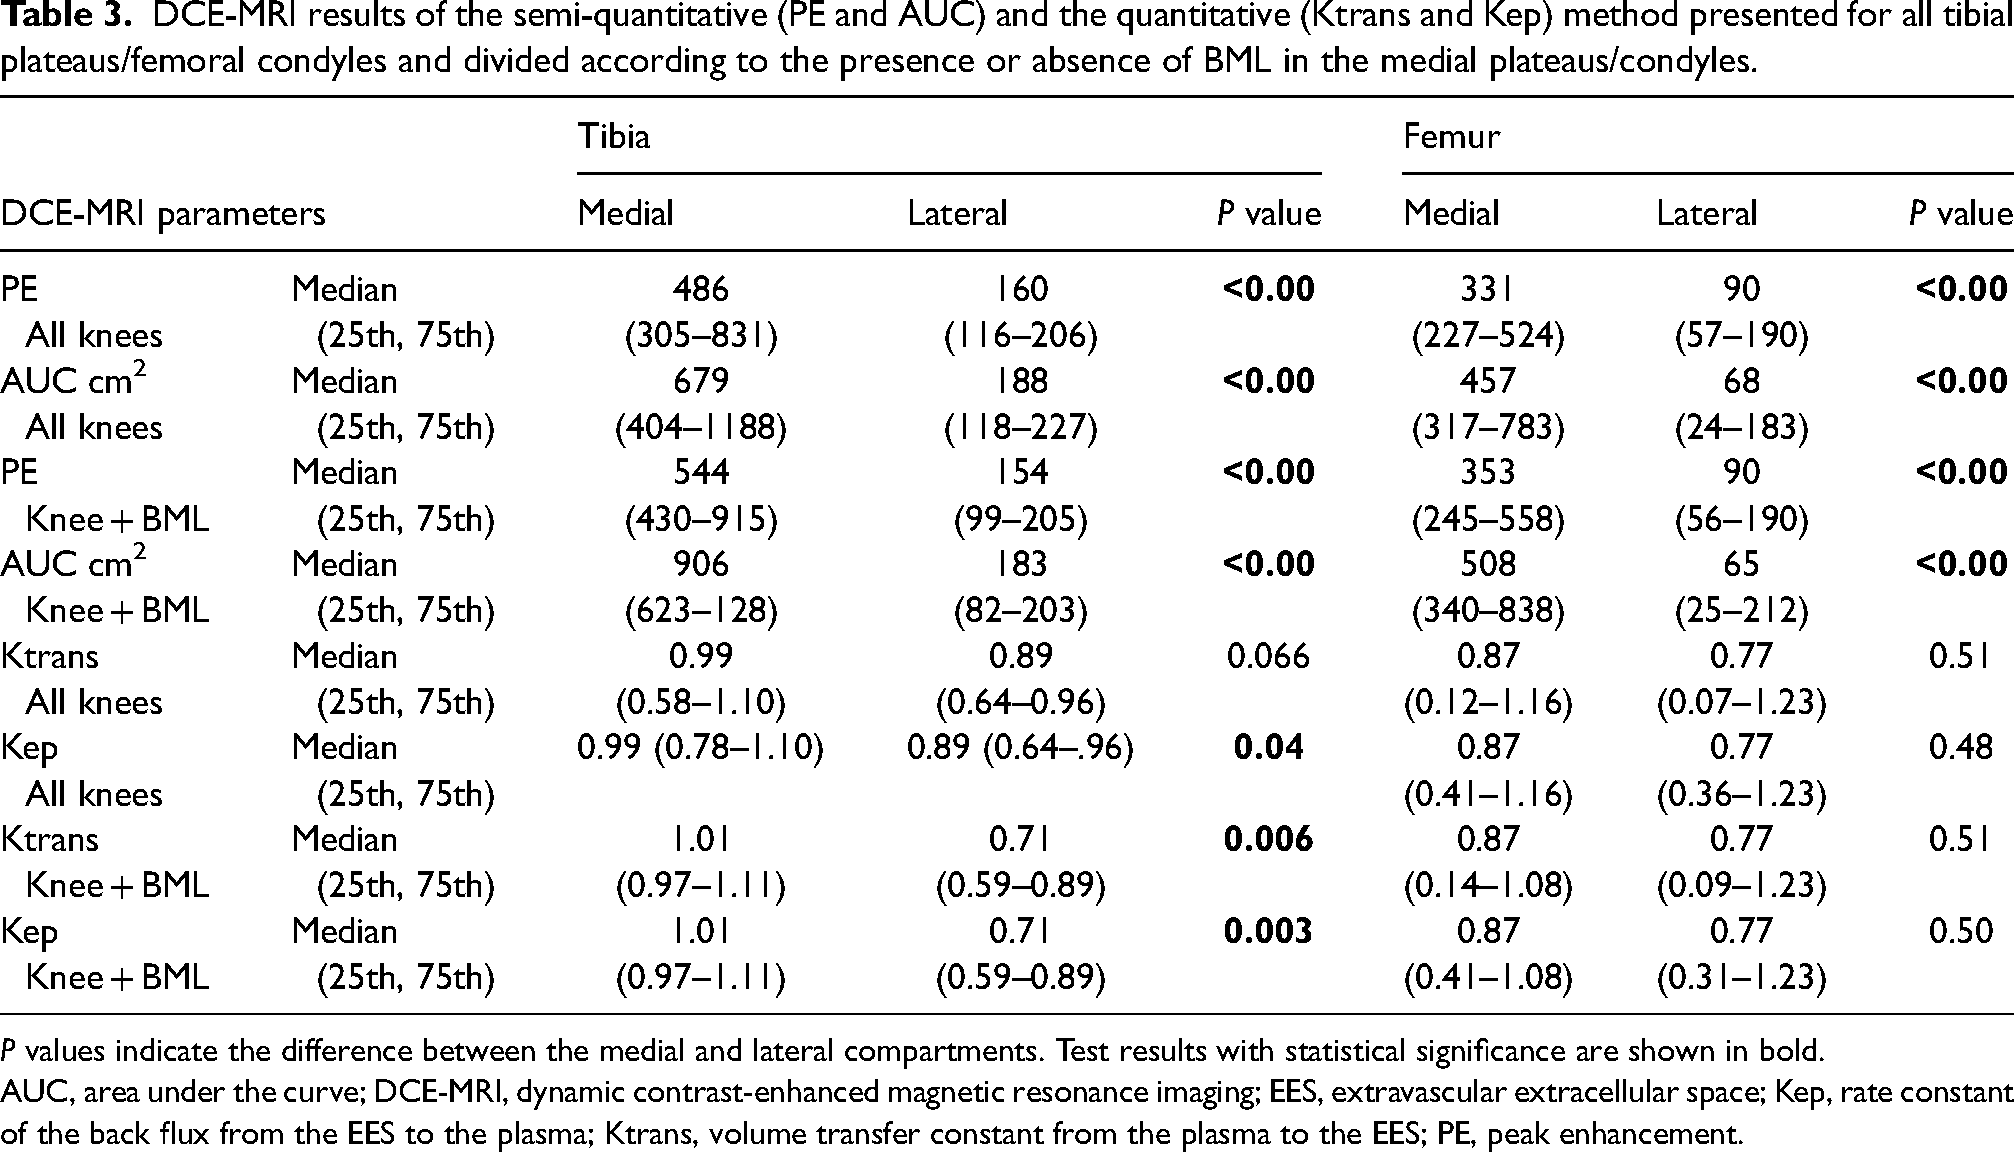
P values indicate the difference between the medial and lateral compartments. Test results with statistical significance are shown in bold.
AUC, area under the curve; DCE-MRI, dynamic contrast-enhanced magnetic resonance imaging; EES, extravascular extracellular space; Kep, rate constant of the back flux from the EES to the plasma; Ktrans, volume transfer constant from the plasma to the EES; PE, peak enhancement.
Ktrans and Kep were significantly higher in the medial tibia plateaus with BMLs compared with the corresponding lateral plateaus; no significant differences were observed between the femoral condyles. The four medial tibial plateaus without BML areas had a lower median Ktrans value than the lateral plateaus. When analyzing all tibial plateaus, only the values of Kep remained statistically significant (Table 3).
The mean thickness (=height) of the 16 tibial and 17 femoral biopsies was 4.9 mm (range = 1.2–7.5 mm) and 5.8 mm (range = 3.0–11.0 mm), respectively, and the subchondral bone plate had a mean thickness of 0.7 mm (range = 0.1–1.7 mm) in the tibia and 0.7 mm (range = 0.1–1.4 mm) in the femur.
The histopathological findings are summarized in Table 4, including number of specimens with different degrees of change. Intramedullary hemorrhage was not seen in any of the biopsies.
Grading of histopathological features with corresponding number of specimens with the different degree of changes in the femur and tibia, respectively.

A comparison of the DCE-MRI parameters with the histopathological findings showed a significant correlation between PE and AUC and vascular proliferation as well as between PE and bone marrow fibrosis in the tibia (Table 5). No other significant correlations of the semi-quantitative parameters were observed. No detectable correlations between the quantitative DCE-MRI parameters and the histopathological findings were seen.
Comparison of DCE-MRI parameters and histopathological findings.
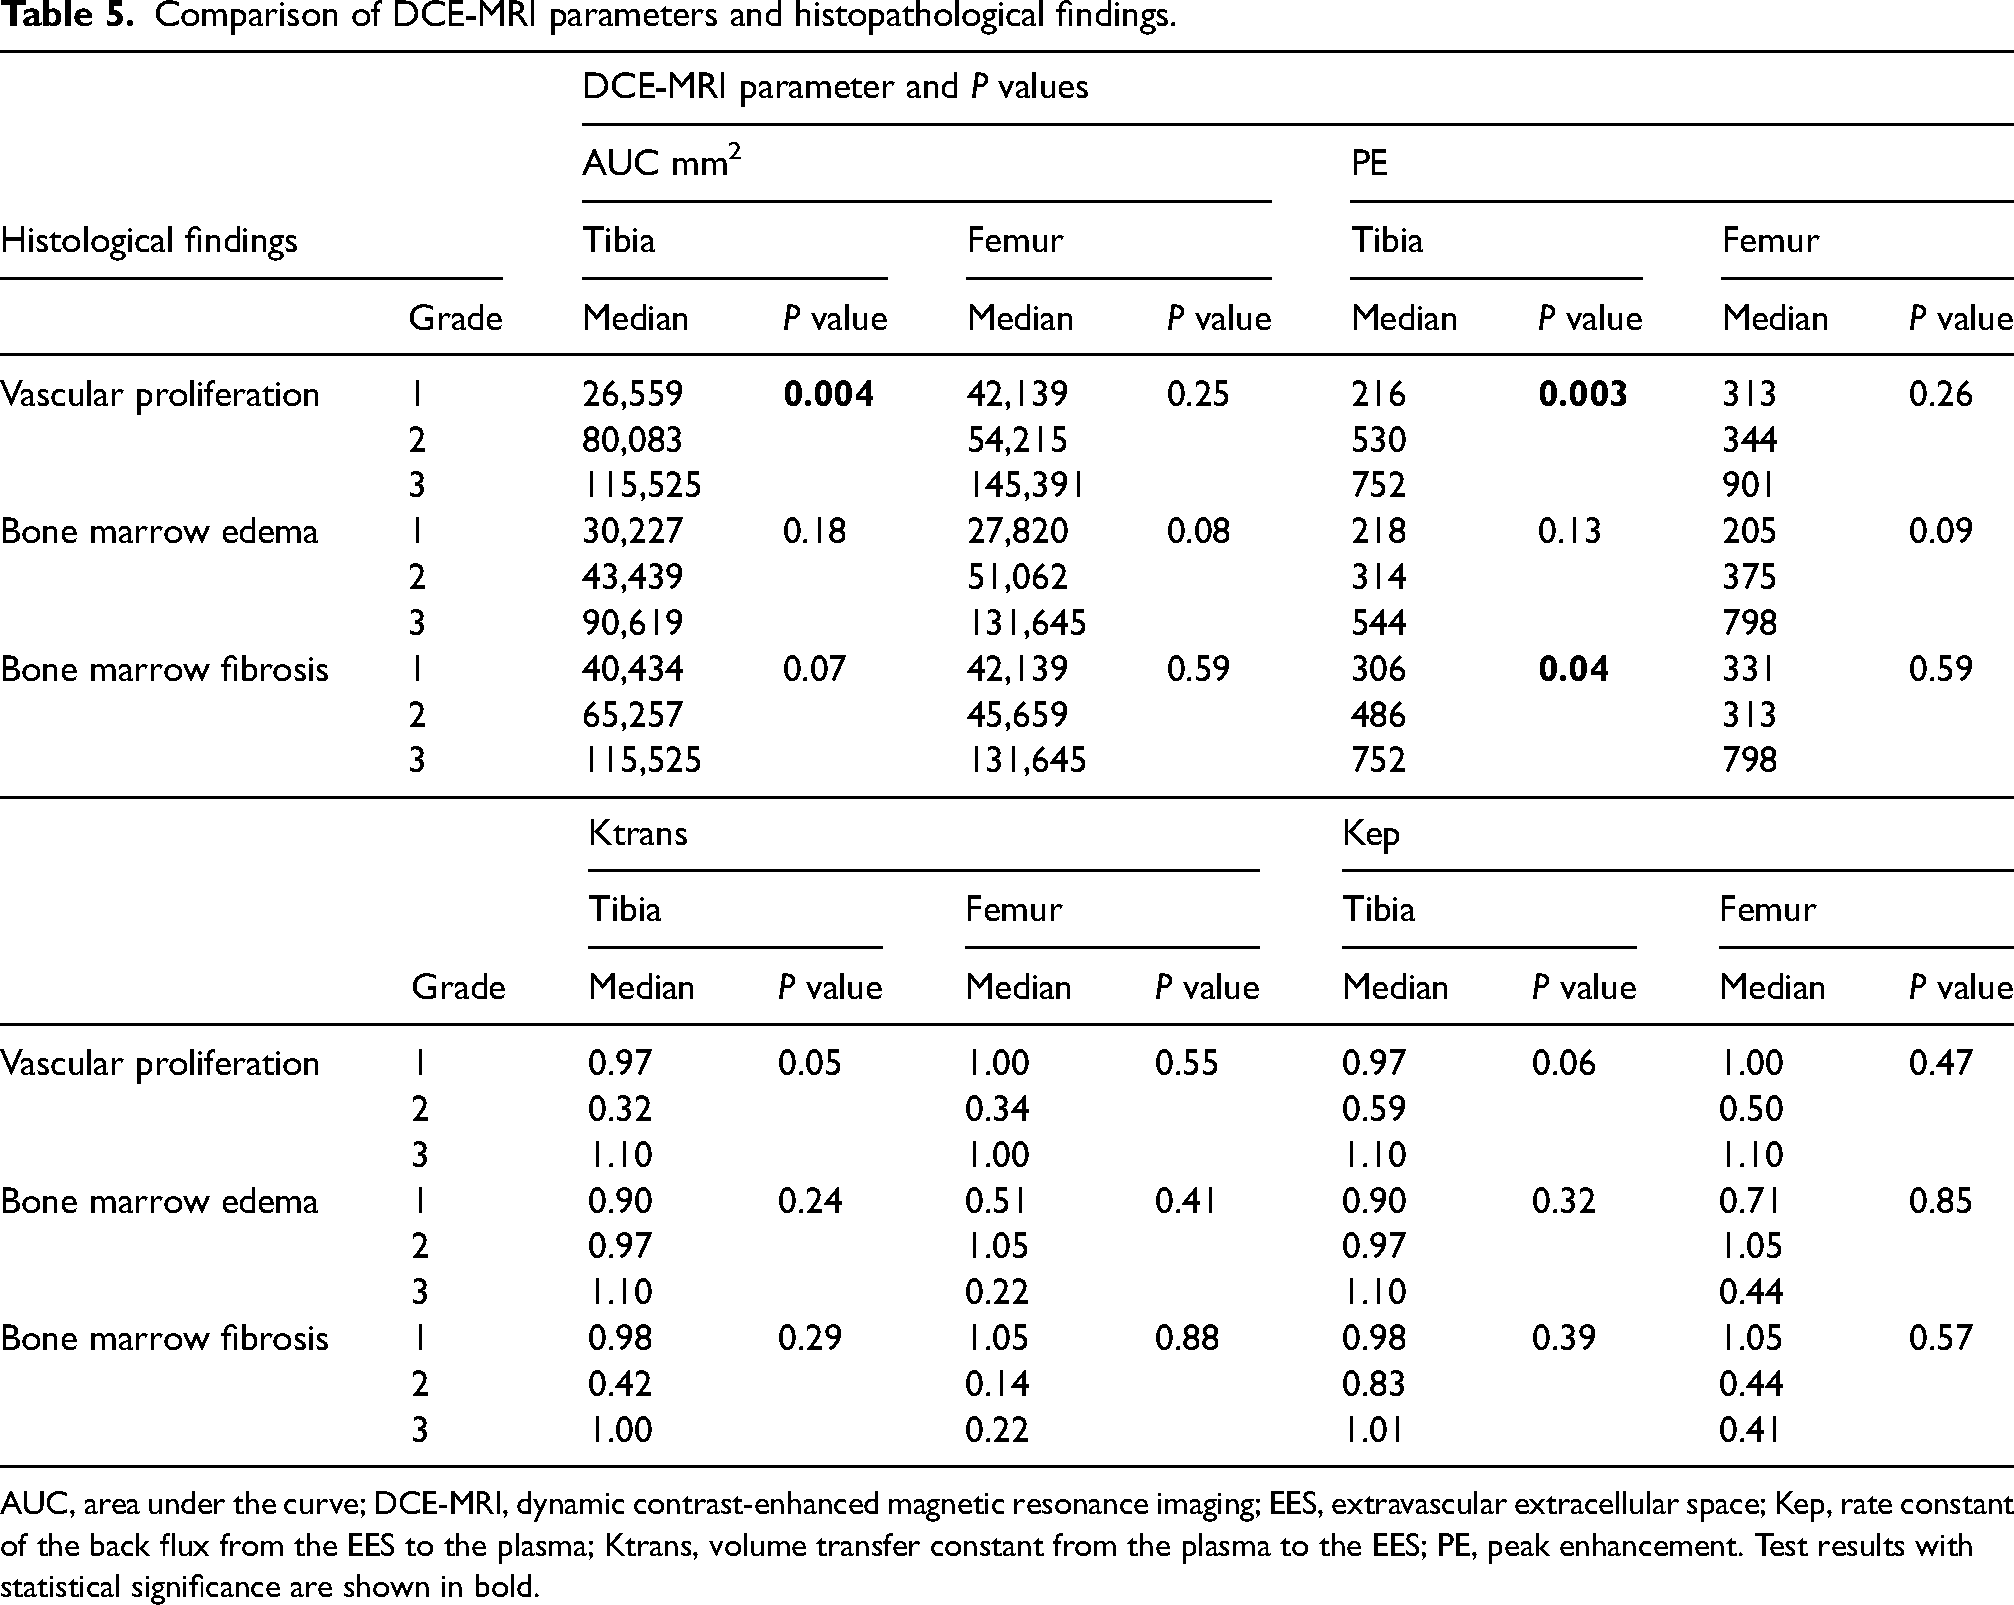
AUC, area under the curve; DCE-MRI, dynamic contrast-enhanced magnetic resonance imaging; EES, extravascular extracellular space; Kep, rate constant of the back flux from the EES to the plasma; Ktrans, volume transfer constant from the plasma to the EES; PE, peak enhancement. Test results with statistical significance are shown in bold.
Discussion
In this study, we found significantly different DCE parameters between medial tibial plateaus with BMLs compared with the lateral plateau by both semi-quantitative (AUC and PE) and quantitative analyses (Ktrans and Kep). Significant differences corresponding to the femoral condyle were only detected by the semi-quantitative analyses.
Both the amount and degree of contrast enhancement on DCE-MRI (AUC and PE) were significantly correlated with histological signs of vascular proliferation in the tibia, and PE was also correlated with bone marrow fibrosis. There was no significant correlation between quantitative DCE values and histopathological findings.
Our DCE results are in accordance with previous studies. Budzik et al. reported significantly different AUC values between OA and non-OA compartments (14). They were not able to obtain reliable quantitative data. However, Vries et al. detected higher Ktrans and Kep in the most affected OA compartments compared to the least affected compartments (15). Similar to our study, the findings by Budzik indicate that semi-quantitative DCE-MRI analyses are more robust and less prone to errors and artifacts compared to quantitative analyses. An explanation for this could be inhomogeneous and often weak contrast concentration in the subchondral bone, causing insufficient signal enhancement to be able to calculate Ktrans and Kep (14). Moreover, it is possible that contrast leakage to the extravascular space, measured by the quantitative method, is minimal in the subchondral bone marrow. Even though our quantitative DCE analyses were inconclusive concerning the femoral condyle, the enhancement/TICs, representing vascular as well as interstitial contrast media, showed rapid and continuous contrast enhancement in areas with BMLs compared to areas without (Fig. 1).
Our enhancement curves in BML areas displayed an initial steep enhancement followed by a plateau like those observed by Budzik et al. However, we only observed minimal washout in five patients during the mean scan time of 3.5 min. This could indicate facets of venous stasis, supporting the hypothesis that, in addition to increased vascularity, the fluid dynamics in BMLs are altered by venous stasis, supposedly affecting the excretion of cytokines involved in bone remodeling and cartilage degradation (5,7,8,15,25). The AUC has no clear physiological correlation; high AUC values in BML areas are consistent with increased intravascular blood volume secondary to angiogenesis but can also be due to obstructed outflow (5–7).
In the present study, AUC and PE were significantly correlated with the degree of vascular proliferation histologically, but only in the tibia. This may be due to more pronounced BMLs in the tibia than in the femur, possibly due to load-related areas of micro-injuries (11). However, there could also be a technical explanation. The total knee arthroplasty technique applied in the present study implied that the resected specimens consisted of an entire tibial plateau, whereas the femoral condyles only consisted of two oval specimens, measuring approximately 4 × 1.5 cm with a maximum thickness of 11 mm. We used anatomical landmarks to facilitate the location of BML areas by MRI when performing bone biopsies, but we may not always have sampled the exact BML area. This could have influenced our femoral DCE results. Interestingly, only BMLs in the tibial plateau were analyzed in most histopathological studies of knee OA (4,11,12,26–28); this may be due to similar technical explanations.
Several histological studies exploring the pathophysiology of BML areas have been performed, reporting varying changes across studies. One of the first analyses of BMLs by Zanetti et al. showed that BMLs primarily consisted of normal bone marrow containing smaller areas with bone marrow necrosis, necrotic or remodeled trabeculae, fibrosis, edema (the latter only accounting for 4% of the lesions), and bleeding (4). The observation of edema not being a significant component of BMLs led to a change in the terminology from “bone marrow edema” to “bone marrow lesion.” In a subsequent histopathological study of 60 knee OA specimens compared with ex vivo MRI findings, Muratovic et al. found increased vascularity, bone marrow edema, fibrosis, and necrosis in addition to increased trabecular bone and osteoid volume in BML areas compared with areas without BMLs (12). In another study by the same research group, also based on ex vivo MRI findings, they observed altered vascular characteristics and increased bone matrix micro-injuries and osteocyte density in areas with BMLs compared to areas without (11). The vascular changes consisted of increased arteriolar density, increased vascular wall thickness, and an increased ratio of wall thickness to lumen size (11). The findings by Muratovic et al. indicate that a combination of trabecular damage and altered vascularization contribute to the formation of BMLs.
Increased bone turnover, vascularity, and angiogenesis seem to be a relatively constant finding in OA-related BML areas, also observed in other joint areas such as the hip and the joints of the thumb base (29,30). Our histopathological findings are consistent with this, constituting new bone formation and vascular proliferation within BML areas (Table 4). Furthermore, our study identified bone marrow edema in BML areas, which has not been a consistent finding in previous studies. However, the correlation between histopathological edema and AUC/PE did not reach statistical significance (P = 0.08–0.18), and the quantitative analysis was inconsistent (Table 5). It is possible that bone marrow edema within BMLs may vary among individuals and in different study populations, possibly related to the stage and degree of OA (12).
The current analyses showed the potential of DCE-MRI for quantifying the amount and degree of contrast enhancement in BML areas, providing information about the underlying pathophysiological changes regarding tissue vascularization and, to some extent, marrow fibrosis, probably secondary to increased vascularization in the process of healing, whereas the degree of bone turnover could only be estimated histologically (Table 4).
The use of semi-quantitative DCE-MRI with TICs has also been shown to be valuable in synovitis related to knee OA. In a study by Riss et al., the degree of histological inflammation was found to be related to time intensity curve data in patients with end-stage knee OA (31), highlighting the general applicability of DCE-MRI for assessing signs of inflammation.
The present study has some limitations. These include the relatively small sample size. Although the biopsies were based on anatomical landmarks on the specimens and the preceding MRI findings, they may not always have included the exact BML areas, and DCE analyses in adjacent bone marrow were not performed. Furthermore, the assessment of the DCE sequences and the histopathological material was performed by single evaluators only. However, both evaluators were experienced within their field, and the intra- and inter-reader agreement in DCE analyses have previously been shown to be excellent (14).
In conclusion, our study revealed a correlation between BML areas and histopathological vascular proliferation/angiogenesis as well as marrow fibrosis, as indicated by semi-quantitative DCE analyses. However, the quantitative perfusion parameters appeared to possess limitations in precisely depicting the fundamental pathophysiological alterations.
Footnotes
Acknowledgement
We thank Rene Oestgaard, Silkeborg Regional Hospital, Silkeborg, Denmark, for contributing to data collection.
Declaration of conflicting interests
The authors declared no potential conflicts of interest with respect to the research, authorship, and/or publication of this article.
Funding
The authors disclosed receipt of the following financial support for the research, authorship, and/or publication of this article: This work was supported by the A.P. Møller og Hustru Chastine McKinney Møllers Fond til Almene Formaal.