
Abstract
Ponzo is a familiar name in psychology because of the illusion that takes his name. He had a long and productive career in Italy, and some of his work was translated for international journals already in his lifetime. However, few of these papers are available in English. We provide a commentary that considers how his name came to be associated with an illusion he did not discover. We explain the content of several papers, some of which are often cited in a wrong context in the literature (i.e., papers on touch mentioned in relation to the Ponzo illusion). More importantly, we discuss his contribution to the study of perceived numerosity, and provide a full translation of his important 1928 paper, including a redrawing of its 28 illustrations.
Keywords
Mario Ponzo (1882–1960) is best known for a configuration he examined and that now bears his name: the Ponzo illusion is one of the best known optical geometrical illusions. In 1912, Ponzo illustrated this illusion with two circles of the same diameter; the one which is closer to the converging lines appears larger than the other one (Ponzo 1912a, Figure 1a). The size distortion even occurs with facial portraits, as is evident in Figure 1b. In 1928, Ponzo re-examined the illusion and presented a figure with two equal lines of dots rather than circles (Figure 1c).
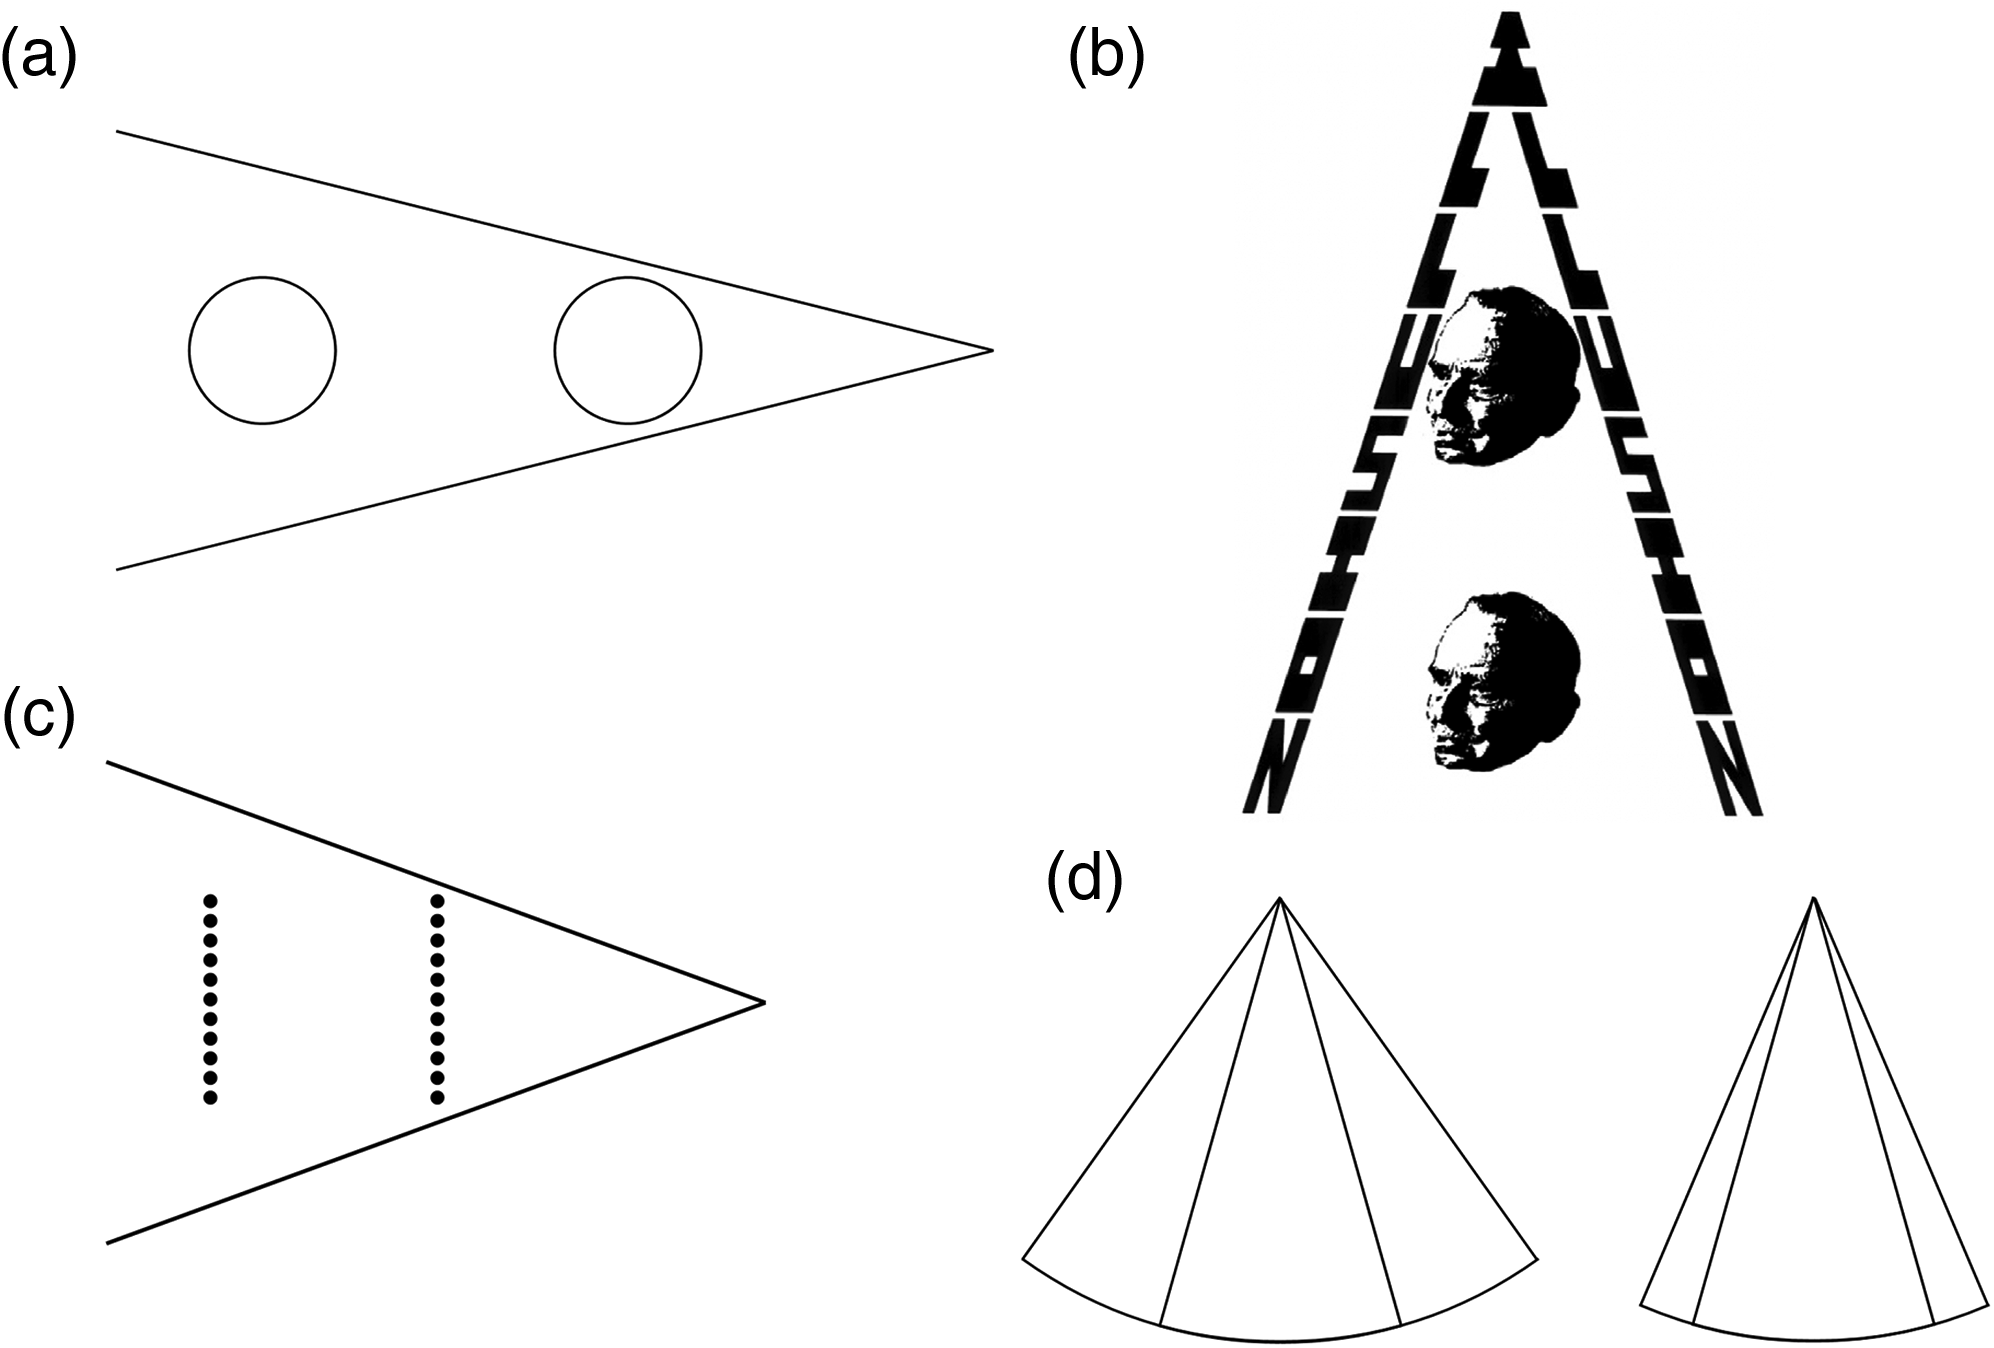
(a) Redrawing of the figure from Ponzo (1912a); (b) Two equally sized portraits of Mario Ponzo enclosed within the diverging letters of the word ILLUSION (see Wade, 2014); (c) Redrawing of Figure 6 in Ponzo (1928); (d) Redrawing of a figure from Kiesow and Ponzo (1914).
In these two papers (1912a and 1928) Ponzo was using a misperception of size as a tool to explore other phenomena. In the first case he proposed that a size contrast effect can explain the Moon illusion, in the second he was systematically studying perception of numerosity and how numerosity is affected by extent. The illusion itself was presented as a known case of size contrast, along with related examples (Figure 1d).
We will commence with a brief account of Ponzo's life followed by a discussion of his work, and in particular his contribution to the study of perception of numerosity. Unlike the Ponzo illusion, his research on numerosity has been neglected. It was described most fully in an important paper that appeared originally in German in 1928 (Ponzo, 1928). The article is translated into English here. Ponzo had a long and productive career, however, most of his publications have appeared in Italian, some in German and some in French. The lack of English translations has probably limited and distorted his legacy.
Mario Ponzo and the Ponzo Illusion
Ponzo was born in Milan and studied medicine at the University of Turin graduating in 1906. His interests were also in psychology, and he was recruited to the newly formed psychology group in Turin directed by Friedrich (Federico) Kiesow (1858–1940) who had worked with Wundt in Leipzig and brought the “New Psychology” to Turin. Kiesow was Ponzo's teacher and mentor and Ponzo remained his assistant for 25 years.
As a curiosity we note that Mario Ponzo was born in the same year, 1882, as Carlo (Charles) Ponzi, infamously known for the Ponzi scheme. Ponzo/Ponzi is a fairly common Italian name. For those who care about pronunciation in both cases the z should sound like the “ts” in the English word “mats.”
In 1910 Ponzo published (in Archiv für die gesamte Psychologie, written in Italian) a long paper on the Aristotle's illusion, a French version of which was published in 1911 in Archives Italiennes de Biologie. Although in different languages, the titles are the same (“On some illusions in the field of tactile sensations. On Aristotle's illusion and analogous phenomena”), but the 1911 version is shorter. These papers are sometimes cited in relation to the Ponzo illusion, but they are about something totally unrelated. When two fingers of one hand are crossed, and they come into contact with a small object, the sensation is that of touching two objects rather than one. This was originally described by Aristotle in Metaphysica, and in Parva Naturalia (IV century BCE) (Benedetti, 1985). Ponzo describes a number of variants, and manipulations that include testing conditions with eyes closed or open. Observations are reported also with different parts of the body that can be crossed over or folded, including the outer ear, the lips and the testicles. Although these observations do not meet modern standards in terms of how the methods are described, many participants are clearly involved, and Ponzo summarises the results and discusses theoretical implications. A key problem at the time was to understand whether misperception of touch demonstrates that there is a representation of that body part (as opposed to a mental image for those parts).
Another paper often cited in relation to the Ponzo illusion appeared in Archives Italiennes de Biologie in 1912 (Ponzo, 1912a). Articles in this journal were predominantly in French and this applied to Ponzo's discussion of “visual illusions of angular contrast” (a version in Italian was published later in the year, Ponzo, 1912b). In this short note, he suggests that size contrast effects can explain the Moon illusion. Because of this, the only figure in this paper has two circles as elements of the illusion (Figure 1a). Ponzo did not claim to have discovered what we now know as the Ponzo illusion. In the initial sentence of the article, he cited an earlier reference (Sanford, 1900) in which an almost identical illustration to that shown in Figure 1a was published. Sanford (1900) was a translation into French of Edmund C. Sanford's (1898) textbook.
Many other contrast illusion figures were described prior to Ponzo (see Arai and Arai, 2013; Vicario, 2011; Wade, 2014, 2016, 2022) and those involving converging lines were presented by Thiéry (1895) and Sanford (1898). In the context of named visual illusions, like the Ponzo illusion, it is not unusual for earlier versions to exist (see Vicario, 2008, 2011) but it is uncommon to find such a precise parallel as that between Sanford (1898, p. 224) and Ponzo (1912a, p. 327). In fact, Ponzo stated that he reproduced the figure from Sanford: “The optical illusion reproduced in the figure below is already known [Sanford, 1900] and it belongs to the group of contrast optical illusions” (p. 327).
Ponzo had many interests, and he was an active representative of sensory perception in Turin and later an international ambassador for Italian psychology. In Ponzo's obituary Canestrelli (1960) did not even mention the Ponzo illusion. Ponzo's research on cutaneous sensitivity and touch (initially with Kiesow) was emphasised as was his later work on psychomotor processes and on applied psychology.
The Ponzo illusion is still the topic of numerous research articles (e.g., Cretenoud et al., 2020; Cretenoud et al., 2021; Dobias et al., 2016) and reviews (e.g., Yildiz et al., 2022) and is included in many catalogues of illusions (e.g., Bertamini, 2017; Shapiro and Todorović, 2017). In general, explanations are of two types, the first is about contrast (Fisher, 1969; Robinson, 1972), the second is about misapplied size constancy (Gregory, 1963). Both of these ideas have clearly a long history; we have seen that the term contrast was used by Ponzo, and the role of depth is also considered in Thiéry (1895). Thiéry presented figures with several converging lines that were crossed by two lines at different distances from the point of convergence; the line nearer to the convergence point appeared longer. He also described (but did not illustrate) a similar converging pattern with circles at different distances and they appeared successively smaller the greater the separation from the point of convergence. Von Bezold (1884) had earlier illustrated the same reduction in apparent size with rectangles at different distances from the centre of radiating lines.
Mario Ponzo and Numerosity
The association of Ponzo's name with an illusion he did not discover is firmly established in the literature, by contrast his research on perceived numerosity has suffered the opposite fate. It is for this reason that his 1928 paper deserves translating into English. The title is “Illusions of perceived quantity” and the 1928 German version is a direct translation from Italian, although the Italian version was published only the following year (Ponzo, 1929). The reason is that the German paper was published on the occasion of Kiesow's 70th birthday. The Italian version is published in Archivio italiano di psicologia, a journal founded by Kiesow ten years earlier, in 1919.
Ponzo's starting point is that people can judge the magnitude of sets, and this is a fundamental way in which we appreciate our environment. Number, together with space and time, form a “trinity that governs most of our active responses.” The first part of Ponzo's discussion is very modern, because it highlights the fact that we have “direct impressions” of numerosity, without counting the elements. This anticipates therefore the idea of a “number sense,” and of the approximate number system (ANS). It has been proposed that this mechanism underlies the process of estimation of large sets of elements (Anobile et al., 2014; Burr & Ross, 2008; Dehaene, 2011). The ANS is also believed to be the building block for numerical development in general (Dehaene, 2009; Piazza, 2010), but is not unique to humans (Cantlon & Brannon, 2006; Rugani et al., 2009).
Although much progress has been made, some aspects of perception of numerosity remain controversial. Biases are produced by several factors, such as the size of the elements, regularity, density, and area. Some of these are anticipated by Ponzo, when he shows that extent affects judgments of numerosity, as well as density, in terms of the gap between the elements. Carefully separating effects of area, density and numerosity has proved particularly difficult (Anobile et al., 2014; Dakin et al., 2011; Raphael et al., 2013), and observers may rely on sampling (Solomon & Morgan, 2018).
Ponzo uses the term “quantity” and “collective” rather than “numerosity” (“quantità,” “collettività” and “numerosità” in Italian). This works better if one wants to avoid any implication of formal mathematical operations, and of counting. We kept this in the translation, but in our commentary we revert to the now more common term “numerosity.”
In order to study perception of numerosity, Ponzo suggests that direct comparison of two sets is an ideal method. This is easily implemented in the case of vision, and the examples he provides are for visual stimuli, but he notes that other senses may serve similar functions. The comparison procedure avoids biases that may contaminate numerical estimation, and is a strategy later adopted in many studies in the literature (e.g., Bertamini et al., 2016). Most of the examples in Ponzo have two images next to each other, and readers are asked to assess which set is more numerous. The exact number varies (the largest is 21 in Figure 22), and it is almost never mentioned in the text. (Figure numbers in the following commentary refer to those in the translation, apart from Figure 2.) Note that these numbers are above what is considered the subitising range, with the only exception of Figures 25 and 26. Here we see four circles, and Ponzo suggests that how they group is important to let observers treat each element as a unit. This spatial overlap is indeed a factor in subitising; concentric rectangles, for instance, are not subitised (study by Trick & Pylyshyn, cited in Dehaene, 1992).
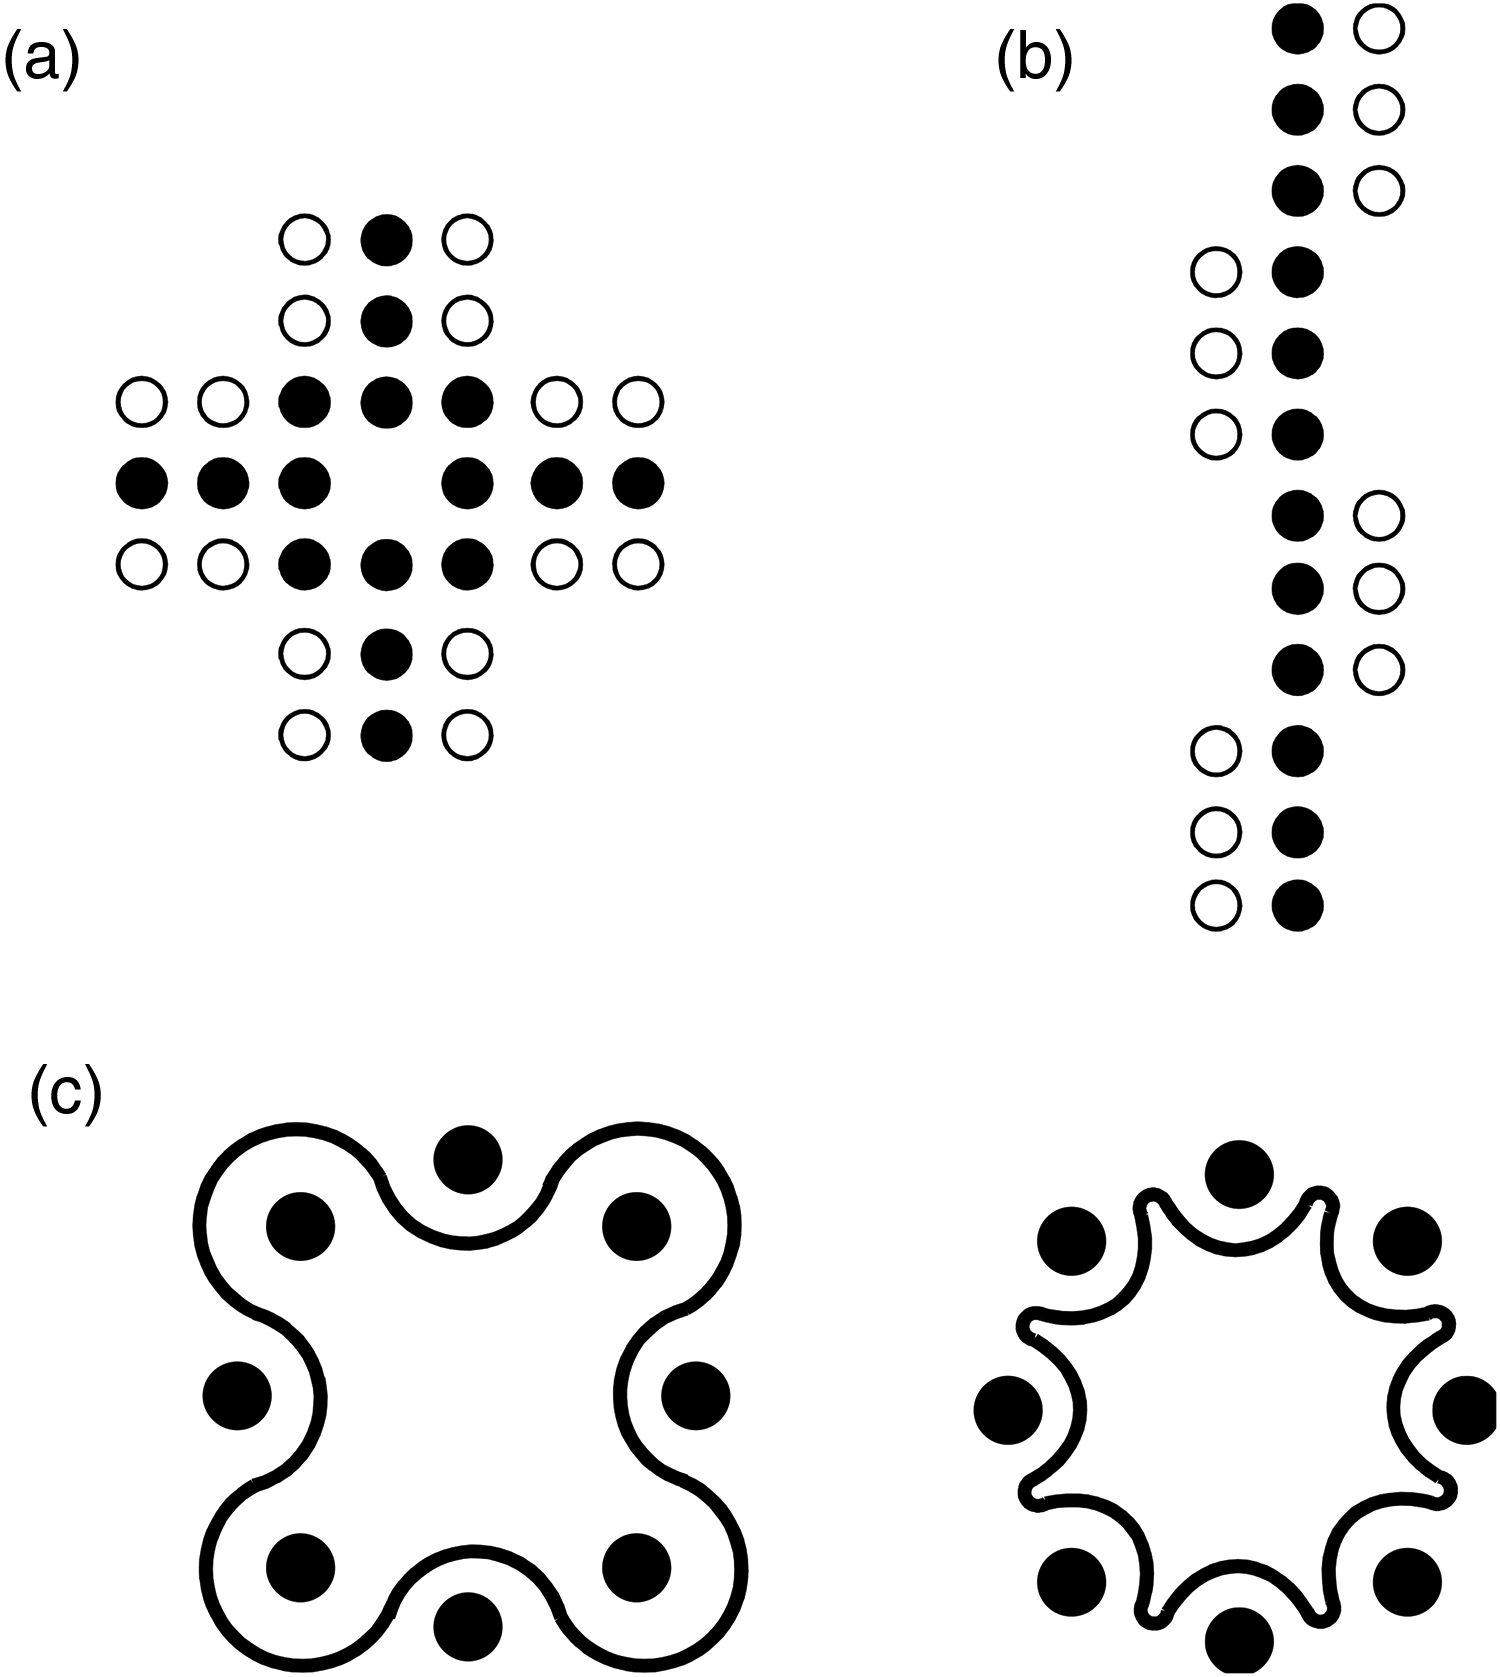
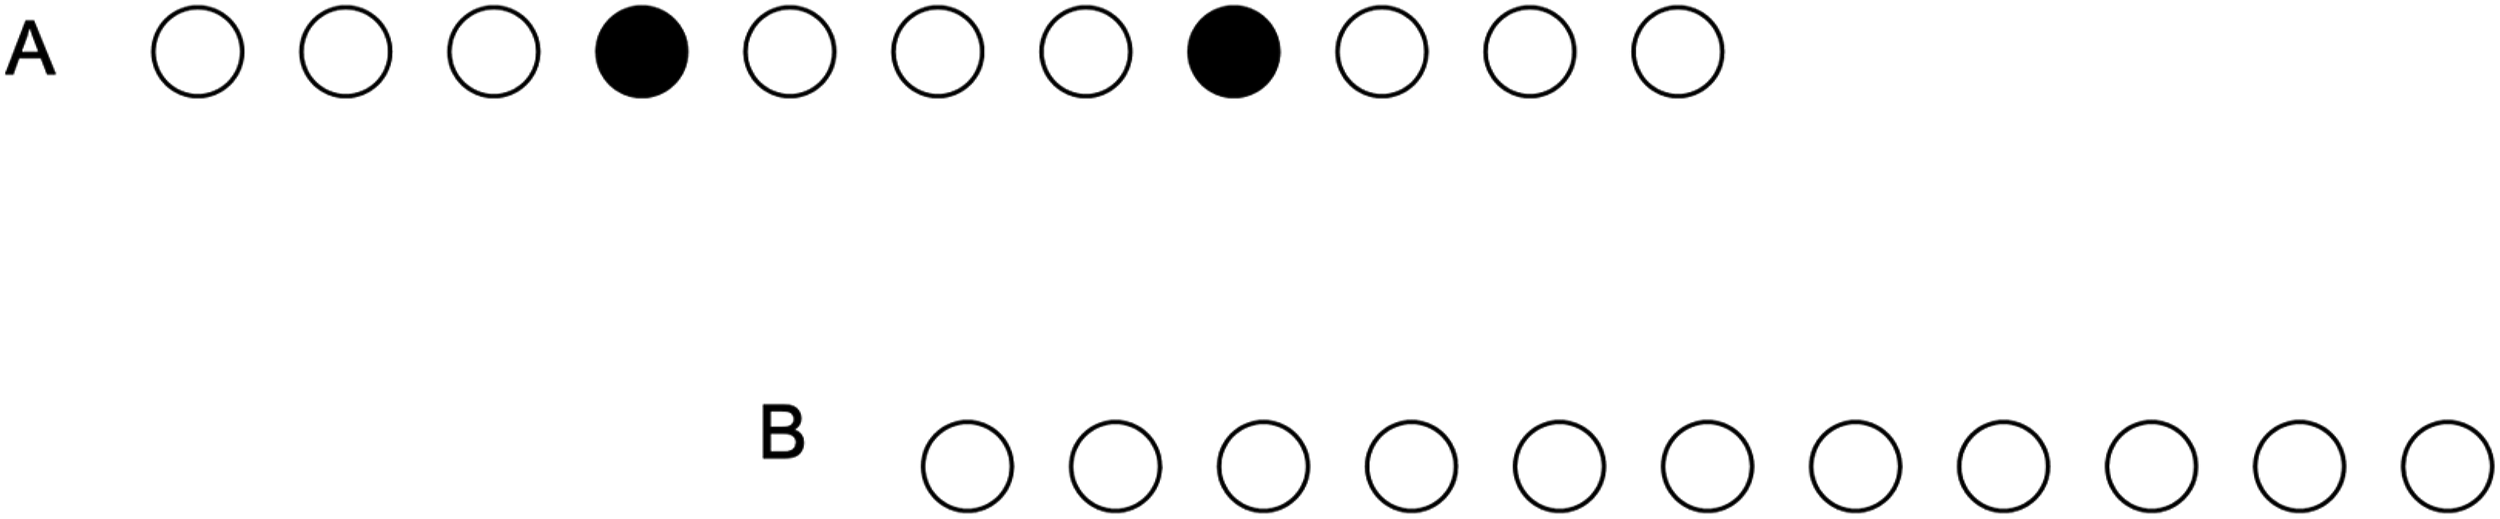
(a) Redrawing of the Solitaire illusion from Frith and Frith (1972). (b) Another configuration from Frith and Frith (1972). In both cases the inner set of elements (black) appear more numerous than the other (white) set. (c) Figure 27 from Ponzo (1928), in which the elements separated into groups appear less numerous than those forming a single group.
After the introduction, there is a section on the influence of figural extent (i.e., area) on numerosity estimation. In the current literature on numerosity, area has been extensively studied. Many studies have confirmed that perceived numerosity is greater for larger areas of the configuration (Dakin et al., 2011; Krueger, 1972; Poom et al., 2019; Tokita & Ishiguchi, 2010; Vos et al., 1988).
Ponzo's approach is to exploit illusions of size, so that we can see a change in perceived numerosity for areas that are physically identical but are perceived as different in size. For example, he uses a version of the Müller-Lyer illusion to demonstrate this (Figure 3). It is in this context that we also find what is now known as the Ponzo illusion (Figure 6): note that Ponzo is using this contrast effect as a tool to study perception of numerosity rather than studying illusions of size per se.
That perceived rather than physical extent is the critical factor can be seen by comparing Figure 5 with Figure 6. They both employ triangles. In the first case elements towards the upper part of the triangles are underestimated compared to the elements in the lower part. In Figure 6 we have exactly the opposite. Simply reasoning on the basis of the closeness of the outside lines of the triangle to the dots does not work. The difference is that in Figure 5 the elements are along the main axis of the triangle, and in Figure 6 they are transversal. Why would this be so important? Ponzo suggests that in the first case the length of the line of dots is affected by the distance from top and centre of the triangle. It was known that the centre tends to be mislocated towards the base. These other perceptual mechanisms are therefore fundamental in determining perceived extent, which in turn affects perceived numerosity.
After extent, Ponzo considers the complexity of the elements and their distance. Simple lines are underestimated compared to composite (Figure 8) or curvy lines (Figure 9). Elements that are more easily segmented contribute more to perceived numerosity. This explicit reference to whether each element is a unit, or whether in some cases it becomes part of a sub-unit and therefore loses individuality anticipates the key idea of occupancy (Allik & Tuulmets, 1991; Vos et al., 1988). In particular, Ponzo notes the importance of the gap between the elements. But as in the case of extent, it is the perceived distance that matters. This is clearly shown in Figure 12, the circle on the right appears to have more spokes, even though it is simply the central region of the circle on the left.
Ponzo is also aware that some factors may work against each other, so that it is possible for larger extent not to be associated with greater numerosity, as in Figure 12. The same conflict is present in Figure 16. This can also be seen as a direct manipulation of density, another aspect extensively studied in the literature on numerosity (e.g., Anobile et al., 2017; Durgin, 2008).
The last aspect discussed is that of grouping. This is illustrated by various manipulations, and is perhaps the most difficult factor for models of perceived numerosity to capture. We highlight here one configuration, that of Figure 27. The effect is clear, we estimate the numerosity to be higher on the right presumably because the elements are seen to belong to a single group. In the literature, clustering has been studied in relation to the regular-random illusion (Ginsburg, 1976) and the occupancy model. Effect of physical manipulation of how elements are connected has also been reported (Anobile et al., 2017; Franconeri et al., 2009). Recently, Poom et al. (2019) have shown that perceived numerosity decreases with number of groups.
We note that the configuration in Ponzo has also a resemblance to the Solitaire illusion, which we illustrate in our Figure 2 (Frith & Frith, 1972). The Solitaire illusion is a robust effect, even when the regularity of the configuration is weakened (Bertamini et al., 2023). In their original report, Frith and Frith note that the explanation must be the role of grouping and Gestalt formation. Although Ponzo did not use the term Gestalt, his analysis is very much the same as that in the more recent literature.
The footnotes in the paper show that even in these early days of the history of psychology, a few other authors had studied numerosity judgments. We highlight one name, that of Silvia De Marchi. Ponzo makes reference to a conference presentation from 1923 (footnote 11). De Marchi was a student of Vittorio Benussi, in Padova, and we find a careful analysis of numerosity already in her thesis (1924). Interestingly, a full paper was published in the very same issue of the Archivio italiano di psicologia in which we find Ponzo's paper (De Marchi, 1929). De Marchi's analysis is more formal, and her stimuli are clouds of dots rather than shapes. The task used is also very different as De Marchi developed a technique of magnitude estimation (Agostini & Luccio, 1994). Unfortunately, there is no English translation available at the moment of this pioneering work.
Because, unlike De Marchi, Ponzo approach is based on providing examples, the strength of these effects is not measured. Indeed, it is even possible that some effects would not be confirmed by careful experimentation.
We conclude with two simple considerations. First, early work on numerosity has been forgotten, largely because of a language barrier, and we hope it can be more fully appreciated. Second, and more importantly, we think the many examples in the 1928 paper can provide inspiration for more research and the development of our understanding of perception of numerosity.
Translation
Ponzo's article is based on a communication he delivered in Italian to the 1924 International Congress of Philosophers, held at Naples. A version in Italian was published in 1929. The translation is from the German version (Ponzo, 1928) and checked against the Italian (Ponzo, 1929). The figures have been redrawn for clarity and they retain the features of originals. Footnotes are listed at the end of the text and the references therein follow the format presented by Ponzo. (Institute for Experimental Psychology from the K. University of Turin
[Foundation : EE Pellegrini])
From Marlo Ponzo, Turin
translated by dr. Hertha Michel, Leipzig
Preliminary Remarks
We often judge the magnitude of quantities presented to our mind as actual sensations, as memories of past events, or as products of the imagination.
This estimation of quantity is certainly one of the original forms of orientation in the environment. With the appreciation of space and time, it forms a fundamental trinity that governs most of our active responses. Often, if not always, it appears as an expression of our instinctive striving for a quantitative evaluation related to the preparation for defence, adaptation or attack.
Just as we constantly convert time concepts into spatial concepts and vice versa, so we constantly formulate estimates for sets of elements that are summarised as a unit.
Due to this interdependence between space, time and quantity estimates, the comparison of quantities with surface or volume also appears natural, immediate and intuitive to us. Based on these comparisons, in the experiments by Carletti 2 and by Fambri 3 subjects were asked to estimate a certain number of marks performed by a person with an awl (a small pointed tool for making holes), by specifying cubes of different sizes.
Since our quantity estimates are not only original, but also fundamental relational experiences, the principles governing them must also have a general character and reveal a structure and uniformity across the different sensory experiences.
We must be able to arrive at these general principles by estimating quantities in many diverse contexts. The remaining variability will ultimately relate only to secondary factors that may obscure these principles but cannot eliminate them.
These estimates of numerosity are based primarily on the possibility of segmenting the whole into elements, so that each element has a unitary value. An individual can form these elements in their own way. Elements have the property that they are distinguishable and individualised in relation to the other elements.
Thanks to counting, an operation that indicates a cultural achievement, we can evaluate the factors that facilitate or hinder estimates of quantity, by ascertaining the difficulties encountered or the time spent in carrying out the calculation.
We can also try to achieve this goal by using our ability, acquired through repeated counting, to obtain impressions of quantity immediately and numerically, without counting each unit individually. In this case, the numerical indications, which have absolute character, are a general judgment formed as an immediate impression.
In the study of quantity judgments, the system of comparisons is more direct and clean, because it avoids any reliance on other mental operations. These comparisons can be made between sets formed from objectively existing or only imaginary units, or between existing and remembered sets. The simplest of these comparisons is the one that is limited to just two sets, both of which are objectively present at the moment when the judgment is formed. The type of comparison can, in its elementary form, consist in the assertion of the quantitative equality or inequality of the sets compared with one another.
This experimental condition is perfectly possible in the visual domain, less perfectly in the tactile and still less in the acoustic domain.
The quantities to be compared can be distributed over a surface in a wide variety of ways. One has to select from the immense treasure trove of possibilities those in which, despite the number of constituent elements remaining the same, the judgment of inequality is difficult or where equality becomes doubtful. Under such experimental conditions, which are to be determined empirically, the factors which lead us to a particular estimation are more easily discerned, whereas under ordinary circumstances they escape us.
Although this route, as mentioned, is the simplest of the various ones that can be taken, it seems to have been seldom used by other investigators.
Despite its simplicity, my work is only at its beginning. Its final stage, however, which can bring about a complete explanation of the various principles of these judgments, can only be achieved through further investigations.
The Influence of the Figural Extension on the Estimation of the Quantity
In the history of scientific investigation, we are constantly surprised by the fact, repeated over and over again, natural as it may seem, that the attention focused on the study of a given phenomenon prevents us from observing other remarkable phenomena, even if they are related to the one with which we are studying. This has also been the case in the field of the so-called optical-geometric illusions, and is repeated in the example that I will give here.
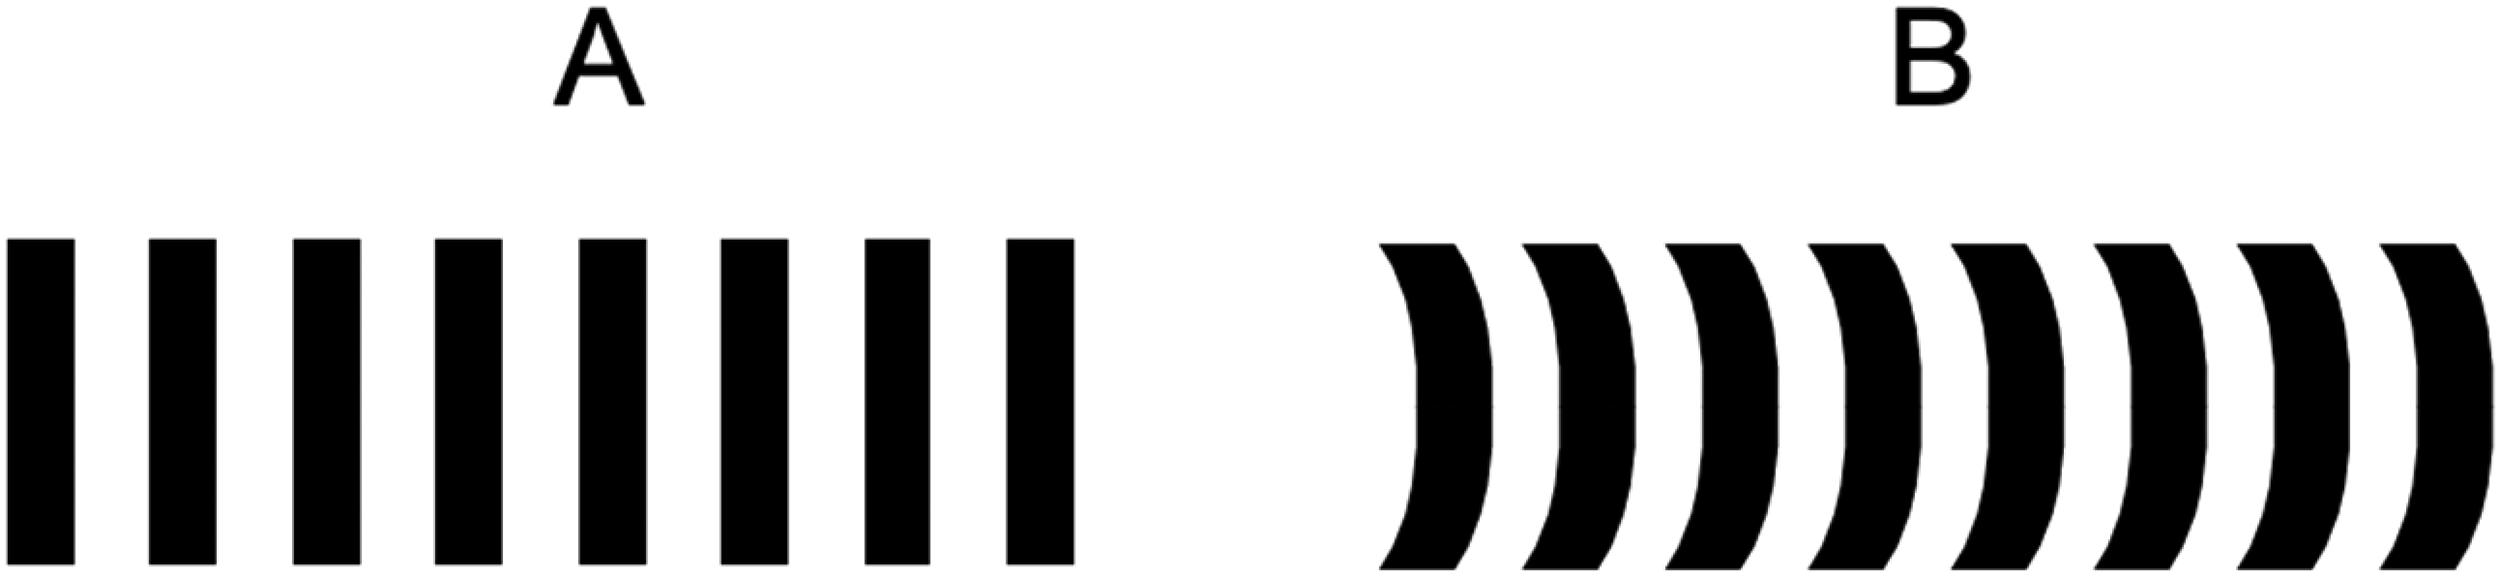
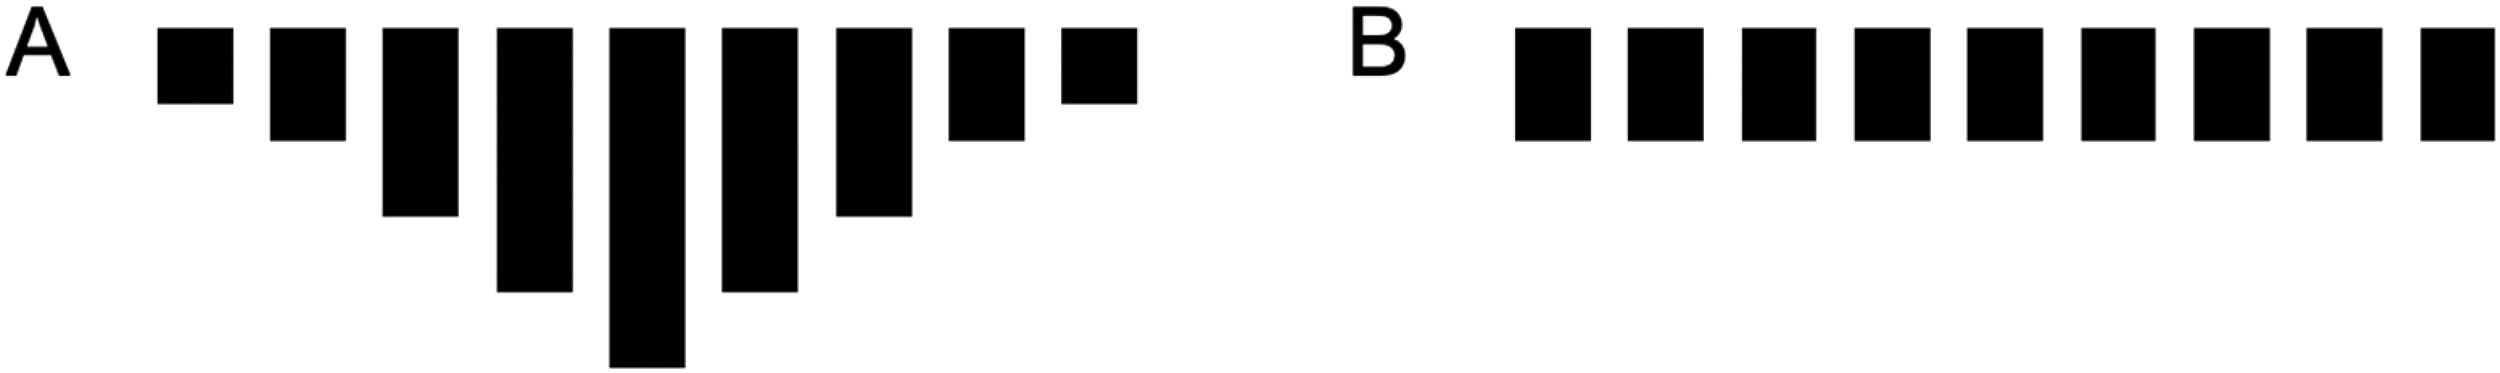
In his work on geometric-optical illusions, Botti, using figures he designed, one of which I reproduce here (Figure 1), shows how the horizontal lines appear longer in A than in B, although they are objectively the same. 4
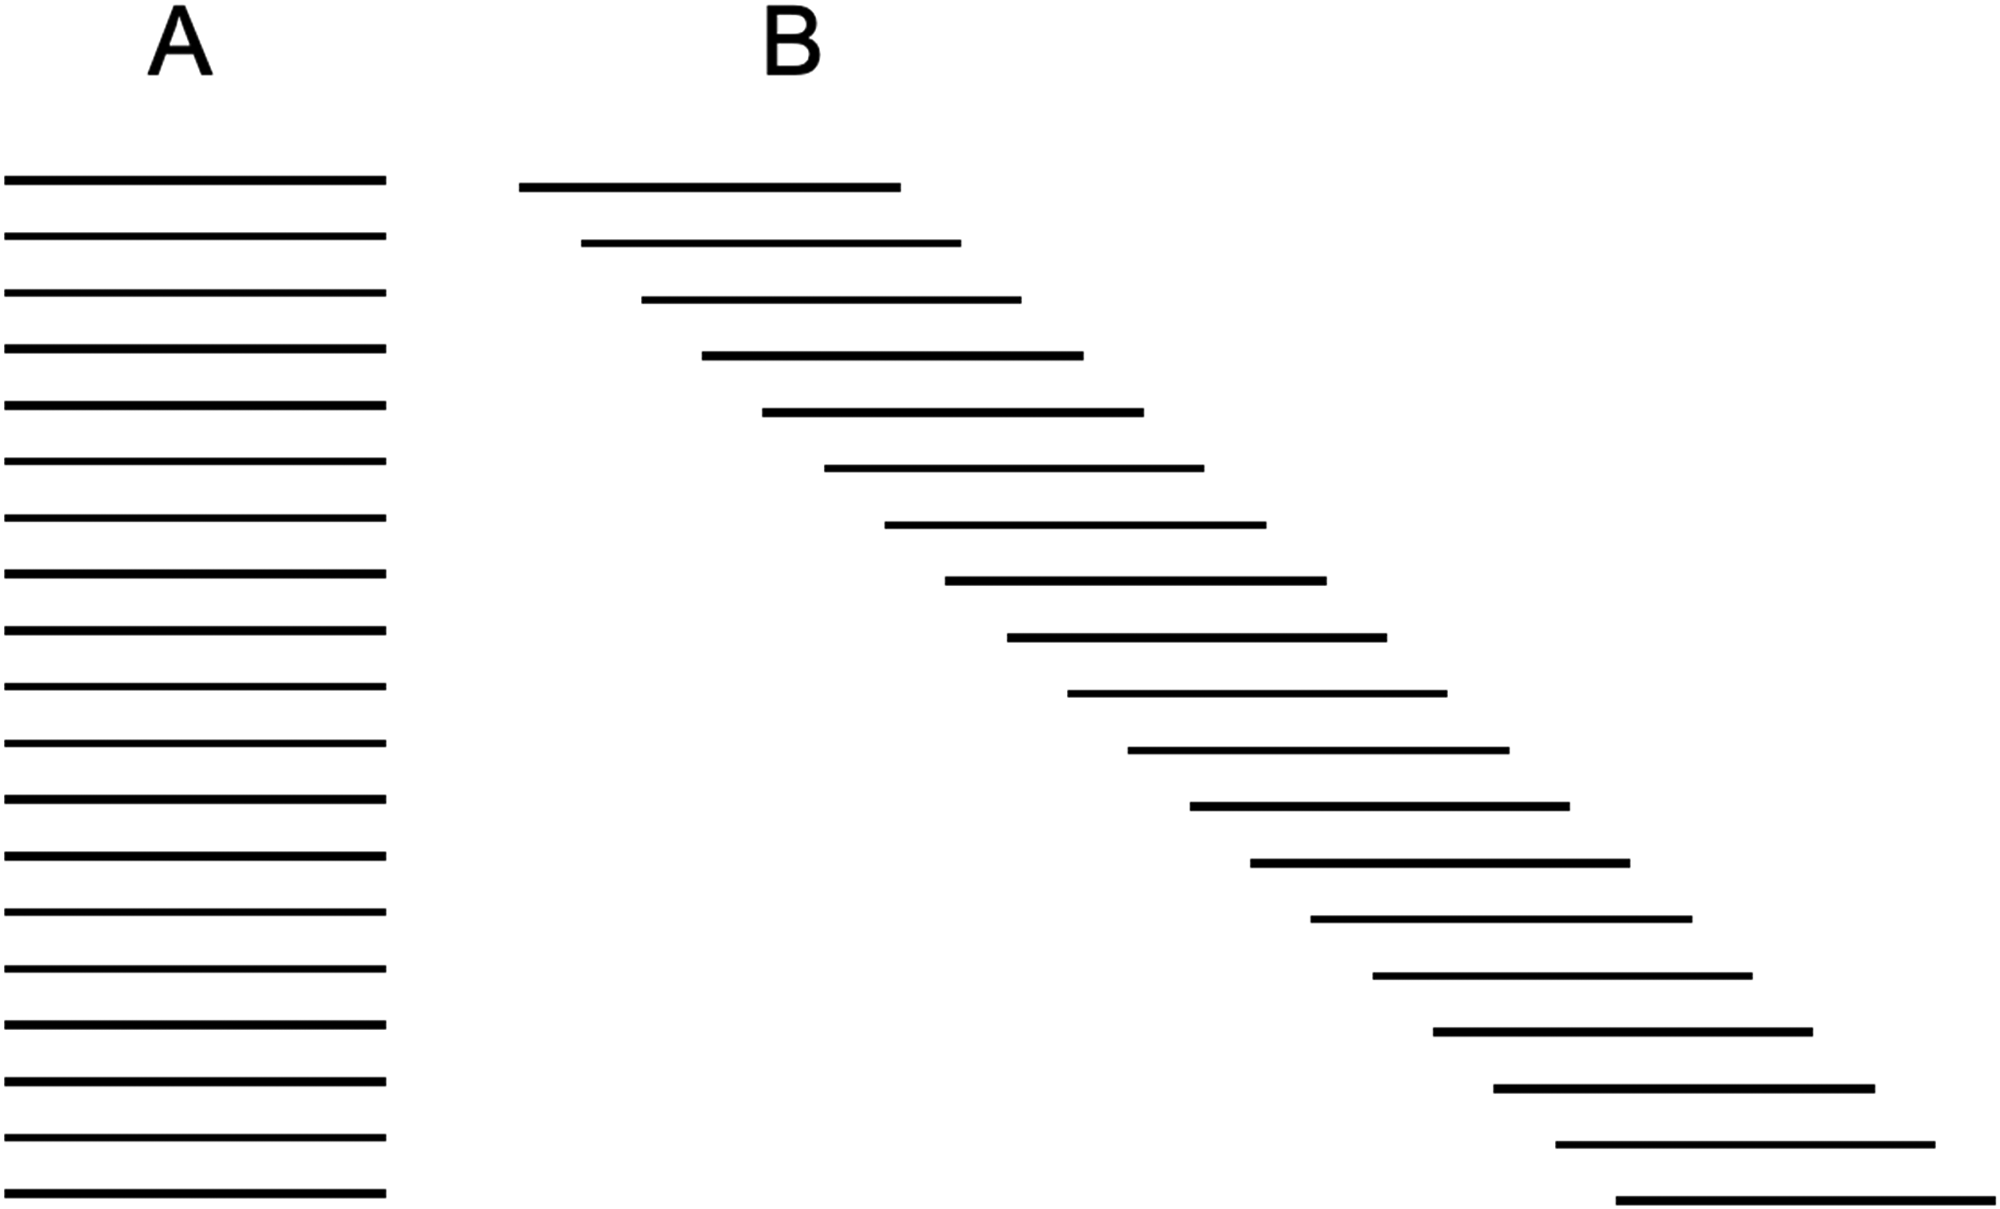
Botti tried to explain this interesting finding. In his writing, however, there is no reference to the apparent difference in the number of lines which make up A and B. But from our point of view, the B series appears to be composed of a far greater number of strokes than the A series.
Botti's figure may be the starting point for some remarks on factors affecting our estimation of quantity.
The explanation that immediately presents itself to anyone looking for a reason for the numerical overestimation of B consists in the fact that in this series the strokes are oblique. As this oblique extent is considerably greater than the vertical along which the strokes of A are distributed, subjects mostly attribute the error in quantity estimation to this difference.
Similarly, in the comparison presented in Figure 2, which I also take from Botti's work, the lines of B are estimated to be more numerous because the whole they form gives the impression of greater extension in the direction of the drawn diagonal.

One understands that the influence of a larger extension of the figure can be felt in the estimation of quantity even where it is only illusory.
Indications of such an underestimation and overestimation of the extent are already shown in rows of the same number of points, which together form a horizontal, vertical and oblique line of objectively the same length. There is then a tendency to value the points which form the perpendicular or oblique line as more numerous than those of the horizontal. 5
Such indications of errors in the estimation of quantities, which are not always present and not quite clear for all subjects, have a strong effect on figures such as 3, 4, 5, 6.

In Figure 3, the black dots in the circle appear fewer than those between the two concave semicircles that face each other, because in the latter case the linear extension formed by the dots is affected by the line illusion, which is associated with the similar Müller-Lyer effect.

Similarly, in Figure 4, due to the overestimation of the width of the lower crown segment, the number of points lying on this crown segment appears to be greater than those in the upper segment.
In Figure 5, because of the well-known error that occurs when subjectively determining the centre of a triangle (Day & Kimm, 2010), the number of points on the lines in triangle A appears to be smaller than in triangle B.
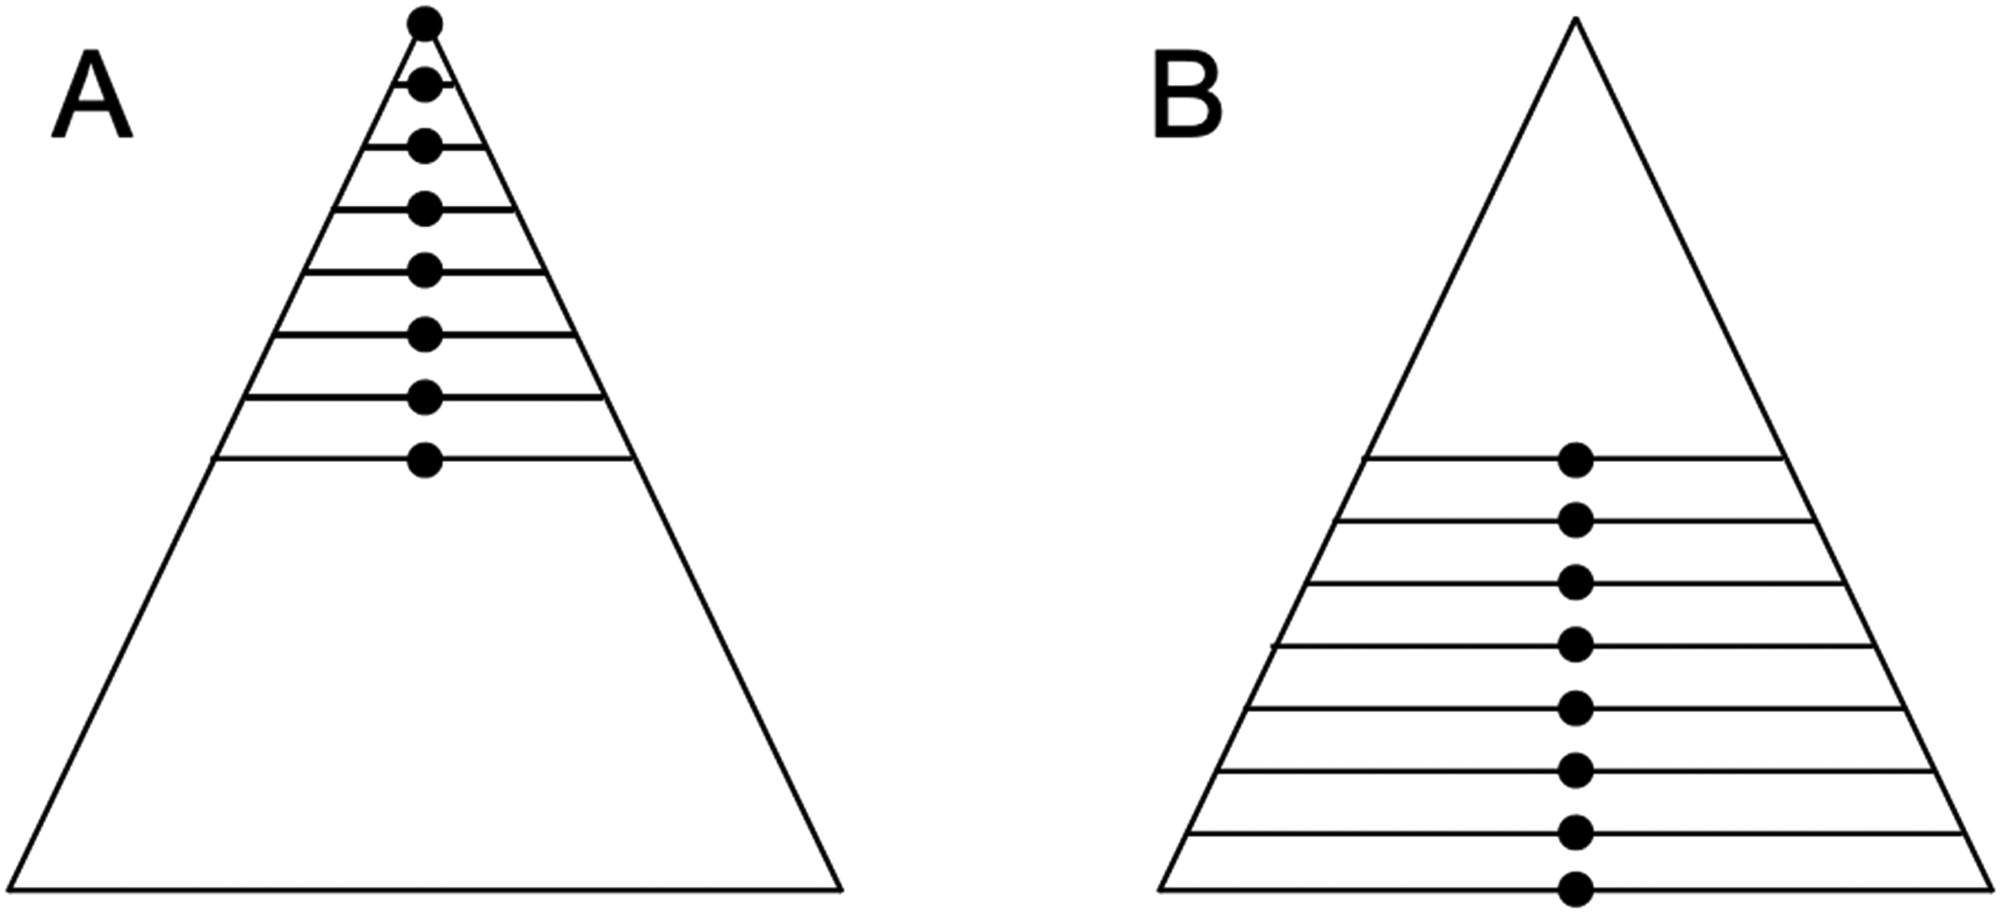
Of the two rows of points in Figure 6, located inside an angle, the points in B appear to be more numerous than in A, again under the influence of the overestimation of the linear extent.
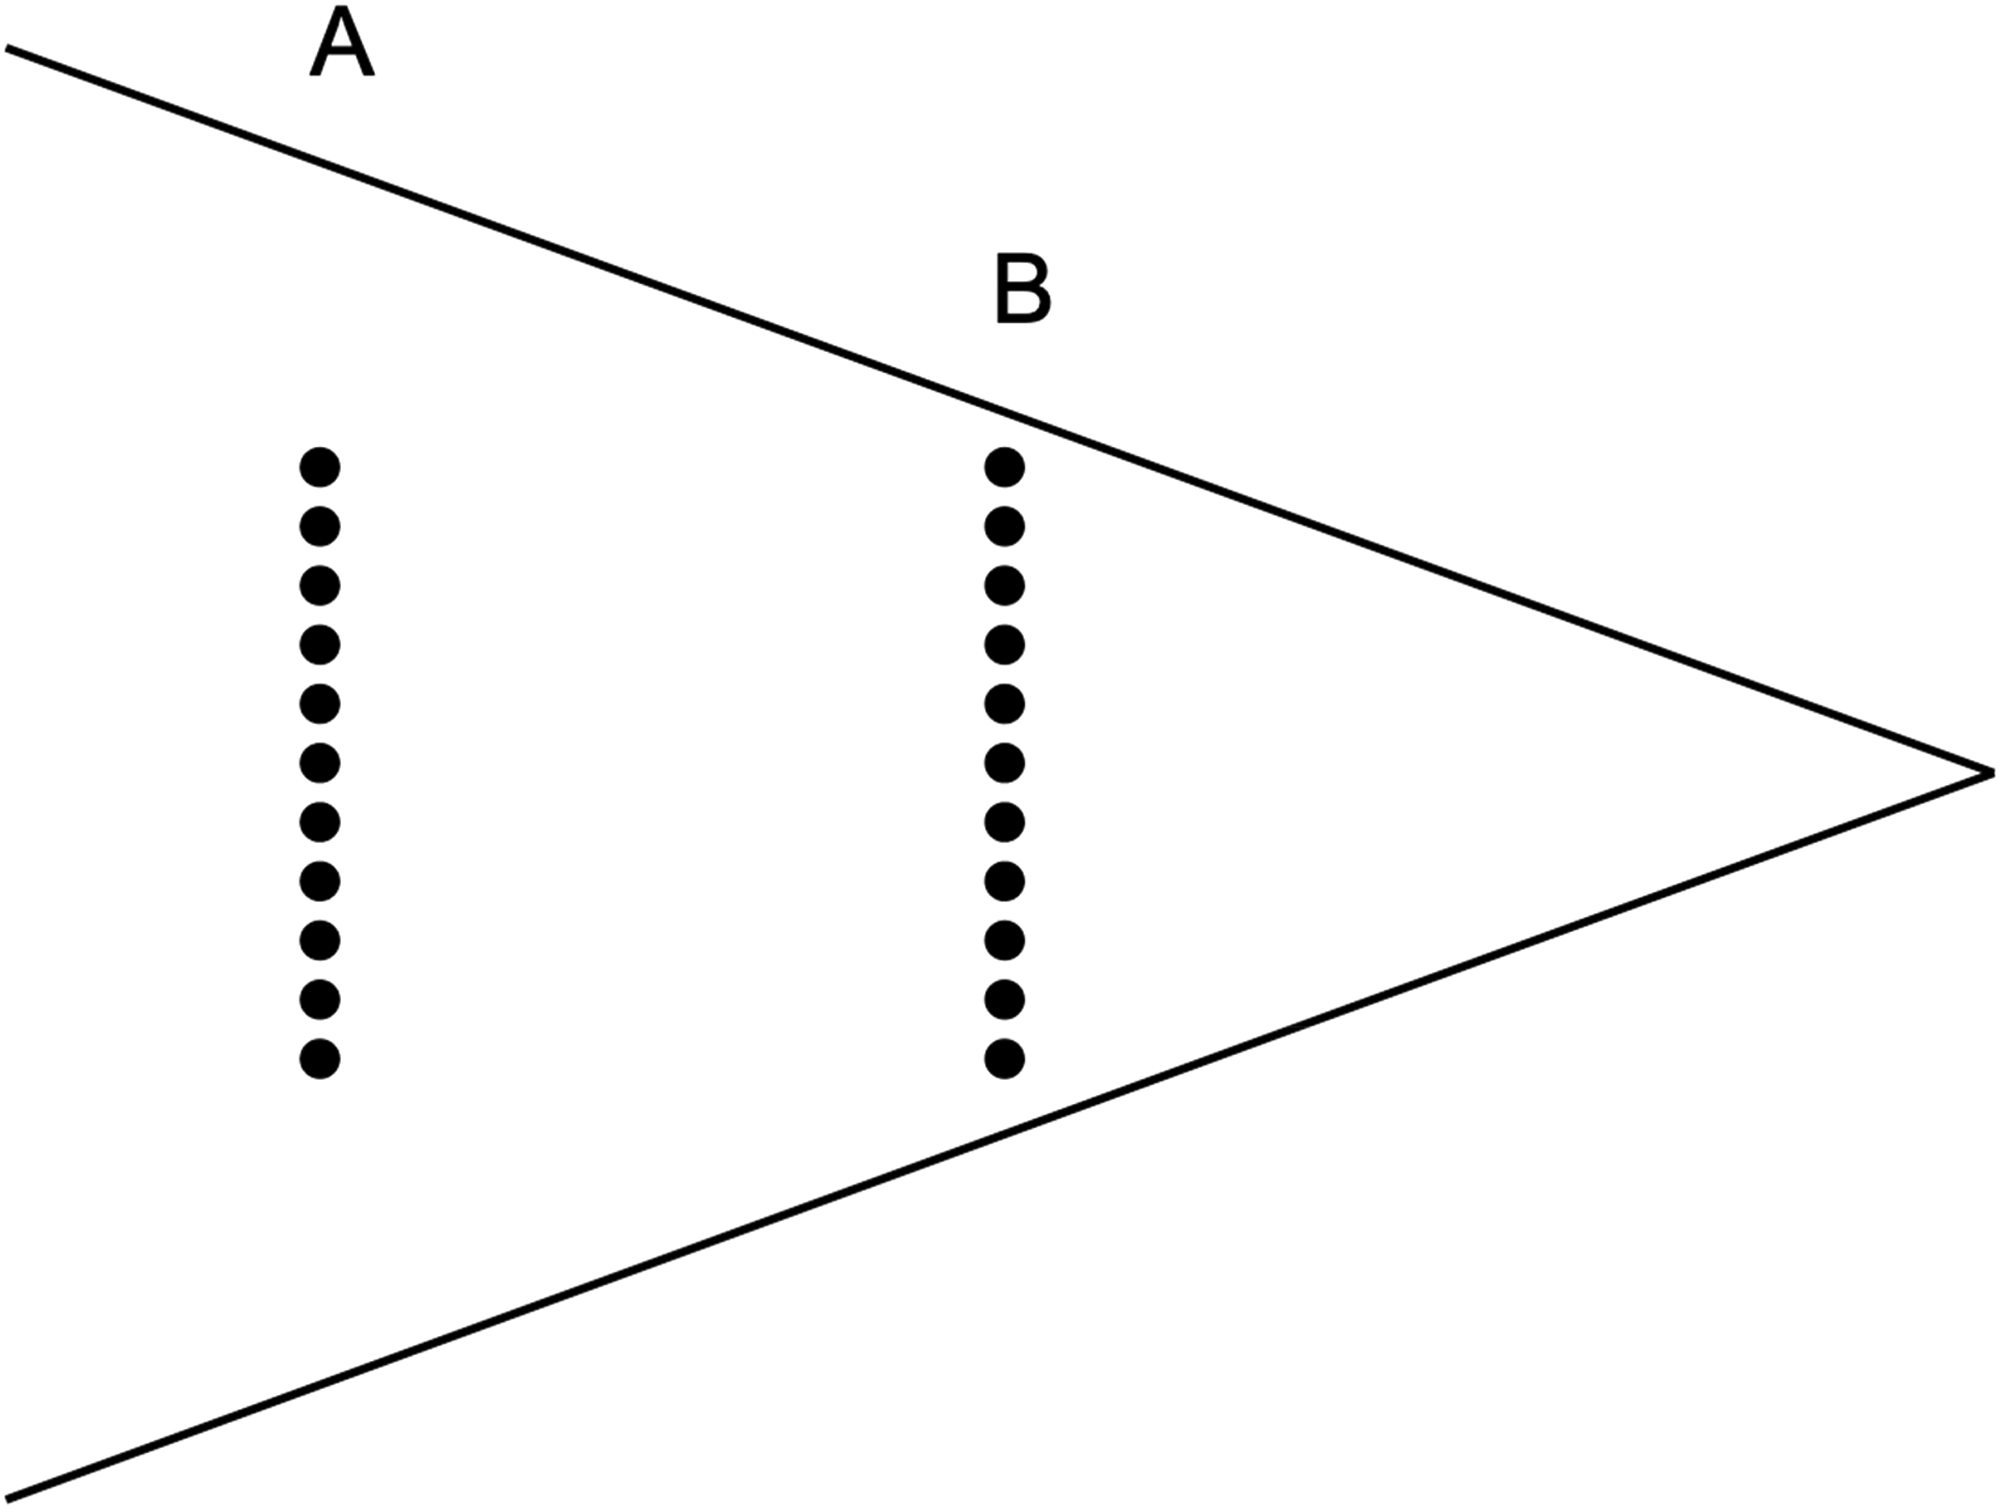
As can be seen, these last figures form variations of the same motif: that is, the quantities are overestimated where the units to be estimated appear to be distributed over larger areas in the figure as a whole.
Influence of the Shape of the Individual Set Element
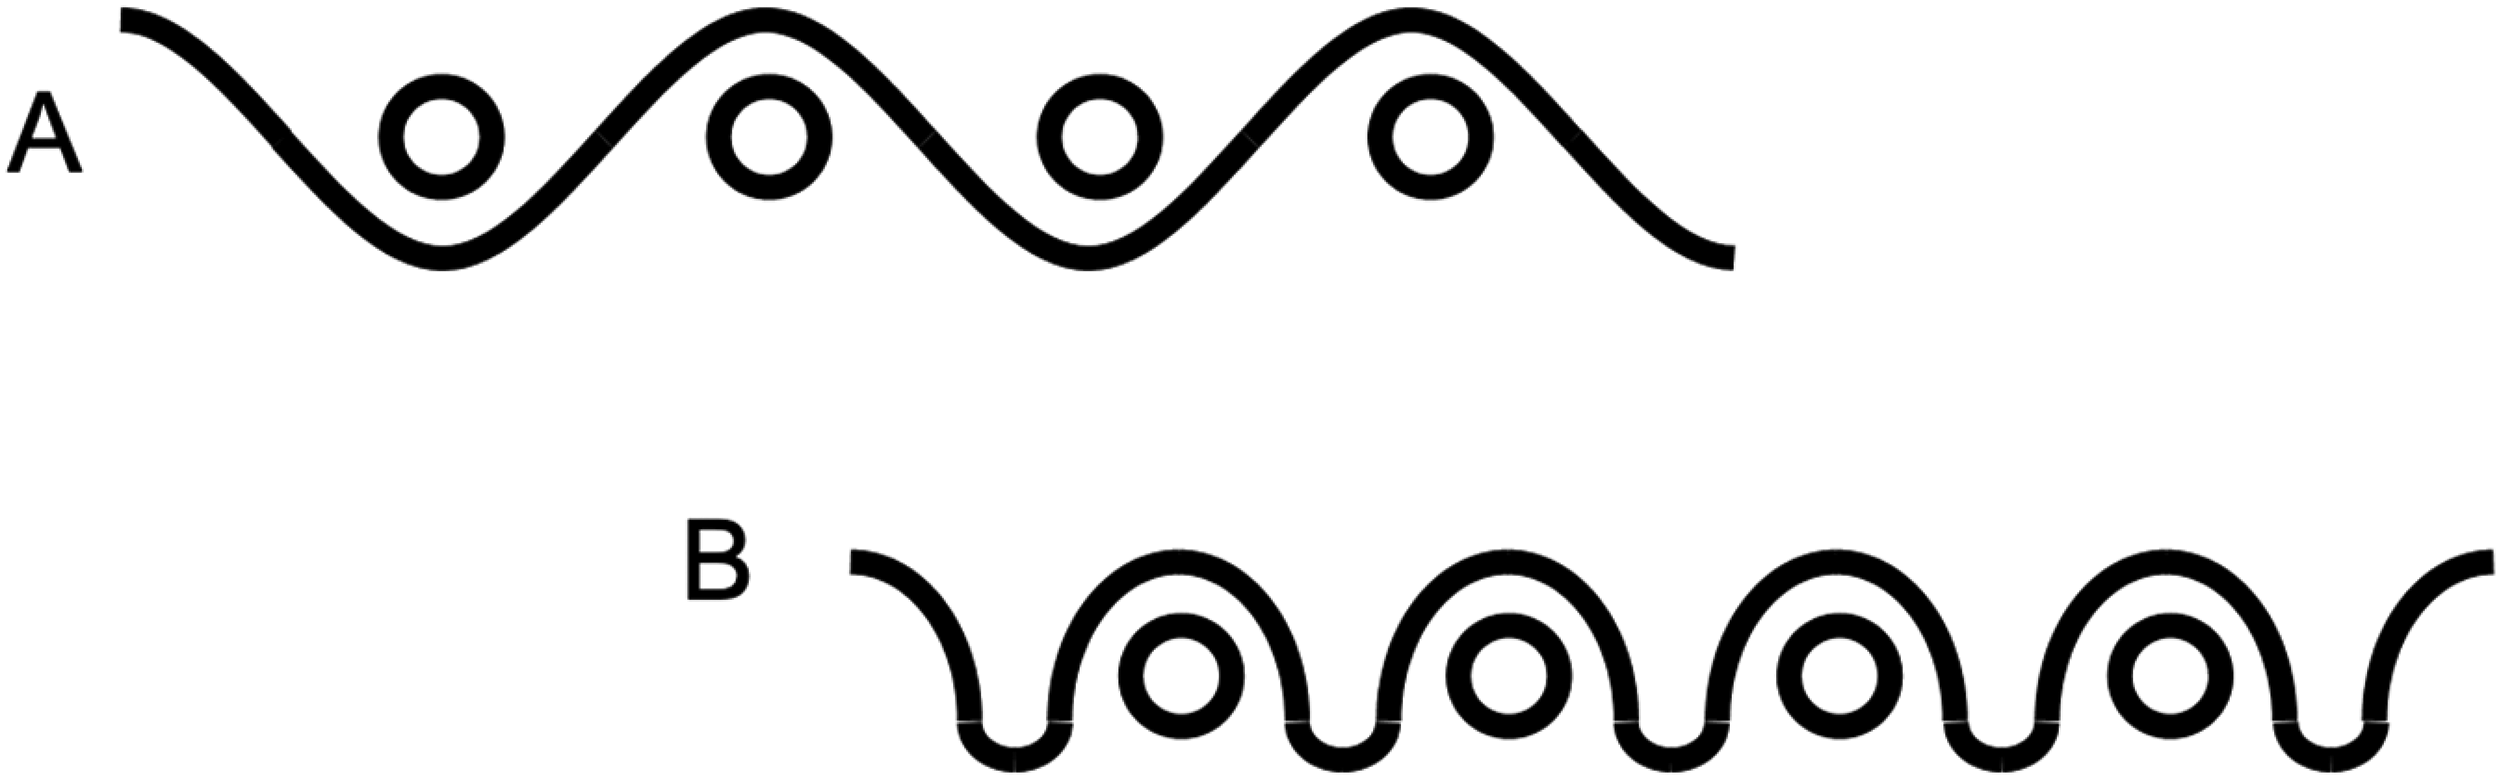
The elements to be compared can be given different forms. It is not difficult to see that even a slight change in the form of the elements immediately changes our estimate of the quantity. If, as in Figure 7, one compares a series of black rectilinear rectangles with the same number of curved black stripes, one tends to overestimate the quantity of the latter.
The difference in number of elements appears small in this figure. One must proceed to configurations such as those of Figures 8 and 9. When the variety in shapes of the elements increases, the numerical difference also seems to increase.
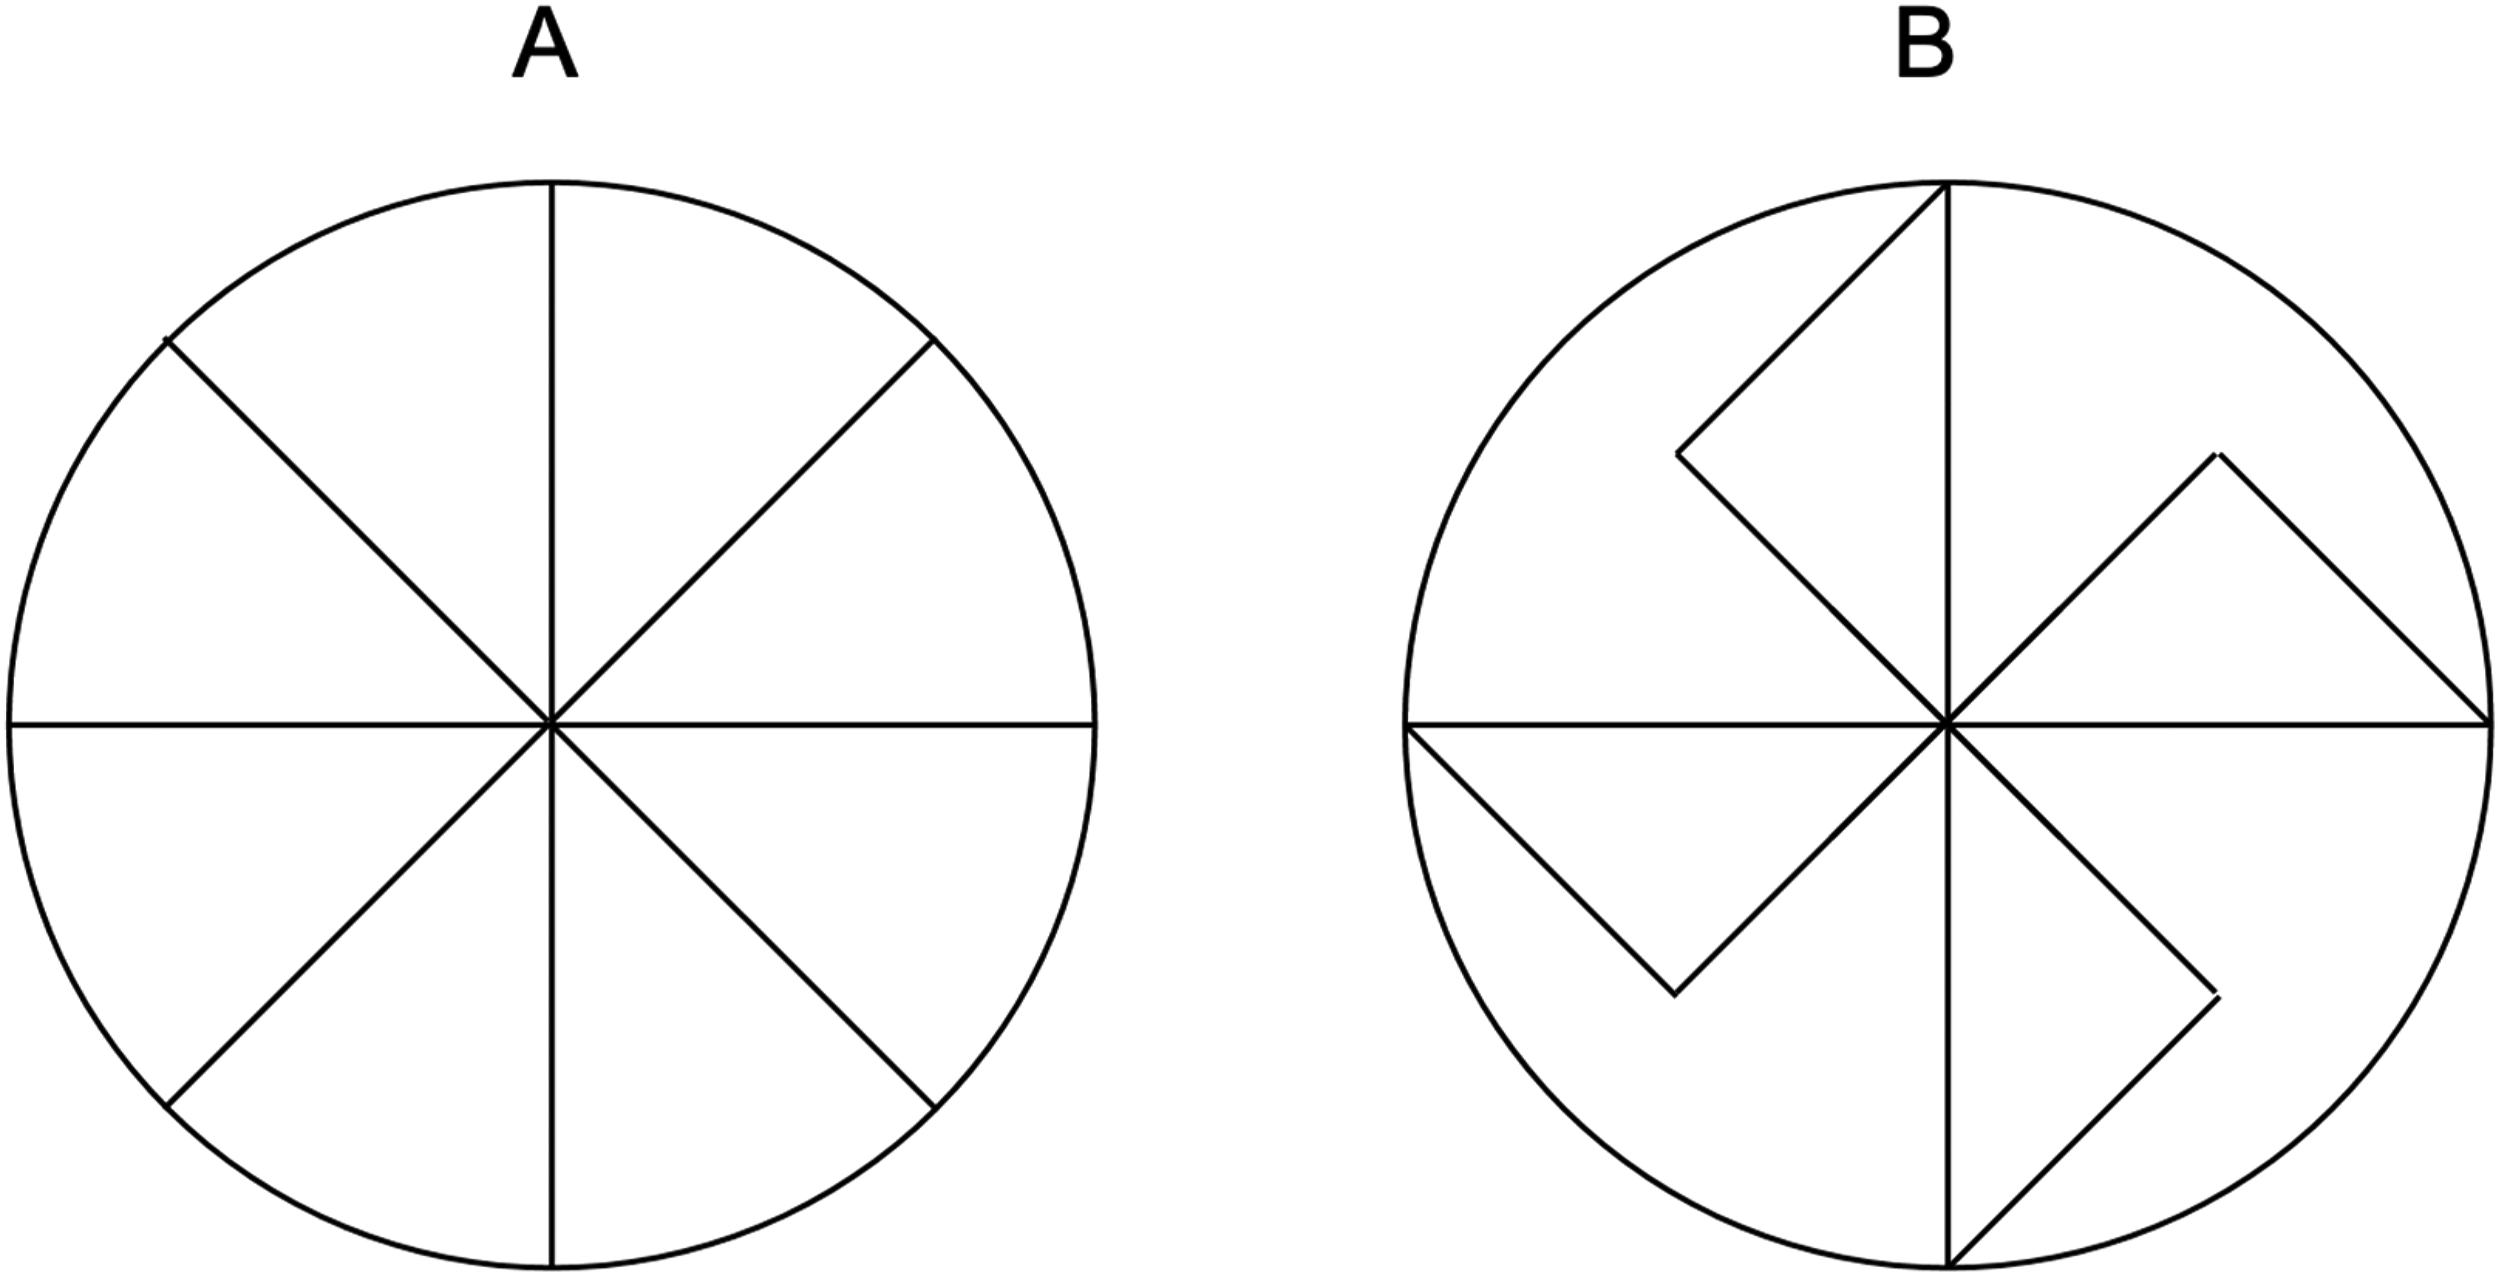
With the circles in which there are always a number of radii or when lines appear as extensions of radii beyond the periphery, the number of rectilinear elements is thought to be considerably fewer than where broken or curved lines are involved (Figures 8 and 9).
The reason which gives rise to the deceptive overestimation in these cases is that the subject dwells chiefly on the impression made on him by the less simple units. According to this impression, the fact that the whole of the figure appears fuller in the case of less simple units must lead to overestimation.

The Influence of the Spaces Between Elements
A glance at the following figures proves that the impression of the greater fullness of the figure as a whole leads to overestimation. Here the important factor is the separation of the elements.
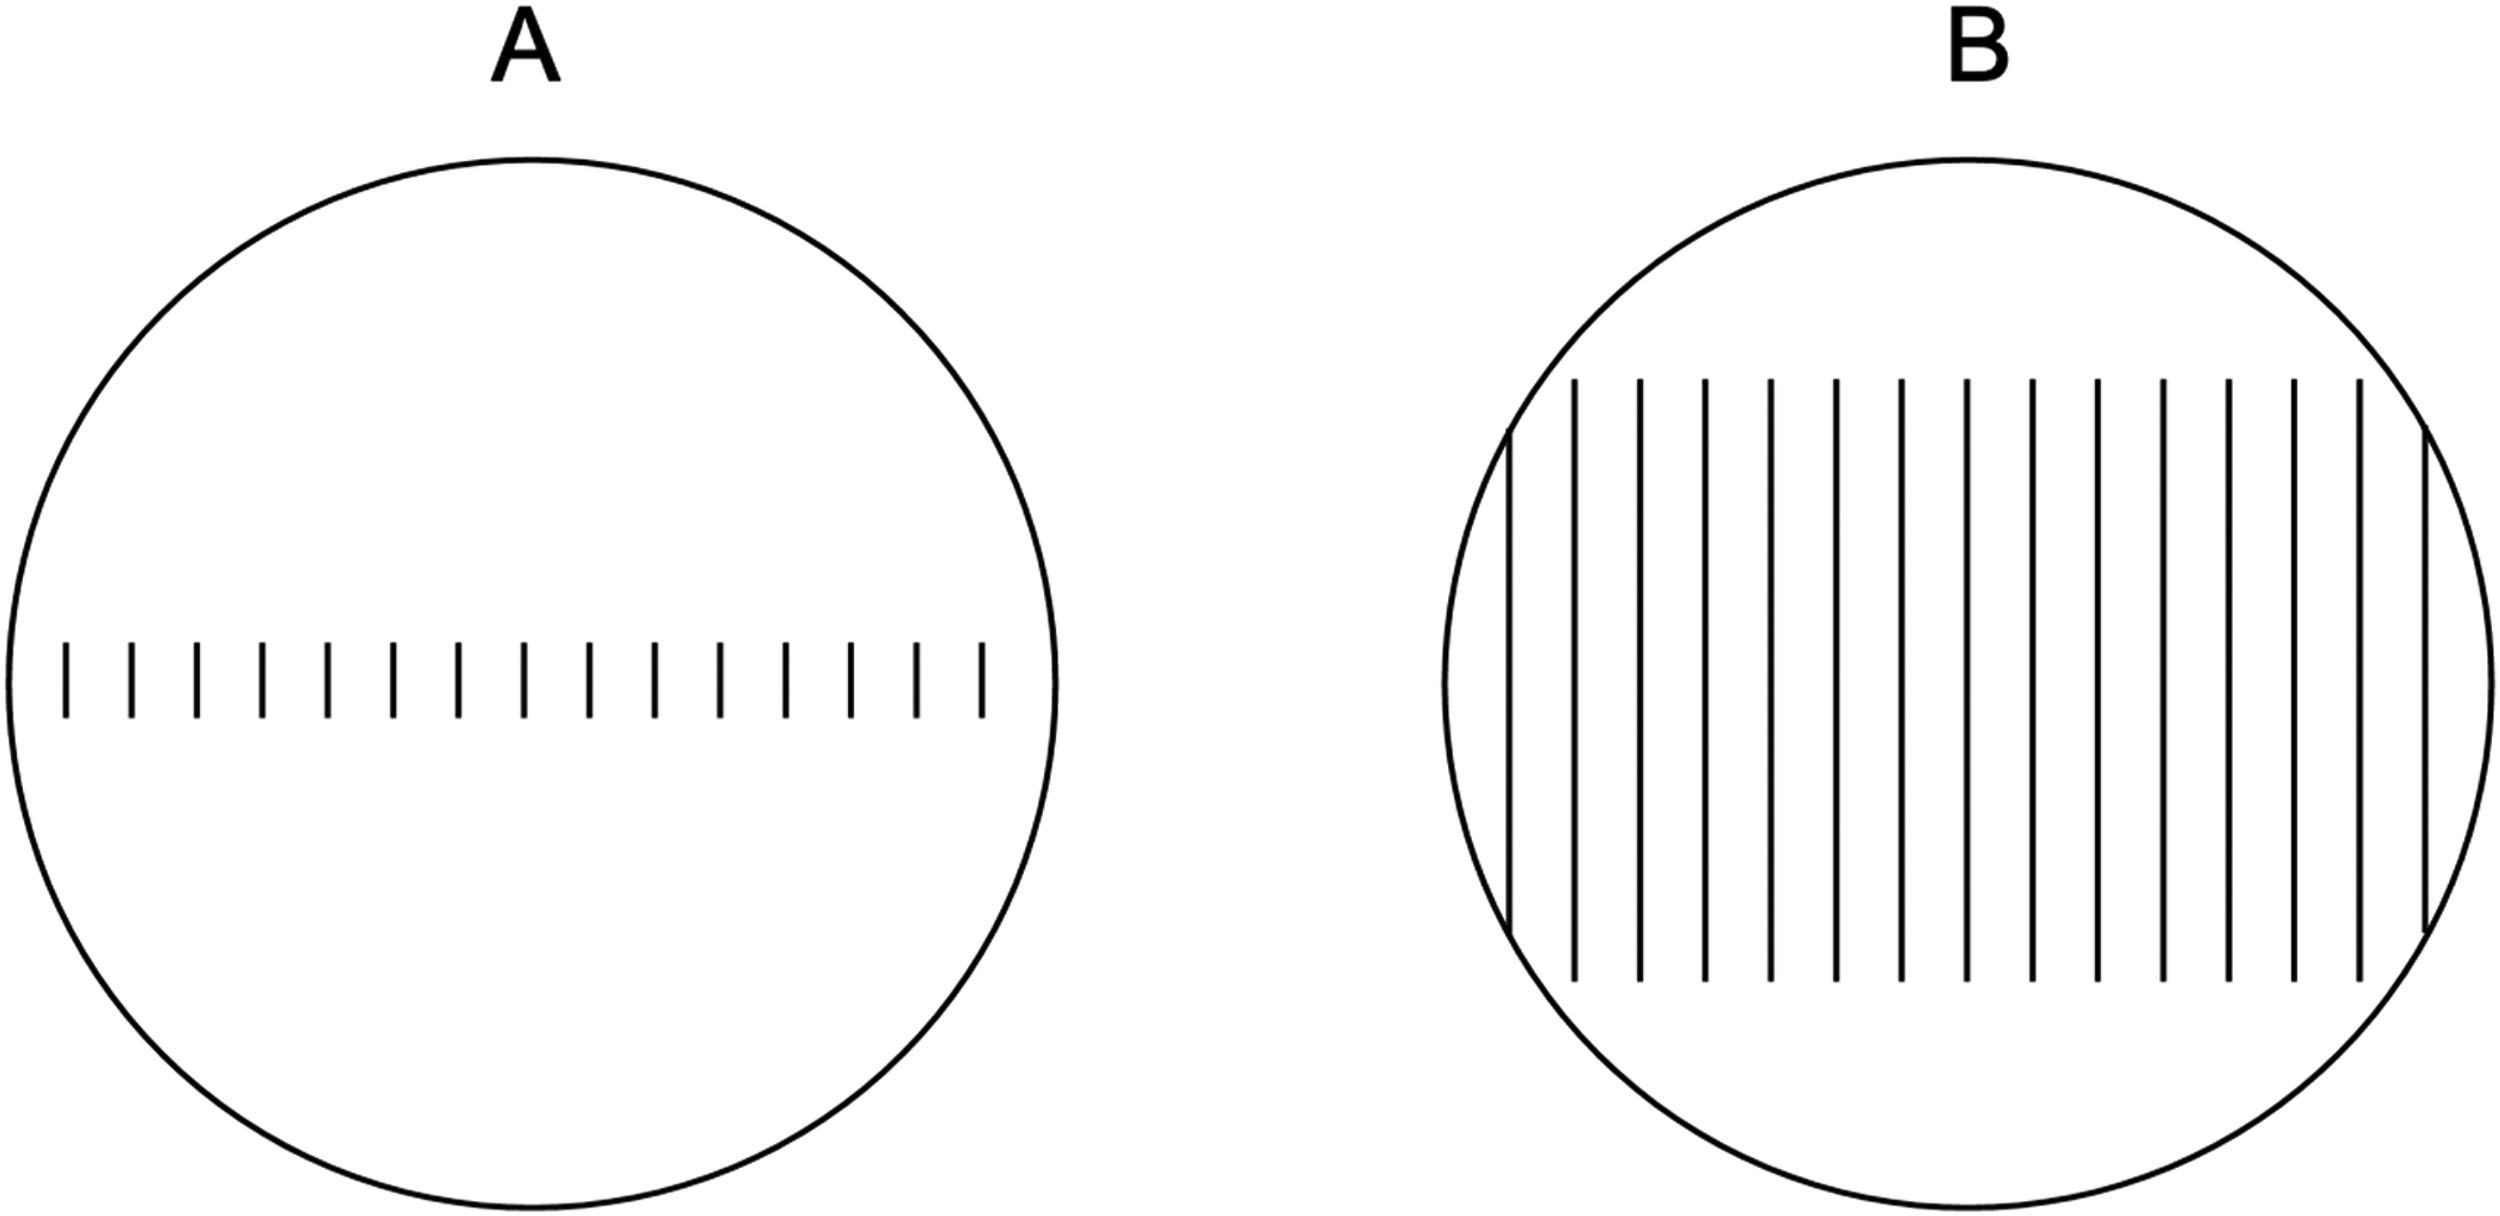
Figure 10 consists of two circles, inside which are vertical straight lines. These lines are short in one circle, but much longer in the other. In comparing, we feel compelled to overestimate the number of longer lines, although the apparent narrowing of the circle B and the widening of A in the horizontal direction seems to counter that. But because of the greater length of the strokes in B, they appear to us to be closer together and therefore more numerous.
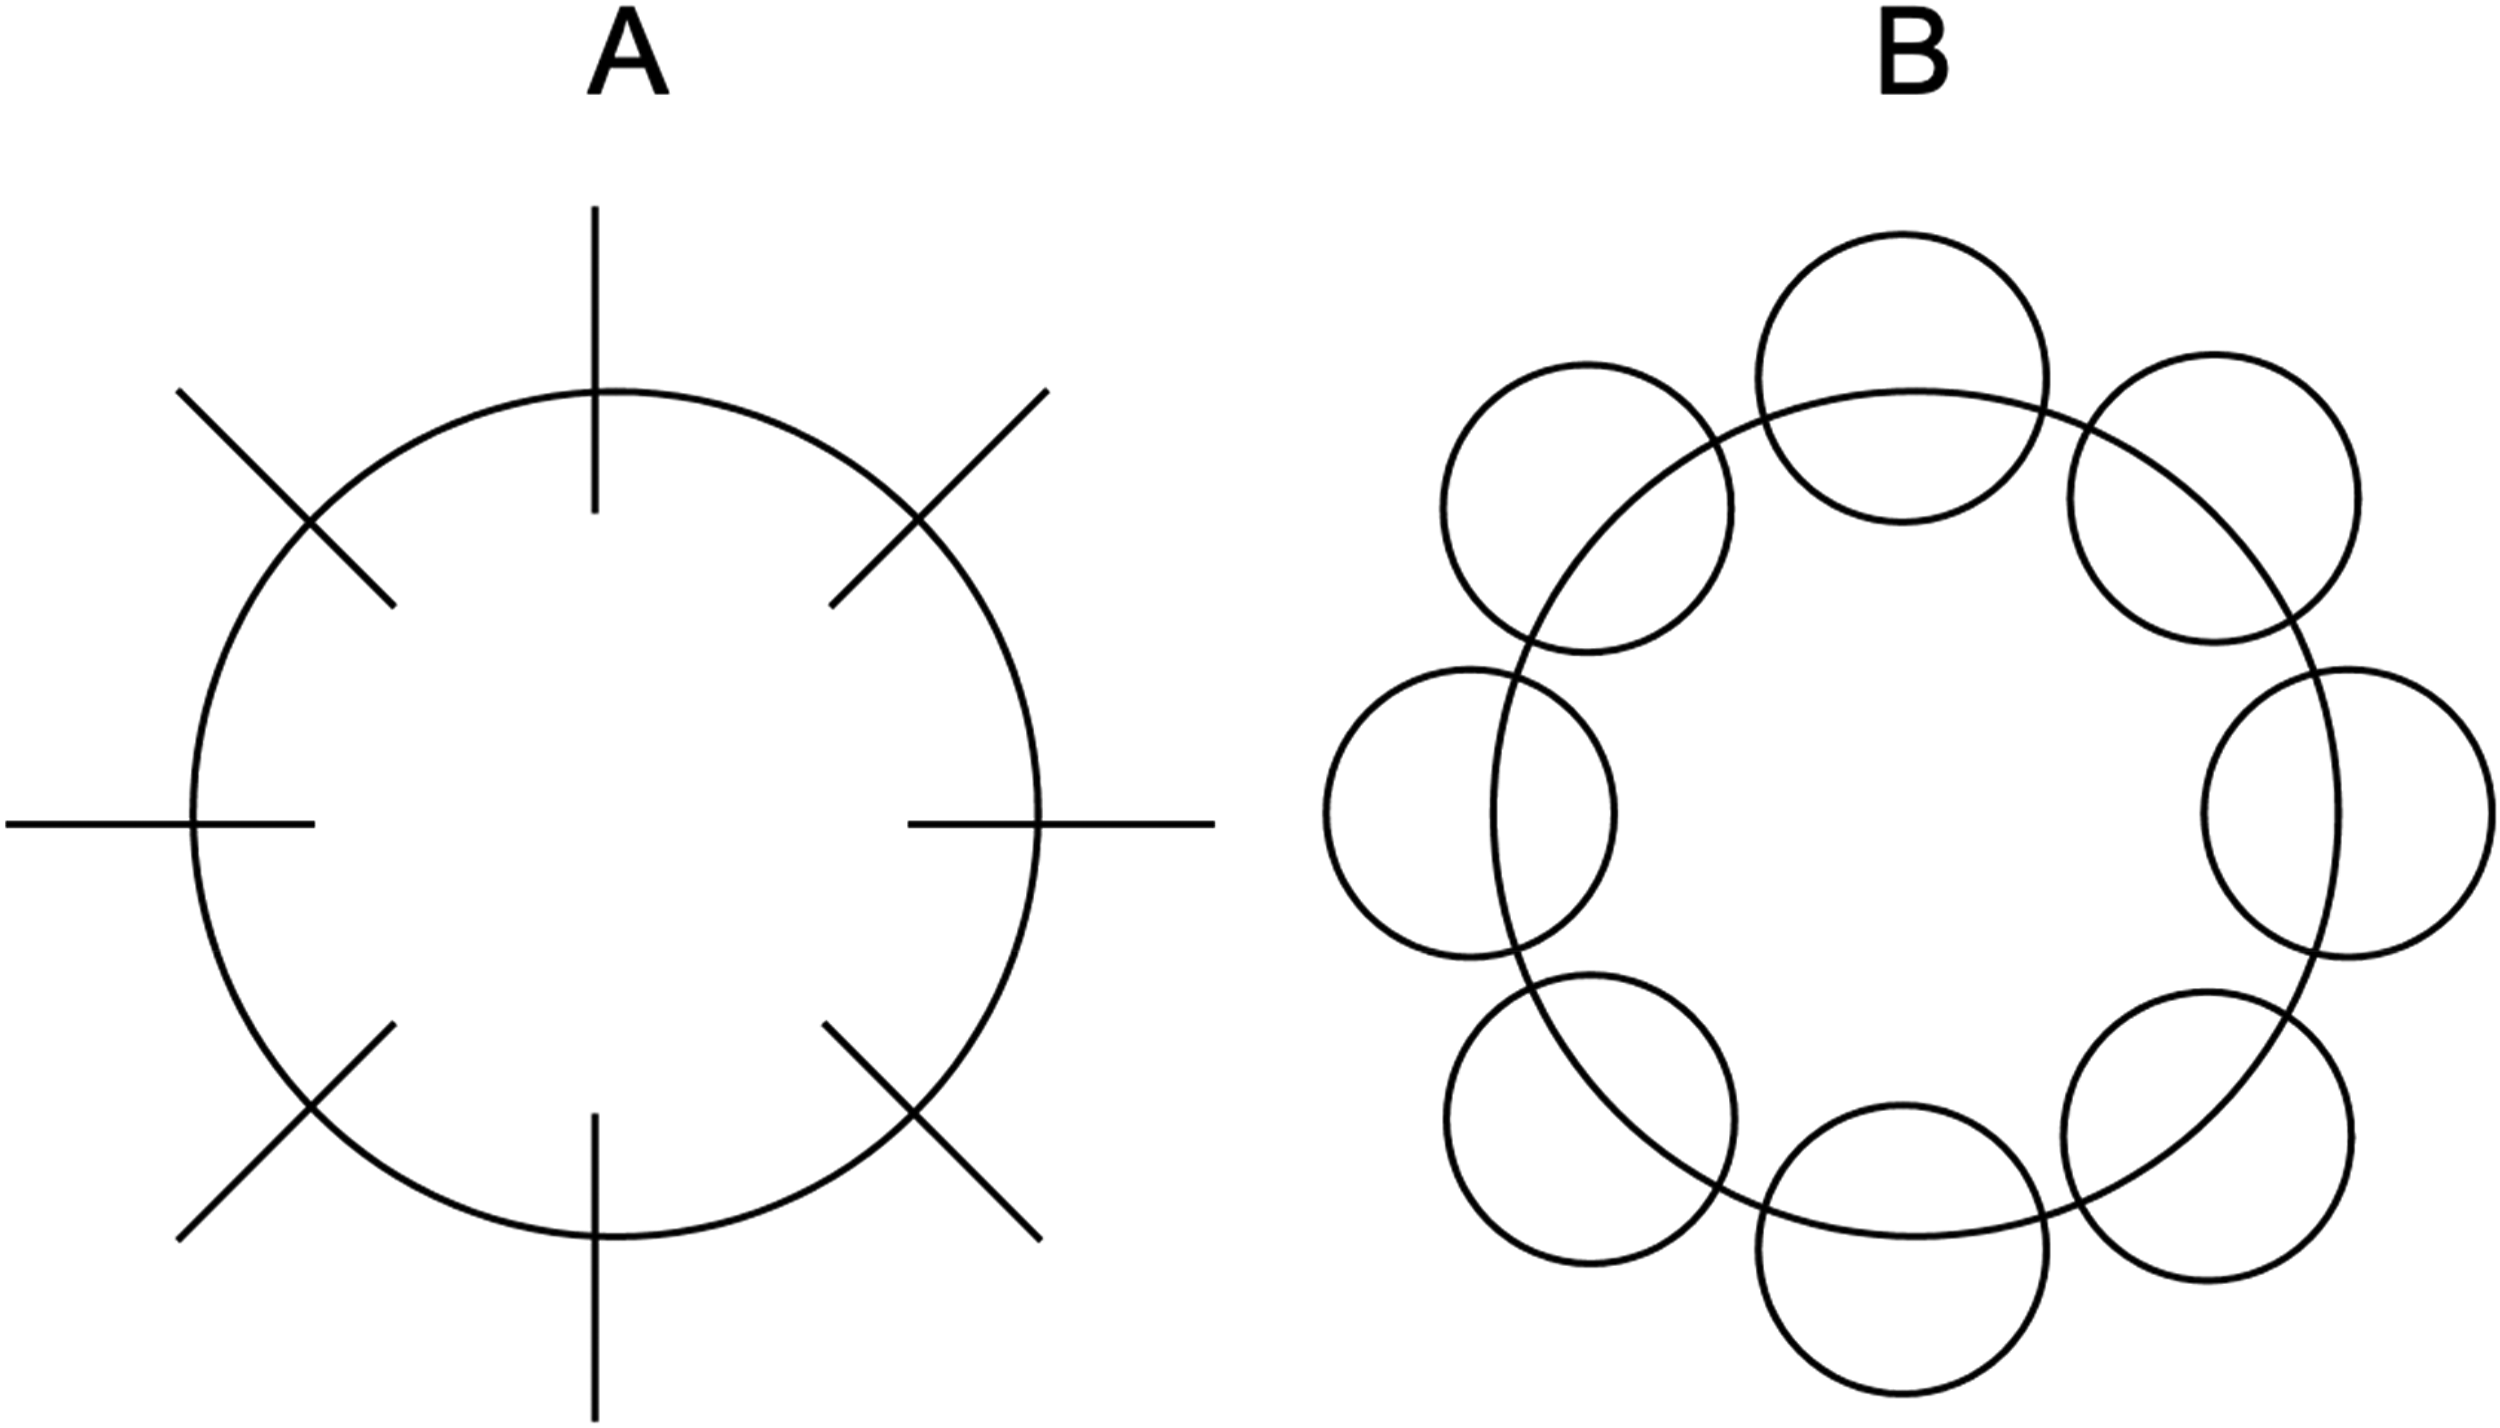
In Figure 11, straight-line segments are arranged along the edge of circle A, and smaller circles are arranged along the periphery of circle B, which is just as large. The small circles are judged to outnumber the straight lines. In this example, the tendency to overestimate the number of small circles is apparently caused not only by the more complicated shape of the mass elements, but above all by the fact that the spaces between the small circles are so small that they run along the border of the circle and stay close together, while the straight lines in A are much farther apart.
The following examples also illustrate the influence of the gaps.
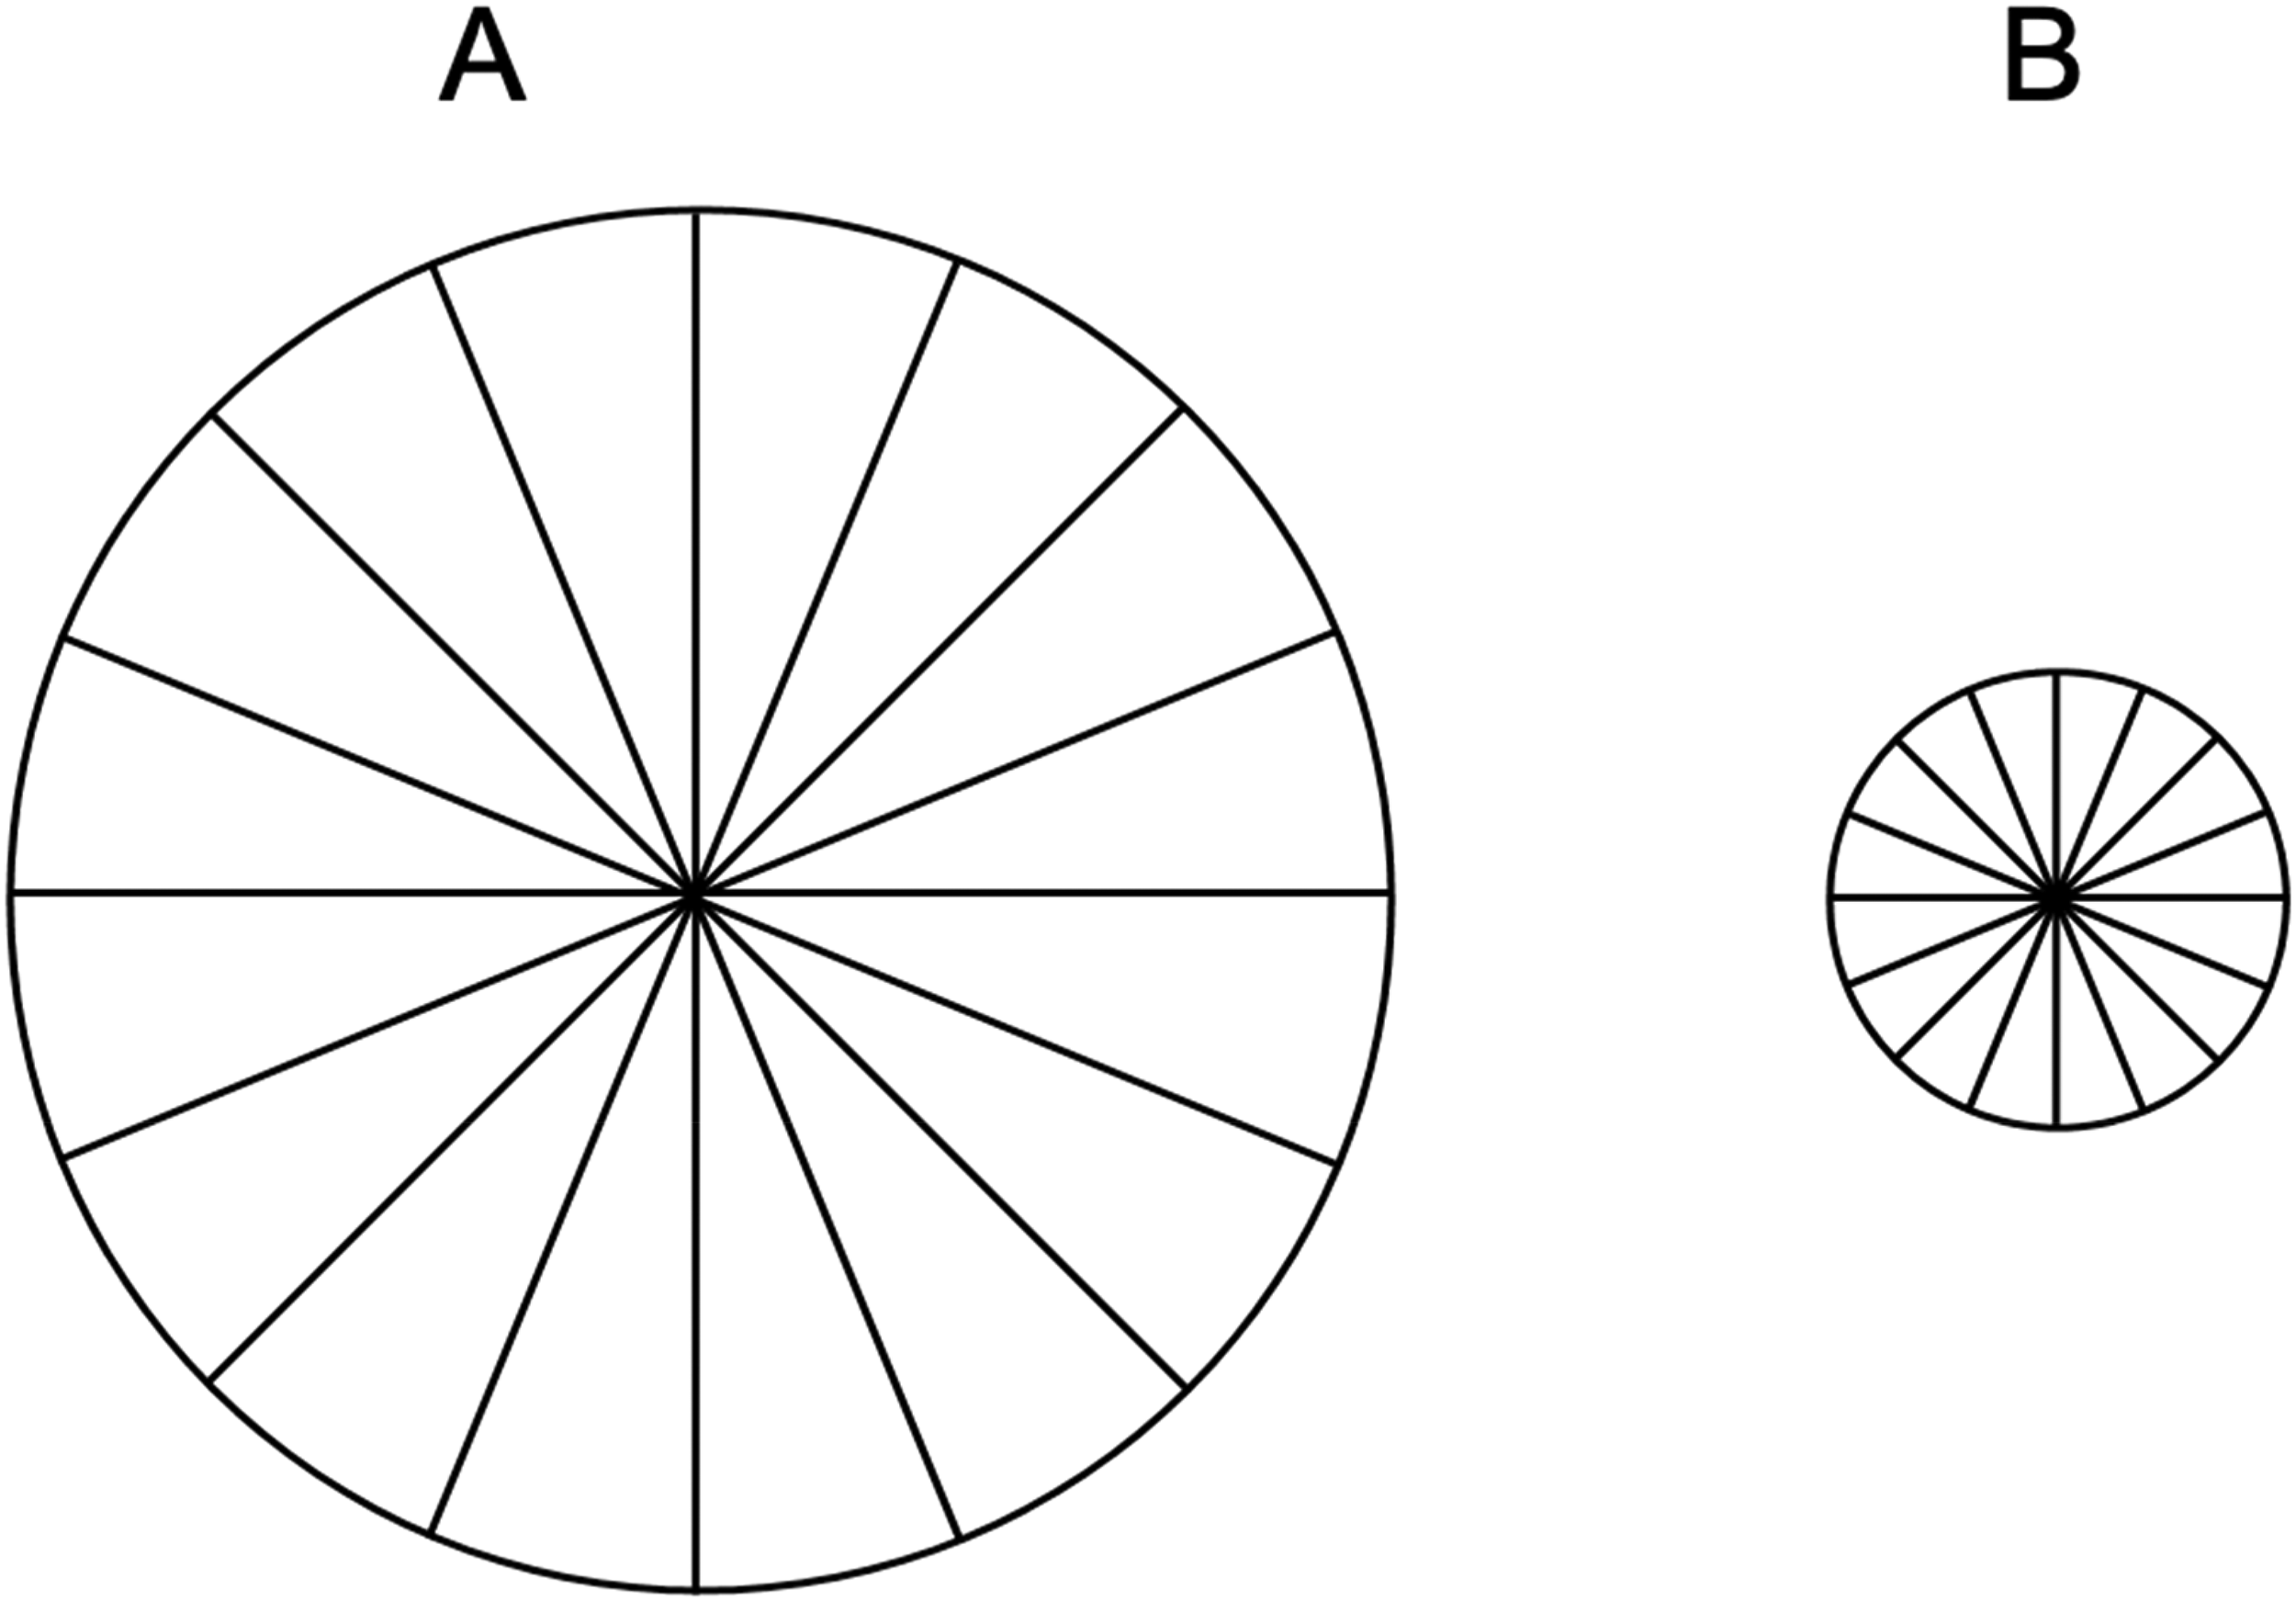
Figure 12 shows two circles, one larger, the other smaller, with the same number of radii. When asked to judge which of the two circles had the greater number of radii, the subjects answered unanimously: the number of radii in the smaller circle appears greater.

The same is true of Figure 13, where each of the straight lines outside the larger circle is the continuation of a radius of the inner smaller circle. Even in this case the deception persists. We still overestimate the number of radii of the small circle versus the extensions of them around the larger circle.
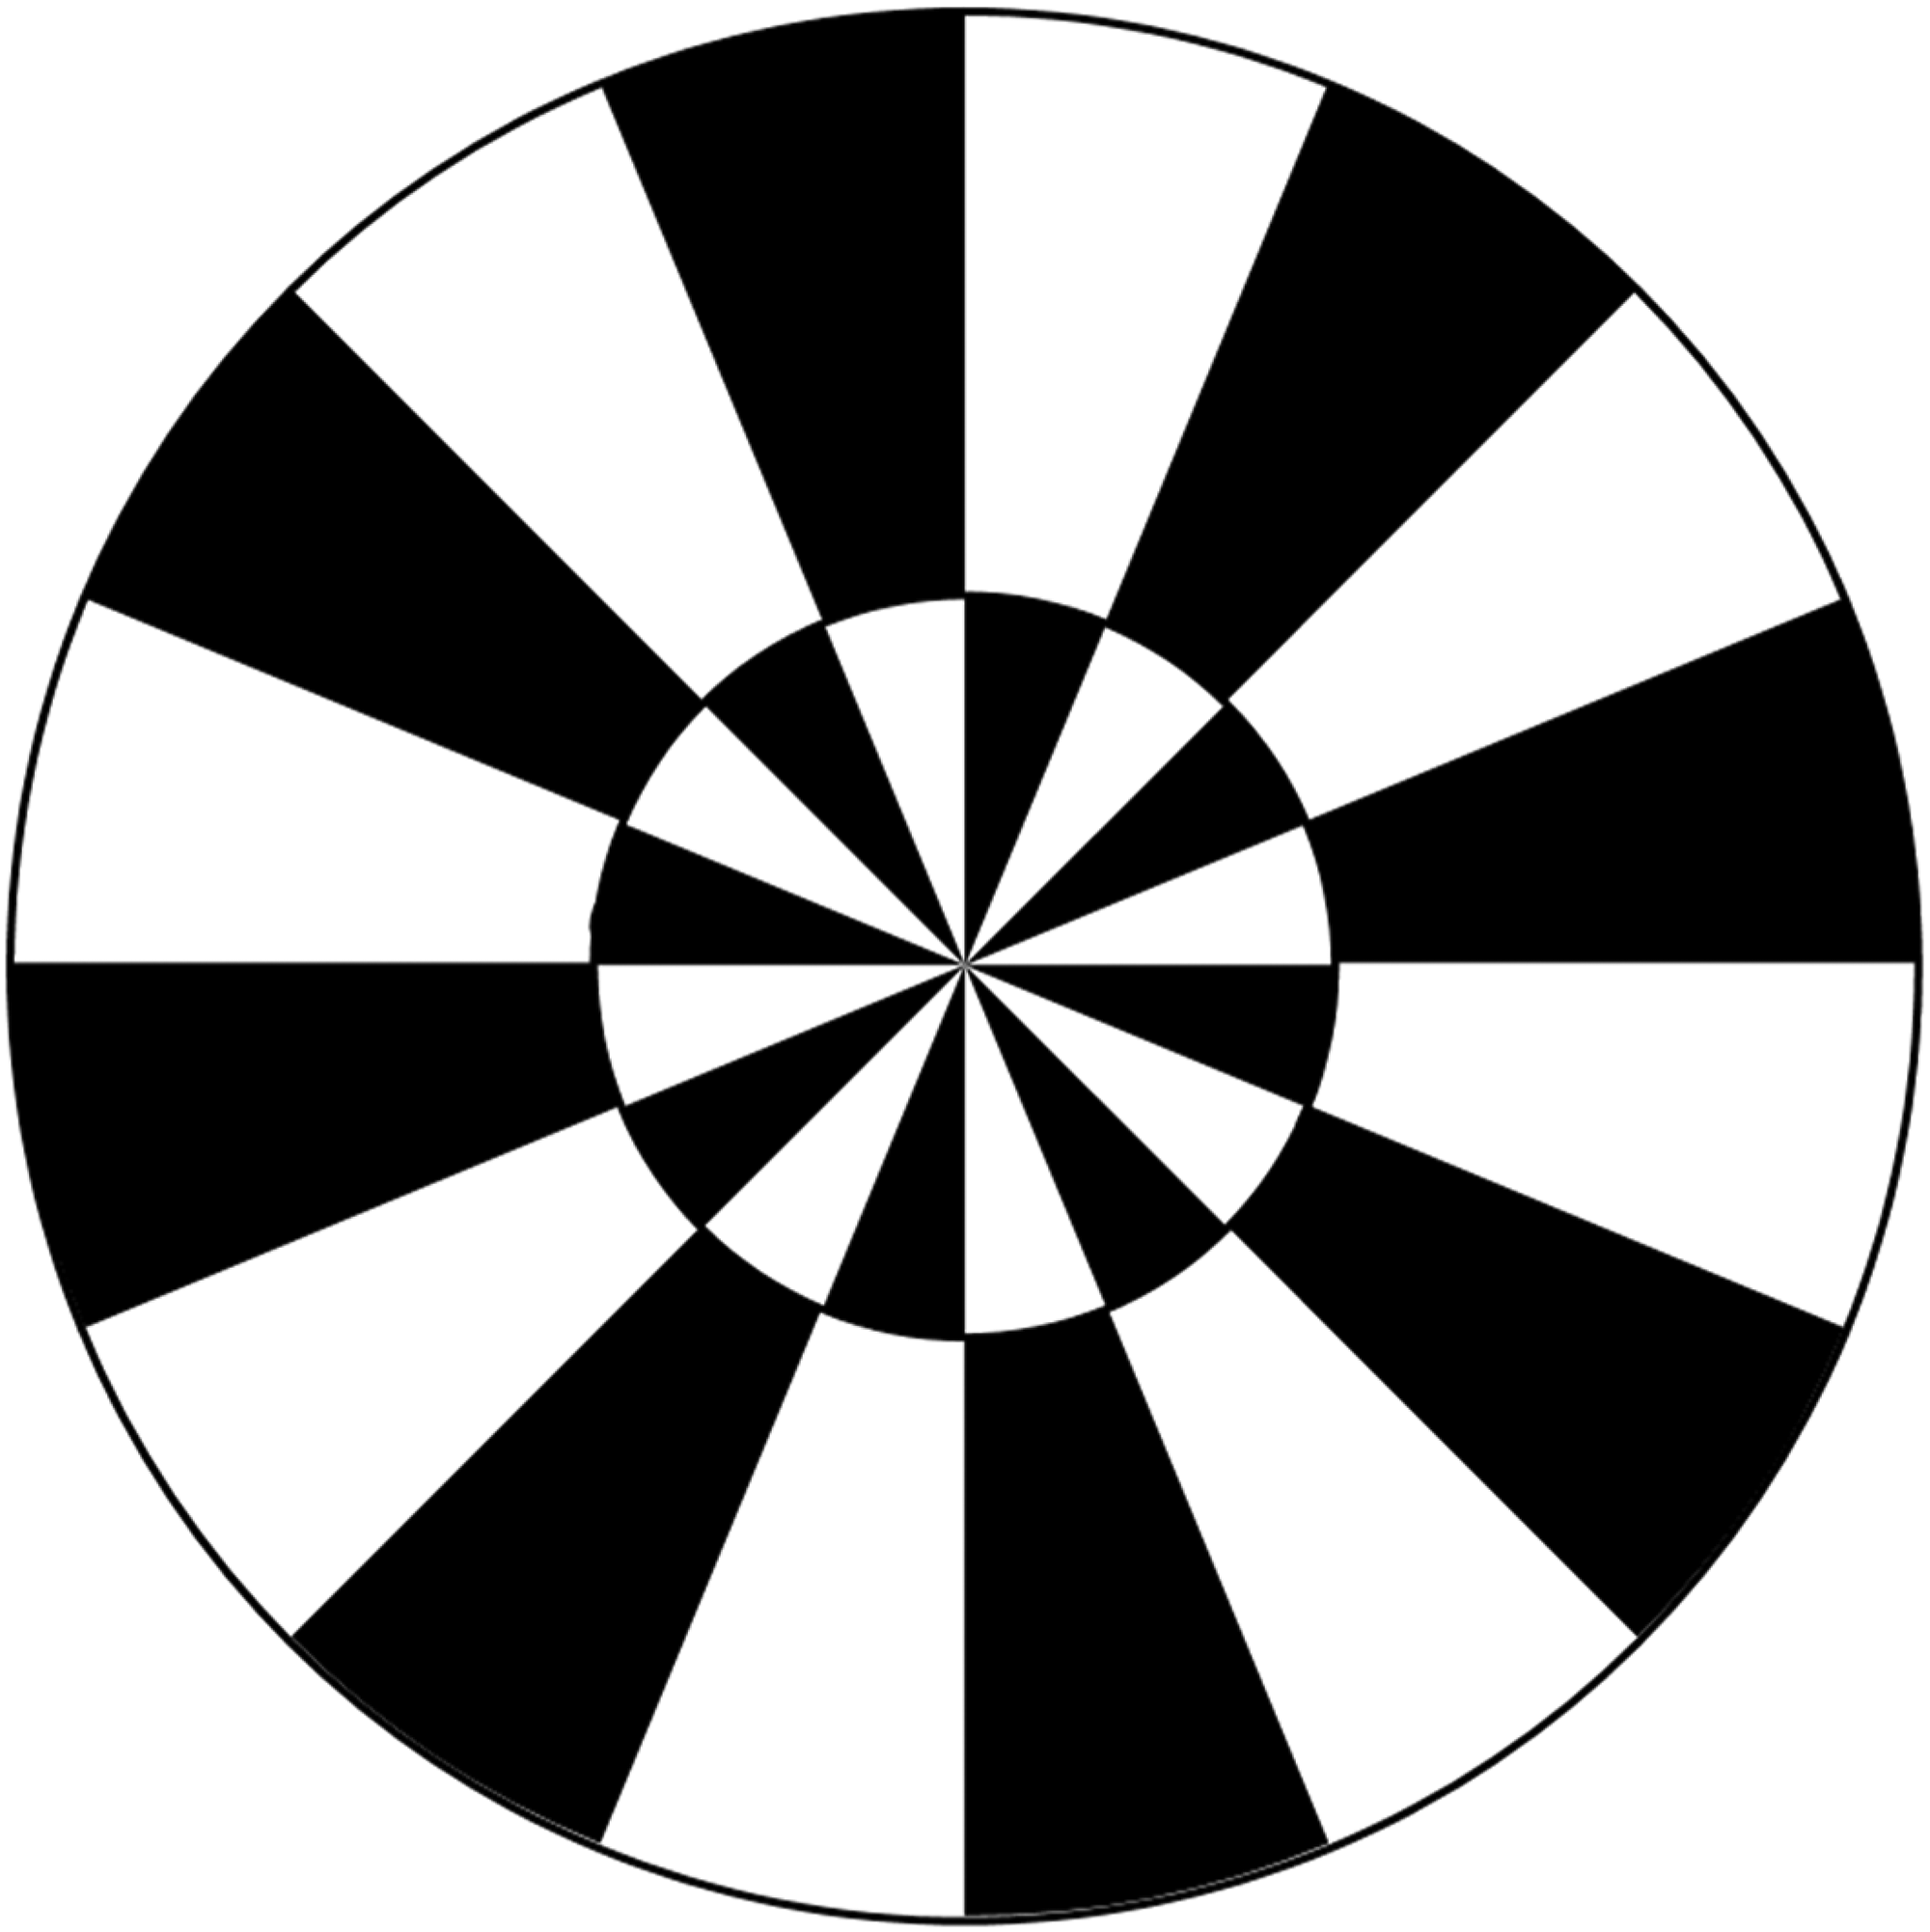
It is natural that the illusion of overestimation grows and becomes more impressive with Figure 14, which I take from a book on optical illusions by Pegrassi. 6
Here two sets are to be compared, consisting of a certain number of white and black sectors, the continuations of which are not only interrupted at a certain point in their course, but also shifted. The sectors within the small circle appear to be much more numerous than those of the larger one.
With these figurative arrangements of the units constituting a set, we are certainly no longer guided by the greater extent occupied by the straight lines or the sectors in the larger circles, but by the spaces between the individual units.
In the arrangement of Figures 12, 13, 14, the annular zones referred to in construing and comparing the interstices seem to correspond to the points at which the radii or sectors touch the circle's periphery, and, where they touch two circles, to the points on the larger (outer) circles.
The fact that this reference to certain points or ring zones of the entire figure is an important factor in comparing the spaces in between, is clearly shown when the units (crown segments) in the two rows of the example in Figure 15 are compared. The two rows of elements compared in this case differ only in that in B the two circular lines inside and outside the crown segments are solid, while in A this is not the case.
The presence of the two boundary lines causes, through the reference made to them, that the crown segments of B, which are otherwise identical to those of A, come closer together and therefore appear more numerous. Also, the whole of the figure appears smaller in B than in A.
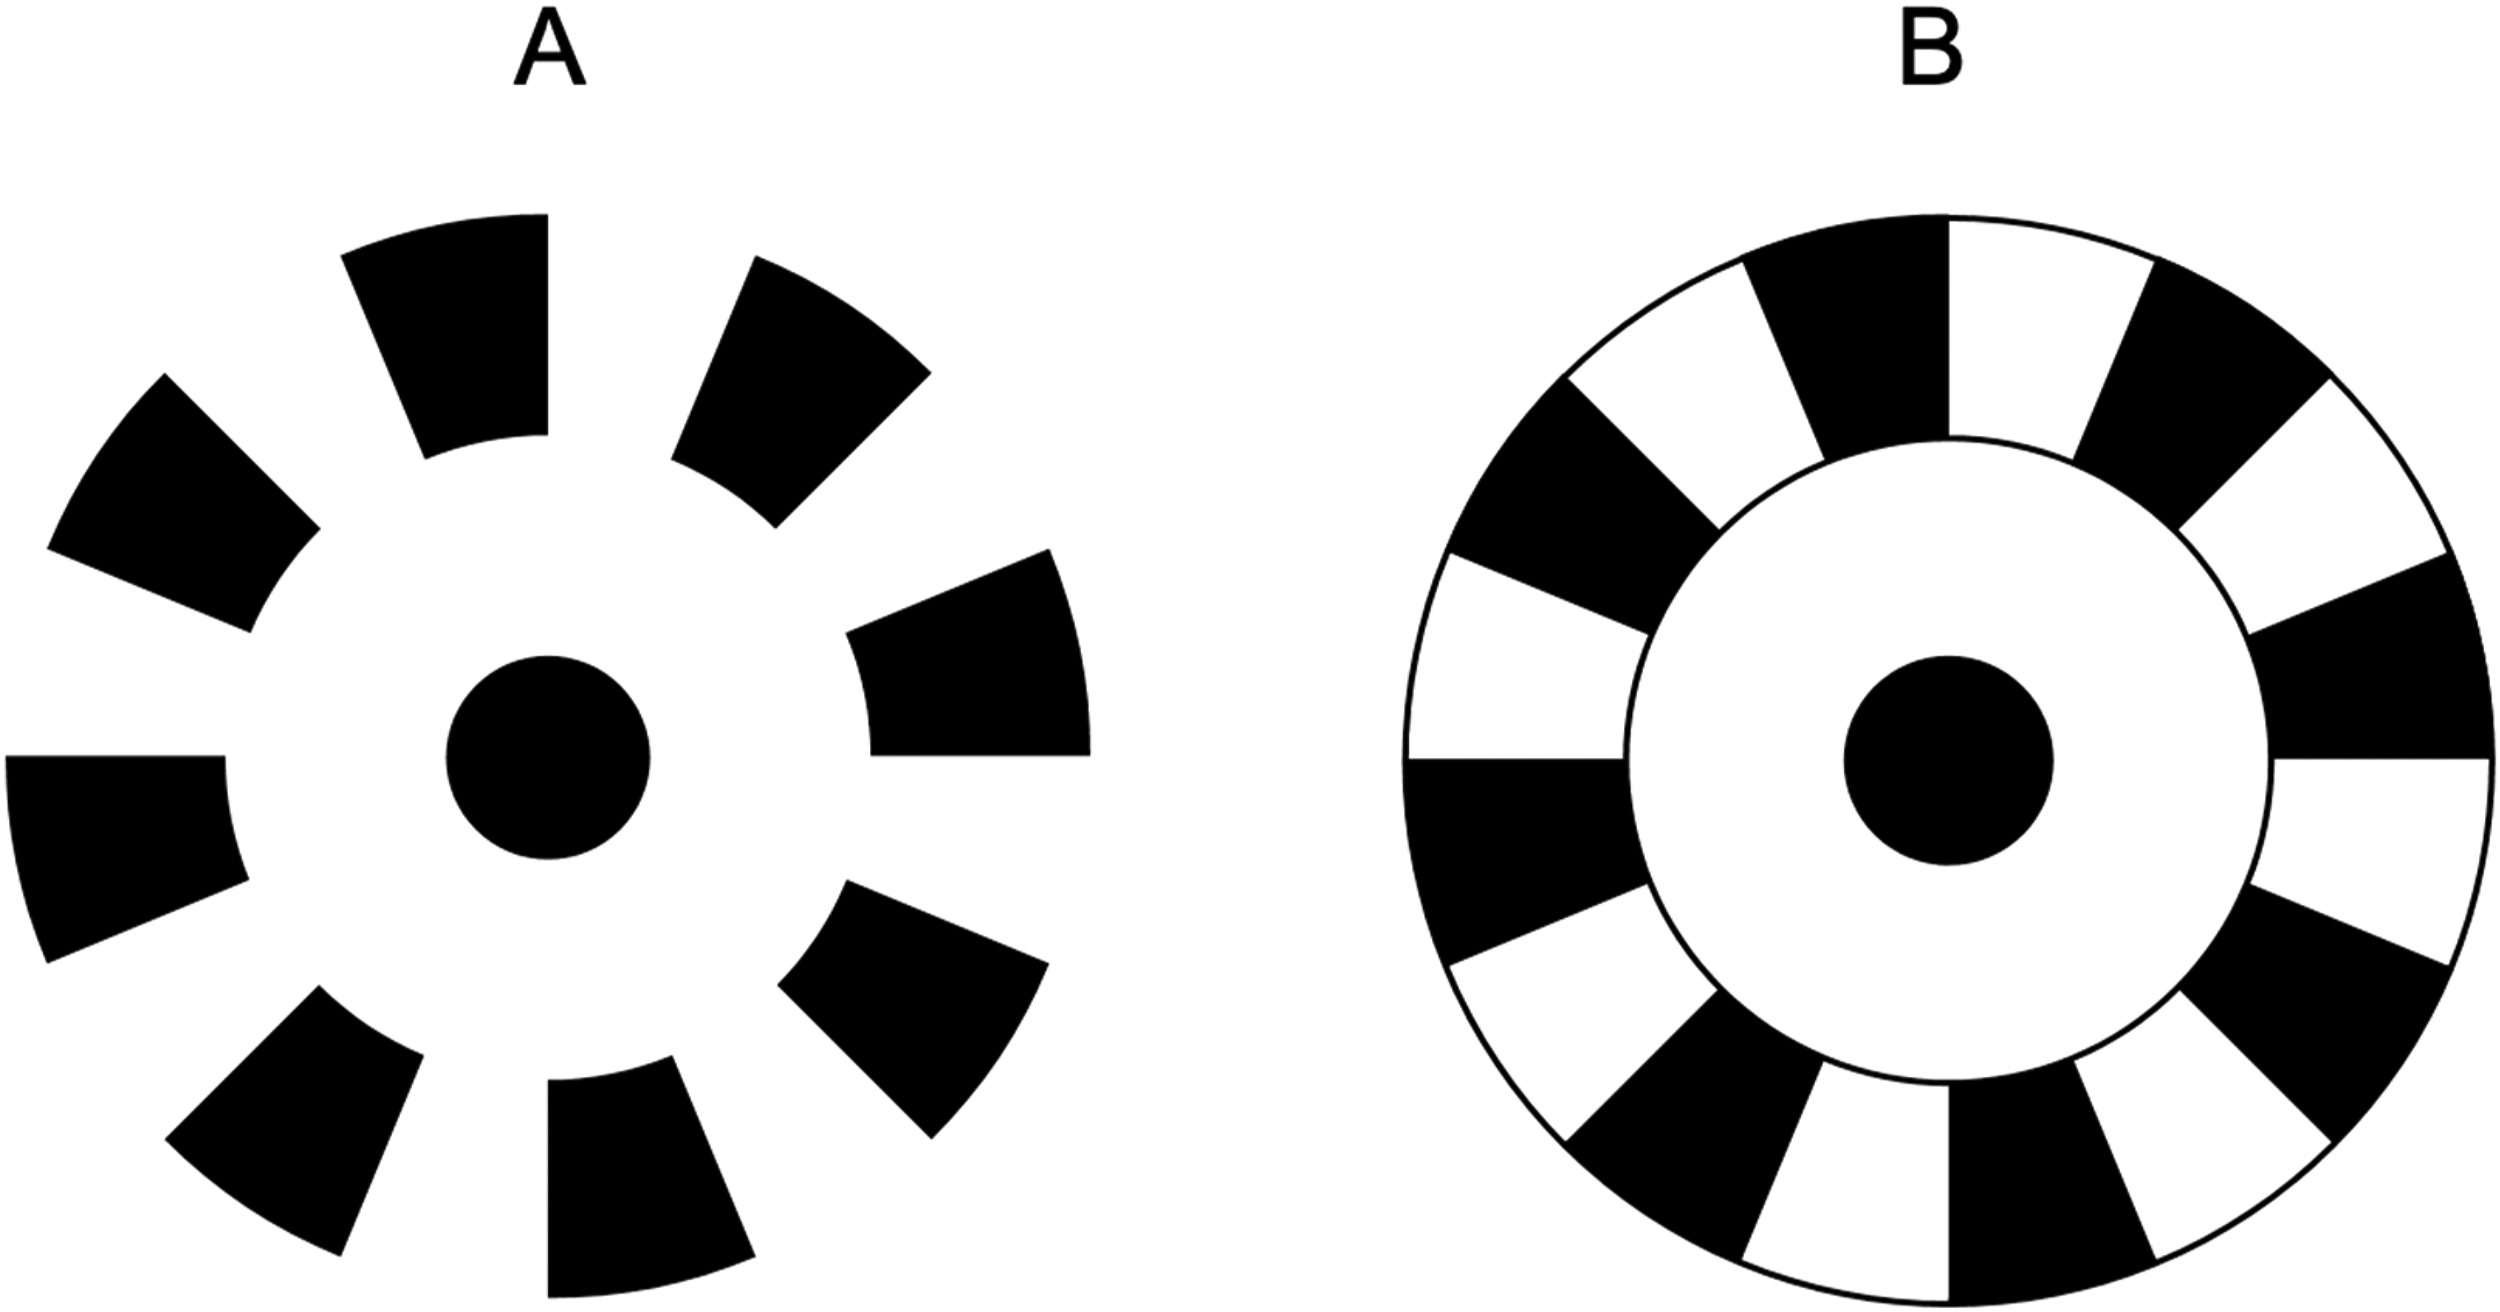
And the illusion appears even more clearly along the periphery of two circles of different sizes, on which the same number of black dots of the same size are arranged on both sides (Figure 16).
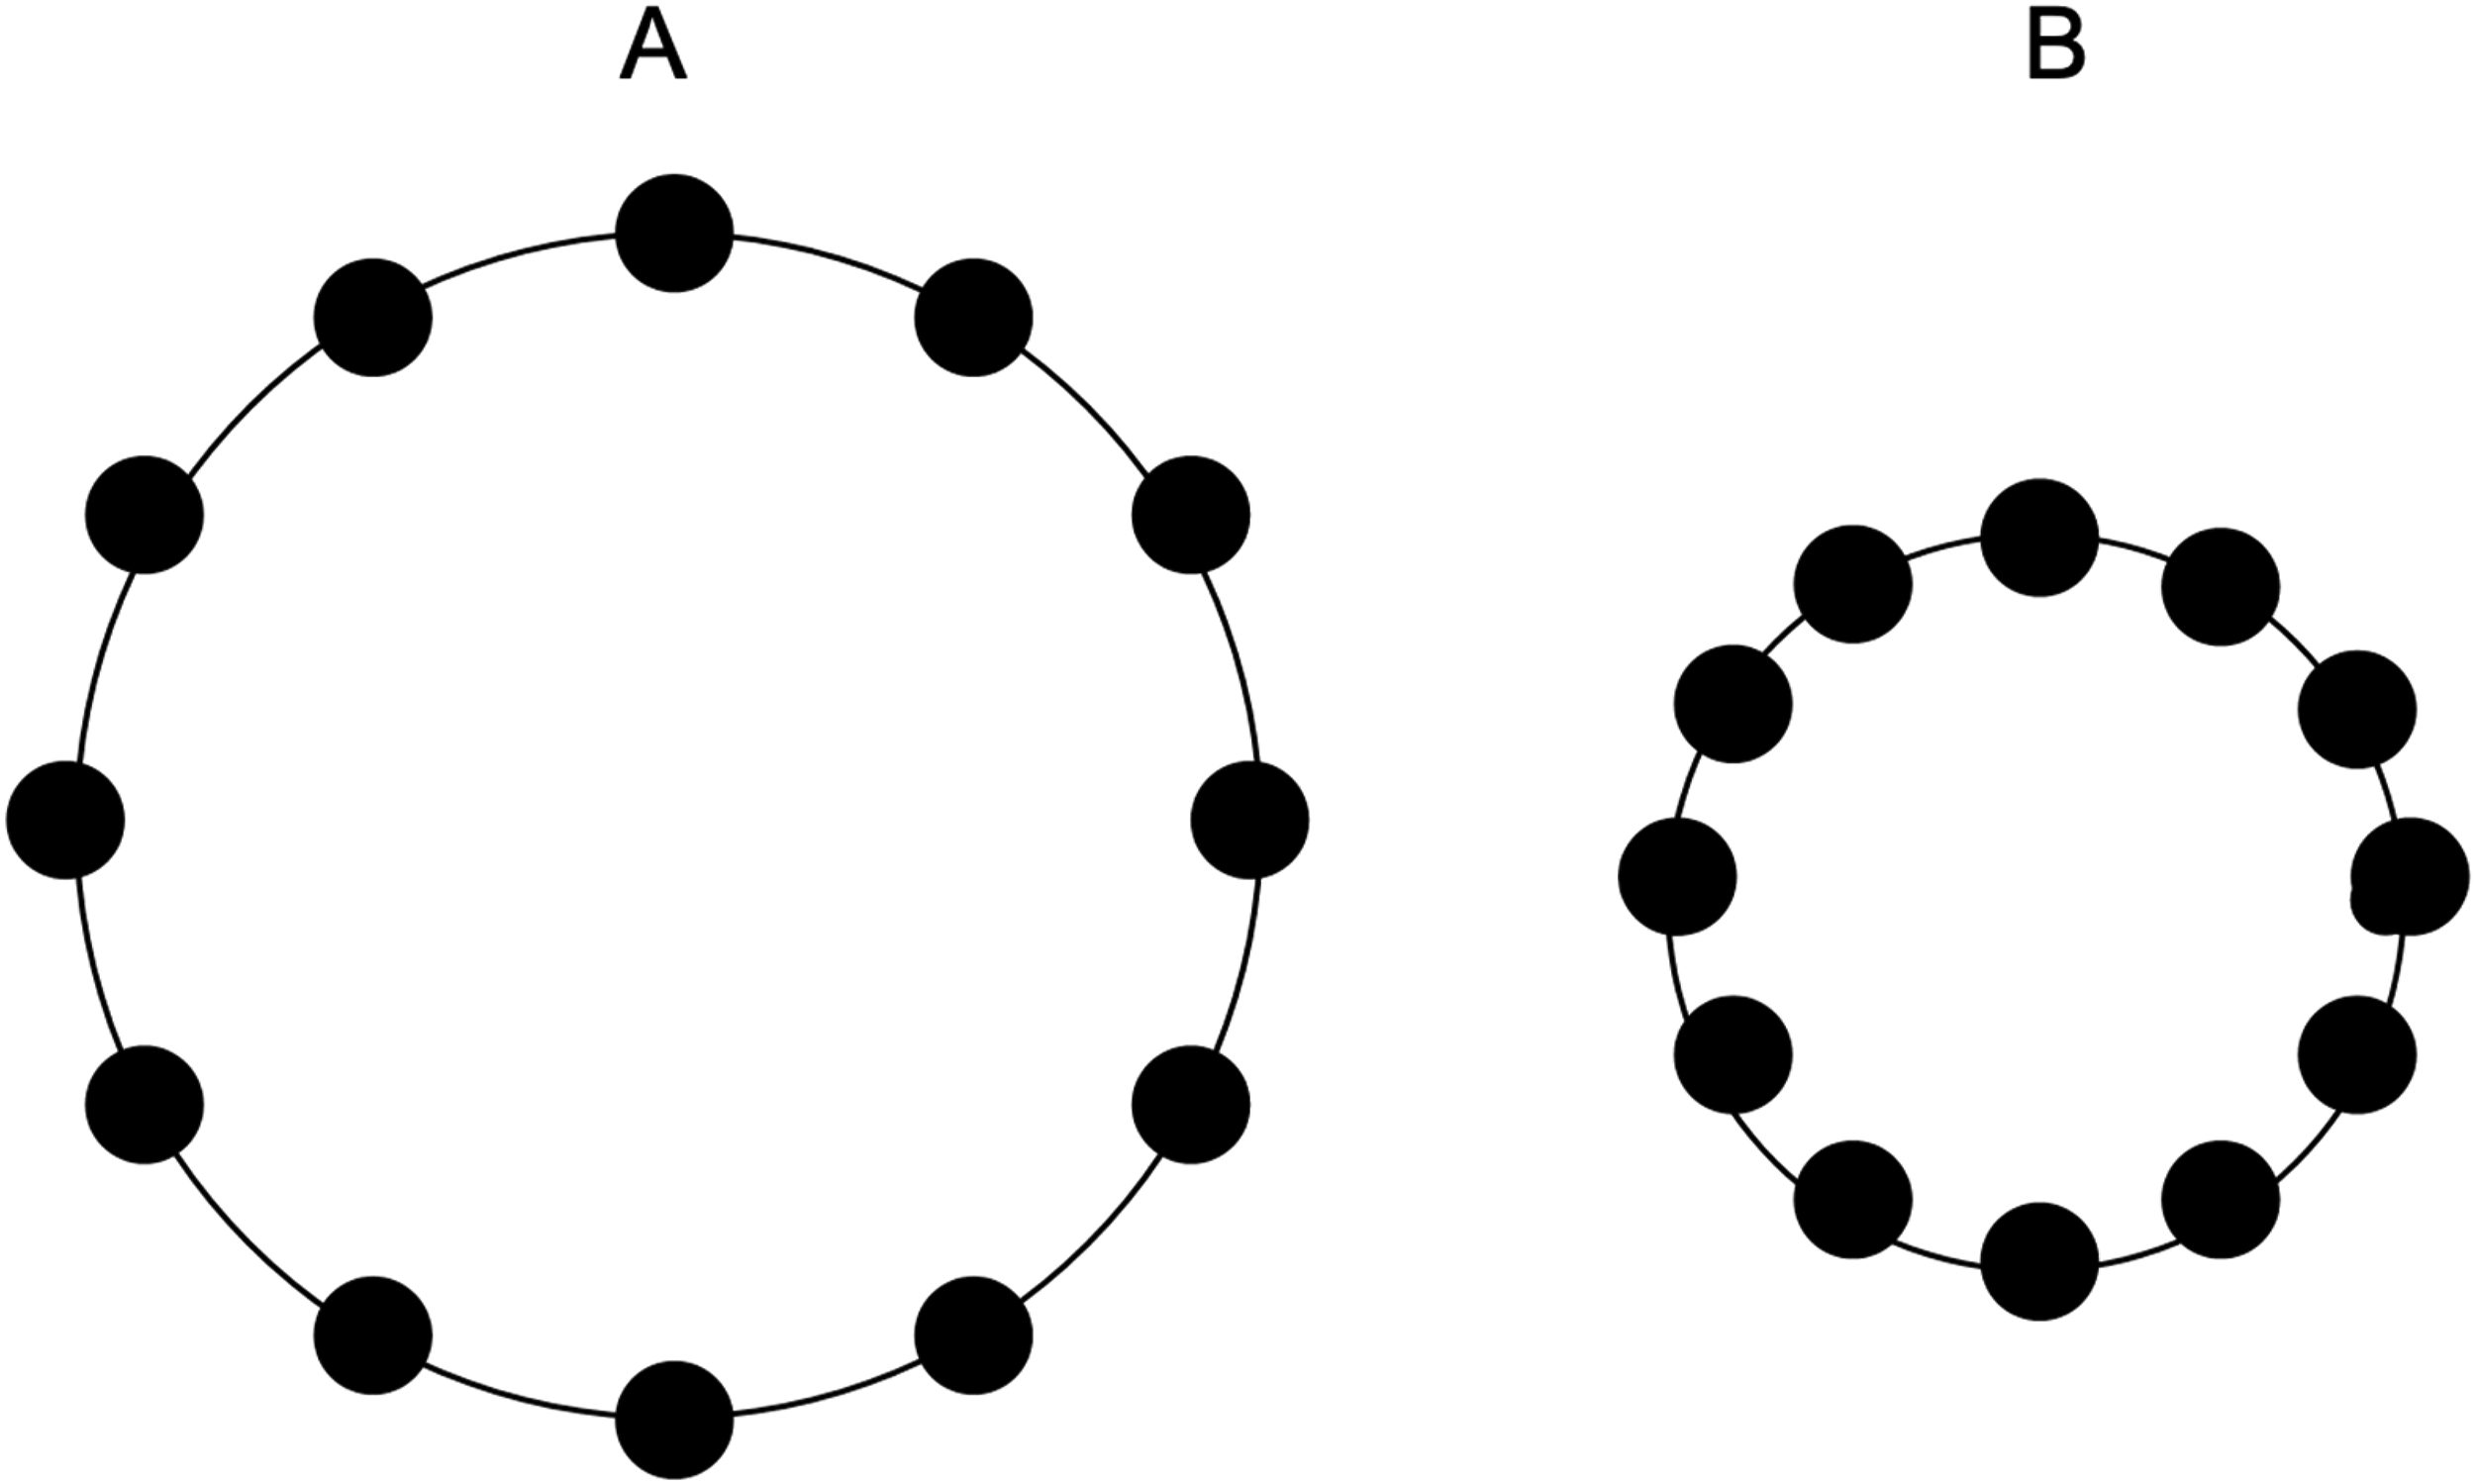
The points along the periphery of the smaller circle appear more numerous than those on the larger circle. In this case, the underestimation or overestimation is undoubtedly caused by the spaces between the black dots distributed along the borders of the two circles. Along the periphery of A, where the spaces are larger, the number of points is underestimated, although in this case the bounded figure is larger than the one being compared.
At this point, let us return once more to the comparisons explained in the first figures (1–6), to point out that the overestimation of the units arranged in a really or apparently larger extent is not exclusively due to the size, but at the same time depends on another factor, which is the distance between the individual elements.
Influence of the Group
Finally, the value of the factor of the spaces between the elements of a set can be illustrated by other formations of sets, which lead us to consider a factor related to it but distinct from it, that of grouping.
For this purpose, we can change the distances between units of the same shape.
We can, moreover, make use of numerous cases where elements of different forms are differently distributed in the series to be compared.

Figure 17 provides an example of the first possibility. The straight vertical lines placed alternately inside and outside the peripheries of the circles are at B the same distance from each other everywhere. In A, on the other hand, they are distributed in such a way that one line inside the circle approximates another line outside it. The gaps are alternately lengthened and shortened.
The result is that the number of units of measure to be estimated appears significantly smaller in A than in B. This result can be attributed to two different factors in the figure in question. The otherwise identical and still easily distinguishable elements of A, which are objectively independent of each other, give us the impression of pairing, each of them striving for a special connection with its neighbour, and through this close relationship it subjectively loses a little of its individuality and independence in order to awaken a peculiar character of ambivalence.
The partial, subjective loss of the individuality of the single element, acquiring a collective character, contributes to the inferiority of the whole series, each element of which is in the same condition of ambiguity. In addition to this factor, the numerical underestimation of the series A is certainly also due to the fact that at the same time we take the intervals between the pairs of elements as large, which leads us to underestimate the frequency of the units within the limits of the whole figure.
The same impression of the inequality of the sets is realised in the juxtaposition of rows of black dots, which are arranged along straighter lines, sometimes (B of Figure 18) at equal distances, sometimes (A of the same figure) with great irregularity. 7
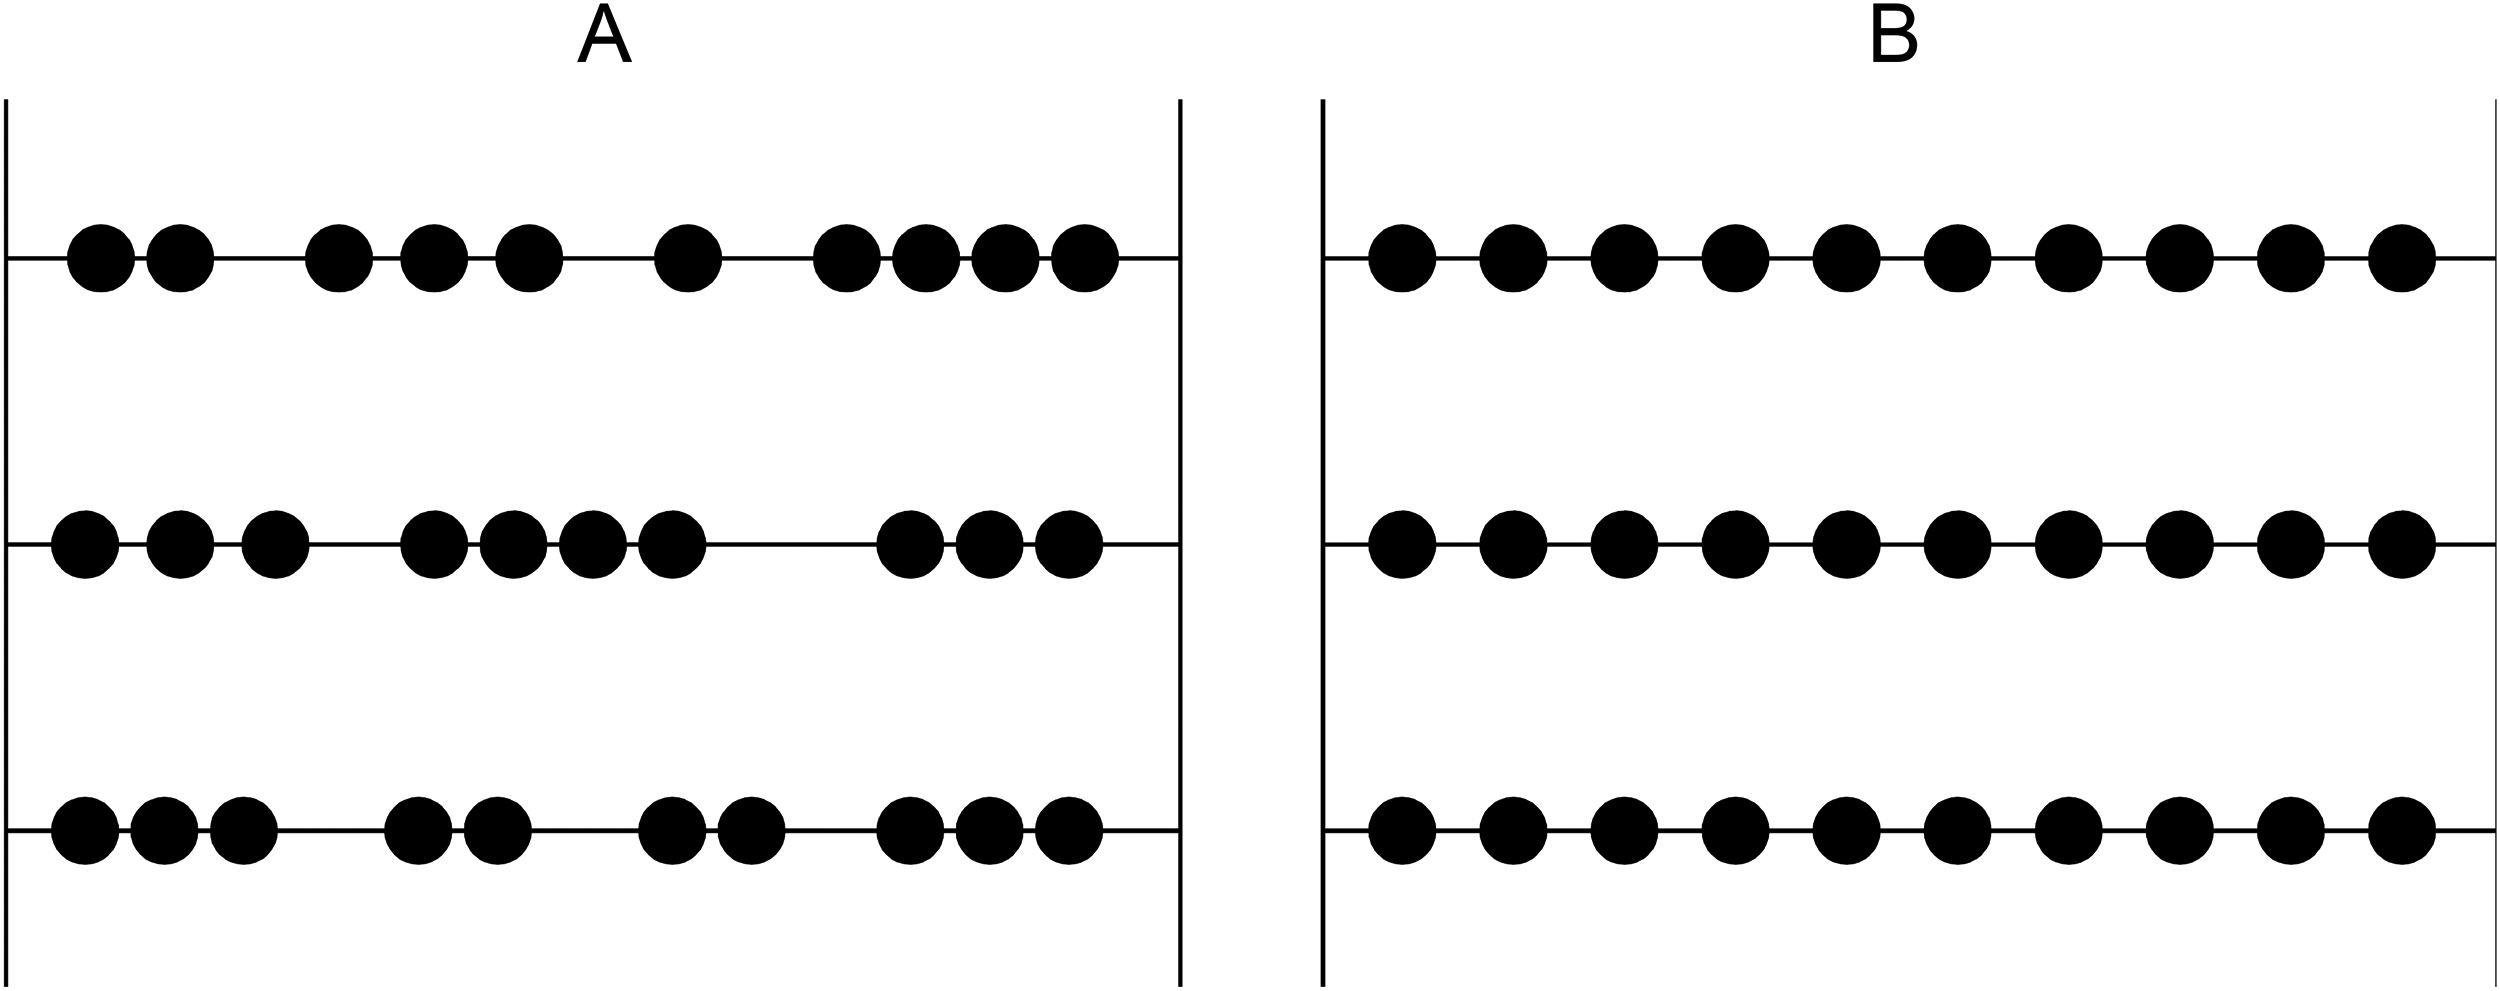
In series A of Figure 18, the black dots often form groups of 2, 3, or 4 units. In each of these groups, the phenomenon of greater cohesion between the elements that make it up is confirmed, while the relationships between the units of different groups are greatly diminished. In addition to the figurative unity of the collection in its general wholeness and the unity of the individual elements, another unity is clearly formed in our consciousness, which can be regarded as superior to the individual element, that is, as a group unity. In each of these higher-order units, each element certainly loses a part of its value as a unit through the increased relationship to the next point, even if it gains other properties. The isolated points, which are fewer in A than in B, retain their value as units. The factor of objective grouping does not come into play for the elements in B, even if an individual subject can have a tendency towards subjective grouping.
If in the series A of Figure 18, although in addition to the factor of grouping, the factor of increasing the gaps is also effective, the latter no longer has the importance as in Figure 17. This is because it is neutralised by the fact that the distance between most of the individual elements is reduced, something that in itself would lead to overestimation of quantity.
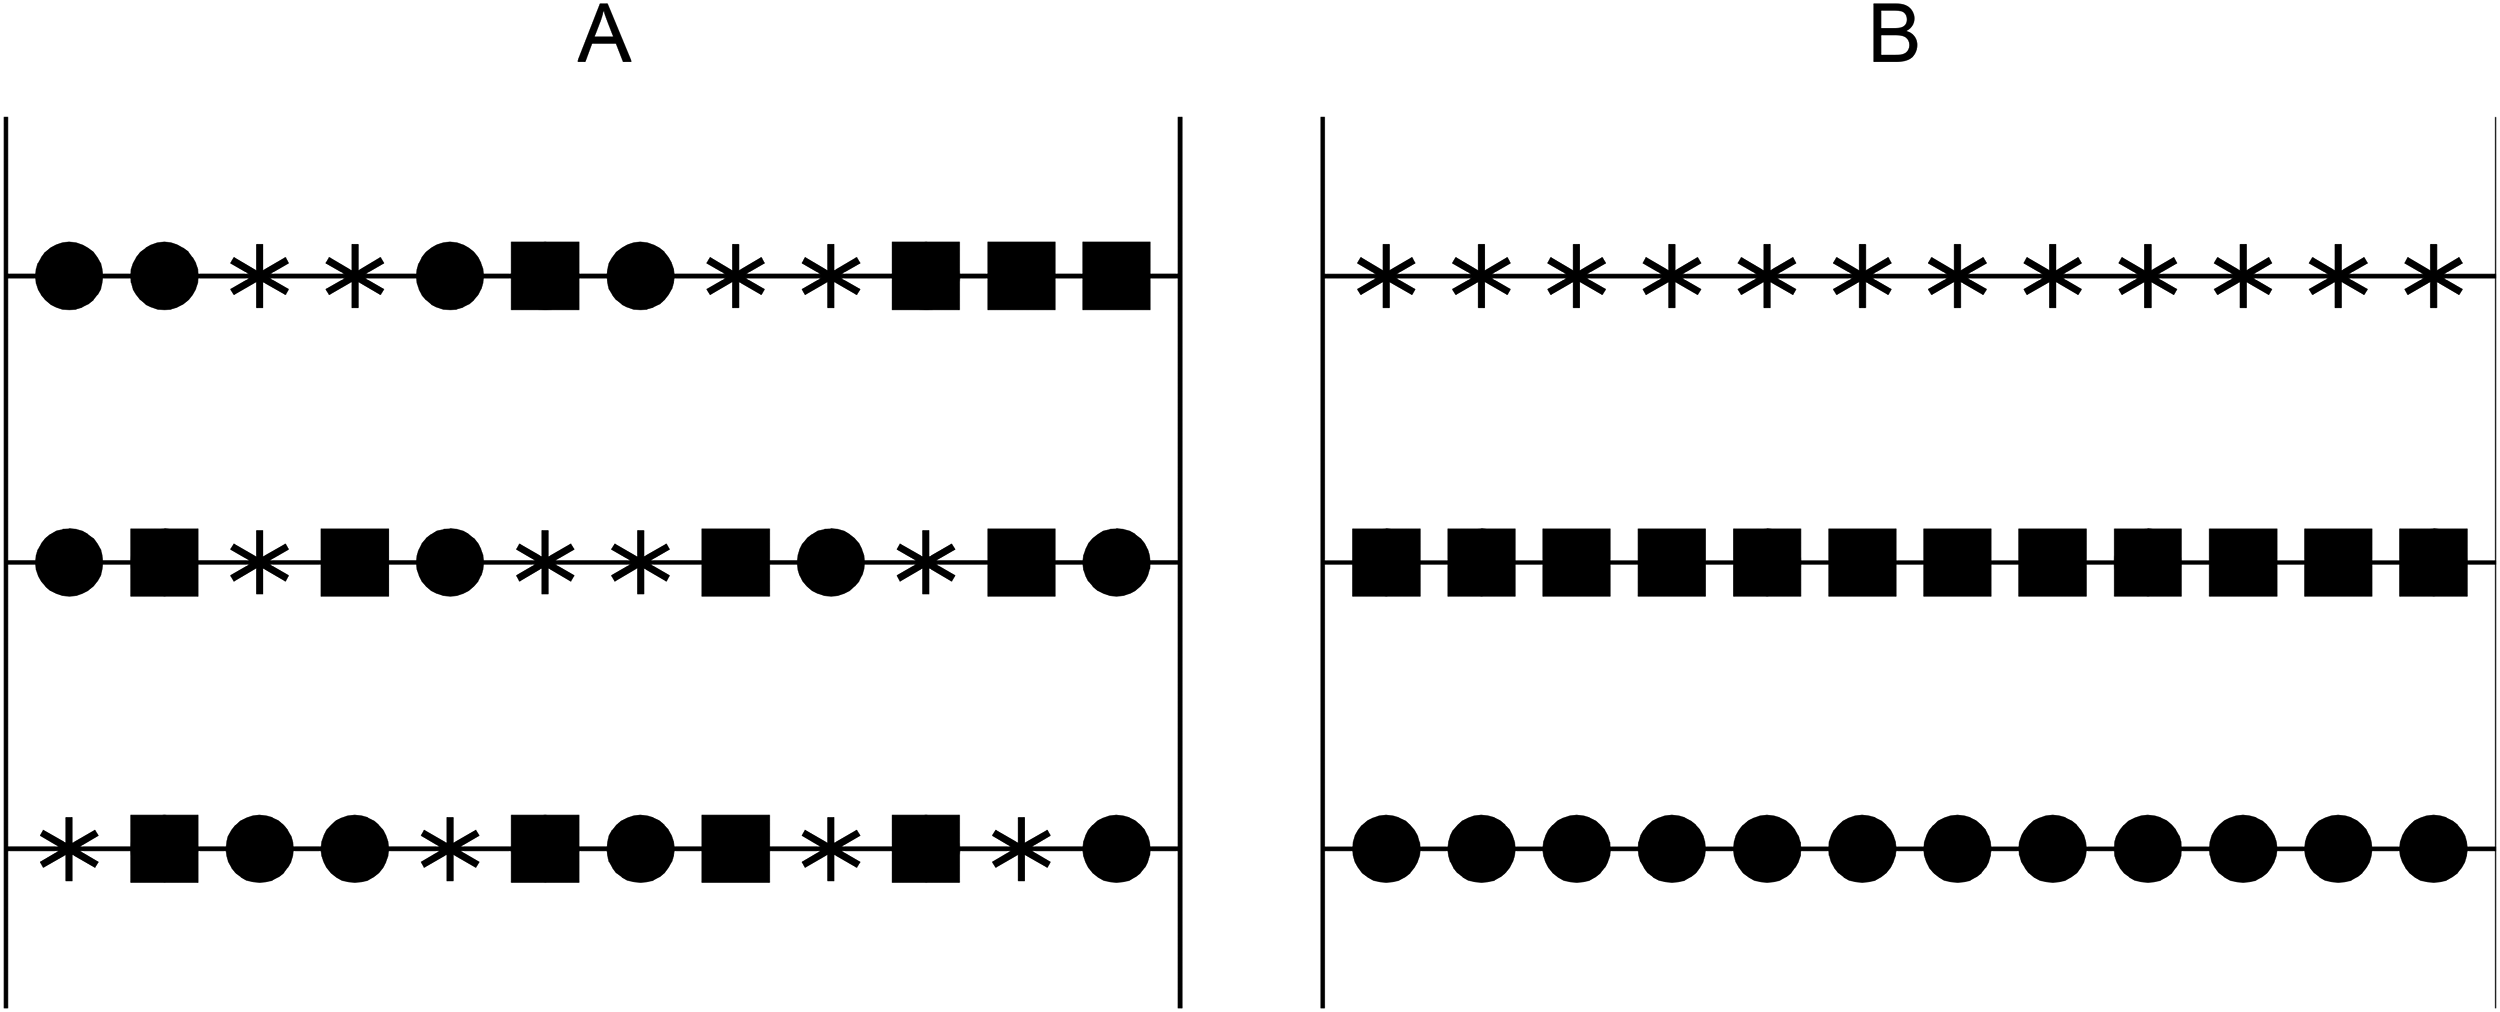
Figure 19 shows that the influence of the grouping is really dominant in the estimation. In the rows compared, the spaces between the constituent elements are actually kept constant in both rows A and B. But in B the three different kinds of elements employed here (points, squares, stars) are arranged in such a way that the same elements are lined up along a horizontal line, so that on this there are only homogeneous elements at equal distances from each other. The interstices are also the same in A, but the individual types of elements are mixed more or less irregularly within a horizontal line.
In Figure 19, just as in the comparison suggested by Figure 18, the apparent numerical superiority of the units of B is obvious. This is due to the fact that in A again, although for a different reason than in the previous figure, the formation of groups of 2, 3, 4 identical or different elements is realised.
This result seems to contradict the result obtained with the same Figure 19 when the subject's task is changed. She is then asked not to guess which of the two series being compared appears to have a greater number of elements, but which one appears to have a greater number of different kinds of elements. To this every subject will answer without hesitation that the larger number of formally different elements are present in A. 8
But the result of this particular method of estimation, as has been said, only apparently contradicts the results obtained by the experiments described above. In reality, it comes to the aid of the explanation given above.
The following happens in the new task: when different types of elements are mixed together irregularly, they often find themselves in contact with units of different shapes. As I have already indicated, these relationships to the neighbouring elements result in peculiar groupings, which not only change the unit value of each group element, but also its form.
This influence of the groups on the quantity estimation can be traced in other series where it is not as complicated as in Figures 18 and 19.
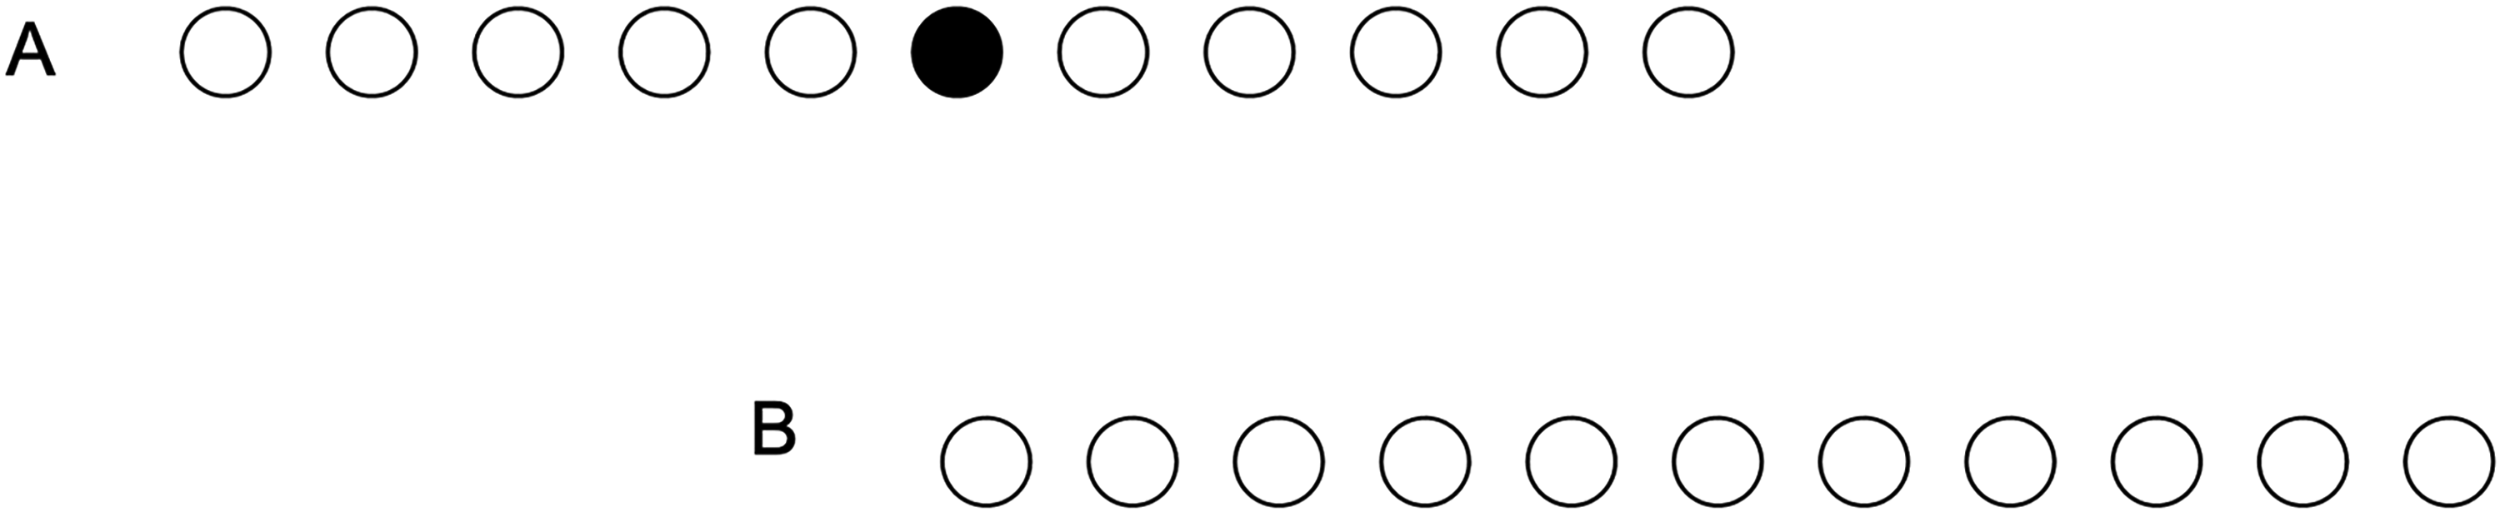
One of the simplest cases seems to me to arise in the comparison of series in which in one (B of Figure 20) equal circles are placed at equal distances along a horizontal circle in the middle.
While the individual circles of B in Figure 20 seem to have almost the same value, in A they form a group on each half of the figure, to the right and left of the middle circle, which wants to be assessed as something uniform, existing in itself.
Here, too, the circles of both groups of A must certainly have lost some of their individual value, which they retain in B, by entering into a unity of higher order, because, under otherwise exactly the same conditions, the only striking difference being the black circle in the centre, appear fewer in number.
When comparing A and B in Figure 20, the well-known fact that an extension divided in the middle is underestimated compared to an undivided one also comes into consideration as a factor in the false impression of difference between the two series.
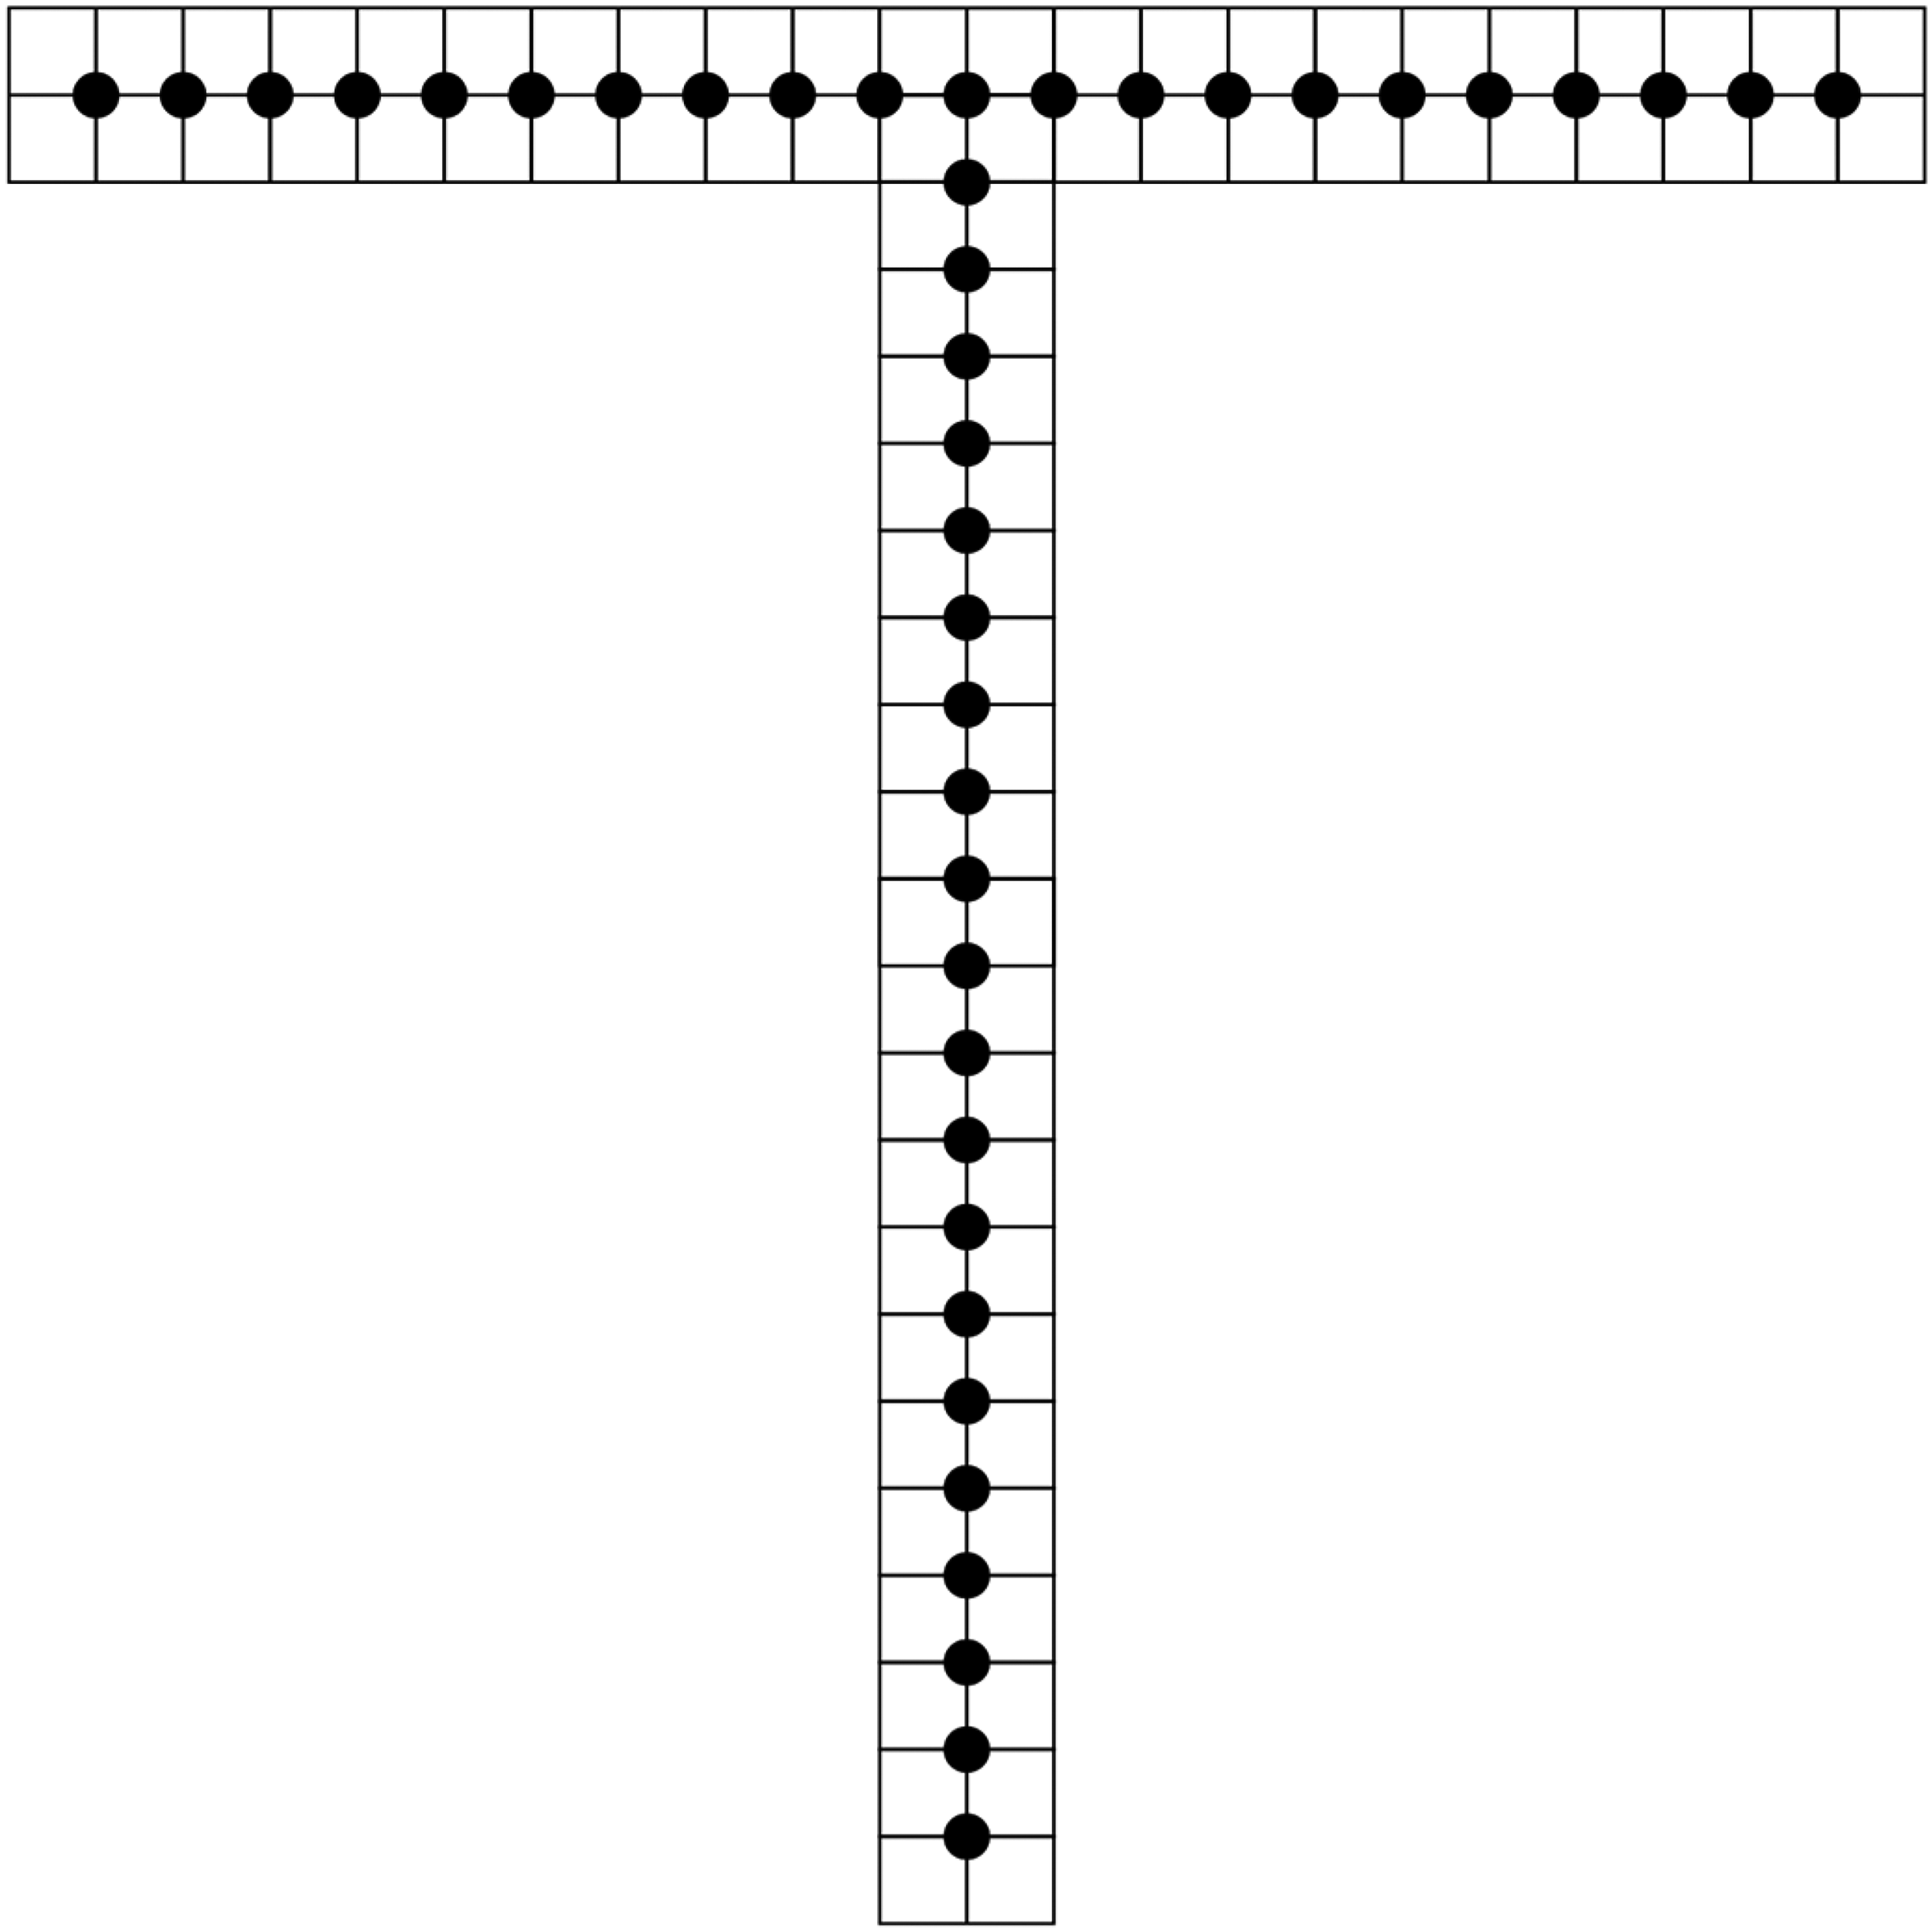
This factor is amplified when comparing A and B of Figure 21, which in A is one of the determining pieces of the Müller-Lyer illusion, and in Figure 22, which contains the fact, well known in the field of optical-geometric illusions, of the overestimation of the length of the vertical bar in the T, which certainly contributes greatly to the overestimation of the score along the vertical branch compared to that of the horizontal one to increase.
One might thus be inclined to think that the underestimation of A when comparing the two parts of Figure 20 depends not so much on the symmetrical grouping factor as on the underestimation of the linear extent divided in the middle. But the underestimation also occurs in the case where one of the two comparative rows (row A of Figure 23) has two (or possibly more) black circles at regular intervals, while the other has none.
The underestimation in A is inherently inconsistent with the tendency to think of a multiply divided linear extent as longer than an undivided one of the same length. The fact therefore decides in favour of the assertion that the factor of extensive overestimation and underestimation is not the primary reason for the overestimation or underestimation in the compared series in Figures 20 and 23, but that this is to be sought above all in the factor of grouping.
The influence of grouping on the estimation of a number of set elements finds confirmation in numerous figured set elements finds confirmation in numerous figured arrangements where the tendency towards grouping is facilitated by a particular distribution of the elements, for example, B in Figure 24. In A the factor of grouping is increased by the fact that the centres of the circles have been shifted towards the right side of the largest circle: this leads to the underestimation of the number of circles.
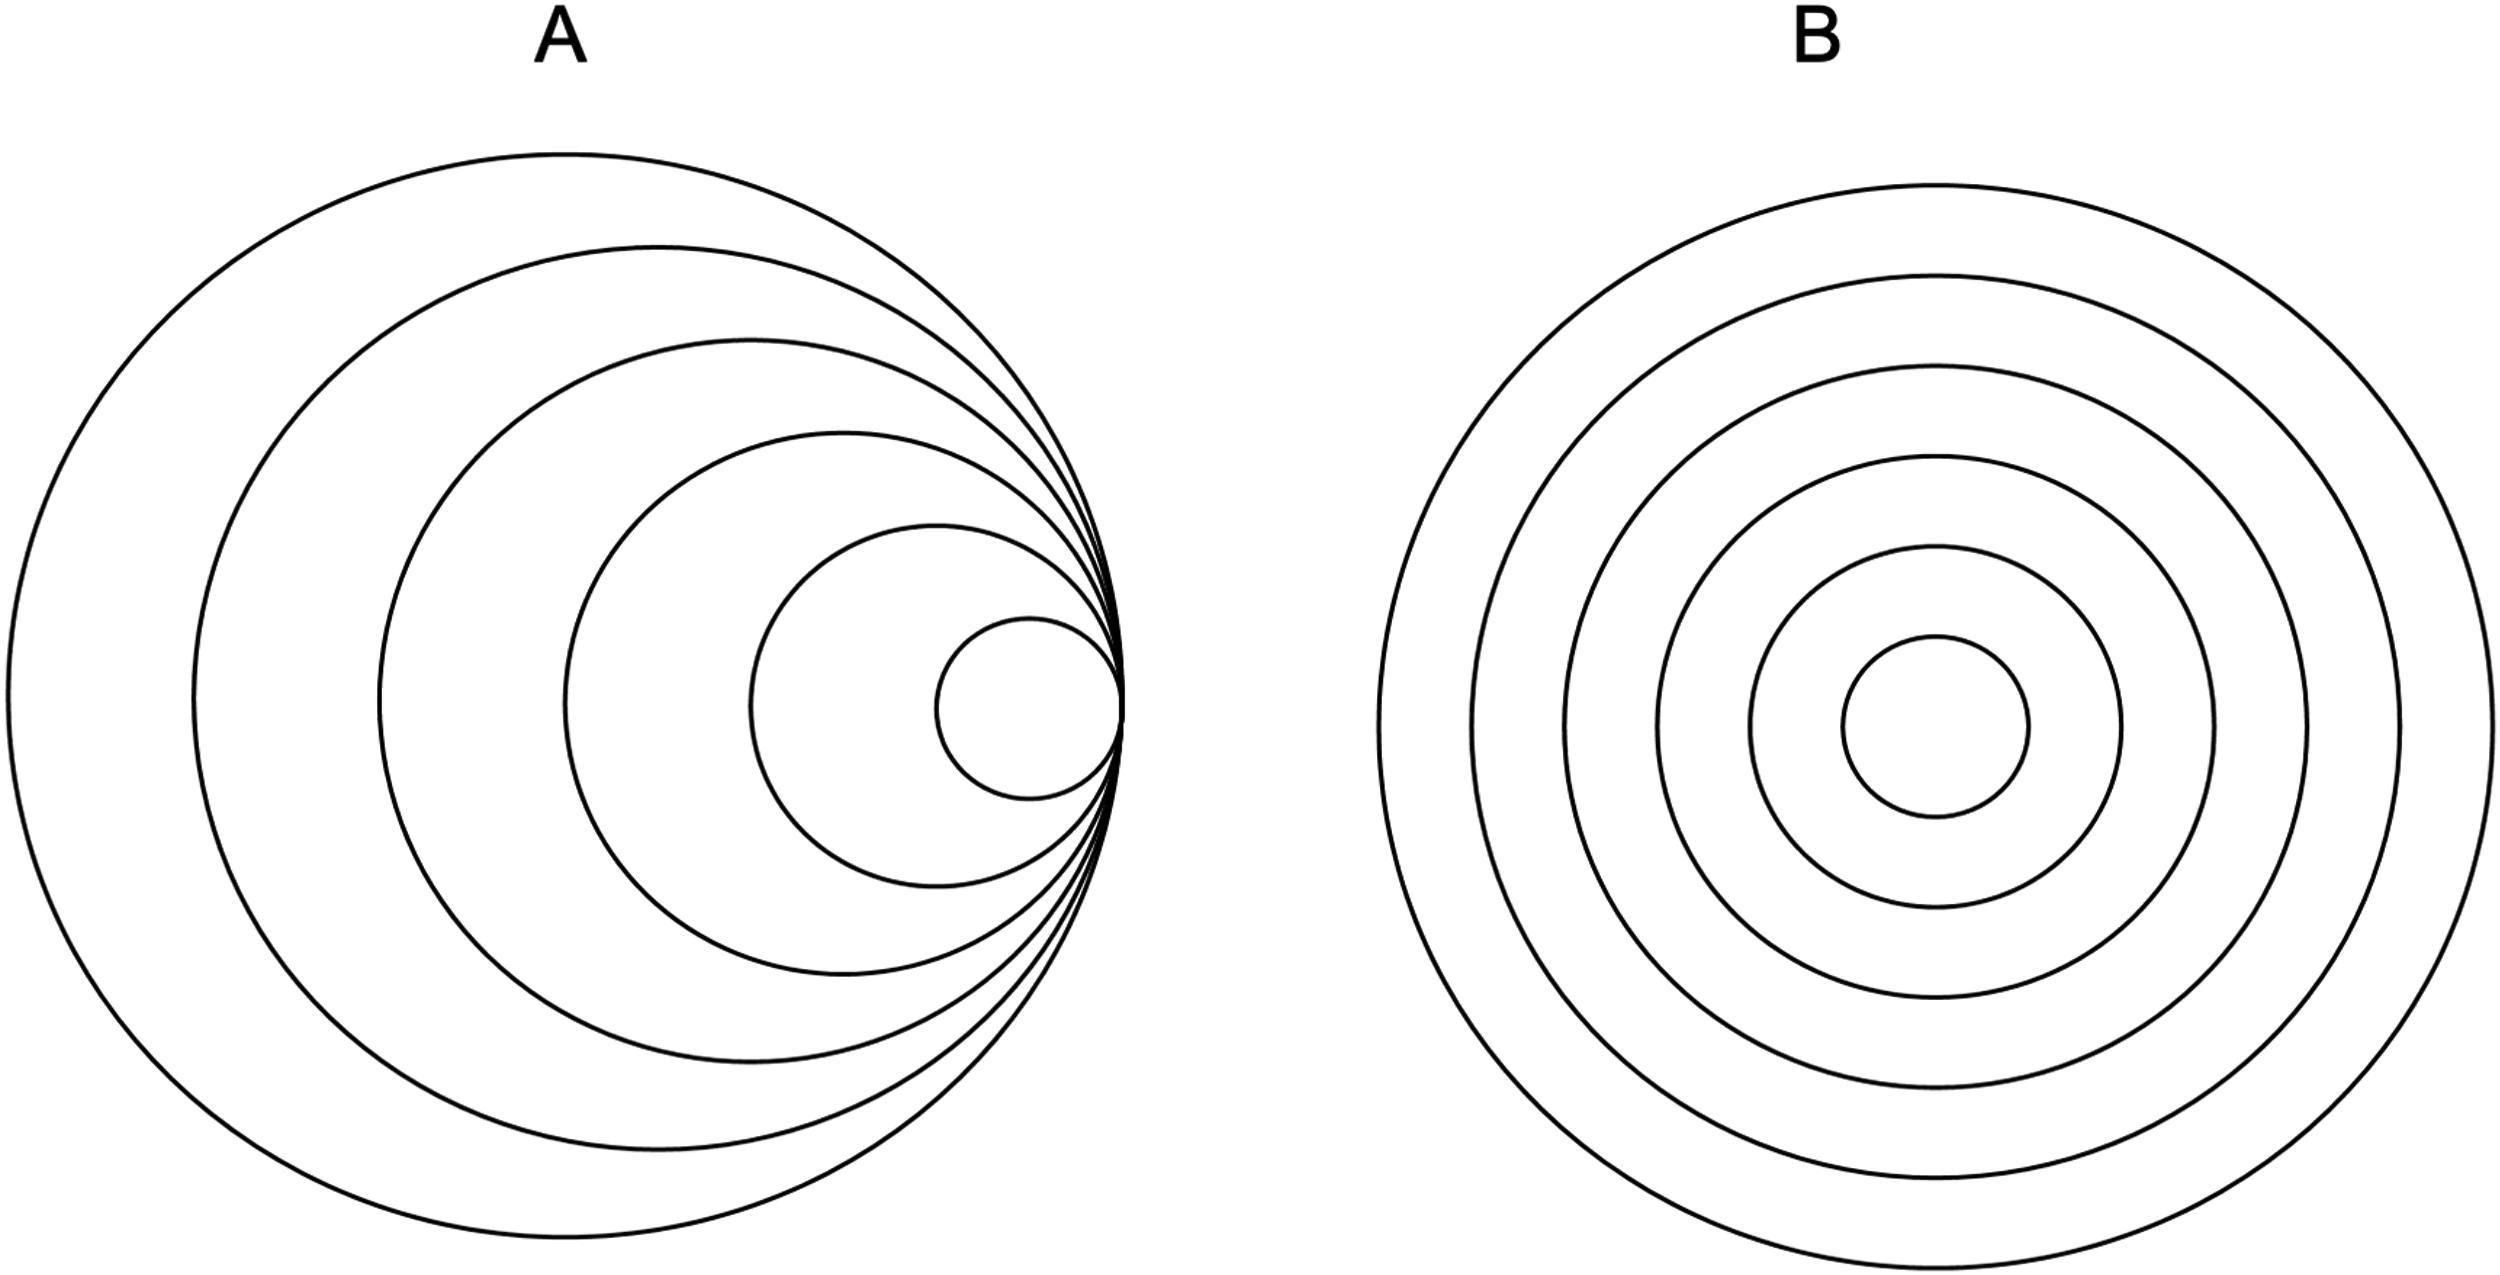
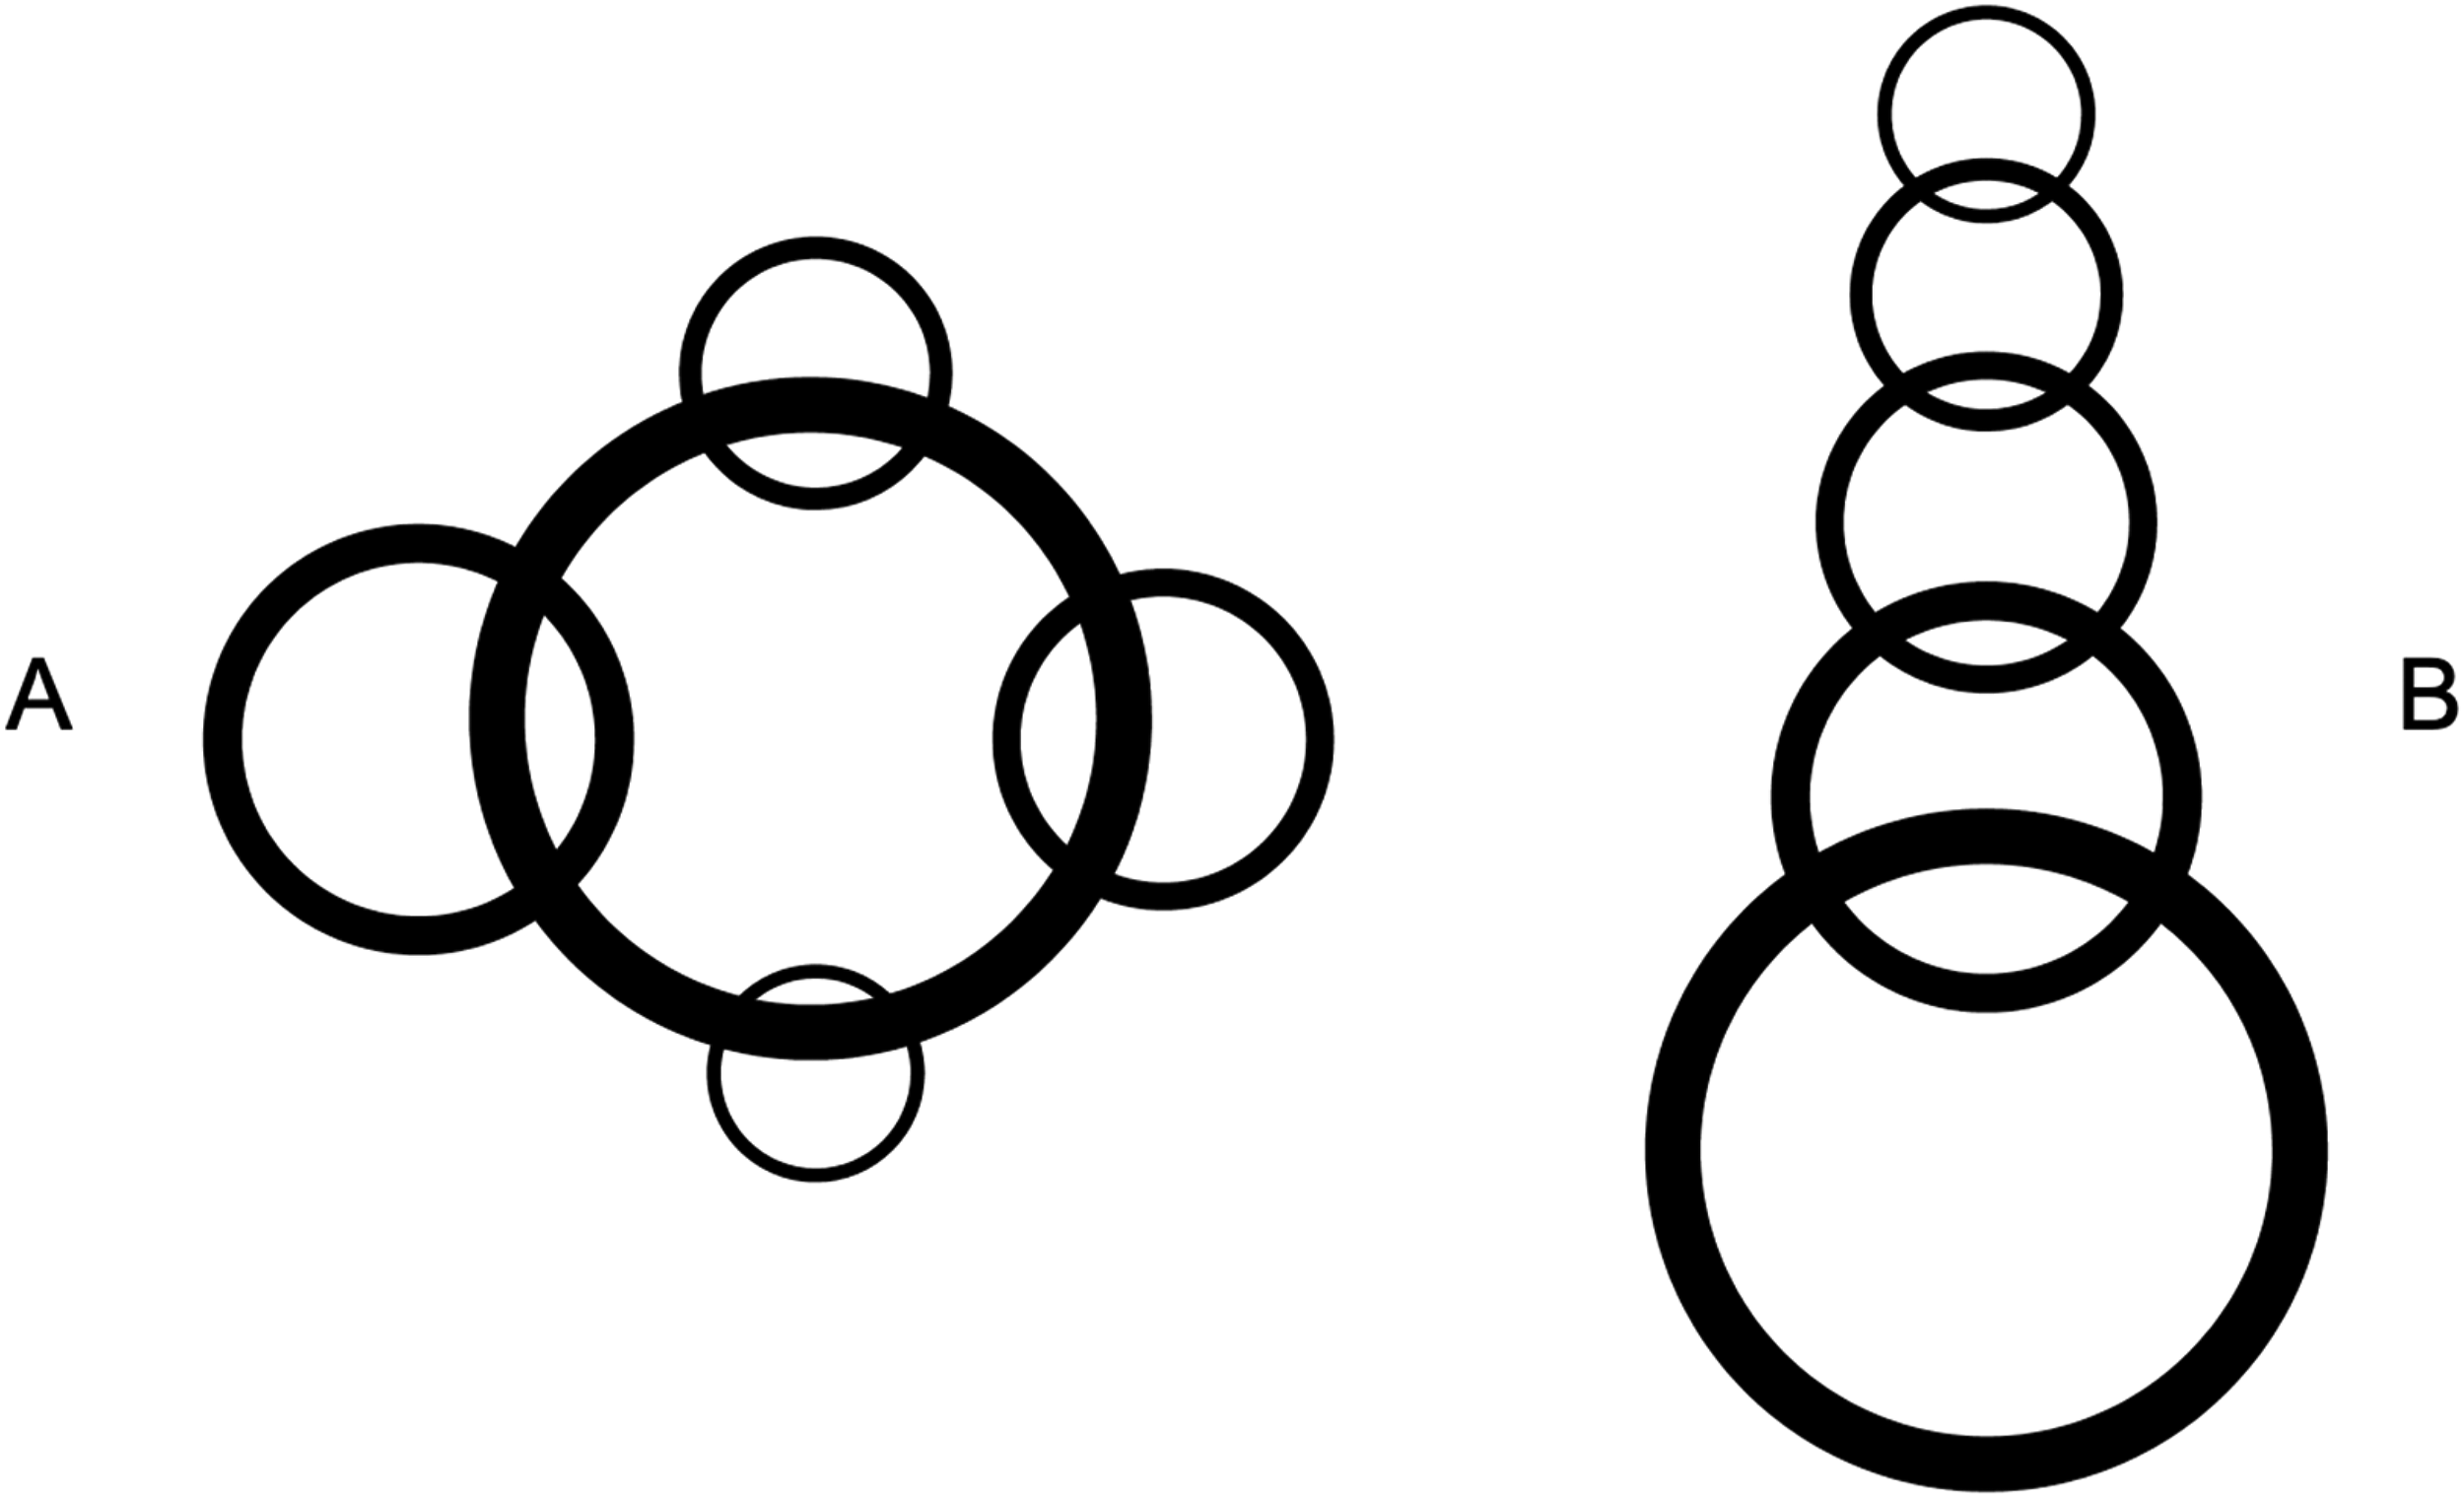
This is made even more striking by the fact that the distances from one circle to the next are relatively large on the left-hand side of the row. A much more uniform character is retained by the concentric, progressively smaller circles of row B of the same figure, in which the factor of grouping around the smallest central circle is much less energetic. 9
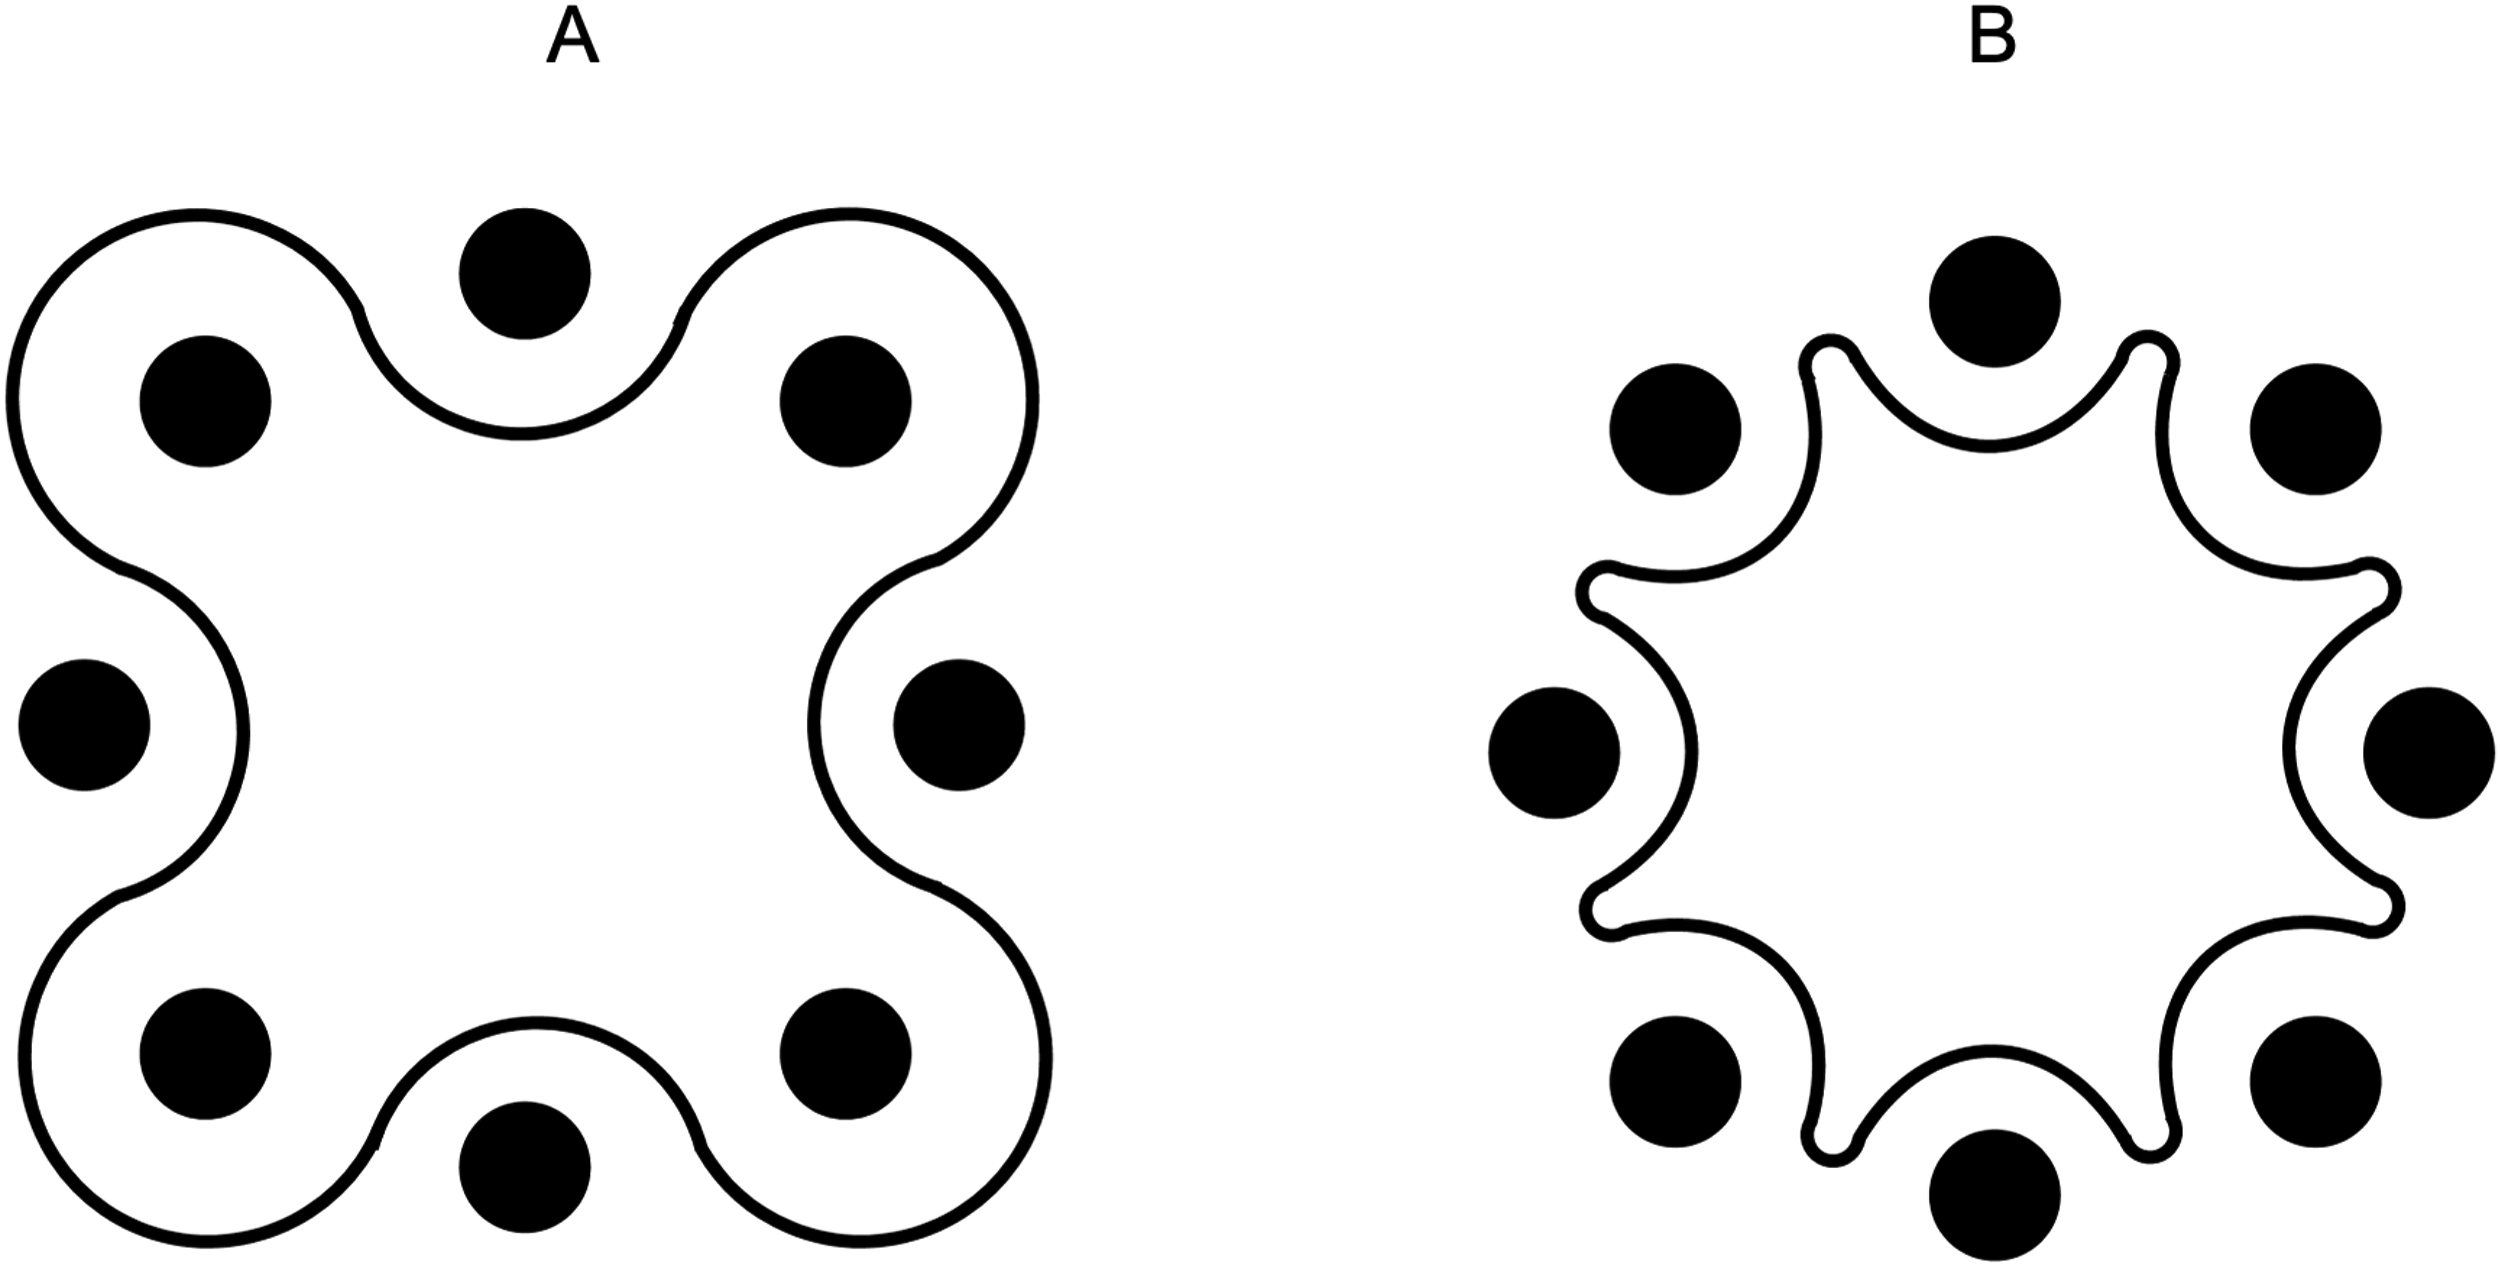
The same grouping factor exerts a strong influence on row A of Figure 25, where four smaller circles are arranged around a larger one which serves as the centre of the grouping. In row B of the same figure, the same circles are simply lined up as a chain one behind the other and are therefore lighter than equivalent elements considered when estimating the quantity. They appear more numerous in B than in A.
Special outlines can be used to increase the grouping factor of over- or underestimation. This is illustrated in Figures 26 and 27, for which I have found numerous examples and which I leave aside in this work.
Influence of Connecting and Separating Factors
In the A series of Figures 20 and 23, which are characterised by the presence of black dots, these latter deserve even more special consideration.
You could have a special influence on the neighbouring points by uniting them into groups. However, this does not appear to be the case in the figures mentioned, at least not to a noticeable degree, since the existence of the black dots delimits the groups formed from homogeneous elements. However, we can detect the possibility of groupings between adjacent but differently shaped elements in the examples of row A of Figure 19, where one element functions as a group centre for the adjacent ones.
In the series of points, one or more of which are particularly different, it was often stated by some subjects that these points differed from the others precisely because of their special marking and were therefore noticed more. This could, to some extent, cause an overestimation of the collection in antagonism to the effect of grouping. But we find that this is not happening, at least not sufficiently, because these rows remain underestimated compared to the others with uniform elements (B of the same figures).
The trend was not evident in other subjects. Rather, they indicated that they viewed those points as elements of low cohesion with the constituents of the array mass whose sharp grouping boundaries they (i.e., these black dots) specified. This diminished connection with the other elements in the series could put the black dots in such a state of dissociation that one might, even against one's will, think of ignoring them when estimating the quantity. This can be achieved, for example, if the black dots occupy the outermost positions, because if such outermost elements of the series naturally reduce their connection with the others, this must become significantly less if the units, through greater difference from the others, become more connected take on the character of boundary points as of elements of the series.
Undoubtedly there is a tendency in all subjects to dissociate any salient elements, even when not made aware of it, as well as the opposite tendency to reinforce their value as individual elements. In Figures 20 and 23, however, it certainly does not represent the decisive factor for the underestimation. Rather, this must always be recognised in the grouping. This can easily be proved by maintaining the uniformity of the points and introducing other signs which are completely independent of the units to be estimated and at the same time facilitate group formation. An example of such conditions is given in Figure 28, where two straight lines at equal distances, without changing the objective intervals, interrupt the row of dots.
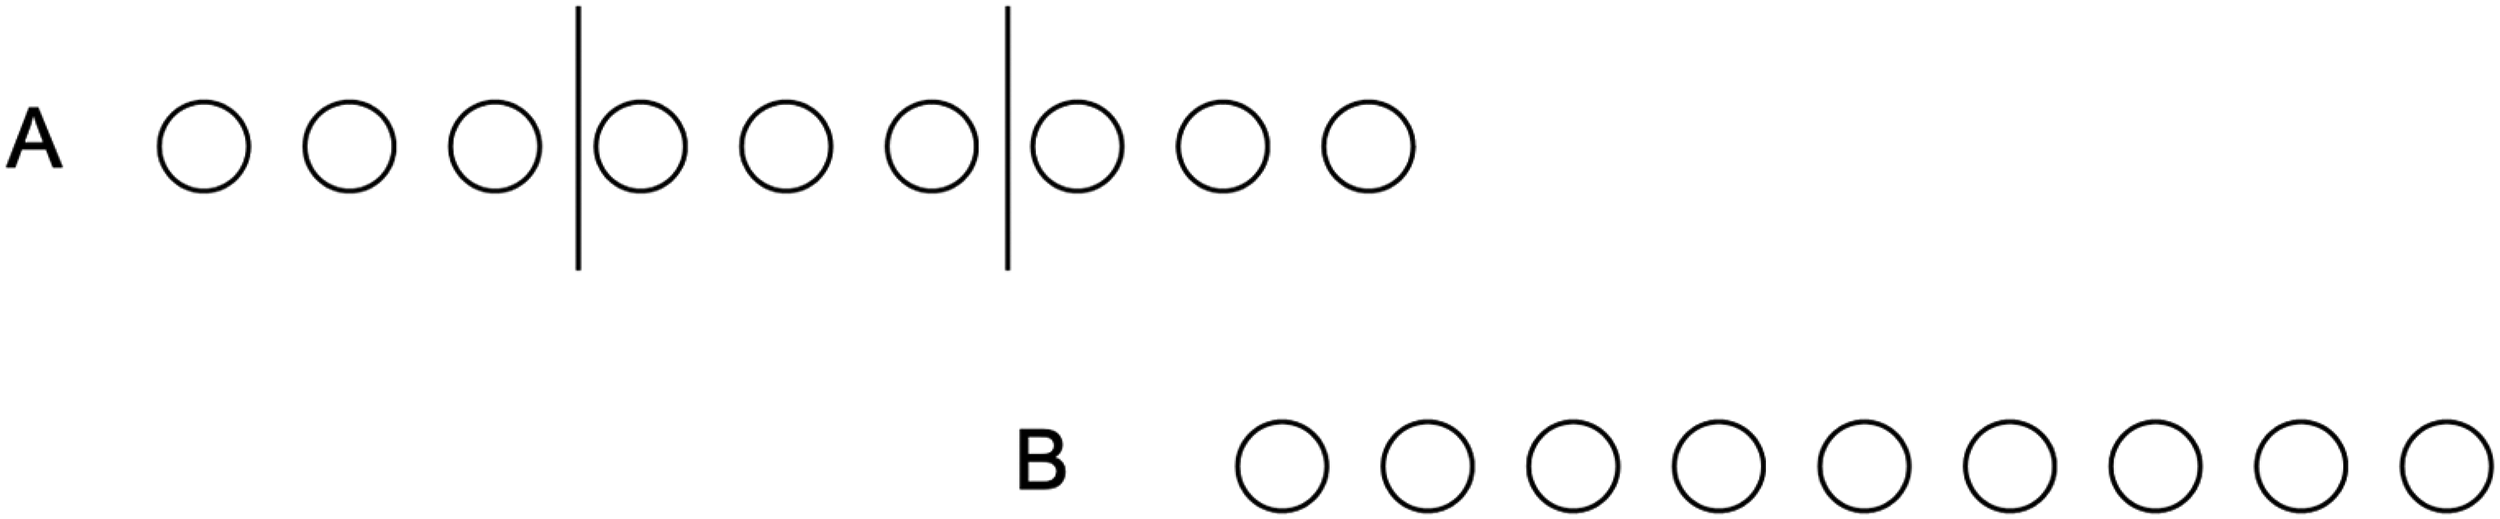
Although here the elements are homogeneous in their structure, since the black dots are absent, and the phenomenon of extensive overestimation is realised in the series repeatedly divided by the straight lines, here A seems to consist only of the grouping of a smaller number of elements than B.
The influence of the connecting and separating factors can also be illustrated by elements arranged in a row that form stronger ties, such as for example B, the letters of the alphabet.
Arranging a series of elements made up of letters of the alphabet to form a word or a known sense leads the subject to underestimate the number of elements compared to a meaningless series made up of the same units.
And the effectiveness of the connecting factor is shown even more clearly when we contrast a word of about 9–11 letters with an equal row of zeros which have the same shape and are arranged in the same direction. The set formed by the row of letters in the word is significantly underestimated by the associative factors compared to that of the row of zeros.
The Factor of the Movement Effect of the Figure on the Subject
This factor could also have been taken into account in the processes already analysed. But it has its peculiar traits, for the sake of which it deserves to be distinguished for the purpose of a schematic analysis.
Of the elements that we are asked to assess in certain configurations, some appear to us static (at rest) in the form of equilibrium, while others are unbalanced, which therefore more easily arouse in us the idea of change or movement. Figure 2 offers us an example of these two conditions. In A the elements appear to us in a state of rest, in B the elements appear in a state of static instability; each of the elements gives the impression, to some extent, that it wants to rotate about its lowest point, or the series as a whole, that it wants to make a forward movement from left to right, or upwards
Imagining the movement leads to the thought of the continuation of the movement and, reflexively, to the unfolding of the collection beyond the boundaries of the figure.
That this is the case becomes clear when one considers connected series of elements (points, lines) in slow and regular motion. I was able to realise these experimental conditions by holding on a screen a row of eight black dots, distributed along a straight vertical line, and an identical row of dots next to this fixed row, drawn on a strip of paper, against the same background at a moderate speed in front of the subject 11 in such a way that the eight moving black dots remained visible to him at all times. The series of moving black dots has always been overestimated by the test subjects.
Limits of Error Tendencies in Quantity Estimation
Cattell 12 used quantitative measures using the tachistoscopic method to determine the maximum number of elements that can be precisely grasped in a momentary presentation of complexes made up of sufficiently simple elements (lines, letters, numbers). He found 4–6, a limit confirmed by others (Nanu, 13 Liebenberg 14 ).
It has been extensively verified both in theoretical discussions and in many tachistoscopic experiments to derive that maximum number for multiple impressions of different composition and distribution in the presentation field.
However, the quantitative analysis seems to have missed a point, which emerges very clearly from my essentially qualitative determinations, namely that even with a number of elements under 5 the tendency to overestimate or underestimate is quite clearly present. This error tendency occurs for example with rows of four elements (Figure 26), although the rows were presented in long exposition to the subject who had to make his judgment. Where the formation of groups in the series under consideration is facilitated by artifice, the tendency to underestimate series with fewer than five elements is realised by reducing the unit value of their elements, which in turn depends on the greater cohesion between the group elements. This can already be seen in sets of three elements: where grouping is facilitated in some way, we tend to underestimate the wisely, compared to sets of three elements, in which the tendency to form groups is less pronounced. There is still a tendency to underestimate even for series with only two elements.
If we limit our consideration to the unit which we have deliberately chosen or fixed as such, we can no longer observe this tendency with the isolated element. That it is there nonetheless becomes apparent if we put together a series of units of a given form and compare them with a similarly ordered series of other forms (Figures 7, 8, 9). The series formed by units of more complicated shape appear to us more numerous; and that just proves that there is a tendency to overestimate, albeit not conspicuously, the single less simple unit, and vice versa to undervalue the simpler unit. The more complicated unity should therefore appear as more in the collection, through its shape characteristics and its relationships to the other elements of the series in the figure as a whole. The overestimation of the units usually takes place through another process, in that it reduces the factors of connection with the other elements of the series, while increasing their intervals and increasing their isolation.
Basic Initial Tendencies in the Subjective Dynamics in Volume Estimations
The view that the explanation of the facts in question is simply to be sought in an unambiguous relation between quantity estimation and figure extension is fundamentally changed by the previous expositions, since our estimates are not only related to the total extension of the figure, but also to the distances separating the elements, and to other factors connected with the way in which the individual elements are assembled.
The diminution of the interstices, so far as they remain constant, is a factor in the overestimation of the set, since the elements appear more numerous where they are really or seemingly closer to one another. Since the spaces in between often tend to impose themselves more in terms of their absolute value than in their relation to the size of the figure which includes the elements to be estimated as a quantity, experiments can lead to a result that tends to assume an immediate direct relationship between the estimate of extent and that of quantity size is just the opposite. This could be seen in several of my sets in this work (Figures 12, 13, 14, 16). 15
On the basis of the introspective facts we can only assert that the factor of expansion in the figure, which is formed from or contains the units to be estimated as quantities, outweighs the other factors in us at the beginning of the estimation. It is often the only phenomenon that many test subjects refer to as the reason for certain overestimations, or at least the most obvious one if the test subject also makes other statements. Where large quantities are involved, this factor of linear expansion or the surface concerned must certainly also be decisive for that impression which Liebenberg (op. cit. p. 391) calls the “impression of thickness” and which is directly related to seeks to associate “little” or “much” with the general judgment. The fact that this relation of “larger extent” and “larger number” appears so immediately does not tell us whether this process is really an original fact, or whether it is rather the result of the frequent combination of “few” and “small,” of “much” and “great” was dictated, and was only pointed out first because it came to full development through its greater conspicuousness.
Also in other areas of mental functions, such as that of memory, the shifting of the order of events to be revived is common and well known, related to the impression they made on the subject.
For those that have worked the deepest also tend to be the first to be recalled, with an apparent change in their chronological sequence.
This does not mean, however, that the overall impression of the collection generally comes to us later than the impressions aroused in us by the parts.
However, this may be permissible in some cases, for example, B, when estimating amounts that are irregularly distributed over large areas, so that they cannot be encompassed at a glance, but are successively grasped in their individual parts, until finally the whole is formed from the union of individual parts, to which then the total estimate is added. 16
But if for the moment it is not possible to determine the order of the processes which lead us to the final judgment, for the various directives of the task of estimating quantities it can be shown, more than in other areas of psychic experience, that from the beginning of the comparison to here special fundamental tendencies of psychic dynamism must necessarily be effective, apart from any rational procedure and also apart from a clear awareness of their existence on the part of the test subject.
We already sense such tendencies in the field of simple perception, but we experienced them more specifically in the field of thought functions, where both tendencies become clearly conscious and can be individualised. Certainly, with all mental processes, from the simplest to the most complex, it can be admitted, and sometimes proved, to exist and operate.
Kiesow, 17 who recently studied the phenomena of binocular mixing and competition between different colours, has stated that in all cases of competition there is also mixing. Mixture is favoured by the principle of psychic fusion, while inhibited by the principle of independence revealed in competition, which is intensified when the differences between the two light sensations are too great.
I noted the existence of these two principles in the treatment of the phenomena of mixing and competition between spatial representations on the skin. 18
Given the manifestation of their expression in the psychic processes, one should rather speak of tendencies than of principles, which I distinguish with reference to the terminology used by Kiesow as synthesising tendencies and dissociating tendencies, because the term “tendency” refers to the concept of dynamic participation of the subject in the processes more clearly.
In estimating quantities, the first tendency drives us towards a total estimation of the quantity, the second strives towards the individualisation of its components; the first favours the merging, the second the independence of the units.
If we look at the individual Gestalts from the point of view of the subject's active participation, we constantly experience the expression of these two tendencies.
Evidence of the existence of this double tendency in the subjects’ behaviour during quantity estimation is the fact that one or the other tendency predominates, depending on the subject. Nanu has thus established the existence of two easily distinguishable types of test subjects, depending on the way in which they proceed with the estimation. 19
In the final purpose of the mental act of estimating quantity, it is natural that the synthesising tendency prevails: indeed, it leads to the eventual estimate, and therefore subjectively it often seems to dominate the field alone.
During the course of the estimation, the tendency towards subjective grouping of the individual elements also takes effect, even where objectively there is no facilitation of group formation, for example, B, when it is a series of uniform, equidistant elements. In fact, we can see in grouping one of the best means of estimating extended masses more easily. In the set of individual elements, the group represents a new unit of higher order and smaller number, which makes it easier to estimate without the benefit of counting.
In his work on the formation of optical rhythms in the successive and silent presentation of luminous points, Koffka 20 observed that subjective groups are formed, which are added to the impression of mere regularity. He traces the concept of the group back to the more general “Einheitsform” (Gestaltqualität, Komplexion). Following Stumpf, he defines it as “das psychische Gebilde, das der Funktion des Zusammenfassens entspringt, wenn zwischen den zusammengefassten Gliedern sachliche Beziehungen bestehen” [the psychic formation that arises from the function of summing up when factual relationships exist between the members] (op. cit. pp. 104–105).
Benussi, 21 who takes credit for pointing out the importance of the formation of groups in relation to the organisation of time, which he also calls “Frasierung,” highlights that grouping, in the case of brightness, spatial relationships and time, acts “im Sinne einer Erhöhung der Aehnlichkeit zu ungunsten der Verschienenheitsauffälligkeit” [in the sense of an increase in similarity to the detriment of the conspicuousness of disparity] (op. cit. p. 107). He sees in the acceptance of characteristics of similarity between the components of the group, the main factor of the phenomenon of the tendency to shorten the duration of a stretch of time divided in half or in more segments.
If one considers that one can also unite impressions that stand in any contrasting relationship to form a group in which, as a result of the effect of the grouping, the “Verschiedenheitsauffälligkeit” [conspicuousness of difference] is emphasised, one cannot see this factor as the first reason for subjective group formation. The drive towards grouping, as a suitable means to the end, must, in my opinion, rest in the dynamism of the subject, which is expressed, in this case, with the tendency to synthesise the processes in progress, as suggested by Koffka (op. pp. 105–107) in the case of rythmitasation. In this tendency towards synthesis one can also, like Gatti 22 claims for other phenomena, see the most economical means of attaining an end, from which psychic life does not escape in any of its expressions and which often, if not always, coincides with the most suitable means for the attainment of a given goal for the psychic functions, which I hope to have proved in various of my works. 23
Various authors (Nanu, Liebenberg) who have worked on number estimates have observed the ease that arises for the estimate when the grouping itself is required by the arrangement of the elements, and on the other hand the greater difficulty where the partial groups cannot be set up.
Given the generality of the synthesising tendency, it is understandable that this facilitation by means of grouping is realised not only in the field of visual impressions, but also in that of auditory impressions, where Nanu has confirmed the findings of Dietze 24 and Schumann 25 that rhythmic groupings facilitate accurate estimation of larger numbers of sound impressions.
Through this original tendency towards synthesis, it is understood that there is generally an underestimation where the possibility of grouping prevails, which has a devaluing effect on the individual elements. In the group, each unit loses a little of its original independence and, through the greater cohesion that develops between the group elements, acquires new peculiarities which it shares with the other group elements. In this sense, one can also agree with the research of Nanu and Liebenberg, who both found that there is a tendency to underestimate many irregularly distributed points. In my opinion, however, in these cases there is a greater effort on the part of the subjects to group the items into a certain number of groups.
The synthesising, connecting, grouping tendency is constantly checked by the dissociating one; this latter constantly stresses the individual units in their formal constitution, as well as the interstices between the individual elements and between the elements and the whole of the figure which contains them or is formed by them.
This tendency gives rise to new reasons for changing the unit value of elements, especially reasons for increasing this value.
Koffka already showed for the visual rhythmic forms that even a single point can form a group in which the pause serves as a background. In my investigations the same fact has come to light, which depended particularly on the formation of the units in their relations to the whole of the figure, or on the emphasis on the isolation of the units by increasing the distances between neighbouring elements.
The dissociative tendency serves particularly to emphasise the part (in our case the unit in relation to the whole or in relation to other units that make up the set). It is to this tendency that the spontaneous limitation of unity as a whole can be traced, and its tendency to double, to multiply.
Reference to the Interference of Other Factors of Psychic Dynamism in Quantity Estimates
Besides these synthesising and dissociating tendencies in subjective dynamism, which coexist, work together and resist each other, and the individual factors of which have been analysed in my work, other important and well-known factors often change the course of psychic events through their interposition.
There is no doubt that the suggestive factors of expectation, surprise, fear, joy are important in our visual appreciation of life. I have not analysed them in this paper, although they are always obscurely present in the formations of the given sets, as a result of the principle of the unity of our consciousness. Evidence of their presence can be found in the aesthetic feelings associated with certain group forms, where the striving for rhythmicisation of the groups awakens. They permeate more clearly in the case of the collection figures, which awaken in us the ideas of restlessness and a tendency to movement. But it is my belief that their rules for scientific purposes can be better gathered from the casual observations afforded by life itself. Liebenberg (op. cit. 8–394–395) gave some illustrative examples in which special emotional dynamisms were at work in estimating the number of people in a hall or on a sports field.
With the widely used method of questionnaires one could collect well-observed cases, and make them the basis of a scientific determination of the principles which preceded popular experience has laid down in some proverbs. Popular wisdom already teaches us how the estimate of the number of enemies often increases in proportion to the terror that their sight arouses in the soul of the timid, which we express with reference to the Kabbalah of the Lotto with the words: “Fear makes ninety,” that is, everything.
To be closer to life with its actual estimates, and hence to a consideration that takes more account of the subject's affective dynamics in the performance of quantity appraisals, we approach the study of the value and conditions of our estimates as applied to specific practical purposes. I intend to come back to this field of application in another work, for which the present one partly laid the basis. Here only a few possibilities of their development are indicated, such as the school exercises in counting, the field of advertising, the art technique, the estimation of quantities, which are often required of witnesses in court or of soldiers during field service exercises, etc.
Footnotes
Acknowledgements
We are grateful to Dejan Todorović and Michael Morgan for helpful comments on an earlier version of this article.
Authors’ Note
I dedicate this document to my esteemed teacher, Professor Dr. Dr hc Friedrich Kiesow, on his 70th birthday, with the deepest wish that he may continue to work among us in his characteristic way for many years to come.
Author Contributions
Declaration of Conflicting Interests
The author(s) declared no potential conflicts of interest with respect to the research, authorship, and/or publication of this article.
Funding
The author(s) received no financial support for the research, authorship, and/or publication of this article.