



Abstract
This manuscript sought to investigate rater cognition by exploring rater types based upon differential severity and leniency associated with rating scale items, rating scale category functioning, and dimensions of music performance assessment. The purpose of this study was to empirically identify typologies of operational raters based upon systematic differential severity indices in the context of large ensemble music performance assessment. A rater cognition information-processing model was explored based upon two frameworks: a framework for scoring and a framework for audition. Rater scoring behavior was examined using a framework for scoring, where raters’ mental processes compare auditory images to the scoring criteria used to generate a scoring decision. The scoring decisions were evaluated using the Multifaceted Rasch Partial Credit Measurement Model. A rater typology was then examined under the framework of audition, where similar schemata were defined through raters’ clustering of differential severity indices related to items and compared across performance dimensions. The results provided three distinct rater-types: (a) the syntactical rater; (b) the expressive rater; and (c) the mental representation rater. Implications for fairness and precision in the assessment process are discussed as well as considerations for validity of scoring processes.
Music performance assessments are based upon a constructed-response format, where observed scores result from raters’ interpretations of a set of evaluation cues (e.g. items and rating scale categories) provided within a measurement instrument. The construct of music performance achievement is latent. In latent construct assessment contexts, the cues set forth within the measurement instrument serve as the operational definition of the construct. Therefore, the functioning of cues needs to be valid, reliable, and fair in order to properly define the latent construct of intended measurement. Unlike traditional cognitive-type tests where psychometric concerns stem from item and person parameter variance, constructed-response assessments have an additional layer of complexity calling for psychometric concern – rater behavior (Engelhard, 2002). In both hermeneutic music performance scoring systems (i.e. systems that define performance achievement based upon multiple-content expert rater perspectives stemming from differences in rater schemata) and psychometric music performance assessment scoring systems (i.e. systems that emphasize and value a high level of quantitative consistency between trained raters), empirical results can serve as a foundation for important administrative and political decisions with impactful consequences (Wesolowski, 2014, 2015). It is therefore necessary for decision makers to verify that rater functioning is valid, reliable, and fair. The inherent problem with the validation of rater-mediated assessments and rater quality management is that: (a) raters’ schemata vary in the use of evaluation cues and the cognitive processes by which the scoring is based (Wolfe, 1997); and (b) observed rater scores are more often associated with characteristics of the raters and less with the performances themselves (Engelhard, 2002). Conceptually, raters’ observed scores are generated within the boundaries of a unique lens to each rater, equally affected by both raters’ schema based upon unique cognitive and perceptual processes as well as the ecological environment (Brunswik, 1952).
This article seeks to investigate rater cognition in the context of music performance assessment by exploring rater types based upon differential severity and leniency associated with (a) raters’ use of rating scale items, (b) rating scale category functioning, and (c) dimensions of music performance assessment (e.g. tone/intonation, balance, interpretation, rhythm, technical accuracy). The purpose of this study was to empirically identify a typology of rater types based upon systematic differential severity indices in the context of large ensemble music performance assessment. This study was guided by the following research questions:
Do individual raters maintain invariant levels of severity when rating high school concert band performances?
How does the structure of the rating scale designed to evaluate high school concert band performances vary across raters?
Does differential severity emerge for individual raters across items when evaluating high school concert band performances?
Does a meaningful typology exist based upon raters’ differential severity indices when rating high school concert band performances?
Background
In the field of music, research concerning rater effects centers around methodologies that broadly represent a rater behavior-centered approach (Wolfe, 2004). These methodologies focus on the ecological content of human judgment and can be classified according to four distinct areas: (a) extra-musical effects related to the performer such as expressive variations (Repp, 1990, 1995), attractiveness and flair (Davidson & Coimbra, 2001; Wapnick, Darrow, Kovacs, & Dalrymple, 1997; Wapnick, Mazza, & Darrow, 1998), and body movement (Davidson, 1994, 2001; Davidson & Correia, 2002); (b) extra-musical effects related to the assessment context such as within-ensemble communication (Wesolowski, 2013; Williamon & Davidson, 2002), acoustics (Ando, 1988), social factors (Davidson, 1997), and audience support (Berliner, 1994; Monson, 1996); (c) rater-centered effects such as memory (Radocy, 1976), first impressions (Stanley, Brooker, & Gilbert, 2002; Vasil, 1973), mood (Schubert, 1996), repertoire familiarity (Flores & Ginsburgh, 1996), and musical preference (Rentfrow, Goldberg, & Levitin, 2011; Rentfrow et al., 2012; Rentfrow & McDonald, 2009); and (d) non-musical effects such as stereotyping (Elliott, 1995; Morrison, 1998), performance order (Bergee, 2006, 2007; Flores & Ginsburgh, 1996), evaluation time (Thompson, Williamon, & Valentine, 2007), facets of musical expression, (Juslin, 2003), teaching-level and primary instrument (Hewitt & Smith, 2004). (See McPherson & Schubert, 2004; McPherson & Thompson, 1998 for process models implementing these areas.)
More recent investigations into rater behavior in the context of music performance assessment take a different approach, using empirically driven investigations into statistical indices that underscore the measurement process. The purpose of these approaches is to explore rater effects and quality of ratings from a psychometric perspective. According to Eckes (2012), rater variability under these conditions can stem from: (a) the degree to which raters comply with the measurement instrument; (b) the way raters interpret criteria in operational scoring sessions; (c) the degree of leniency and severity exhibited; (d) raters’ understanding of the measurement instrument’s rating scale categories; and (e) the degree to which their ratings are consistent across examinees, scoring criteria, and performance tasks. The application of Rasch measurement models has been shown to be a fruitful method to serve as a foundation for these empirically driven approaches (Engelhard, 2013). In the context of music performance assessment, Rasch methodology has been used successfully to empirically explore rater behavior with specific attention to (a) rater effects (Wesolowski, Wind, & Engelhard, 2016b); (b) rating scale structure and precision (Wesolowski, Wind, & Engelhard, 2016a); (c) differential rater functioning (Wesolowski, Wind, & Engelhard, 2015); and (d) time parameters (Wesolowski, Wind, & Engelhard, in press). In this study, the systematic investigation into rater types was explored using indices stemming from rater effects, rating scale structure, and differential rater functioning. First, rater effects (e.g. rater severity) were explored in order to quantify severity indices for each rater. Second, rating scale structure for each rater was explored in order to quantify precision indices. Third, differential rater functioning for each rater by item was explored in order to quantify raters’ systematic differential severity indices in the use of each item. As a result, individual rater severity, indices of rating scale structure use, and indices of differential rater functioning were used as a foundation for identifying rater typologies. Full theoretical and technical explanations of the methodology and application for each rater index in the context of music performance assessment can be found in the above-cited papers.
Both rater behavior-centered approaches and empirically-driven approaches to investigating rater effects provide evidence of interesting cognitive phenomena affected by two judgmental predictors: (a) how well the cues within a measurement instrument function in relation to the raters’ precise use of rating scale categories; and (b) the ecological validity of the measurement tool (Hammond, 1996). Building on the work of Freedman and Calfee (1983) in the field of writing assessment, Wolfe (1997) used both predictors to introduce a model of rater cognition consisting of two broad components driven by top-down cognitive processes: a framework of scoring and a framework of writing.
Wolfe’s (1997) model is an information-processing model in the context of a psychometric setting. If this model is adapted to the context of music performance assessment, it can be surmised as having two components: framework of scoring and framework for audition. The framework of scoring can be described as raters’ mental processes where “an [auditory] image is created, compared to the scoring criteria, and used as the basis for generating a scoring decision” (p. 89). This framework includes three hierarchical cognitive processes: interpretation of the auditory stimulus, evaluation of the auditory stimulus, and justification of the scoring decision. First, interpretation of the auditory stimulus includes the cognitive processes where raters process a unique auditory image from the perceived auditory information. In this process, meaning is constructed through active listening. Second, evaluation of the auditory stimulus includes the cognitive process of mapping evaluative cues to the auditory information. The process of evaluation is where performance achievement levels are empirically defined based upon raters’ varying levels of importance placed on particular items and dimensions of music performance (e.g. tone/intonation, balance, interpretation, rhythm, technical accuracy). The items underscoring each dimension are used as prompts to elicit raters’ behavior stemming from cognitive processing. Third, justification of the scoring decision includes the self-monitoring and attention to raters’ performances as evaluators, and how raters self-regulate and adjust their behavior based upon instructions, training, and other related input regarding the assessment process.
The framework of audition is the raters’ mental schema of performance characteristics that represent varying levels of proficiency. A rater’s cognitive schemata can play an important role (or even interfere) with how well he/she adopts the structure and framework of the measurement instrument due to rater behavior-centered effects and ecological context. According to Stanley et al. (2002):
Initially, they [raters] adopt a “holistic” approach, relying on a “gut reaction”, an “intuitive or emotional response which is basically one of enjoyment: Am I enjoying this playing?” This early process of global assessment frequently involves respondents arriving at a tentative grade. As one examiner noted: “I look at them and I say ‘Distinction, high credit’. I have bands in my own mind and then the number is immaterial – to me the number is way more negotiable than the actual range.” (p. 51)
According to Wolfe (1997), raters’ mental representations within his framework for writing are all unique “because of differences in scoring experience, values, education, and familiarity with the scoring rubric” (pp. 89–90). Similarly in music, the uniqueness of listeners’ mental representations of auditory stimuli have been demonstrated in terms of neurophysiological processes (Downar, Crawley, Mikulis, & Davis, 2001; Näätänen & Winkler, 1999), cognitive/perceptual processes (Gabrielsson & Lindstrom, 2001; Palmer, 1989; Persson, Pratt, & Robson, 1992; Serafine, Glassman, & Overbeeke, 1989; Sloboda, 1983), and psychometric processes (Wesolowski et al., 2015, 2016a, 2016b, in press). In both the context of writing assessment and music performance assessment, the raters’ representation is not directly observable, and therefore can only be inferred from raters’ behavior via the use of the measurement apparatus. As a result, careful attention to how raters engage specifically with each item in a measurement instrument and/or dimensions on a measurement instrument (e.g. tone/intonation, balance, interpretation, rhythm, technical accuracy) may provide valuable insight into raters’ mental representations of the auditory stimuli being evaluated.
Both frameworks interact to result in unique rater variability influenced by individual rater schemata. Therefore, origins of the variability need to be carefully considered in making decisions and inferences based upon raters’ observed data. Under hermeneutic scoring conditions, variability due to rater schemata can provide a desired variety of insightful diagnostic, formative, and summative information for the performers toward their improvement. On the other hand, under psychometric scoring conditions, it can provide conflicting perspectives of a working operational definition of performance achievement within the assessment system. Music research traditionally focuses on face value empirical interpretations of raters’ consistency, consensus, accuracy, and precision to account for variability (Wesolowski et al., 2016a). The empirical results, however, are driven by the interaction between raters’ schemata and the measurement instrument. An understanding of the effects of rater schemata on scoring variability can provide better explanation for the empirical results and improve the overall evaluation process.
This study seeks to explore Wolfe’s (1997) model in the context of music performance assessment. The application of the Many Facet Rasch Partial Credit (MFR-PC) measurement model was used to provide an empirical evidence of a framework of scoring. A combination of hierarchical and non-hierarchical clustering techniques was used to explore and define classes of rater schemata through a framework of audition.
Method
Apparatus
The measurement instrument used in this study was a 30-item rating scale to assess high school concert band performance (DCamp, 1980; see Figure 1). The items were developed and validated using a factor analytic approach to scale construction. The factor analysis yielded a five-factor solution: (a) tone/intonation (n = 6); (b) balance (n = 6); (c) interpretation (n = 6); (d) rhythm (n = 6); and (e) technical accuracy (n = 6). The original response alternatives in DCamp’s scale included a 5-point Likert scale structure: Strongly Agree, Agree, Not Applicable, Disagree, Strongly Disagree. In this study, the response alternatives included a 4-point structure: Strongly Agree, Agree, Disagree, and Strongly Disagree. A 4-point scale was specifically chosen in order to eliminate a neutral category. The elimination of a neutral category provides a better measure of the intensity of participants’ attitudes and opinions (Wright, 1977) and maintains a positive step ordering of rating scale categories (Linacre, 2002a).
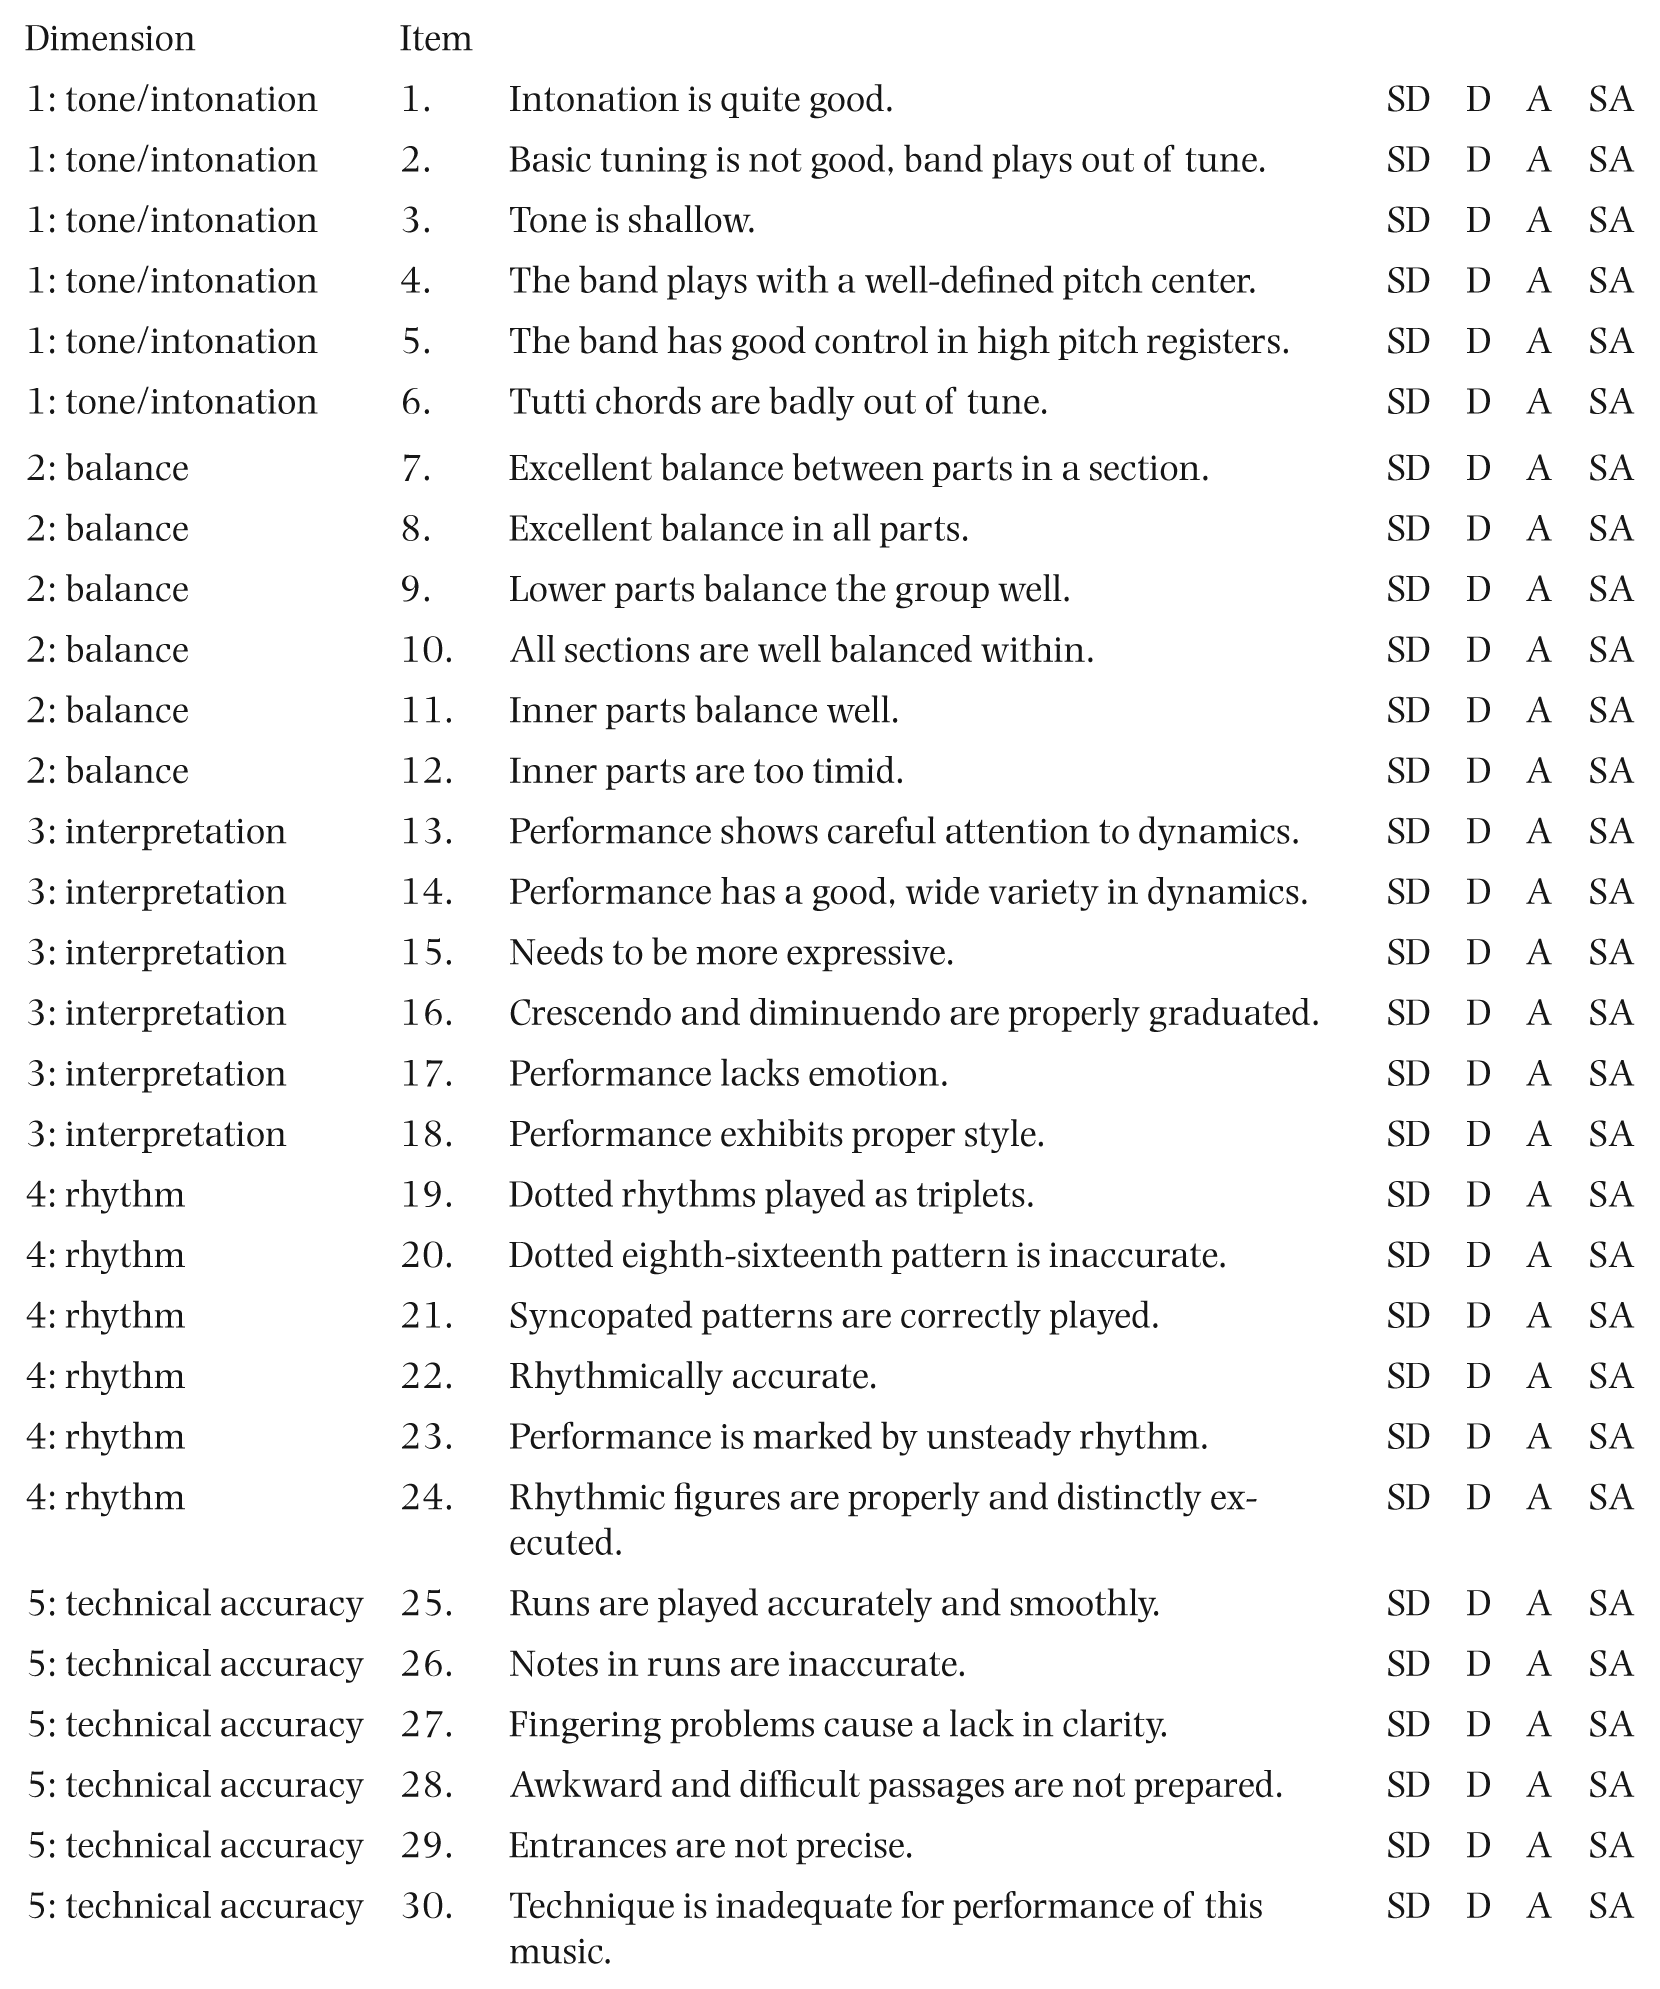
Thirty-item rating scale and associated factor dimensions for the evaluation of high school concert band performance (DCamp, 1980).
Rater assessment structure
For this study, an a priori incomplete assessment structure was developed as suggested by Linacre and Wright (2004) and Wright and Stone (1979). The incomplete assessment network can be described specifically where each consecutive rater overlapped with the previous rater in evaluating the same two musical performances. As an example, Rater 1 evaluated performances 1, 2, 3, 4; Rater 2 evaluated performances 3, 4, 5, 6; Rater 3 evaluated performances 5, 6, 7, 8; etc.). The last rater (i.e. Rater 67) also evaluated performances 1 and 2, thereby linking to Rater 1 and creating a connection between all other raters in the model. This connectivity allowed for independent calibrations of all musical stimuli, rating scale items, and raters to be compared unambiguously. As raters accepted participation in the study, they were consecutively assigned to a rater number so as not to break the connectivity of the rater network.
Participants
A total of 67 (n = 36, male; n = 31, female) raters were solicited for the study on a voluntary basis. At the time of the study, each of the raters was an in-service secondary school-level (n = 41, high school, n = 26, middle school) concert band instructor with an average of 12.42 years (SD = 4.65) of school teaching experience. Each rater’s specialized instruction area was instrumental music education. Each rater was asked to evaluate four full high school concert band musical performances. Anonymity was kept with all the participants in the study.
Stimuli
A total of 53 performances were rated, each randomly inserted into the assessment network using an electronic random generator. Audio recordings were gleaned from a pool of district and state large group music performance assessment performances in the United States. Acceptability of audio stimuli quality was previously rated and verified by a cohort of music content experts using the audio component of the International Telecommunication Union’s ITU-T Rating Scale (ITU, 2004).
Evaluation process
In order to provide a baseline of rater schema and to not influence interpretation, evaluation, or justification processes, raters were not trained nor were they provided anchor recordings. Raters were told that all musical examples were high school concert band performances, and asked to rate the performances to the best of their ability based upon their interpretation of the items, scoring criteria, and personal expectations of what constitutes a proficient high school concert band. Raters were asked to listen to the recordings using headphones at their desktop or laptop computer. They were allowed to listen to the recordings as many times as necessary in order to formulate a holistic auditory image of the performance being evaluated. The musical examples were distributed electronically and responses were collected via a web-based response collection service over a time span of two weeks. After responses were collected, responses stemming from negatively worded items were reverse coded.
Measurement model
The Many Facet Rasch Partial Credit (MFR-PC) measurement model was used to guide the measurement process of this study (Linacre, 1989; Masters, 1982). The benefit of using Rasch methodology is the five requirements of invariant measurement underscoring the analyses (Engelhard, 2013). When using observed data derived from rater-mediated assessment processes, the following five requirements are necessary for invariant measurement: (a) rater-invariant measurement of persons (i.e. the measurement of performances must be independent of the particular raters that happen to be used for the measuring); (b) non-crossing person response functions (i.e. a higher achieving ensemble must always have a better chance of obtaining higher ratings from raters than a lower achieving ensemble); (c) person-invariant calibration of raters (i.e. the calibration of the raters must be independent of the particular ensembles used for calibration); (d) non-crossing rater response functions (i.e. any ensemble must have a better chance of obtaining a higher rating from lenient raters than from more severe raters); and (e) variable map (i.e. ensembles and raters must be simultaneously located on a single underlying latent variable). When adequate fit to the model is observed, rater-invariant measurement is achieved.
The MFR-PC model is specified as follows:

where
ln[Pnijk/Pnijk-1] = the probability that Performance n rated by Rater i on Item j in level m receives a rating in category k rather than category k-1,
The benefit of using the partial credit variation of the measurement model is to allow the rating scale categories to freely vary by each rater (Masters, 1982). This additional parameter allows for the investigation of rater differences in logit locations within the rating scale structure of each item. This provides a more precise estimate of ensemble true scores and better fit of the model to the data. The partial credit version of the measurement model was used because previous research in music performance assessment has verified that each rater demonstrates a unique rating scale structure for each item, resulting in an effect on overall ratings (Wesolowski et al., 2016a). Therefore, investigation into rating scale structure is warranted in this study.
Results
Summary statistics for the MFR-PC model
Table 1 provides the summary statistics for the MFR-PC model analysis of musical performances (n = 53), raters (n = 67), and items (n = 29). The analysis indicated an overall good model data fit with significant differences between performances
Summary statistics from the PC-MFR model.
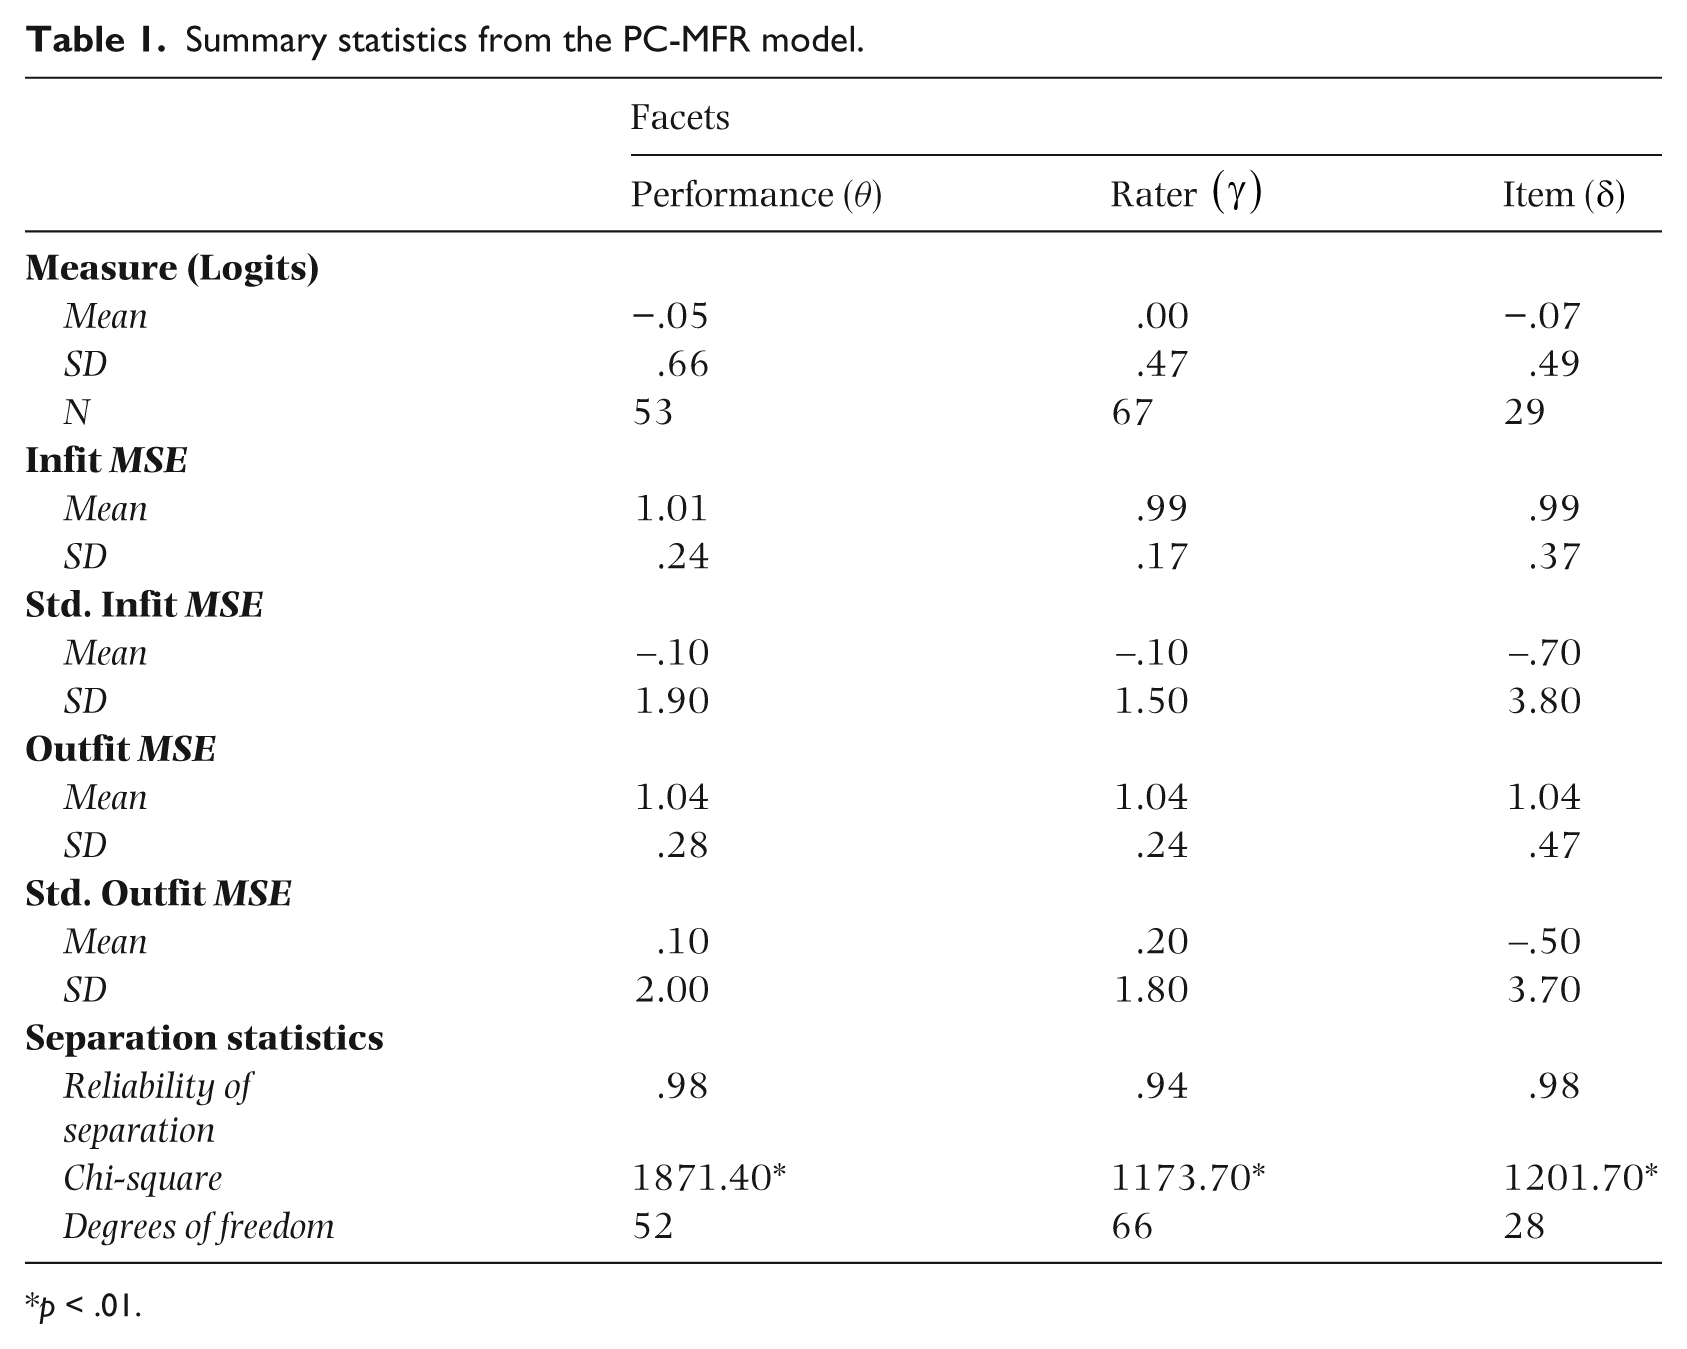
p < .01.
Variable map
The variable map is a visual representation of the hierarchical orderings of elements for each of the facets on the same log odds linear scale included in the measurement model (see Appendix A in Supplementary Materials online). Conceptually, the variable map is a visual representation of the operational definition of the latent construct. In this case, the latent construct can be described as high school concert band performance. The variable map includes facets for rater severity, item difficulty (i.e. rater endorsability of the items), and ensemble performance achievement. The variable map and following facet calibrations were estimated using Facets (Linacre, 2014). 1
Research question 1
Calibration of rater facet
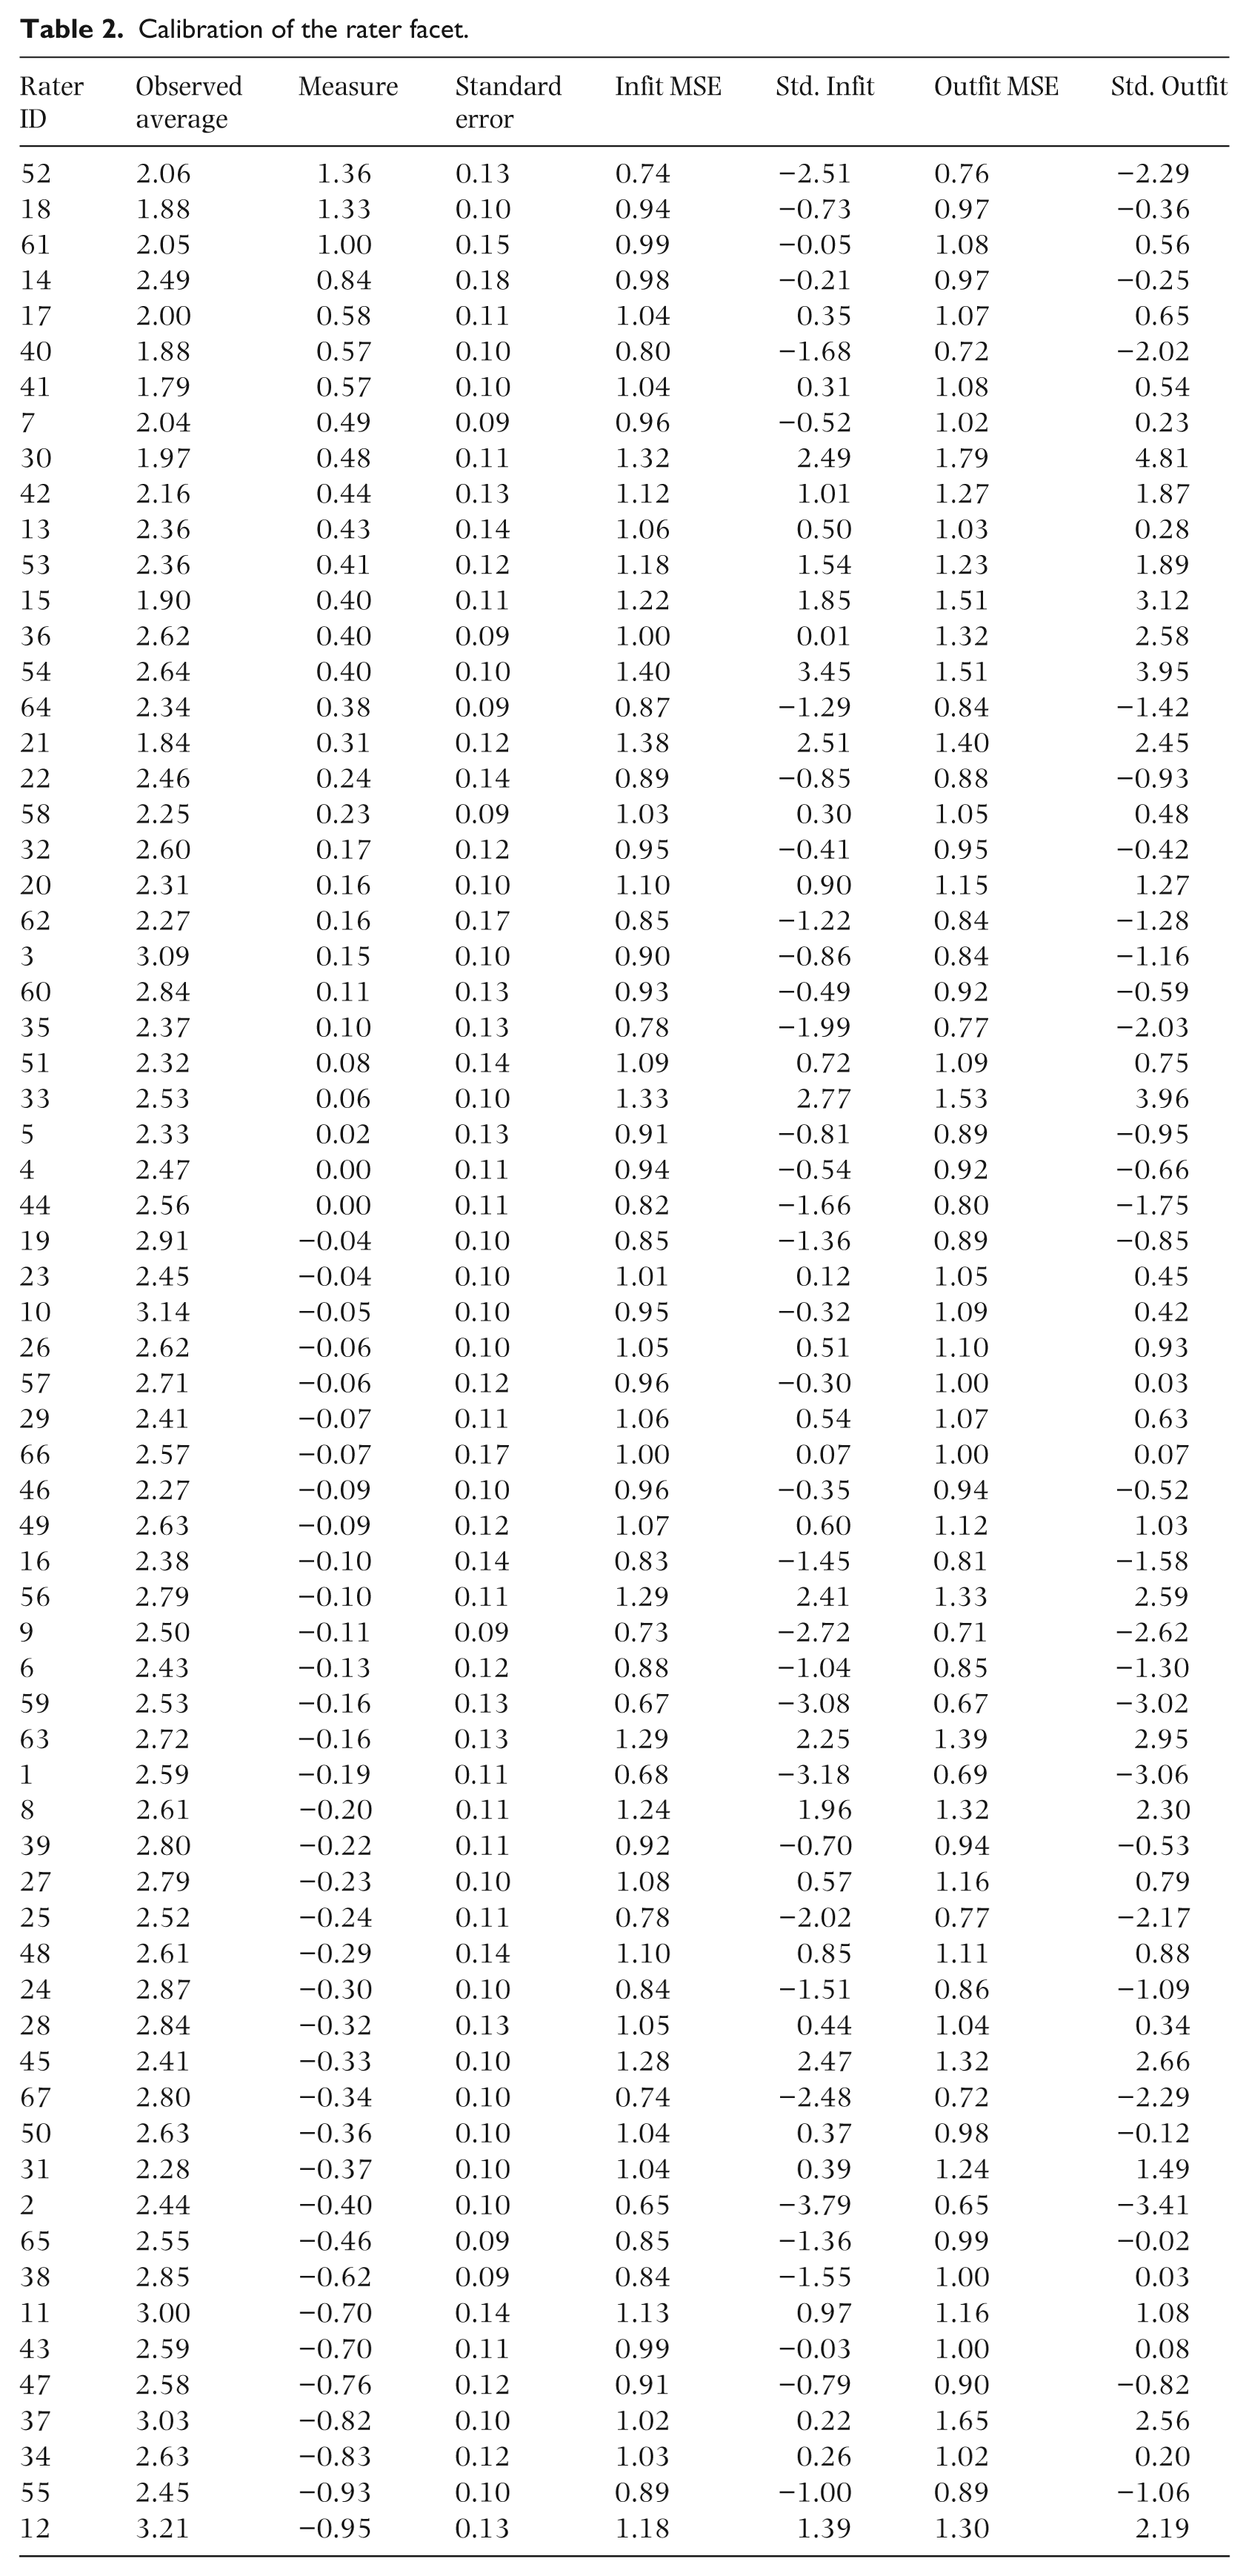
Table 2 provides rater calibration information. The rater facet was centered on the logit scale (mean of 0.00 logits) in order to provide a frame of reference for the interpretation of the item locations. As a result, the mean of the raters was 0.00 logits with a range of 1.36 for the most severe rater (Rater 52) to −1.87 for the most lenient rater (Rater 27). Expected values for facet-level mean square fit statistics are to center around 1.00. As indicated by Wright and Linacre’s (1994) threshold for acceptable rater fit under the conditions of rating scale surveys (.60–1.40), none of the raters demonstrated any overly sporadic or muted behaviors.
Calibration of the rater facet.
Research question 2
The additional parameter from the partial credit formulation of the MFR model allows for the investigation of the rating scale structure for each rater’s use according to each item. By reviewing these structures as well as frequency data, average observed and expected measures, and outfit MSE as provided in Table 3, one can evaluate specific rater behaviors and infer overall rater quality with valid, reliable, and linear empirical evidence. Table 3 provides the diagnosis of category structure by rater. The results do not support the hypothesis that the rating scale structure remains invariant across raters varying rating scale category thresholds. Specifically, Table 4 provides the Rasch-Andrich category threshold logit measures in relation to each rater’s cluster assignment.
Category structure diagnostics: Rater behavior of category usage, average observed and expected logit measures, and outfit MSE.
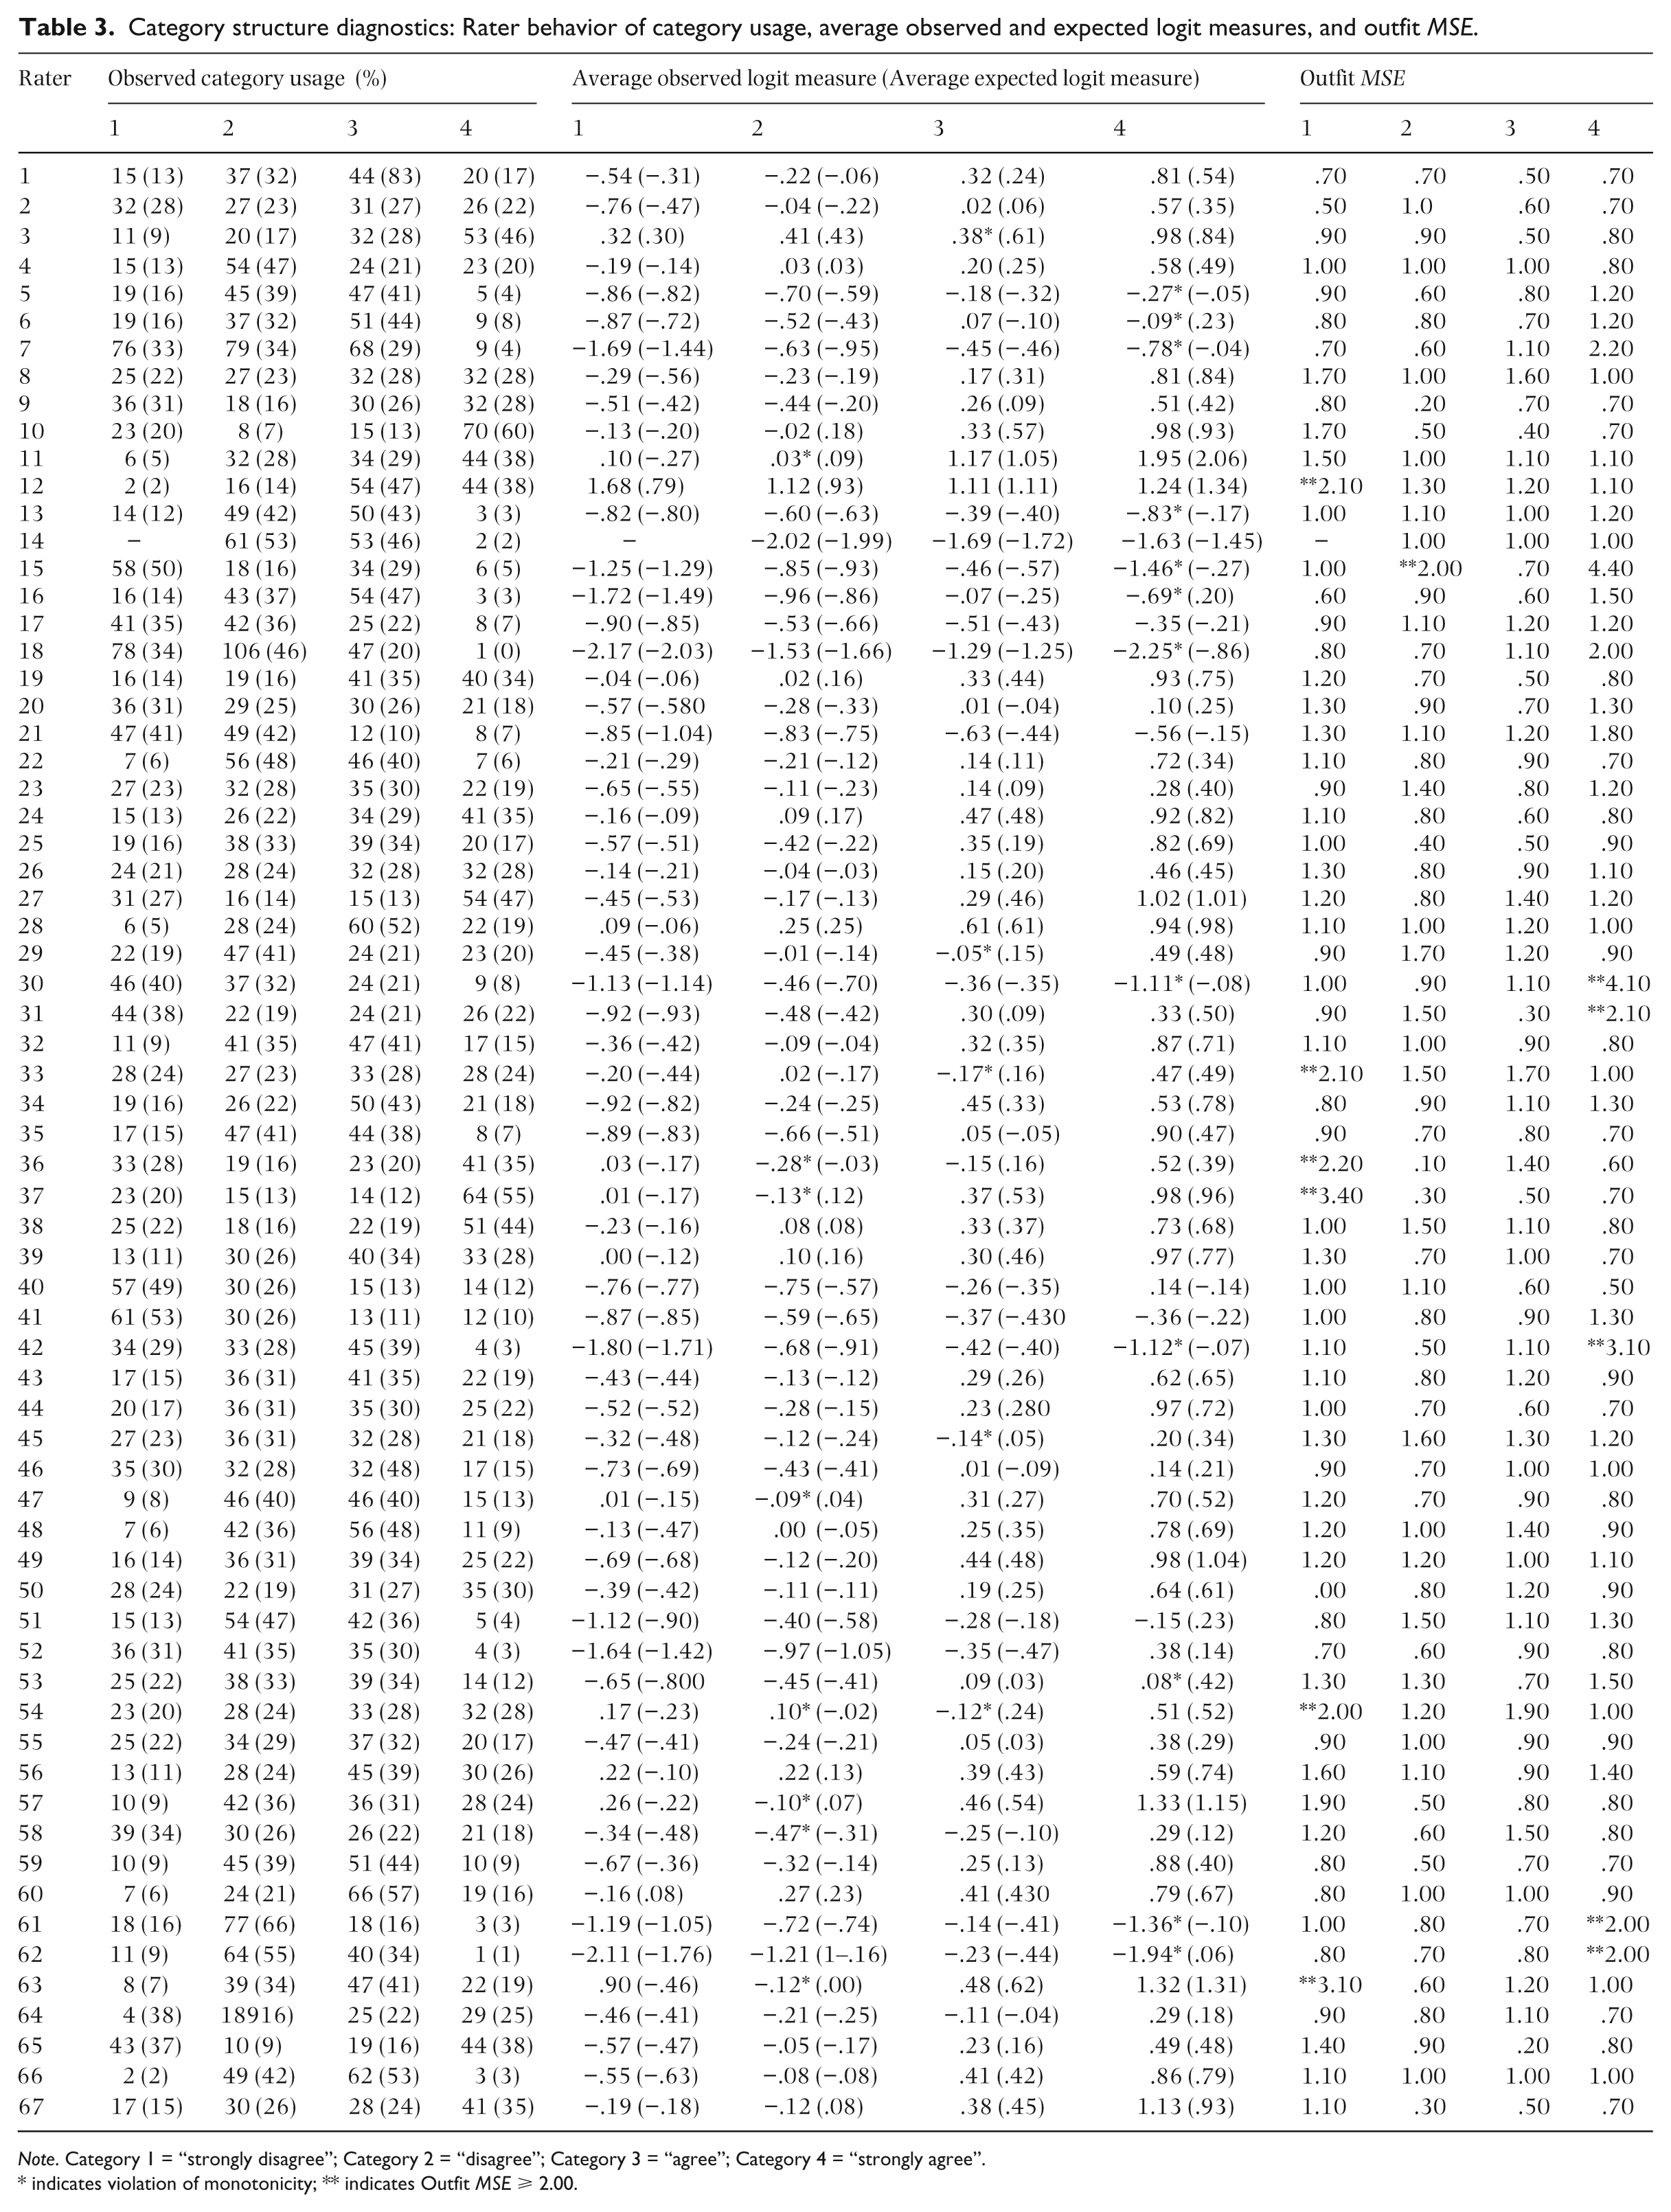
Note. Category 1 = “strongly disagree”; Category 2 = “disagree”; Category 3 = “agree”; Category 4 = “strongly agree”.
indicates violation of monotonicity; ** indicates Outfit MSE ⩾ 2.00.
Rasch-Andrich category thresholds, cluster membership, and squared Euclidian distance measures by rater.
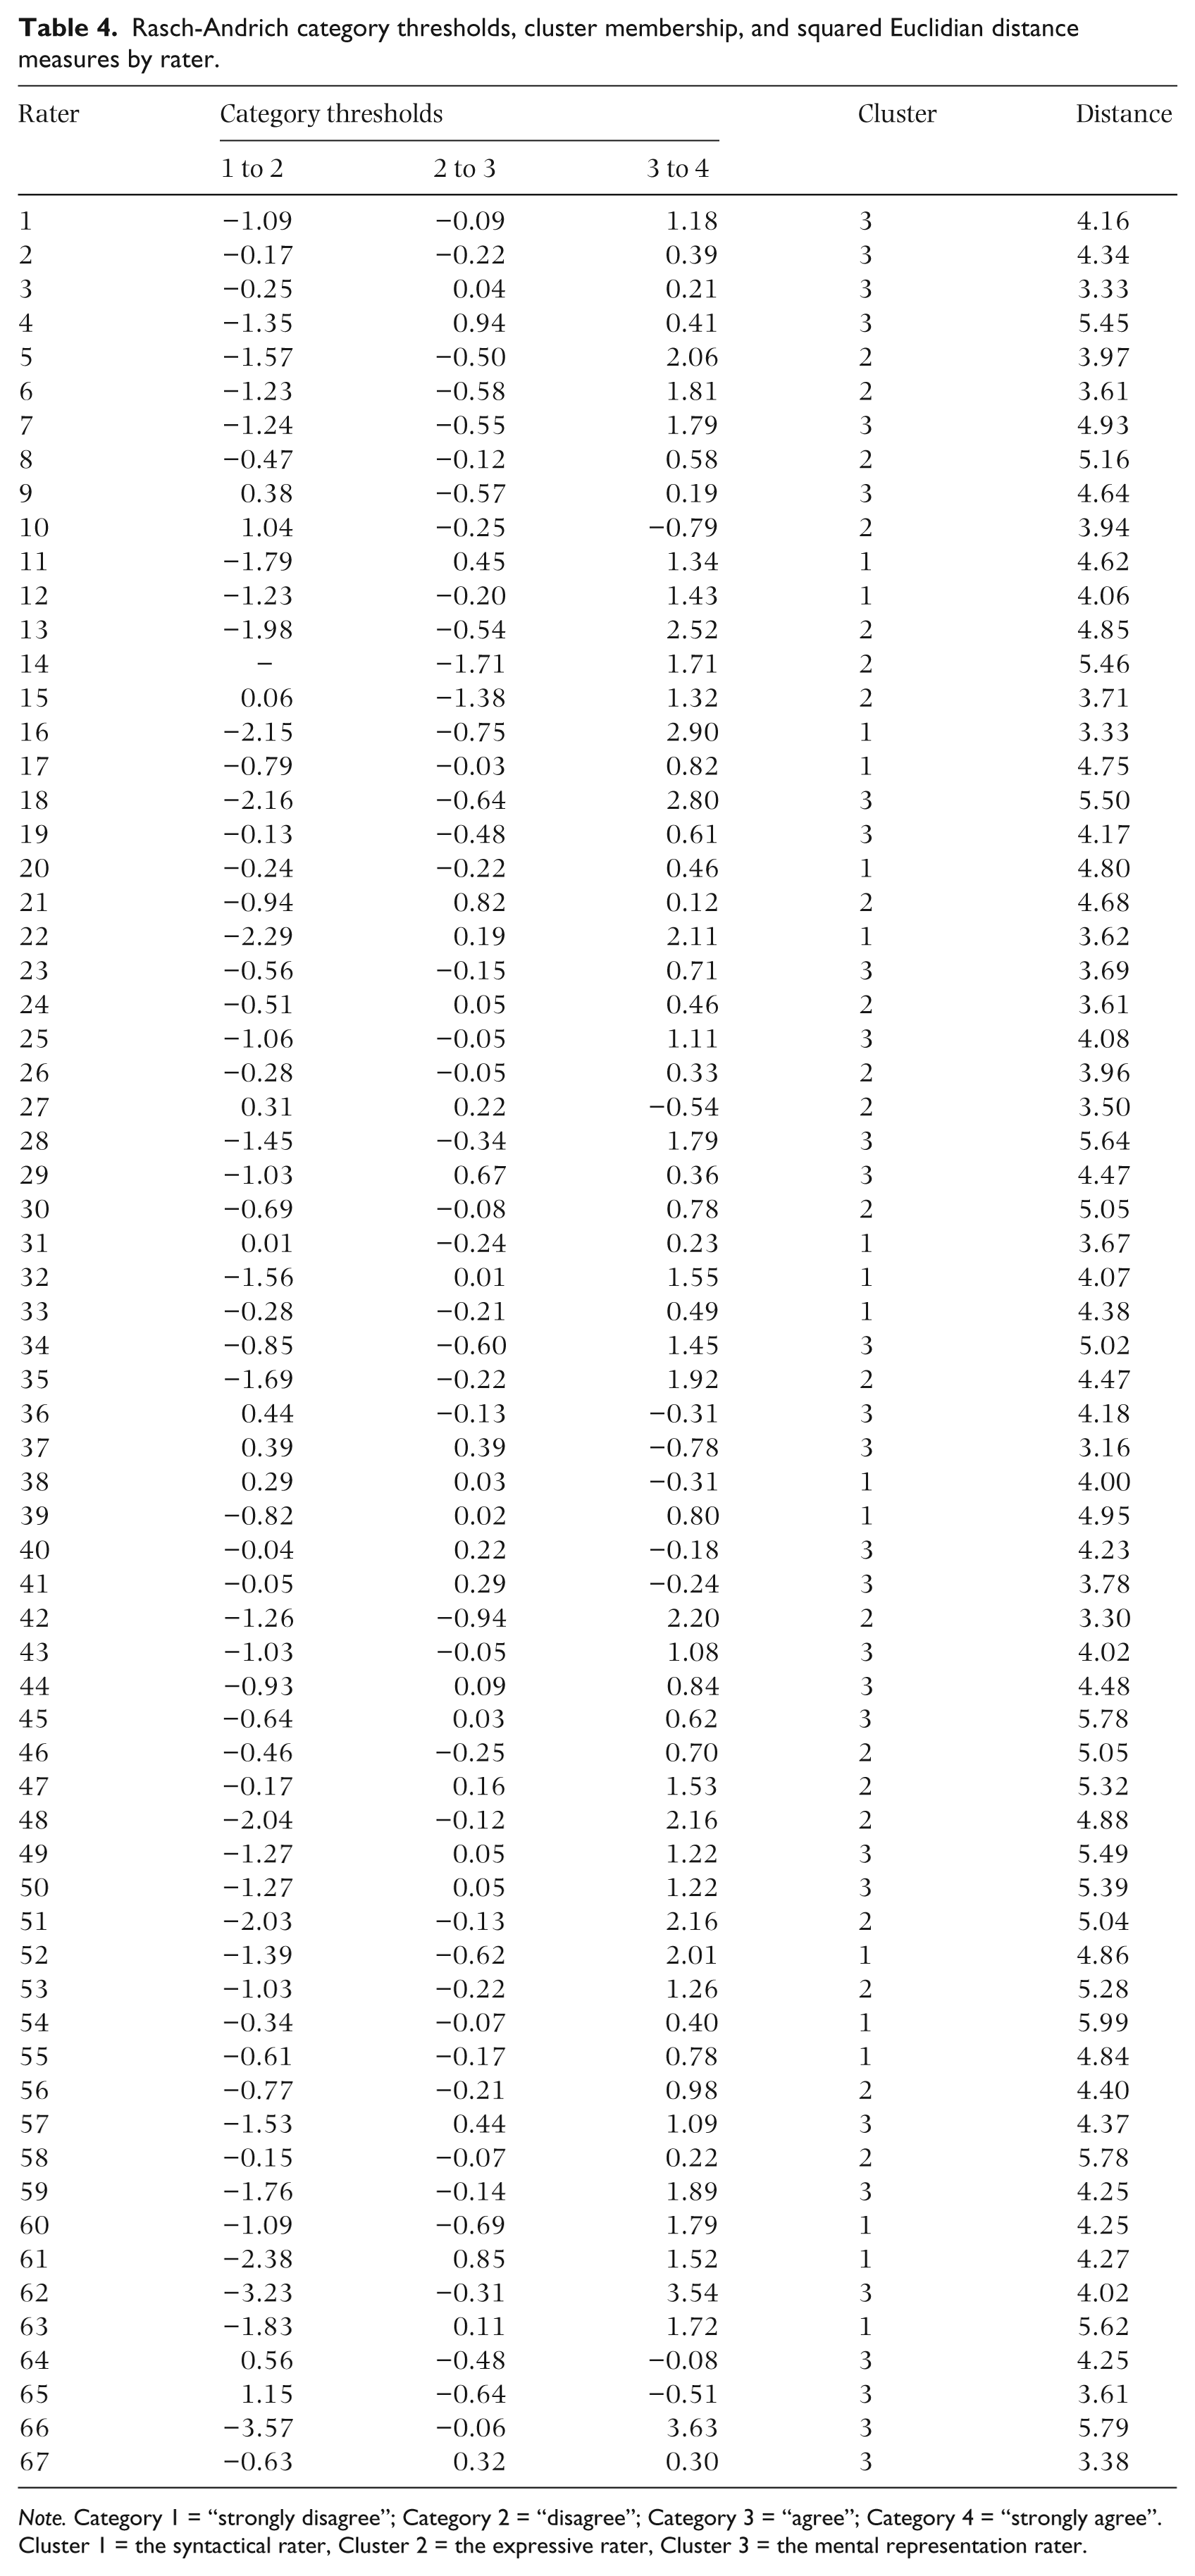
Note. Category 1 = “strongly disagree”; Category 2 = “disagree”; Category 3 = “agree”; Category 4 = “strongly agree”. Cluster 1 = the syntactical rater, Cluster 2 = the expressive rater, Cluster 3 = the mental representation rater.
There are two important diagnostic points to discuss in evaluating the category diagnostics particular to this study (Linacre, 2002a). First, the single asterisk in Table 3 indicates violations of monotonicity. In these instances, person locations on the latent variable do not always increase with the rating scale categories. This illustrates a clear indication of raters’ inaccurate use of specific rating scale categories on specific items. Second, the double asterisk indicates seven instances where Outfit MSE values are equal to or exceed 2.0 (e.g. Rater 12, category 1; Rater 15, category 2; Rater 33, category 1; Rater 36, category 1; Rater 37, category 1; Rater 54, category 1; and Rater 63, category 1). These cases indicate that there is substantive unpredictability in the ratings, ultimately producing an insufficient balance between redundancy and unpredictability based upon the expectations of the model.
Research question 3
Differential rater functioning: Bias interaction analysis
Bias interaction analysis is a secondary analysis that seeks to empirically define systematic leniency/severity in rater behavior. The benefit of using bias measures as a means to individually define systematic differences in rater behavior is that similar to each parameter in the model being statistically separable, so too are bias measures. Each bias measure resulting from rater by item interaction is freed from within group distribution resulting in estimates that are conditionally independent. This allows for independent and consistent estimates of differential rater functioning for each rater’s response to an item. Substantively, bias measures provide empirical evidence for two important questions related to rater behavior: (a) are the ratings of each rater invariant over construct irrelevant components? and (b) are the raters invariant over construct irrelevant components for the overall assessment system? (Engelhard, 2013, p. 212).
The interaction term between raters and items (

where
The interaction parameter tests the null hypothesis that the overall set of rater and item interactions is not significantly different from zero. Evidence of the significance of this omnibus test is a chi square statistic. Each interaction term is reflected as a t-statistic that represents the size of each pairwise comparison. The t-statistic can be conceptualized as a type of effect size, indicating usefulness of the data according to the model (Linacre, 2003). Bias measures above 0.00 indicate observed scores above what was expected by the model. Bias measures below 0.00 indicate observed scores below what was expected by the model. The t-statistic for each individual rater by item was used to define the rater clusters.
A differential rater functioning (rater by item) bias interaction analysis was conducted using Facets (Linacre, 2014). The analysis indicated an overall statistically significant differential measure (χ2(1943) = 2322.20, p < .01), explaining 24.83% of the variance within the measurable responses. A total of 1943 interactions were extrapolated. 2
Research question 4
Cluster analyses
A hierarchical cluster analysis was conducted in order to meaningfully group raters by degree of association based upon differential leniency/severity measures. A hierarchical cluster analysis was used first as an exploratory tool to find the most meaningfully significant cluster solution possible. Appendix B in Supplementary Materials online presents the aggregate of raters represented by a hierarchical dendrogram. The dendrogram represents an agglomerative procedure, where each rater represents its own cluster. In order to partition the raters, Ward’s linkage agglomerative clustering method was used. Ward’s method was specifically used in order to determine the degree of acceptability in which clusters are linked together by maximizing intra-class similarity and minimizing inter-class similarity. Additionally, it is regarded as the most efficient linkage procedure through the minimization of within-cluster sums of squares over all partitions available (Ward, 1963). Squared Euclidian distances were selected as a method for computing the proximity between raters. The advantage of using this method is that other outlier objects do not affect distances between two objects. Additionally, it places progressively greater weights on raters further apart (Romesburg, 1984).
In order to target an appropriate number of clusters, Mardia, Kent, and Bobby’s (1979) “rule of thumb” was considered where the number of clusters (k) is approximately equal to the square root of n divided by k. Additionally, Thorndike’s (1953) elbow method was considered. Cluster solutions ranging from 2–8 were examined for frequency and the discernable and reasonable nature of substantive trends. Based upon the best meaningfully substantive interpretation, a three-cluster solution was elected.
A post hoc non-hierarchical K-means clustering was used to generate a three-cluster solution with the greatest possible case distinction. A K-means clustering technique was used in order to iteratively estimate cluster means based upon smallest distance to the cluster mean. Cluster centers (i.e. seeds) generated from the hierarchical clustering were used to pre-specify threshold distances. Table 5 provides centroid values for each cluster by item. Interpreting 0 as the mean/median for the values of each cluster dimensions provides an anchor for interpretation of the centroid values. Centroid values below 0 can be interpreted as having less value than other clusters. Conversely, centroid values above 0 can be interpreted as having more value than other clusters. As seen in Table 6, F values and significance levels for each item indicate how well the items discriminate the three clusters. The larger the observed significance, the less the variable contributes to the separation of the clusters.
Cluster centroids by item.

Note. Construct dimensions separated via shaded areas. Dimension 1 = tone/intonation; Dimension 2 = balance; Dimension 3 = interpretation; Dimension 4 = rhythm; Dimension 5 = technical accuracy.
Analysis of Variance table.
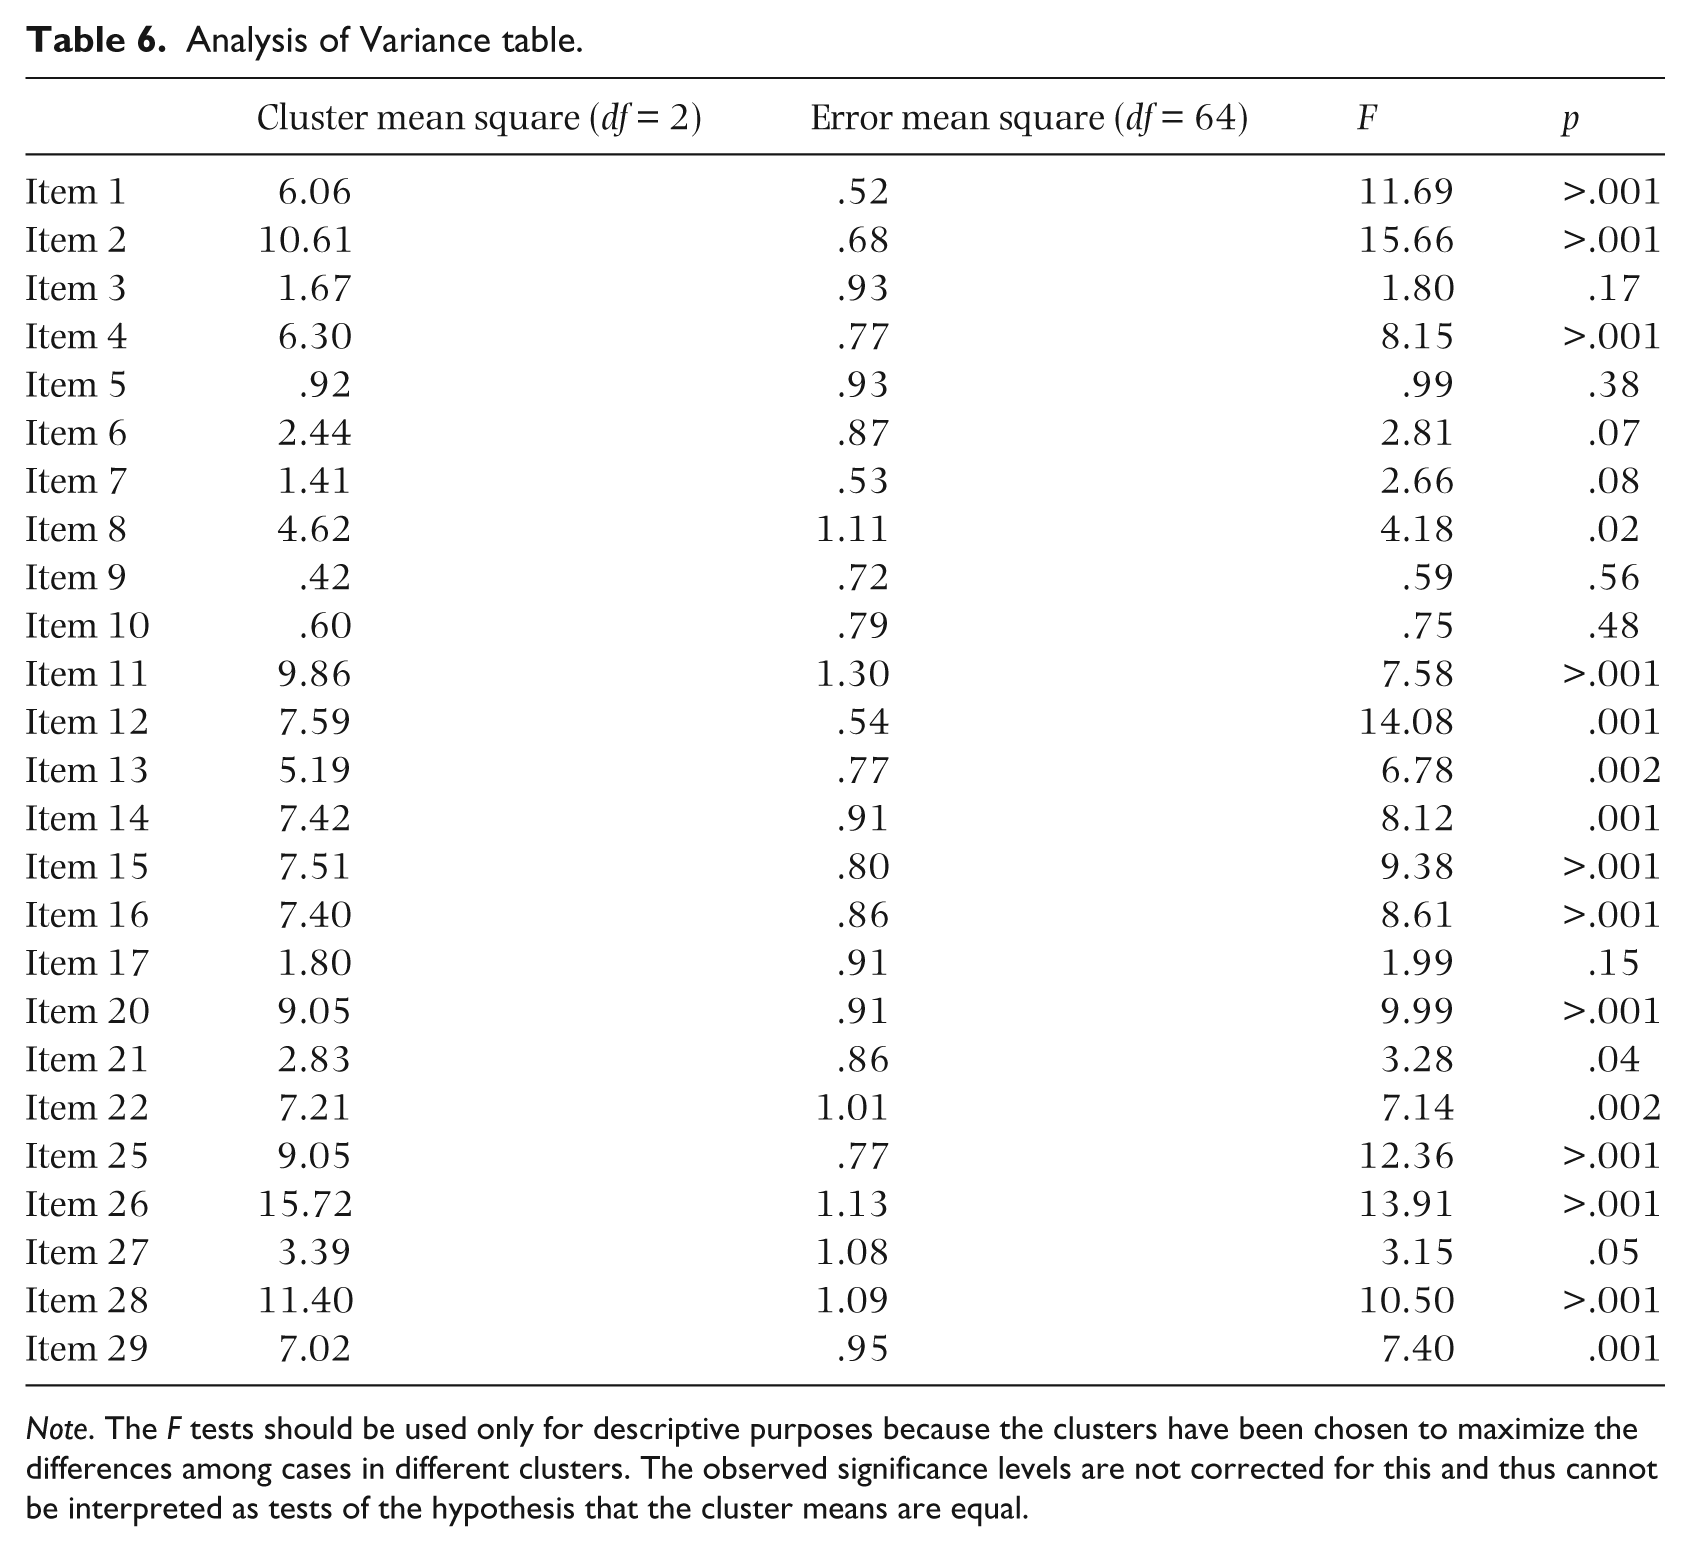
Note. The F tests should be used only for descriptive purposes because the clusters have been chosen to maximize the differences among cases in different clusters. The observed significance levels are not corrected for this and thus cannot be interpreted as tests of the hypothesis that the cluster means are equal.
Cluster labels
The results of the cluster analyses indicated a three-cluster solution. Cluster 1 (C1) can be labeled as Syntactical rater-type (N = 17, 25.40%). Based upon use of the rating scale, the syntactical rater seems to be more interested in the technical execution and accuracy of the notes, rhythms, balance, and sonority of the musical performance. It seems as though this rater reacts to when the syntax of the musical piece is executed improperly or not heard. In these instances, the limitations of the ensemble’s execution may limit the rater from assembling the syntax into meaningful, logical structures. The salient dimension-level characteristics for C1 include: (a) tone/intonation of much importance; (b) balance is of importance (compared to Cluster 3); (c) interpretation is of importance (compared to Cluster 3); and (d) technical accuracy of importance. The salient item-level characteristics for C1 include: (a) excellent balance between parts in a section (Item 7) is of importance; (b) rhythmically accurate (item 22) is of importance; and (c) entrances are not precise (item 29) is of much importance.
Cluster 2 (C2) can be labeled as Expressive rater-type (N = 21, 31.30%). Based upon use of the rating scale, the expressive rater seems to be more interested in the items that reflect the eliciting of modulations in the auditory cues related to expression. These include items pertaining to modulations in dynamics, intonation, and timbre. Additionally, this rater reacts to items that specifically use the terms “expression” and “emotion.” The salient dimension-level characteristics for C2 include: (a) tone/intonation is of importance; (b) rhythm is of less importance; and (c) interpretation is of more importance. The salient item-level characteristics for C2 include: (a) inner parts are too timid (item 12) is of much importance; and (b) runs played accurately and smoothly (item 25) is of less importance.
Cluster 3 (C3) can be labeled as Mental representation rater-type (N = 29, 43.30%). Based upon use of the rating scale, the mental representation rater seems to rely on and engage within internal, musical imagery more so than the actual external sounds of the performance itself. This rater reacts less to items reflecting balance, intonation, interpretation, and sonority. The salient dimension-level characteristics for C3 include: (a) intonation is of more importance; (b) tone is of less importance; (c) balance of less importance; (d) interpretation of less importance; and (e) technical accuracy is of somewhat importance. The salient item-level characteristics for C3 include: (a) tone is shallow (item 3) is of less importance; and (b) the band has good control in high pitch registers (item 5) is of less importance.
Cluster interpretations
A straightforward method to interpret the cluster behaviors is to consider at face value the various emphases outlined above as simple artifacts of raters’ self-directing of the auditory spotlight: (a) raters in C2 consider interpretation of more importance than raters in C1 and C3; (b) raters in C3 place more of an emphasis on balance than C1; (c) raters in C1 and C3 value intonation more than C2, etc. However, a more broad speculation of raters’ cognition and perception based upon musical structure and expectancy may shed some light on the various similarities and differences outlined above. Of course, the following is speculative and warrants further investigation through experimental manipulations of testing conditions, audio stimuli, and rater training/interventions.
As indicated in Namour’s (1990) Implication-Realization (I-R) model, expectancy in music listening is driven by both bottom-up and top-down cognitive processes, where both processes interact, yet work separately. Bottom-up processes refer to the direct impact of sensory information input from the musical stimulus. Focus of these processes is on the innate, human cognitive and perceptual mechanisms. Top-down processes refer to perception driven by cognition, where the brain fills in the gaps of what is expected. Human perception of music is constrained by the processes of the auditory system, and is therefore influenced by how the system encodes and retains acoustic information (McDermott & Oxenham, 2008).
It can be hypothesized that C1 demonstrates cognitive constraint on the processing of pitch and timbre perception, which plays a significant role in the cognitive processing of tonal structure. C1 raters seem to be working from a top-down cognitive approach, where the auditory stimuli need to be clear and emphasized in the musical performances in order to perceive a tonal structure. Eliciting structure from multisensory cues in music is a contextually-driven, top-down sensory process requiring a system of complex auditory abilities to extract, organize, and interpret acoustic information (Baldwin, 2012). In particular, pitch and timbre (i.e. tone color) perception is based upon steady-state cues. Human perceptions of these steady-state cues are multidimensional, as they are affected by interactions between frequency regions and harmonic resonance (Ladefoged & Broadbent, 1957). Timbre discrimination becomes more difficult and confusing for the listener with the elimination of onset transients (Elliott, 1975; Saldanha & Corso, 1964). Interestingly, in the case of C1, raters placed a strong emphasis on item 29 (Entrances are not precise). Additionally, timbre consistency plays an important role in timbre perception. Iverson and Krumhansl (1993) found that timbres of different instruments (e.g. bassoon and French horn) are easily confused by performances of the same pitch in different registers. Notably, C1 demonstrates more emphasis on item 5 (The band plays with good pitch control in high registers). Additionally, related to pitch perception is the factor of contour, where patterns of relationships act as a facilitator of short musical memory (Dowling & Bartlett, 1981; Dowling & Fujitani, 1971). Evidence of this can be seen in C1’s emphasis on the need to hear clear syntax of item 25 (Runs are played accurately and smoothly).
In contrast to C1, C3 places less overall emphasis on dimension 2: balance. It can be hypothesized that C3 is working more from a bottom-up cognitive approach that relies on auditory imagery and expectancy in order to “fill in the structural gaps” of what C1 was missing in the musical performances. This aligns with Meyer’s (1956) view on embodied musical meaning, where the aesthetic power of the music comes from expectations of the listener. Similar to C1, the dimensions of intonation and technical accuracy are important in the performance. However, there is a drastic shift in the emphasis placed on balance dimension (i.e. items 7–12). C3 raters seem to be more reliant on the unique auditory images from perceived auditory information and distracted less than C1 on the dimensions of tone, intonation, balance, and interpretation.
C2 demonstrated drastically different characteristics than C1 and C3. Raters in C2 demonstrated a strong emphasis toward items under the interpretation dimension (e.g. items 13–17). Notably large indices were related to items reflecting musical expression and the modulations of expressive cues such as dynamics. It can be hypothesized that C2 raters, similar to C3 raters, have a strong reliance on auditory images, as little emphasis was placed on the dimensions of tone/intonation, balance, rhythm, and technical accuracy. In considering Frijda’s (1988) Law of Comparative Feeling, the raters may be using their schemata as a frame of reference for the listening experience, comparing what they are hearing to past performances or similar qualities of past musical performances that moved them emotionally. The muted indices in the other dimensions may rule out the need for raters wanting increased modulations of auditory behavioral cues such as timing deviations, intensity, intonation, articulation, and timbre as a method to increase arousal.
A limitation of this study is the initial labeling of the clusters themselves. The use of qualitative labels to identify groups of raters in the context of this study is an initial step in identifying types of raters. As noted in the introduction to this article, the investigation falls under the category of an empirically driven investigation into statistical indices that underscore the measurement process. Clear empirical evidence exists of how statistical differences in raters exist based upon raters’ differential severity of items, use of rating scale structure, and interpretation of dimensions in music performance; however, the true perceptual differences in mental representations of the raters compared to the empirical results of the raters’ rating scale behavior remains unclear. At this time, the labeling system should only be interpreted as an initial qualitative identifier to distinguish between clusters of raters demonstrating significant differences in rating processes.
Of course, psychological explanations for these occurrences are at best speculative and could certainly be limited by sample dependency. A retest of a different sample representing the same population may provide additional insight into the formulation of these clusters. Additionally, this methodology applied to samples representing different populations may provide additional insight into the listening and evaluation experiences.
Conclusion and implications
The purpose of this study was to identify a typology of rater types based upon systematic differential severity indices in the context of large ensemble music performance assessment. The first research question asked if individual raters maintain invariant levels of severity when rating high school concert band performances. Fit statistics from the MFR-PC model indicated that all raters demonstrated adequate fit to the model in the context of rating scale survey data. The second research question asked how rating scale structure varied across raters. Use of the partial credit formulation of the model allowed the rating scale structure to vary freely by rater. The results did not support the hypothesis that the rating scale structure remains invariant across raters varying rating scale category thresholds as evidenced by unique category thresholds for each rater. Additionally, some outfit MSE statistics brought to light violations of stochasticity and the comparison of observed versus expected logit measures indicated some violations of monotonicity. The third research question asked if differential severity emerges for individual raters according across items. The results indicated statistical indices unique to each rater by item that were found to be both above and below what was expected by the measurement model. The fourth research question asked if a meaningful typology existed based upon raters’ differential severity. Results indicated a three-cluster solution demonstrating a distinct pattern of differential rater functioning based upon dimensions of music performance and related items. The rater types were labeled as (a) contextual rater type; (b) expressive rater type; and (c) mental representation rater type.
Underscoring the framework of scoring was empirical evidence gleaned from each raters’ proficiency rating scale use. This includes indices measuring raters’ overall leniency/severity, category usage, and differential leniency/severity by item (i.e. Rasch bias measures). These indices provide evidence of variability stemming from each raters’ unique interpretation of the measurement instrument as a result of their schema. The framework of audition is a direct result of each individual rater’s schemata based upon their experiential and environmental differences. In order to gain an empirical perspective of rater schemata, a cluster analysis based upon bias indices provided an empirical definition of distinct rater types.
Considering the rating process from a cognitive perspective can lead to the improvement of measure development, scoring processes, and training procedures. Ratings resulting from any rater-mediated assessment protocol are a representation of the rater, and not necessarily of the performance itself (Engelhard, 2002). If a clear methodology to managing rater mediated assessment data is not put into place, the threat of construct-irrelevant variability may obscure what is being measured, the use of the measurement apparatus itself, and the resulting raters’ scores (Lane & Stone, 2006). Therefore, a clear empirical understanding of rater behavior is necessary for valid, reliable, and fair assessment practices in the evaluation of musical performances.
Measurement instruments that are carefully and strategically designed in conjunction with carefully trained and monitored raters can improve consistency and precision in the rating process. The incorporation of accuracy models and a more in-depth study of the effects of rater clusters on model fit may provide practical applications of the results of this research. In hermeneutic music performance scoring systems, selecting raters that represent a variety of rater types may provide a more broad and diverse (yet better controlled) perspective to the assessment process. Conversely, in psychometric music performance scoring systems, knowledge of rater types can inform and perhaps streamline the rater training process to provide more equitable and precise evaluations. The problem still exists, however, that little information is known about the relationship between rater cognition and rater proficiency. Investigation into rater training procedures related to rater types can provide insight into the connection of rater proficiency, environmental, and experiential implications to rater behavior. Additionally, investigation into the effects of rater type to the construction of a priori assessment network systems through evaluation of model fit may provide insightful and fruitful implications for developing large-scale performance music performance evaluation systems.
The approach underscoring cognitive modeling specific to rater behavior is to explain why raters respond to a particular item. In working with latent constructs such as music performance assessment, the most prominent validity concern lies in explaining the inferential gap between observed scores and the definition of the construct. Validity evidence can only truly be established when sources that affect response outcomes are explained. Validity, however, is not an omniscient knowledge of the construct of interest, as sources of error will always impede the measurement process. Therefore, the focus of validity in the context of psychometric measurement should not necessarily be on the validity itself, but on the process of establishing validity. The process of validity is a trifold relationship between inference, explanatory considerations, and evidence. As demonstrated in this article, raters’ underlying cognitive processes are fundamental in explaining sources of variability. Further investigation into explanations of cognitive rating processes underscored by invariant psychometric measurement models with the aid of relevant statistical methods is essential for providing valid assessment in music performance and related psychological music research.
The ability to embed the Rasch model and related indices (e.g. rater severity, rating scale structure, differential rater severity) and analysis of cluster membership into the music performance assessment process would greatly improve its validity, reliability, and fairness. Specifically, the ability to identify raters’ unique engagement with measurement instruments can help identify, diagnose, and correct potential weaknesses in their ability as a rater. Of course, there are instances when differences in rater opinion can provide a more holistic evaluation of a musical performance. However, in instances when quantitative data is used for purposes beyond that of improving teaching and learning, Rasch measurement has promise as a new and improved approach toward the advancement of music performance assessment protocols.
Footnotes
Funding
The author(s) received no financial support for the research, authorship, and/or publication of this article.
Notes
References
Supplementary Material
Please find the following supplemental material available below.
For Open Access articles published under a Creative Commons License, all supplemental material carries the same license as the article it is associated with.
For non-Open Access articles published, all supplemental material carries a non-exclusive license, and permission requests for re-use of supplemental material or any part of supplemental material shall be sent directly to the copyright owner as specified in the copyright notice associated with the article.
