



Abstract
Music emotion information is widely used in music information retrieval, music recommendation, music therapy, and so forth. In the field of music emotion recognition (MER), computer scientists extract musical features to identify musical emotions, but this method ignores listeners’ individual differences. Applying machine learning methods, this study formed relations among audio features, individual factors, and music emotions. We used audio features and individual features as inputs to predict the perceived emotion and felt emotion of music, respectively. The results show that real-time individual features (e.g., preference for target music and mechanism indices) can significantly improve the model’s effect, and stable individual features (e.g., sex, music experience, and personality) have no effect. Compared with the recognition models of perceived emotions, the individual features have greater effects on the recognition models of felt emotions.
For the ability to convey or induce emotions, music plays an important role in human life. Almost all music pieces are created to convey feelings, composers create music to resonate with their listeners, and performers use the language of music to elicit the emotional responses of audiences (Feng, Zhuang, & Pan, 2003). Therefore, the emotion information of music has been widely used in, for example, music information retrieval (MIR; Downie, 2008; Wang, Yang, Wang, & Jeng, 2012; Y. H. Yang & Chen, 2010), music recommendation (Deng, Leung, Milani, & Chen, 2015; Park, Ihm, Jang, Nasridinov, & Park, 2015), and music therapy (Bernatzky, Presch, Anderson, & Panksepp, 2011; Dingle, Kelly, Flynn, & Baker, 2015). Considering the importance of emotion information of music, a technology for automatically recognizing music emotion is urgently needed (X. Yang, Dong, & Li, 2018). Because there is so much existing music, it is difficult for people to manually tag emotion information to all music. Thus, music emotion recognition (MER), a research area investigating computation models to detect the emotion of music (Chen, Lee, Hsieh, & Wang, 2015), has become an urgent issue, and computer scientists have expended lot of effort on it during the past decade.
MER constitutes a process of using computers to (a) extract and analyze music features from original music, (b) construct the relationship between music features and perceived emotions, and (c) recognize the emotion that the untagged music expresses (see Figure 1). Through the above process, a music database can be organized and managed according to emotion (Y. E. Kim et al., 2010). Therefore, MER has become an important part of the research on digital music applications (Dobashi, Ikemiya, Itoyama, & Yoshii, 2015).
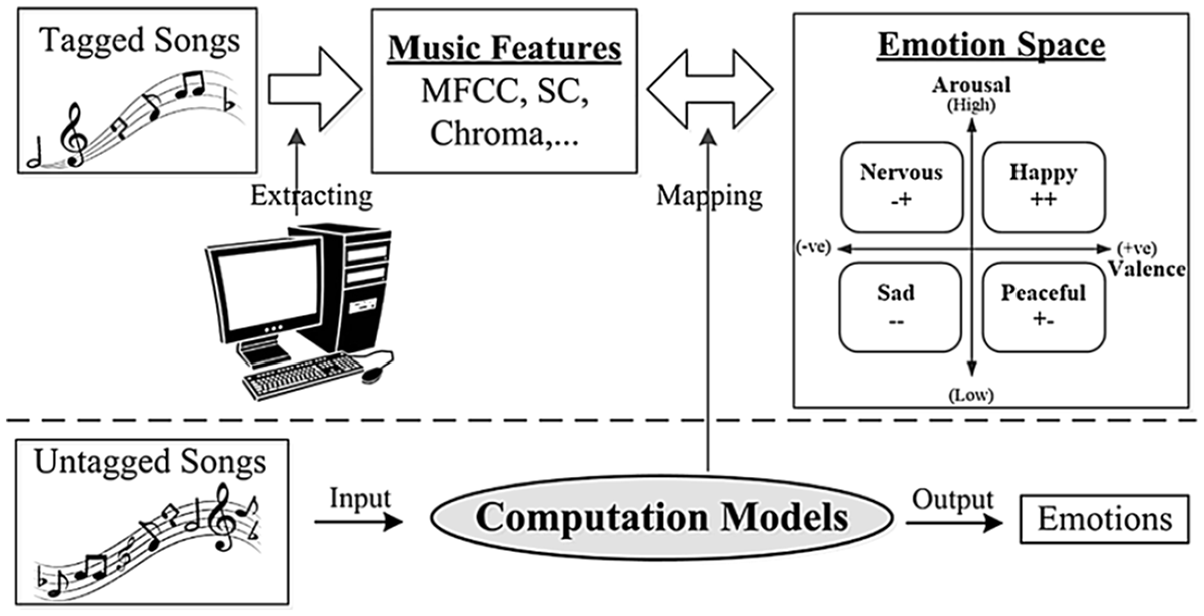
Music emotion recognition process (X. Yang, Dong, & Li, 2018).
Although the research on MER has made considerable progress, common problems remain. A critical problem is the strong subjectivity of the ground-truth data, which reflect the perceived emotions of human beings, because different people listening to the same music may produce different emotion perceptions (Gabrielsson, 2001). To solve this problem, each musical segment must be annotated by many subjects (Raykar et al., 2010) to obtain a relatively accurate emotional assessment. However, it raises another problem, that is, the emotions identified by MER models are not the emotions perceived by the target individual but the average perception of a group of individuals. Therefore, the importance of using personalized MER models has been advocated (Y. H. Yang, Lin, & Chen, 2009), despite the difficulty of collecting modeling data for everyone. As a compromise, we used individual features as inputs for our MER models, and the individual factors were classified according to the difficulty of acquisition. We suppose that the MER models’ performance will improve with the increase in individual features.
Notably, in the field of music cognition, the judgment of musical emotion has proven to be influenced by individual factors, for example, age (Dolgin & Adelson, 1990; Laukka, 2007), sex (Kratus, 1993), music education (Mualem & Lavidor, 2015), trait empathy (Kawakami & Katahira, 2015), and personality (Kallinen & Ravaja, 2006). However, these studies have often focused on a single or small number of factors and did not consider different types of individual factors together. Through machine learning (ML) methods, music emotion judgments were first considered from a computational perspective by Vempala and Russo (2018), and this method opened new lines of music cognition research. In this study, ML toolkits used in previous MER studies, such as multiple linear regression (MLR; Soleymani, Caro, Schmidt, Sha, & Yang, 2013), k-nearest neighbor regression (KNN; Dewi & Harjoko, 2010), support vector regression (SVR; Deng et al., 2015), and so forth (see below), were applied to investigate the relationship between individual factors and musical emotion.
To better select modeling features, we had to review the process of listening to music. And the data collected during this process was divided into three categories based on the difficulty of acquisition (Figure 2). The first type, easiest to obtain, is the music information that can be obtained directly from music without considering the listener and has been the only input in most MER studies. The personal information reflecting relatively stable individual characteristics is the second type of data, for example, sex, academic background, music experience, music preference, and personality (Y. H. Yang, Su, Lin, & Chen, 2007). The third type of data must be collected when listening or immediately after listening (real-time data) and includes subjective evaluation (e.g., mechanism indices; Juslin, Harmat, & Eerola, 2014), objective evaluation (Kallinen & Ravaja, 2006), context, physiological signals (e.g., skin conductance, electrocardiogram, pulse, and facial muscle activity; Gouizi, Bereksi Reguig, & Maaoui, 2011; J. Kim & André, 2008; Li & Chen, 2006; Vempala & Russo, 2018), and brain signals (e.g., electroencephalograph; Bhatti, Majid, Anwar, & Khan, 2016; Byun, Lee, & Han, 2017; Jenke, Peer, & Buss, 2013). In this study, all three types of data were considered, and we collected audio features, stable individual factors, subjective feelings, and perceived emotions for modeling.

Three types of data that can be collected in different contexts.
The term “music emotion” in the field of MER has been used to represent the audience’s perceptual emotion of music (X. Yang et al., 2018), and felt emotions (emotions evoked by music) have seldom been considered. Although the relationship and differences between perceived emotions and felt emotions have been widely discussed by psychologists (e.g., Gabrielsson, 2001; Juslin & Zentner, 2001; Kallinen & Ravaja, 2006), using ML models to predict felt emotions of music is rare. Therefore, we also considered using ML methods to construct recognition models of felt emotion and comparing them with recognition models of perceived emotion. Gabrielsson (2001) concluded after conducting a review that perceived emotion and felt emotion are the “objective” and “subjective” aspects of music-elicited emotion. Each music may have a recognizable character (e.g., emotional meaning) that differs from the subjective meaning of different listeners (Kallinen & Ravaja, 2006). In the evaluation to determine if felt emotions are more subjective, we supposed that individual features would have greater effects on feeling models than perception models. In addition, researchers have found more complex models that account for music-elicited emotions better than the basic emotion and dimensional emotion models (e.g., a 9-factor model of music-induced emotions; Zentner, Grandjean, & Scherer, 2008). And whether musical and naturalistic emotions really map onto one another in a 1:1 fashion is still controversial (Allen, Walsh, & Zangwill, 2013). But in this study, basic emotions were used to conduct the evaluation. We considered four representative emotions—happy, relaxed, sad, and angry—because of their relation to basic emotions, and because they cover the four quadrants of the 2-dimensional model of emotion (Laurier, Grivolla, & Herrera, 2008). And these four emotions were also widely used in previous MER studies (e.g., Han, Rho, Dannenberg, & Hwang, 2009; Y. E. Kim et al., 2010; Laurier et al., 2008).
By combining ML techniques with research methods in the area of music psychology, this study contributes to the field of music cognition and MER. The contribution to music cognition is as follows: We analyzed the effect of individual factors on music emotional judgment from a computational modeling perspective; in this manner, we investigated the relationship between variables and constructed models that automatically recognize individuals’ perceived emotion or felt emotion of music. The contribution to the field of MER is as follows: We attempted to solve the subjectivity problem by introducing individual features; our MER models provided a reference for the creation of personalized MER systems. And three research questions arose. First, as mentioned above, traditional MER researches used music features to predict average perceived emotion of a group of individuals (also refer to as the general MER model), which was inaccurate for each individual. Therefore, we decided to build MER models that predict perceived emotions of each individual (the personal MER model). And we investigated whether using only music features can also effectively predict individuals’ perceived emotions by comparing the prediction effects of the general and personal MER models. We assumed that individuals’ perceived emotions will be more difficult to predict, that is, the personal MER models will perform worse than the general MER models (Hypothesis 1). Second, we needed to investigate whether adding individual features can improve the effect of personal MER models. And we believed that, when individual features are added, the personal MER models will perform better than using only music features as input (Hypothesis 2), because the recognition models may be able to obtain additional valid information from individual features. Third, felt emotion of music might be more susceptible to individual features than perceived emotion, so we assumed that individual features will have greater effects on feeling models than those on perception models (Hypothesis 3). In addition, individual features considered in Hypothesis 2 and Hypothesis 3 included sex, academic background, music experience, personality, mechanism indices, preference for music, familiarity with music, felt emotion (perception models), and perceived emotion (feeling models).
Methods
To build our MER models, we collected audio features, stable individual factors (demographic property, music experience, and personality), subjective feelings of excerpts (felt emotion, preference, familiarity and mechanism indices), and individual perception of music emotion. The ML methods used are introduced generally below. All features extracted for modeling are listed in Supplemental material A.
Stimuli, musical feature extraction, and reduction
Sixty famous popular songs were collected from Chinese albums, and the collected excerpts were trimmed to 25 s and converted to a uniform format: 22,050 Hz, 16 bits, and mono channel PCM WAV. Each excerpt was annotated by 20 participants in our experiment.
Then, we need to extract effective information from each excerpt as input to later models, and Figure 3 presents the complete flow of audio signal processing in this study. For musical feature extraction, we used librosa (McFee et al., 2015), a Python package for audio and music signal processing. Spectral features (root mean square [RMS], mel-frequency cepstrum coefficient [MFCC], spectral centroid, spectral contrast, spectral rolloff, zero-crossing rate, and tonnetz), which were widely used to represent the intensity, timbre, or pitch of music (see Table 1), and rhythmic features (by beat and tempo detection) were extracted from each excerpt, and all the features were used in other MER studies (Harte, Sandler, & Gasser, 2006; Jiang, Lu, Zhang, Tao, & Cai, 2002; Tzanetakis & Cook, 2002; Wieczorkowska, Synak, & Raś, 2006; Yang, Su, et al., 2007).

Audio signal processing method in this study.
Illustration of the spectral features.
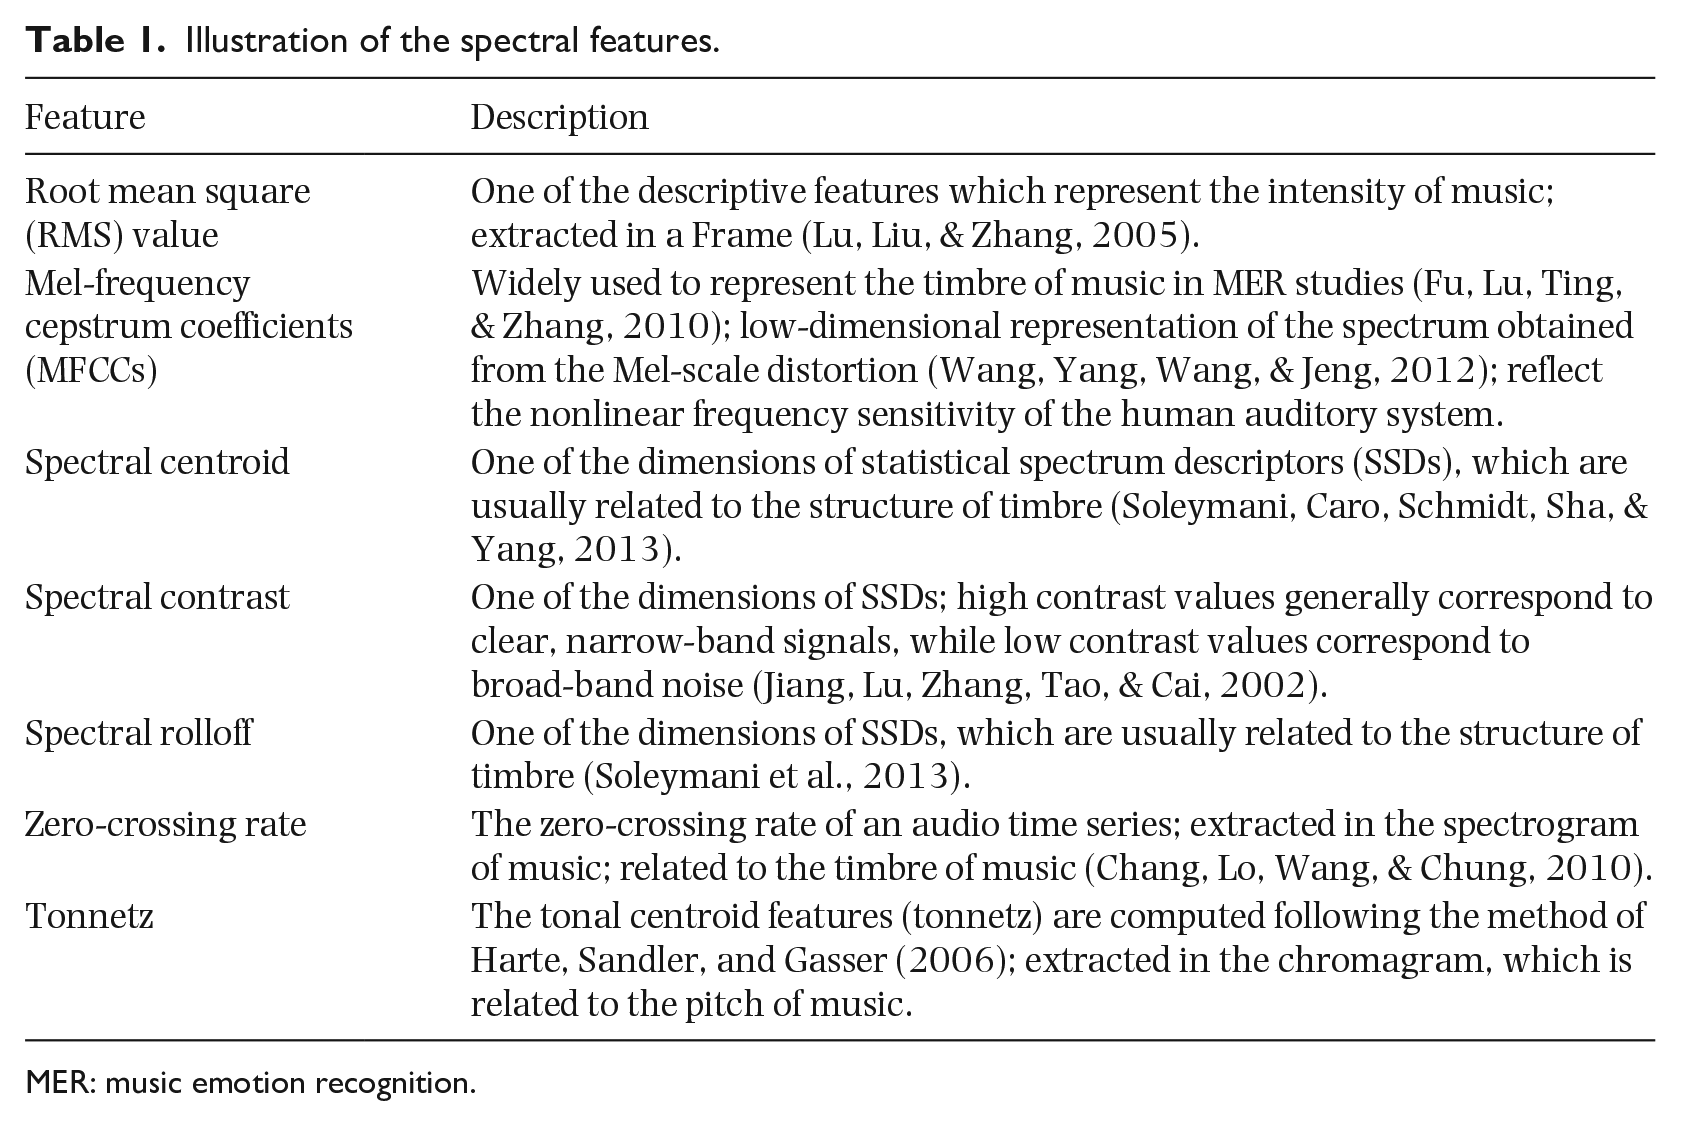
MER: music emotion recognition.
After feature extraction, each excerpt was represented in a subspace of high dimensionality (38,778 dimensions per excerpt). To manage the high-dimensional dataset, feature reduction is typically a critical step that reduces the storage and computational space (Vempala & Russo, 2018). Thus, principal components analysis (PCA) was applied to reduce the dimensionality of the data. After applying PCA, dimensions with little variation were eliminated, and 58 dimensions explaining 99% of the variation were retained. These 58-dimensional features reflecting music information would be one of the final inputs of our MER models.
Participants
Participants were recruited from the campus of Zhejiang University, and each was rewarded with ¥40. The experiment was designed such that each excerpt would be annotated 20 times by different participants, and we obtained a complete data set from 54 participants. On average, the final 54 participants (33 females, 21 males) were aged 22.56 years (SD = 1.99). Five participants annotated the entire dataset.
Stable individual factors
Using personal information for MIR has been advocated (Chai & Vercoe, 2000; Y. H. Yang, Su, et al., 2007); therefore, individual factors are critical inputs of our MER model. The following stable individual factors evaluated by Y. H. Yang, Su, et al. (2007) were collected before the experiment:
1) Demographics: We collected the age, sex, occupation, and academic background (defined as follows: the first academic category comprises colleges of liberal arts, social science, and management, and the second academic category comprises colleges of engineering, science, medicine, and computer science) of the participants, although the relationship between academic background and music emotion is rarely discussed. Only sex and academic background were applied in our models because the participants were mainly college students.
2) Music experience: We represented music experience in terms of their habit of listening to music (from rare to often) and ability to play an instrument (can or cannot) and whether they had received professional music training and liked to listen to music with the following prototypical emotions used by Kallinen and Ravaja (2006): alert, surprised, energetic, peppy, happy, satisfied, relaxed, calm, inactive, sleepy, bored, vegetated, sad, hopeless, fearful, and angry. Because none of the participants had received professional music training, this feature was removed.
3) Personality: We used the Big Five personality traits to describe personality. A Chinese-language 44-item Big Five Inventory personality scale, assessed to be valid (Carciofo, Yang, Song, Du, & Zhang, 2016) was applied to measure the personality of each participant.
Experimental design
The experiment was designed such that (a) each participant listened to 12 of the 60 excerpts and (b) each excerpt was heard by 20 unique participants. To collect the personal information of participants, after a brief description of the experiment, the participant was asked to fill out questionnaires described above. Next, participants received a listening order that was independently randomized to minimize the influence of presentation order. Each excerpt was preceded by 30 s of silence and followed by self-report questionnaires.
In the self-report phase, participants were first asked to evaluate the emotions that the music aroused in them while listening (i.e., emotion felt; “Did you feel happy when you listened to the music?”), the preference and familiarity of the excerpt, and the mechanism indices (i.e., “Did the music evoke a memory of an event from your life?”). After the subjective measures, participants were then asked to evaluate the perception of the emotions expressed by the music (i.e., emotion perceived; “Do you think the music expresses a happy emotion?”). The subjective measurements had to be performed first because it may dilute faster compared with the more objective evaluation of the perceived emotion and the felt emotion may have included physiological responses that decrease as a function of time (Kallinen & Ravaja, 2006). In addition, the participants were asked to concentrate on the music and listen to the music with their eyes closed.
In general, each participant performed the experiment according to the following sequence

In this sequence, S indicates silence, Ex indicates excerpt, Sm indicates subjective measurements, and Om indicates objective measurements. All the target emotions (happy, relaxed, sad, angry), felt and perceived, were evaluated on two scales from 1 (not at all) to 5 (very much). The mechanism indices (brain stem reflex, rhythmic entrainment, episodic memory, conditioning, visual imagery, contagion, musical expectancy, cognitive appraisal) were measured by the MecScale (Juslin et al., 2014). The preference for and familiarity with music were also evaluated on a scale from 1 (not at all) to 5 (very much). In addition, for subsequent modeling, all continuous inputs were scaled to a value between 0 and 1(e.g., the preference for music), and all binary inputs were labeled as 0 or 1 (e.g., the mechanism indices).
ML methods
In this study, we attempted to form the mapping relations among music features, individual factors, and emotion (i.e., perceived emotion and felt emotion). And the ML method is a bridge that links the aforementioned variables. A multitude of ML methods is available for both classification and regression. In this study, we formulated MER as a regression problem (Y. H. Yang, Lin, Su, & Chen, 2007) and adopted the random forest regression and the Bayesian ridge regression to train regressors. Other ML methods, such as MLR (Soleymani et al., 2013), KNN regression (Dewi & Harjoko, 2010; Pao et al., 2008), and SVR (Deng et al., 2015; Imbrasaitė, Baltrušaitis, & Robinson, 2013; Y. H. Yang, Su, et al., 2007), were also attempted and presented below for reference. In addition, scikit-learn (Pedregosa et al., 2011), a Python module integrating a wide range of state-of-the-art ML algorithms for medium-scale supervised and unsupervised problems, was applied for modeling. More details on the ML methods are presented along with the results below.
Results
Manipulation check
As the first step of the exploration of the data, we assessed whether the distribution of annotated emotions was appropriate for modeling. Table 2 shows the mean ratings for perceived and felt emotions. The mean rating for perceived anger was significantly lower than for the other emotions, χ2 = 30.07, p < .01, and only 11 excerpts’ mean ratings for perceived anger were higher than 2, which means “a little angry.” In addition, anger was not well-aroused by our excerpts (felt anger; M = 1.24, SD = 0.27) compared to other emotions. Therefore, mean ratings for perceived and felt anger were retained for correlation analyses but excluded from modeling.
Mean ratings for perceived and felt emotions.
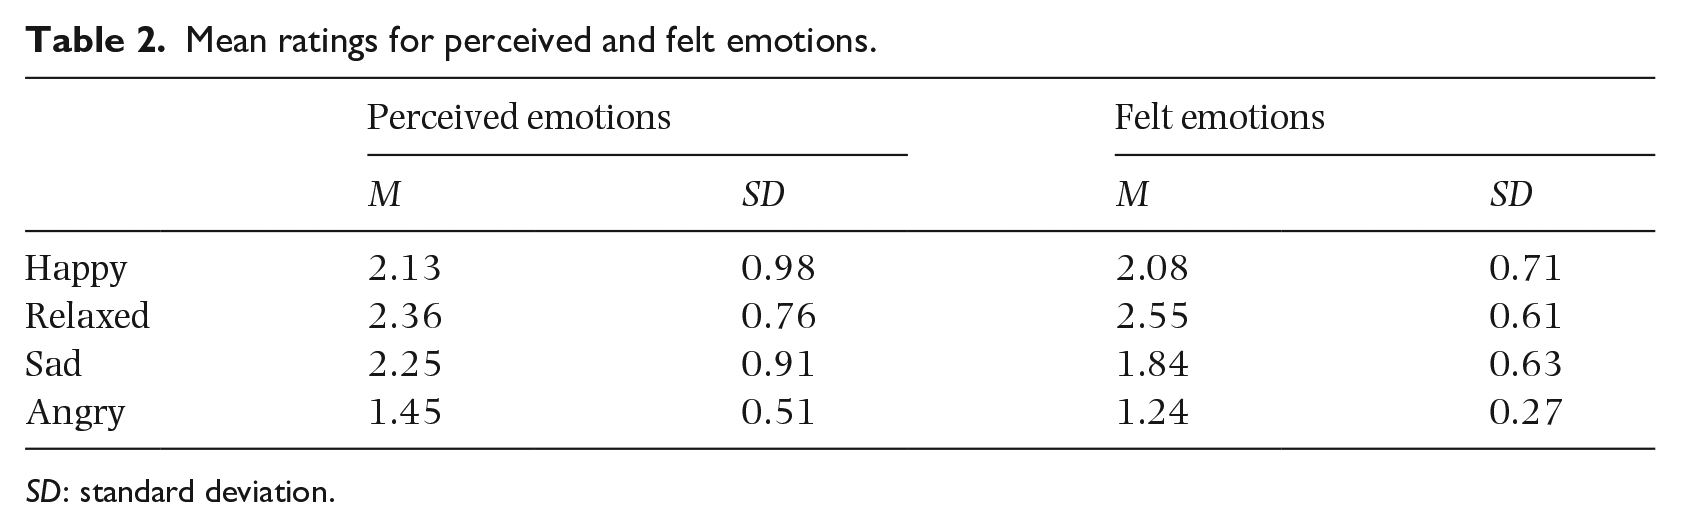
SD: standard deviation.
Correlation analyses
Before building MER models, we analyzed how well the independent variables (stable individual features and subjective feelings) accounted for the dependent variables (perceived emotions and felt emotions). For example, we observed that individuals’ preferences for music were positively correlated with perceived happy ratings, r(1198) = 0.25, p < .01; perceived relaxation ratings, r(1198) = 0.19, p < .01; felt happiness ratings, r(1198) = 0.49, p < .01; and felt relaxation ratings, r(1198) = 0.34, p < .01. These results are presented in their entirety in Supplemental material B. In addition, among the four perceived emotions, emotions with same valence were positively correlated, i.e., perceived happy and perceived relaxed, r(1198) = 0.57, p < .01, and emotions with a different valence were negatively correlated (Table 3). Felt emotions had the same phenomenon as perceived emotions, although the average correlation coefficient (M|r| = 0.42, SD = 0.15) was smaller than perceived emotions (M|r| = 0.29, SD = 0.17). We also found that all the perceived emotions were positively correlated with the corresponding felt emotions. The aforementioned results illustrate the linear relationship between variables, but not all results can be explained by a linear relationship. Thus, we used ML to investigate their relationship.
Bivariate correlations between perceived emotions and felt emotions.
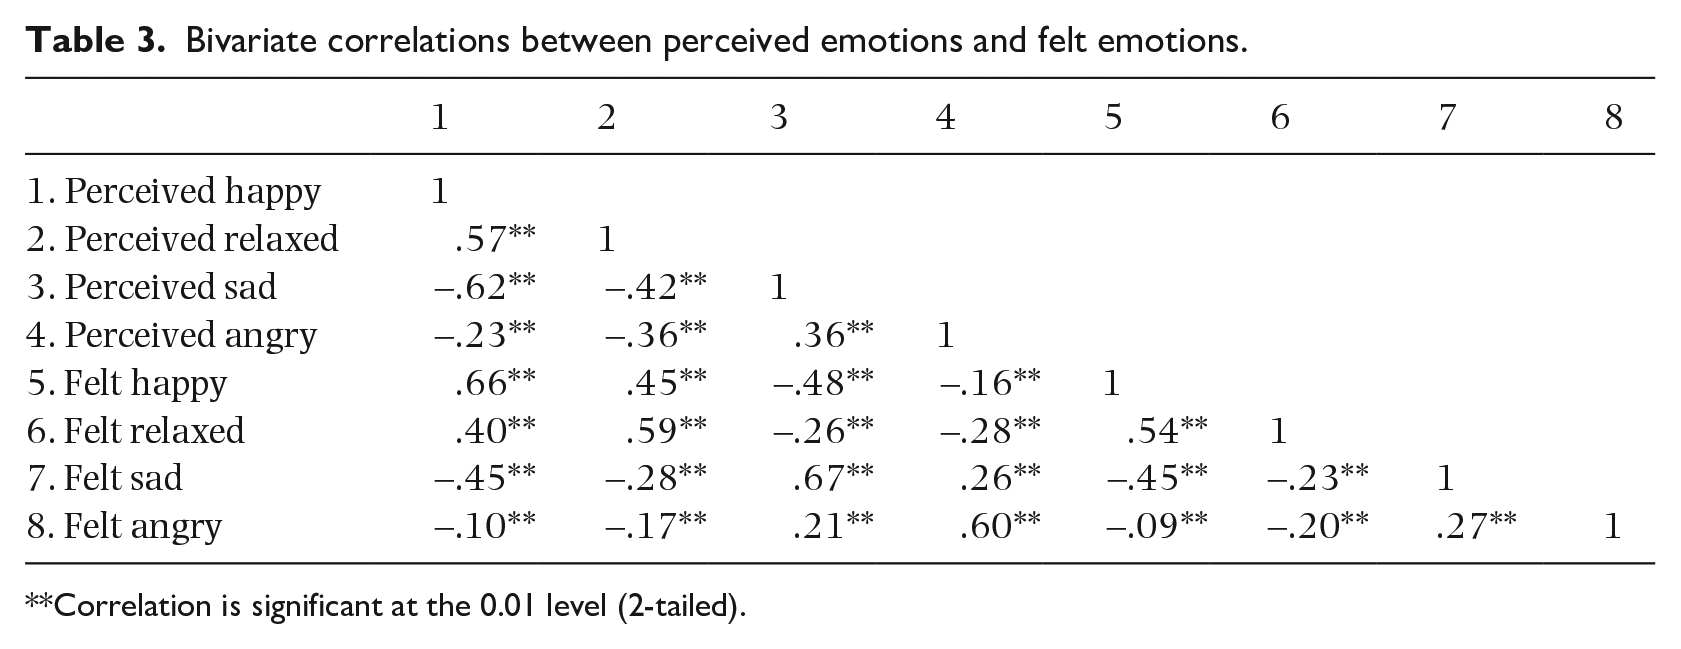
Correlation is significant at the 0.01 level (2-tailed).
MER models using audio features only
In this section, we built the first type of MER model and attempted to verify Hypothesis 1. We used the same algorithm and input to construct the MER models and used the model to predict individual perceived emotions and average emotions, respectively.
To obtain relatively good models, we must select the algorithm first. Using audio features as inputs and average emotions as the ground truth, we used the following five algorithms for modeling: MLR, BR, SVR, RF, and KNN. The best performing algorithm would be used for subsequent analysis and modeling.
We built three models separately to predict the perception of happy, relaxed, and sad. The dataset in the current models is too small (60 samples), so the performances of our models were evaluated by the leave-one-out cross-validation technique, which uses one data instance of the dataset as the testing data and uses the remaining instances as training data to train the regressor (Y. H. Yang, Su, et al., 2007). And the prediction accuracy of a regressor was evaluated in terms of the root mean-squared error (RMSE)

where
Mean RMSE values of five ML models (60 samples).
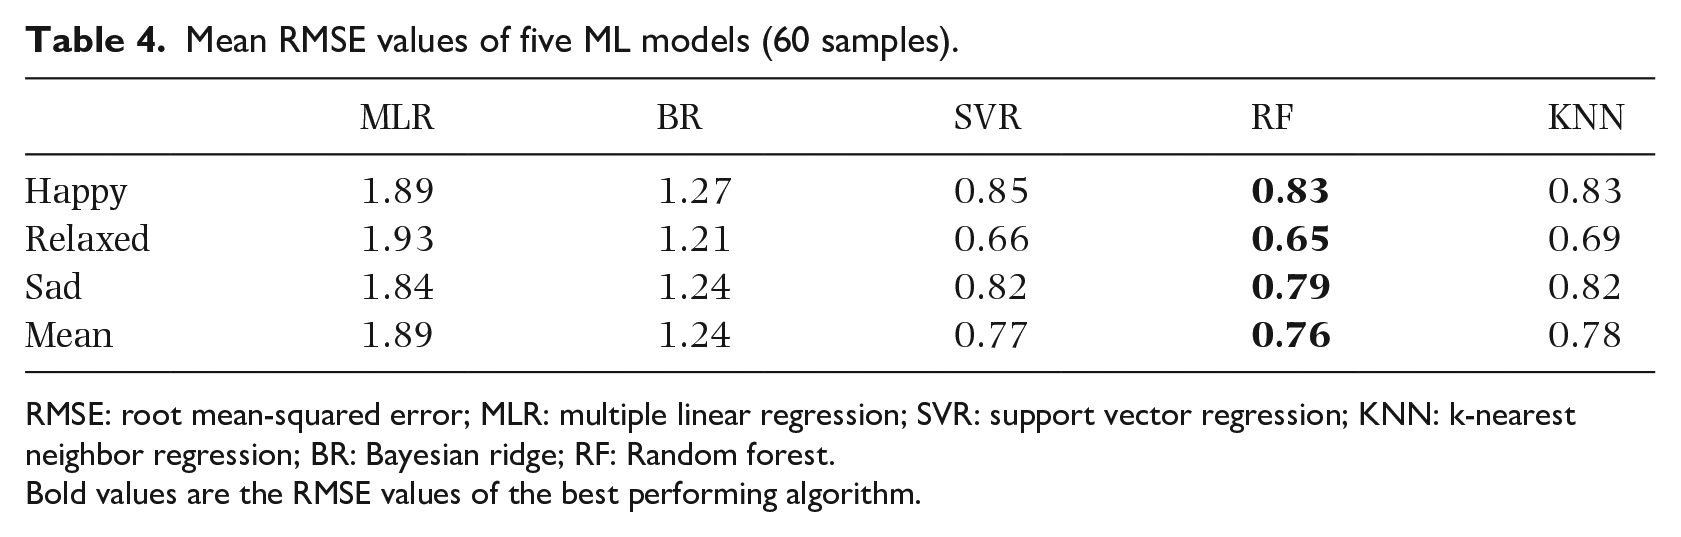
RMSE: root mean-squared error; MLR: multiple linear regression; SVR: support vector regression; KNN: k-nearest neighbor regression; BR: Bayesian ridge; RF: Random forest.
Bold values are the RMSE values of the best performing algorithm.
To evaluate the effect of the MER models in predicting individual emotions, we trained a personalized regressor, by using random forest regression and using audio features as input, for each participant who had annotated all 60 songs. Leave-one-out was also used to evaluate the performance, and the mean RMSE values for the five participants are shown in Table 5. The general regressor achieved a mean RMSE value of 0.83 for happy, 0.65 for relaxed, and 0.79 for sad (Table 4); its performance decreased to 1.26 for happy, 1.16 for relaxed, and 1.00 for sad on average when predicting the five participants. The results indicate that the MER models using audio features as the only input are less effective in predicting individual emotions than the mean opinions. We supposed that the mean perception of music would be more responsive to the general part of music; thus, we could better predict the mean opinions using audio features. When predicting the individual’s perception of emotion, individual uniqueness must be considered.
Mean RMSE values for the five participants.
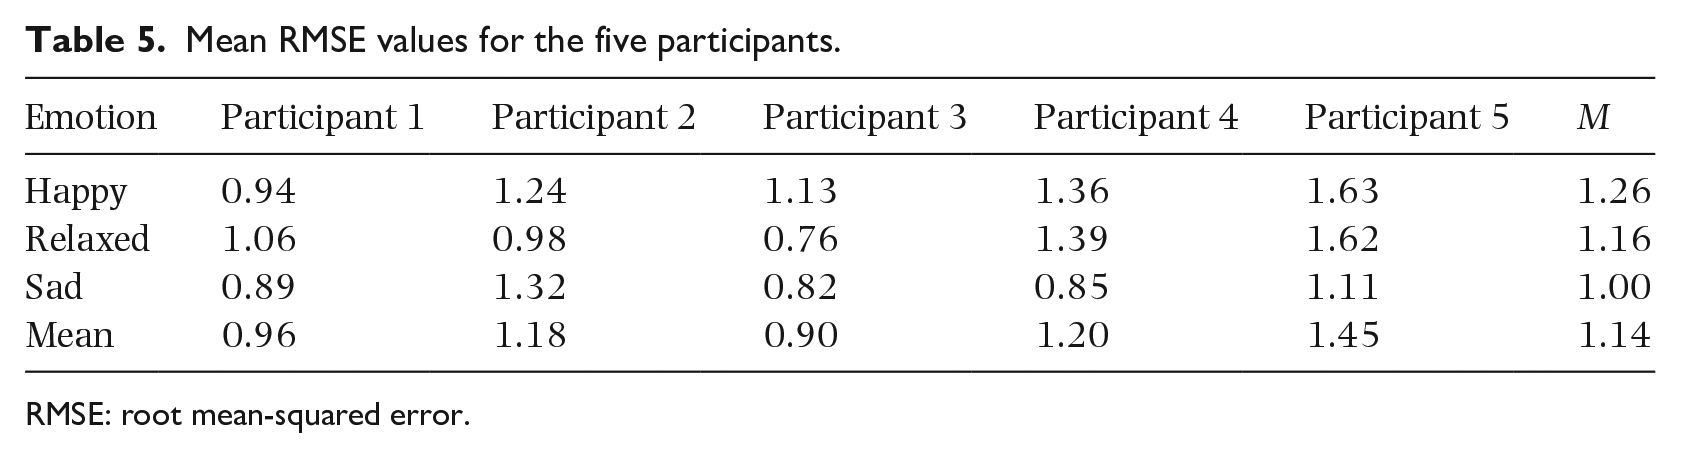
RMSE: root mean-squared error.
Perception models of music emotion
Realizing the importance of individual uniqueness, we used individual features as the input for our MER models in this section. First, we used audio features as the input and individual perceived emotion as the ground truth, and the aforementioned five algorithms were compared for modeling. By contrast, 10-fold cross-validation was used to evaluate the performance here. In Table 6, models using BR performed best and achieved a mean RMSE value of 0.94 for perceived happy, 1.04 for perceived relaxed, and 0.98 for perceived sad.
Mean RMSE values of five ML models (1,200 samples).
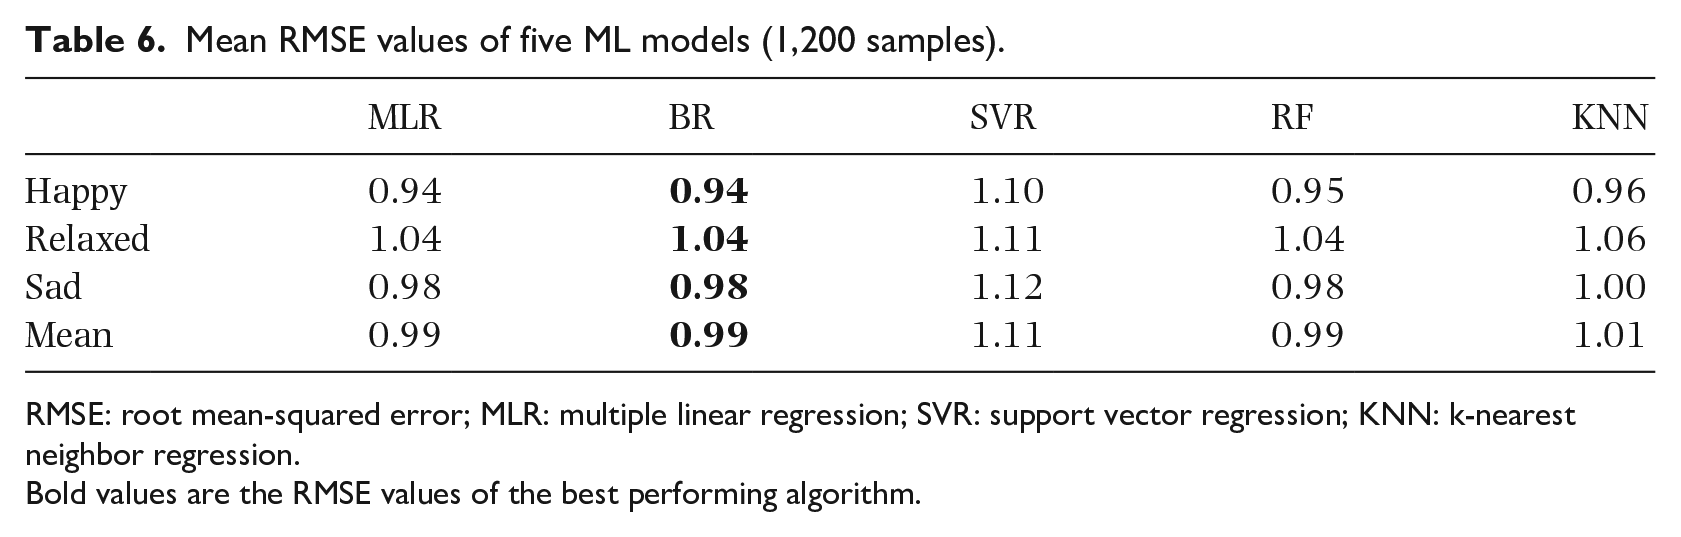
RMSE: root mean-squared error; MLR: multiple linear regression; SVR: support vector regression; KNN: k-nearest neighbor regression.
Bold values are the RMSE values of the best performing algorithm.
Next, the individual features were gradually added to the basic model as inputs. We divided individual features into two categories. The first category was stable individual features, and comprised demographics, music experience, and personality. The second category was dynamic features, including felt emotion, preference, familiarity and mechanism indices. We constructed four models with different inputs for each prototypical emotion. The first type of model, already built, was a base model that used only audio features. The second type of model added stable individual features as the input on the basis of the first type. Similarly, the third model added subjective feelings. The fourth type of model added all individual features as the input.
Figure 4 shows the prediction results of the four types of models for individual perceived emotions. When only stable individual features were added, the model effect for the three prototypical emotions did not improve significantly. However, when adding subjective feelings, the mean RMSE value of the perception of happy decreased from 0.94 to 0.82, relaxed decreased from 1.04 to 0.93, and sad decreased from 0.98 to 0.85. The results demonstrated that when predicting individual perceived emotions, the stable individual features have a relatively weak effect on the prediction results, and the dynamic individual features (subjective feelings in this study) improve the prediction results.
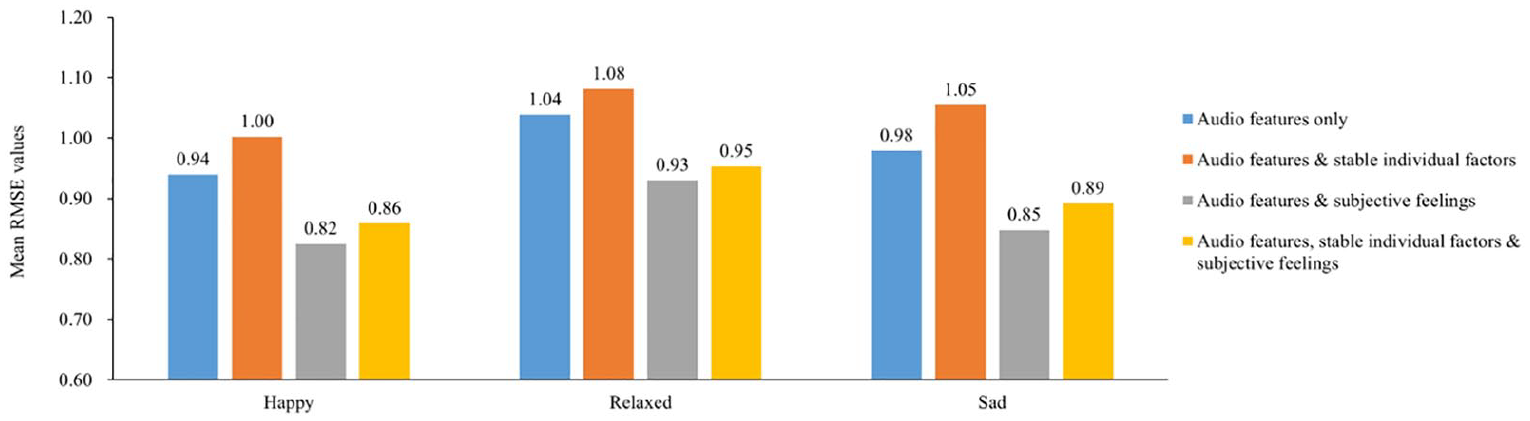
Mean RMSE values of perception models with different inputs.
Comparison between feeling models and perception models
The next step was to build the third type of model to predict felt emotions and observe how individual features contribute to prediction. In addition, we also had to verify Hypothesis 3 by comparing the role of individual features in predicting perceived emotions and felt emotions.
First, we used audio features as the input and individual felt emotion as the ground truth and applied BR to construct our basic models. Ten-fold cross-validation was also used to evaluate the performance of our models. The basic feeling models achieved a mean RMSE value of 1.03 for felt happy, 1.09 for felt relaxed, and 0.88 for felt sad.
Next, we gradually added individual features as the input for the basic model. Stable individual features were still the first type of individual features. However, we divided the subjective feelings into two parts. Because the felt emotion in subjective feelings became the ground truth, the remainder of the subjective feelings (i.e., mechanism indices, familiarity, and preference) was considered a separate category of individual features. In addition, the perceived emotion was regarded as the third type of individual feature. We added the aforementioned three types of features to the basic model and compared the effects of the models.
Figure 5 shows the mean RMSE value of the models. Similar to the perception models, when only stable individual features were added, the model effect was slightly worse. Subjective feelings achieved good results when predicting happiness and relaxation, which improved the model’s effect by 13.11% and 3.42%, but the effect of model improvement remained small when predicting sadness.
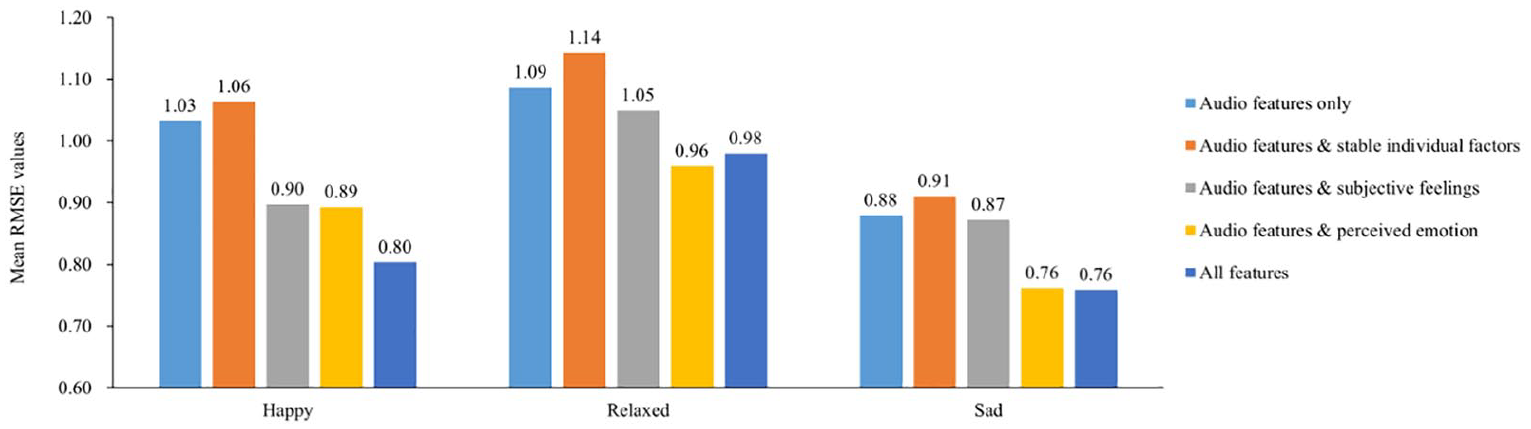
Mean RMSE values of feeling models with different inputs.
To compare the role of individual features in the perception models and feeling models, we also classified subjective feelings into two categories (a. mechanism indices, familiarity, and preference, and b. felt emotions), and then compared the effects of the three types of individual features on the perception model. Table 7 shows the mean RMSE value of the perception models and the improvement rate of the current model compared with the basic model. We found that, in general, individual features played a greater role in feeling models than in perception models.
RMSE values and improvement rate of perception models with different inputs.
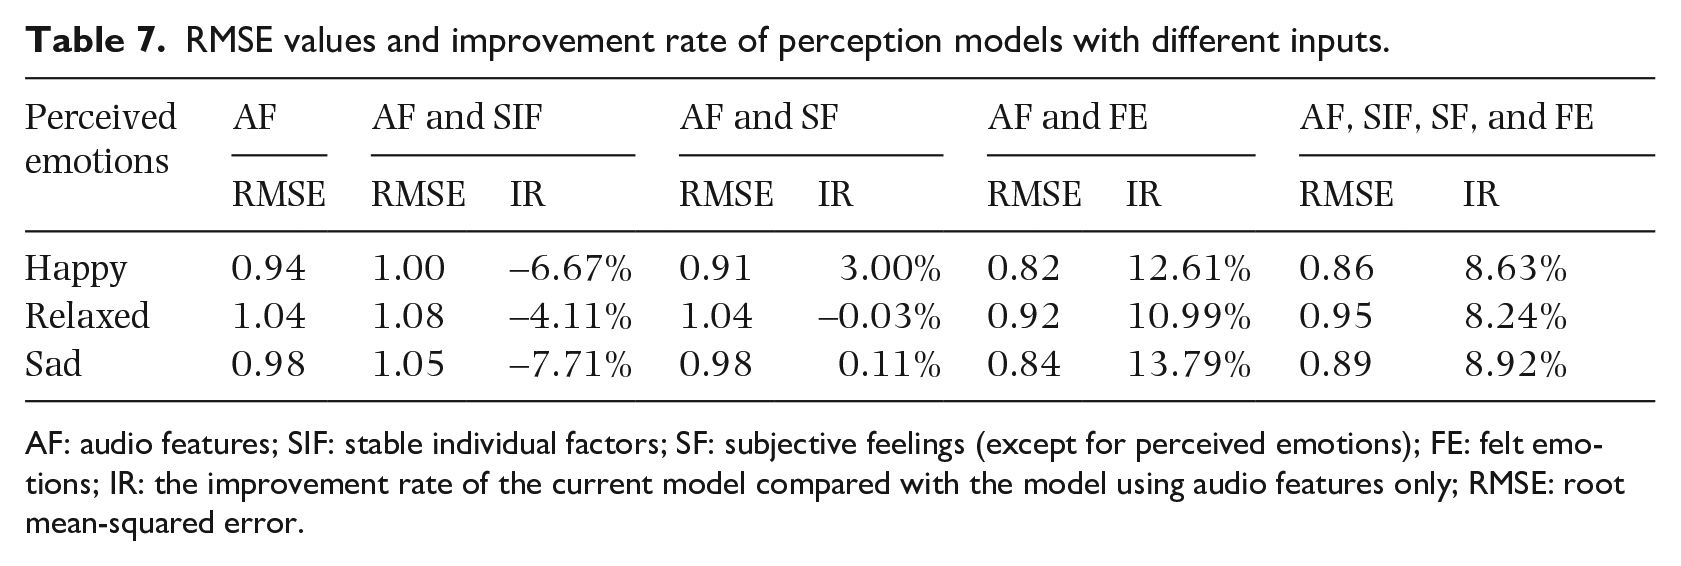
AF: audio features; SIF: stable individual factors; SF: subjective feelings (except for perceived emotions); FE: felt emotions; IR: the improvement rate of the current model compared with the model using audio features only; RMSE: root mean-squared error.
Model interpretability
In the last step of data exploration, we assessed if the models were able to differentiate between perceived emotions or felt emotions, by examining the information gain of features. The final models were constructed by BR; thus, they can be interpreted by the value of the coefficients. Because 10-fold cross-validation was used to evaluate the performance of our models, the coefficients of features might differ when predicting each test set; to show this, we plotted the distribution of the coefficients for each feature using boxplots (Figures 6 and 7). Boxplots were arranged in descending order of the absolute value of the median, and only the top 30 features were included for visibility, and the trend of the remaining features was approximately the same. All features applied to the modeling are listed in Supplemental material A.

Distribution of coefficients of each feature for recognition models of perceived emotion.
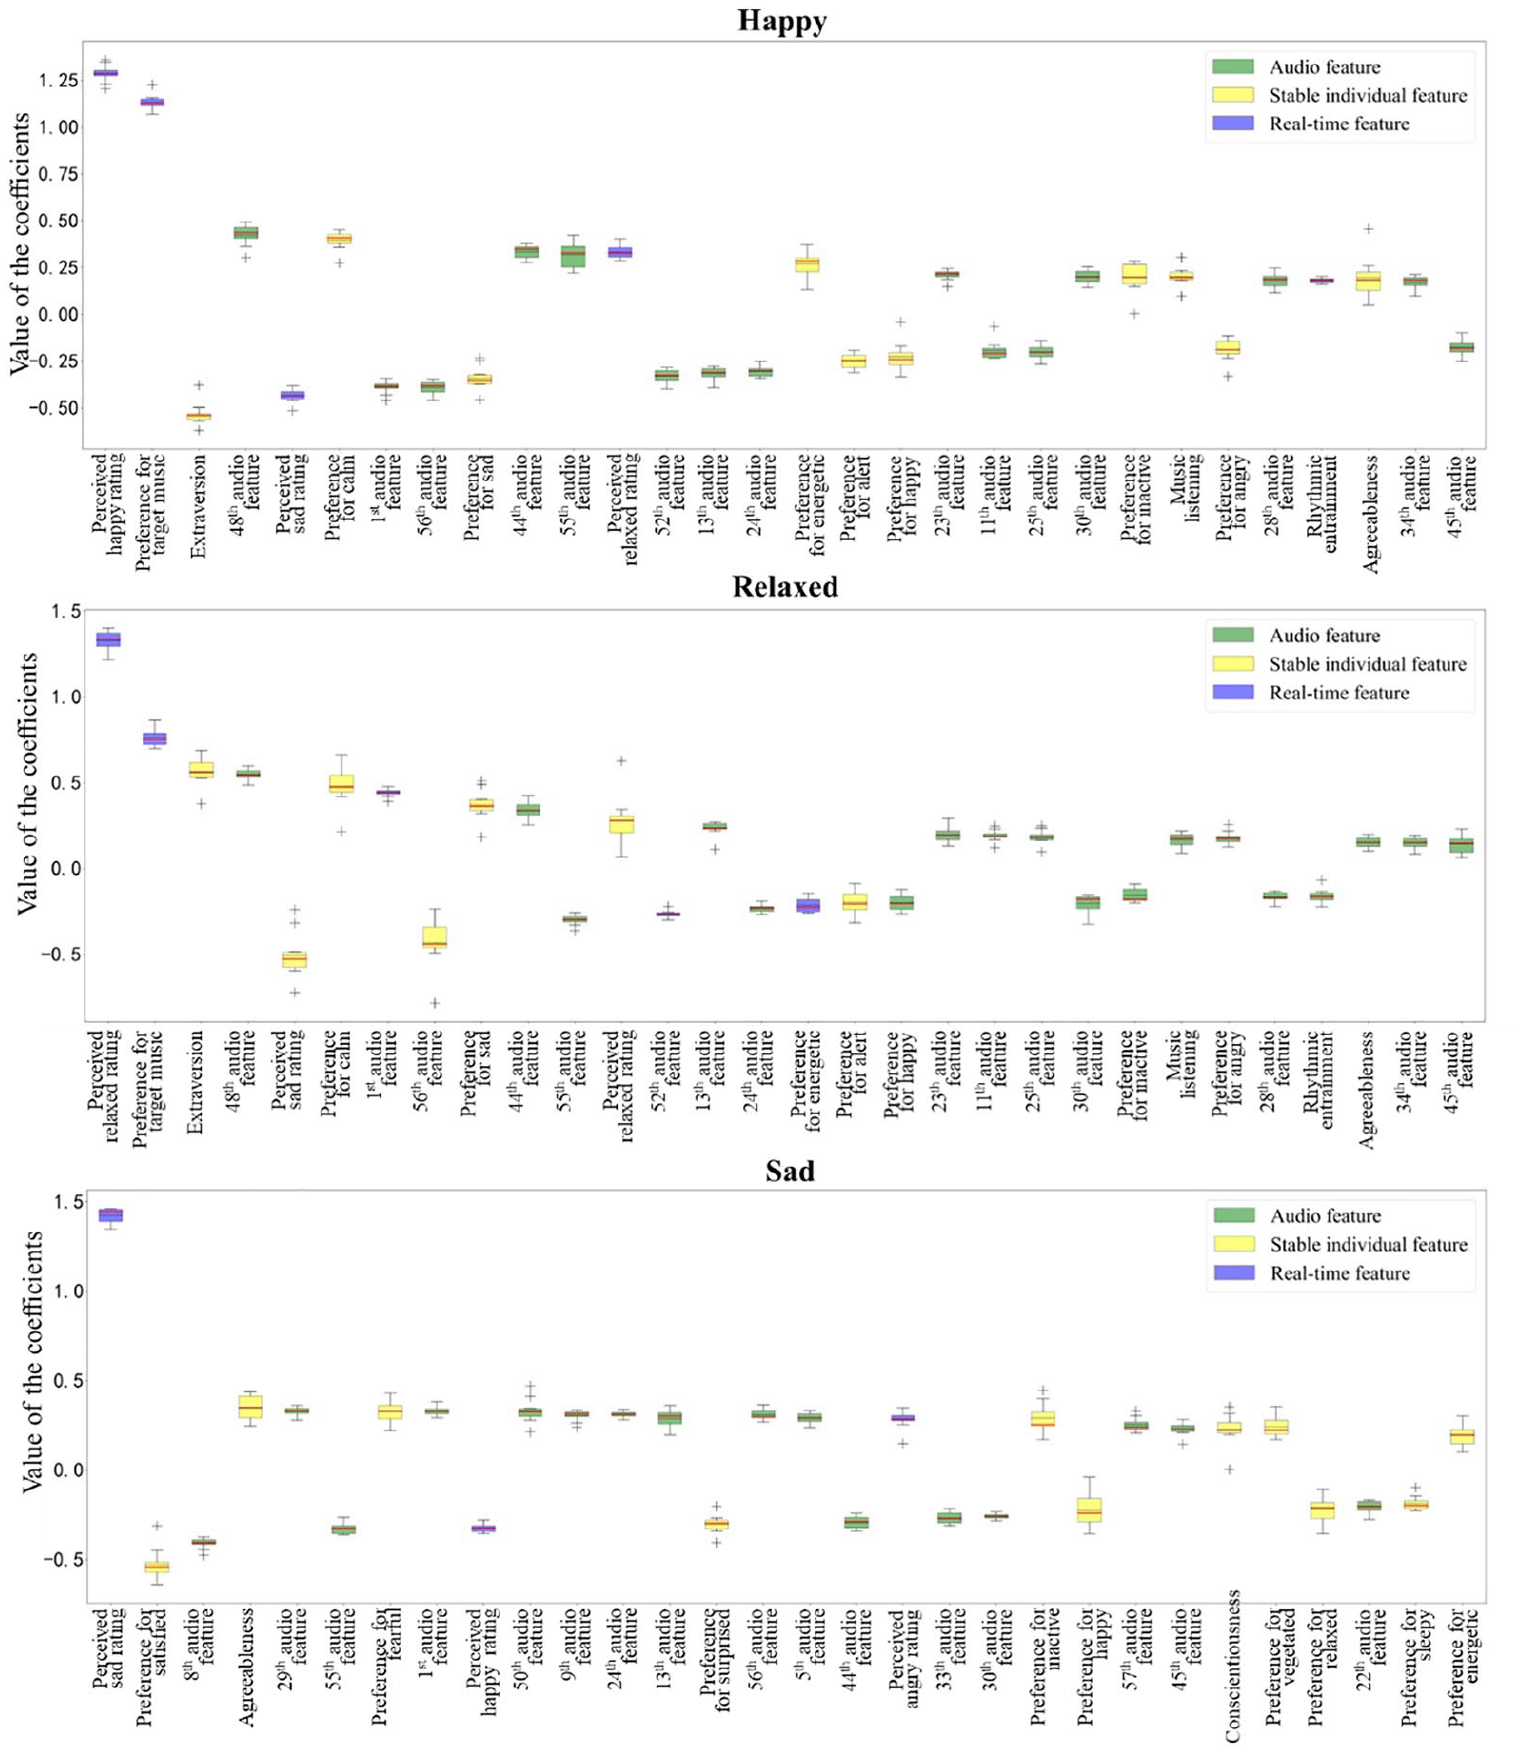
Distribution of coefficients of each feature for recognition models of felt emotion.
A compact boxplot indicates that the feature has a similar value when predicting different test sets. In Figure 6, for perceived emotions, the corresponding felt emotion was the most important feature. The remaining features had smoothly decreasing distributions. For felt emotions (Figure 7), the corresponding perceived emotion was also important. In addition, for felt happiness, the preference for target music became the second important feature. This feature was also important in predicting felt relaxation. We also observed that for the perception models, the value of the audio features accounted for 73.81% of happy, 64.88% of relaxed, and 68.54% of sad. For feeling models, the value of the audio features accounted for 51.52% of happy, 46.34% of relaxed, and 53.64% of sad. These findings demonstrated that individual features can provide more information for feeling models than for perception models.
Discussion
In this study, we revisited the influence of individual factors on the perception of music emotion and the emotion evoked by music. By using ML methods, we applied the individual variables verified in psychological research to the recognition model of individual music emotion perception and feelings. This process resulted in a re-understanding of the relationship between individual factors and music emotion judgment through a computational modeling perspective. In addition, our work is of practical value, because the models constructed in this study may improve the traditional MER system and may indirectly contribute to the personalized MIR and music recommendation systems.
We first compared the predictive effect of individual perceived emotions (personal MER model) and average opinions of perceived emotions (general MER model) to investigate whether we must consider individual differences. The results support the argument that the MER models, using audio features as the only input, are less effective in predicting individual emotions. This finding further proves that individuality plays a critical role in making an MER system effective in practice.
Next, we investigated the role of individual factors in perceived emotion recognition by gradually adding individual features to the basic MER models based on audio features. After adding stable individual features, all the models performed worse, and this showed that stable individual features were not effective information for our models. By contrast, the increase in redundant information reduced the effect. Similar to the conclusion of Y. H. Yang, Su, et al. (2007), that is, individuality is too subtle to be captured by each single individual factor, the combination of several stable individual factors considered in our experiment is also insufficient. It is necessary to exploit other individual factors, such as absorption (Herbert, 2013; Kreutz, Ott, Teichmann, Osawa, & Vaitl, 2008), rumination (Garrido & Schubert, 2013), and so forth, to adequately describe individuality. Compared with stable individual features, adding real-time features significantly improved the effectiveness of our models. This means an individual’s perception of music emotion is affected by the state of the individual after receiving music stimulation. However, from a practical point of view, real-time features, currently, are difficult to widely use in the personalized MER model because they are difficult to obtain.
We also constructed recognition models for felt emotions and assessed the role of individual factors. We found that the positive effect of individual features on the feeling models is higher than on the perception models. Because perceived emotion and felt emotion are the “objective” and “subjective” aspects of music-elicited emotion (Gabrielsson, 2001), from a theoretical perspective, we suspect that emotions evoked by music are more susceptible to the individual’s own state than the objective judgment of the emotions expressed by music. Some studies reported the relationship between individual variables and the gap across perceived and felt emotion (e.g., Kallinen & Ravaja, 2006), which indirectly support the above assumption, but we still need further research. From a computational modeling perspective, this result illustrates the close relationship between individual factors and the felt emotion of music. Compared to using only music features for recognition (e.g., Koelstra et al., 2011), this result is a reminder that we should consider individual factors to enhance model’s effect in the process of modeling the recognition model of music emotion.
In addition, we observed that the features that are more relevant to the prediction target in correlation analysis often contribute more to the prediction models. This reminds us that the statistical results of experimental studies can also provide a reference for the selection of input features in modeling applications. Finally, we used the value of the coefficients to interpret our final models, and this allowed us to observe the importance of each feature in the model. We observed that, both for perceived emotions and felt emotions, the corresponding felt emotion or perceived emotion was the most important feature. And individual features can provide more information for feeling models. This result further illustrates the importance of individual features in the prediction of felt emotion.
Our work is also of practical value. As mentioned earlier, music emotion information has been widely used in various fields (e.g., MIR; Downie, 2008; Wang et al., 2012). And MER, a research area investigating computation models to automatically recognize the emotion of music, is an important part of the research on digital music applications (Dobashi et al., 2015). In this study, we improved the effect of individual MER models by adding individual features as model inputs. Therefore, our work provided a reference for the creation of personalized MER systems, which can provide individuals with more accurate emotion information of music.
This study has several notable limitations. First, the audio features that considered input in our models were not studied in depth in the modeling process, and they may only be a subset of the full profile of features actually processed by listeners. In further modeling research, feature selection and processing methods must be consistently updated to achieve optimal results. Second, our modeling attempts were handicapped by the size of our dataset. However, participants have difficulty annotating a large number of audio recordings, and the quality of annotation may also decline because of fatigue or other reasons. Thus, a better means to collect the labeling results is necessary. Third, the combination of several stable individual factors was not of great help to MER, and we suggested the exploitation of other individual factors to adequately describe individuality. From the perspective of theoretical exploration, follow-up work is of great significance. However, from a practical point of view, discovering and collecting a large number of stable individual features is not necessarily easier than collecting individual real-time features. Therefore, in the modeling processes, trade-offs must continue to be made between the two aforementioned methods. Finally, when choosing the ML method, we only referred to the prediction effect of the models, without considering the interpretability. Fortunately, BR, which has good interpretability, performed best in this study. Notably, most of the models developed with flexible methods tend to be powerful in terms of fitting the training data, but the flexibility of methods is opposite to the interpretability of methods (Hastie, Tibshirani, Friedman, & Franklin, 2005). Therefore, when interpreting mechanism exploration, we suggest adopting more interpretable methods. And when pursuing model effects, more flexible methods, such as deep neural networks (Orjesek, Jarina, Chmulik, & Kuba, 2019; Zhou, Chen, & Yang, 2019), convolutional neural networks (Malik et al., 2017), recurrent neural networks (Liu, Fang, & Huang, 2019; Malik et al., 2017), and so forth (e.g., Dong, Yang, Zhao, & Li, 2019) can be used.
Conclusion
In this study, we used ML methods to form relations among audio features, individual factors, and music emotions. We observed that (a) the MER models, using audio features as input only, are less effective in predicting individual emotions than the mean opinions; (b) stable individual features have no positive effects on MER models, but real-time individual features can significantly improve the model’s effect; and (c) the individual features have greater effects on feeling models than those on perception models. Our work investigated the relationship between variables, constructed models with practical value, and provided a reference for the creation of personalized MER systems.
Supplemental Material
Supplemental_material – Supplemental material for Effects of individual factors on perceived emotion and felt emotion of music: Based on machine learning methods
Supplemental material, Supplemental_material for Effects of individual factors on perceived emotion and felt emotion of music: Based on machine learning methods by Liang Xu, Xin Wen, Jiaming Shi, Shutong Li, Yuhan Xiao, Qun Wan and Xiuying Qian in Psychology of Music
Footnotes

References
Supplementary Material
Please find the following supplemental material available below.
For Open Access articles published under a Creative Commons License, all supplemental material carries the same license as the article it is associated with.
For non-Open Access articles published, all supplemental material carries a non-exclusive license, and permission requests for re-use of supplemental material or any part of supplemental material shall be sent directly to the copyright owner as specified in the copyright notice associated with the article.
