



Abstract
Preferences are essential in explaining consumer choice and have been studied from different standpoints. Some empirical studies aimed at measuring music preferences have used direct procedures (i.e., list of genres), while other studies have used indirect measures (i.e., listening to excerpts of music). This article focuses on analyzing music-genre preferences to identify whether they differ depending on the type of measure used (direct vs. indirect), studying their consistency. A survey was conducted among 753 individuals. The results highlight not only the discrepancies of using one measure or another but also the relevance of familiarity and experience, associated with individuals’ endowment of cultural capital. Findings explain the (in)consistency of reported preferences through direct and indirect means. All in all, the research suggests that direct and indirect methods to measure music preferences may be capturing different dimensions.
Keywords
Preferences have been widely analyzed in social sciences and psychology research due to their influence on individuals’ choices and behaviors. As the literature notes, preferences are influenced and shaped by many different variables, from individuals’ objectives and values (Coolen & Hoekstra, 2001), to cognitive constraints and experience (Warren et al., 2011) or demographic, social, cultural, behavioral, or psychographic characteristics. In the case of music, preferences can be determined by distinctive variables such as personality (Dollinger, 1993) or listening behavior (Dunn et al., 2011). This topic has been empirically analyzed from many different disciplines over the last decades for a variety of purposes.
Specifically, the relationship between preferences and different determinants have been analyzed from educational (Droe, 2006), sociological (Van Eijck & Lievens, 2008), psychological (Rentfrow & Gosling, 2003), and economic (Fernández-Blanco et al., 2017) standpoints. The factors explaining music preferences, unsurprisingly approach-dependent, are connected to music training, social identity, personality, and socio-economic characteristics, among others.
After conducting a literature review of mainly musicology studies, Droe (2006) notes that factors influencing music preferences are familiarity, through listening and performance; teaching method; music education; and social influence or significant others’ opinion (peers and adults). Parenting styles are also associated with musical taste, as Warren et al. (2011) point out. Other studies have identified the relationship between music preferences and socio-economic class, with upper-class and well-educated individuals preferring “high-brow” music genres and working-class and less educated individuals preferring “low-brow” music (Katz-Gerro, 1999; Van Eijck, 2001). This confirms that the symbolic nature of music favors self-expression, social identity, status, and membership of social spaces (Larsen et al., 2010). According to Prior (2013), however, the idea of music preferences reflecting and reproducing inequalities between social classes (originally stated by Bourdieu) has been challenged as new approaches have emerged. In addition, abundant sociological literature has focused on the theory of cultural omnivores (Peterson, 1992), according to which a wider variety of high and popular cultural activities is consumed by individuals with higher levels of income and education.
Music preferences have been linked to personality as well. In particular, Rentfrow and Gosling (2003) have found that individuals with strong preferences for sophisticated styles, like classical music, opera, or jazz, score high on psychological measures of creativity, curiosity, intelligence, and political liberalism. There is also evidence that people who enjoy intense styles of music, like rock, heavy metal, and punk, score high on psychological measures of thrill-seeking and openness, and also value freedom and independence (Rentfrow & Gosling, 2003, 2006; Zweigenhaft, 2008). These results were confirmed by Chamorro-Premuzic and Furnham (2007), who studied the relationship between personality and individual ability and uses of music, and also by Delsing et al. (2008) who focused on adolescents.
Furthermore, Mellander et al. (2018, p. 612) find that music preferences can also reflect and reinforce dimensions of political and economic divides. Their research was based on the idea that geographic variation in music preferences is connected to underlying economic and political divisions in American society. Results showed that “places where people prefer sophisticated and contemporary music are more affluent, educated and liberal” while “places where people prefer unpretentious and intense music are less advantaged, more working class and more conservative.” This is in line with Fox and Wince (1975) who had already found that people from small farm towns preferred folk, rock, and country music, while individuals from larger regions preferred jazz and blues music. Similarly, Fernández-Blanco et al. (2017) aimed to identify different groups of music consumers to analyze the connection between the observed diversity of musical consumption and the socio-economic characteristics of its audiences.
This research draws on quantitative analysis to improve the understanding and knowledge of music-genre preferences and how these are consistently or inconsistently reported depending on the method used to approach them. Literature suggests that direct and indirect measures could produce different outcomes so we address the measurement method itself. Direct and indirect music-genre preference measures are compared to uncover expressed and underlying preferences. This approach highlights individual’s discrepancies and inconsistencies and associated factors. The main contribution of this article is to provide a detailed assessment of direct and indirect methods of preference reporting applied to music genres.
With that purpose, the article begins with a multidisciplinary literature review of preference measures. Then there is a description of the empirical survey, its objectives and methodology, followed by an analysis of the results of different multivariate techniques; and finally, a discussion section.
Preferences and their measurement
Preferences play a key role in individual’s behavior helping explain consumer choice. According to Warren et al. (2011), preferences are sensitive to context, and influenced by goals, cognitive constraints, and experience. Making a decision involves the individual choosing an action or option, conducting and/or experiencing it, and evaluating its result. That information will be stored in memory and, across similar experiences, it will help to generate a preference in the individual, conditioning future decision making (Hutchinson et al., 1994).
Although most of the research focuses on preferences as a general term, Warren et al. (2011) highlight two different perspectives: preference can match with choice or willingness to pay (Simonson, 2008) or with a latent tendency to consider something desirable or not (Zajonc, 1980). Derived from both interpretations, Warren et al. (2011) use the label expressed preference for the first approach, mostly linked to economics and behavioral decision theory, and the label underlying preference for the second approach, more considered by psychology. Some similar terms, such as rational and inherent preferences (Dhar & Novemsky, 2008) or explicit and implicit preferences (Friese et al., 2006) have been also used in the literature.
Justification for this different terminology comes mainly from the debate on whether preferences are constructed at the moment of making the decision. According to Utility Theory, preferences differ from one individual to another, but are stable for each individual (Rabin, 1998), the implication being that preferences are retrieved at the time of choice. However, literature provides support for preference instability (e.g., Tversky & Kahneman, 1981; Van Osselaer et al., 2005) suggesting that preferences are assessed every time a decision-making process takes place. Several factors can influence preference reversal, such as the specific options available in the choice set (Simonson, 1989), the framing of choice information and the context (Chartrand et al., 2008; Kivetz et al., 2008; Tversky & Kahneman, 1981), or the way in which preferences are measured (Slovic, 1995). We are specifically interested in the different ways of measuring preferences that may provide different outcomes.
Although to a large extent individuals act on the basis of their cognitions (knowledge, preferences, and beliefs about the world), stored in memory (Alba et al., 1991), they do not always do so (Friese et al., 2006). Accordingly, when taking into consideration memory measures to know individual preferences, it is relevant to think carefully about the task used to retrieve the information from individual’s memory, as different tasks (direct or indirect) make different informational demands on the individual (Richardson-Klavehn & Bjork, 1988).
Direct memory measures are those in which the “instructions at the time of the memory test make reference to a target event (or target events) in the personal history of the subject” (Richardson-Klavehn & Bjork, 1988, p. 477); individuals provide information without conscious processing (Schacter, 1985, cited by Weinberger et al., 1985, pp. 351–379) and typically do not perceive their memory is being tested (Abernathy et al., 2013). In contrast, indirect memory measures require “the subject to engage in some cognitive or motor activity, when the instructions refer only to the task at hand, and do not make reference to prior events” (Richardson-Klavehn & Bjork, 1988, p. 478).
Several studies in the literature measure music preference directly with a list of music genres or styles gathered from different backgrounds. Delsing et al. (2008) use a list of 11 established categories of music, with items from interviews with retailers and a pilot study. Fernández-Blanco et al. (2017) draw on data from an official nationwide survey to identify clusters of music listeners with a list of 20 music genres. Similarly, in the study by Mellander et al. (2018), participants were asked to select music styles from the ones provided by the authors. In summary, these studies analyze music preferences through direct measures that only capture expressed preferences.
In contrast, other studies measure music preference with indirect tools. Dunn et al. (2011) consider music preference is difficult to analyze using genre labels due to their ambiguity, confusion, and overlapping, and so they include listening behavior along with direct measurement; specifically, a listening database of audio recordings plus a list of 16 music-genre categories according to an industry standard. Among authors only considering indirect measurement techniques, Alpert (1982) made participants listen to 30-s excerpts of rock, country, and classical music to examine the effects of peers and adults on music preferences. A decade later, Madsen et al. (1993) undertook a survey to analyze the aesthetic response to music, asking participants to respond to selections from well-known operas and classical pieces. Schubert (2007) aimed at measuring internal and external locus or emotions on listening to five pieces of romantic Western art music. The induction of emotions while listening to 25 excerpts of classical music, representing different emotions, had to be individually assessed (Kreutz et al., 2008). Finally, in Schäfer and Sedlmeier (2010), study participants listened to six pieces of different music genres (classical, rock, pop, electro, rap, and beat music) derived from a previous factor analysis plus one of their favorite pieces of music with the purpose of investigating determinants of music preference.
Motivated by the aforementioned discussion, and given the inherent problems of attempting to compare results from different studies, in this article, we analyze whether music-genre preferences differ depending on how participants are asked about this issue. We also put forward that preferences, and consequently music tastes and the choice of music genre(s), need not be consistent as they can be affected by a framing effect. More precisely, we consider that results from direct and indirect measurements will differ, showing a discrepancy between expressed and underlying preferences. In addition, the role that familiarity, due to music training (Madsen et al., 1993), or experience of arts consumption or participation (Colbert & St-James, 2014) in music preferences measures needs to be considered. Both these aspects are assumed to be associated to an individual’s endowment of cultural capital (a measure of the skills or competences to assess and process cultural products and services) and consequently affect the ability to correctly assess music genres.
Method
Empirical research was conducted to identify discrepancies in music-genre preferences emerging from the use of both direct (expressed preferences) and indirect (underlying preferences) procedures. This statement is put forward in the following hypothesis:
If evidence supports inconsistency in the assessment of individual preferences (i.e., H1 is supported), a further step in the analysis is to identify which factors influence these discrepancies. Based on the literature, we formulate the following hypotheses:
The empirical research was conducted in the form of personal survey using a structured questionnaire. The questionnaire was divided in three parts: (1) Habits, regarding performing arts (including music) consumption and practice; (2) Music preferences, in relation to music genres, and (3) Classification, including main socio-demographic variables. Different scales of measurement were used as suggested by the literature review. Specifically, music-genre preferences were measured using self-reported data (see Rentfrow & Gosling, 2003).
Indirect measurement involved participants listening to 14 different songs, one at a time, for 40 to 50 s each, following Schubert (2007), Schäfer and Sedlmeier (2010), Rentfrow et al. (2011), and Floberg and Brown (2013). Participants had to answer first whether they had heard the tracks before and then assess their likings using a 5-point Likert-type scale. Every song was carefully selected by three experts, who matched each song to 1 of the 14 music genres considered. In addition, experts were asked to ensure that songs in the choice set had different levels of notoriety for subsequent analysis of individuals’ familiarity with music. In addition, songs were randomly presented to participants. Thus, this indirect technique allowed us to measure underlying preferences.
Note that the decision of making individuals listen to just one excerpt per genre was based on two reasons. First, the inappropriateness of requiring participants to assess a large number of stimuli (songs or excerpts of music) in a short time. This could lead to a tiredness effect making them unable or unwilling to answer. Second, the selected songs represented adequately the genres to be assessed. To check this, a qualitative previous study was undertaken with 10 individuals. They were asked to listen to all 14 excerpts, one at a time, and match them to one genre in a table provided. Song excerpts were correctly associated to prespecified genres.
The direct measure consisted of presenting participants with a list of 14 different music genres so they could evaluate how much they liked them on a 5-point Likert-type scale as in the study by Delsing et al. (2008). The list was elaborated reducing the 20 initial items in the classification provided by the Spanish Survey on Cultural Habits and Practices (Ministerio de Cultura y Deporte, 2019) to 14 final items, by grouping related genres (e.g., techno and dance or folk and ethnic) to avoid participants’ fatigue. With this procedure, expressed preferences were measured.
Quota sampling (age and gender) was used to select respondents from a population of individuals between 18 and 65 years old. Data collection took place in November 2018 coordinated from Valencia, Spain. Thirty appropriately trained fieldworkers of different nationalities were told to interview 25 accessible units (friends, relatives, colleagues, neighbors, etc.) face to face, following the established quotas. The number of participants interviewed was 755. Two of the interviews were incomplete, and so these participants were removed from further analyses. After these cases were rejected, a total sample of 753 participants’ responses was used in the analyses of results. The answers recorded on paper questionnaires by the interviewers were transferred to a spreadsheet. Then, after producing the dataset, univariate (frequency distribution and mean) and multivariate analyses (multiple correspondence analysis [MCA] and multilevel logistic model) were performed to statistically process the information to verify the hypotheses.
The sample consisted of 49.7% women and 50.3% men. Mean age was 38.93 years old. With respect to education level, 45.8% had university studies, 31.2% high school, and 21.0% primary-secondary school. Regarding personal status, it is noticeable that a large majority (77.0%) had no children in their charge, and many (63.2%) had partners. Two thirds of the sample were actively in the labor market: employees (48.5%) and self-employed (14.3%). Finally, students were 25.5% of the sample and participants were from 33 different nationalities.
Results
Music preferences
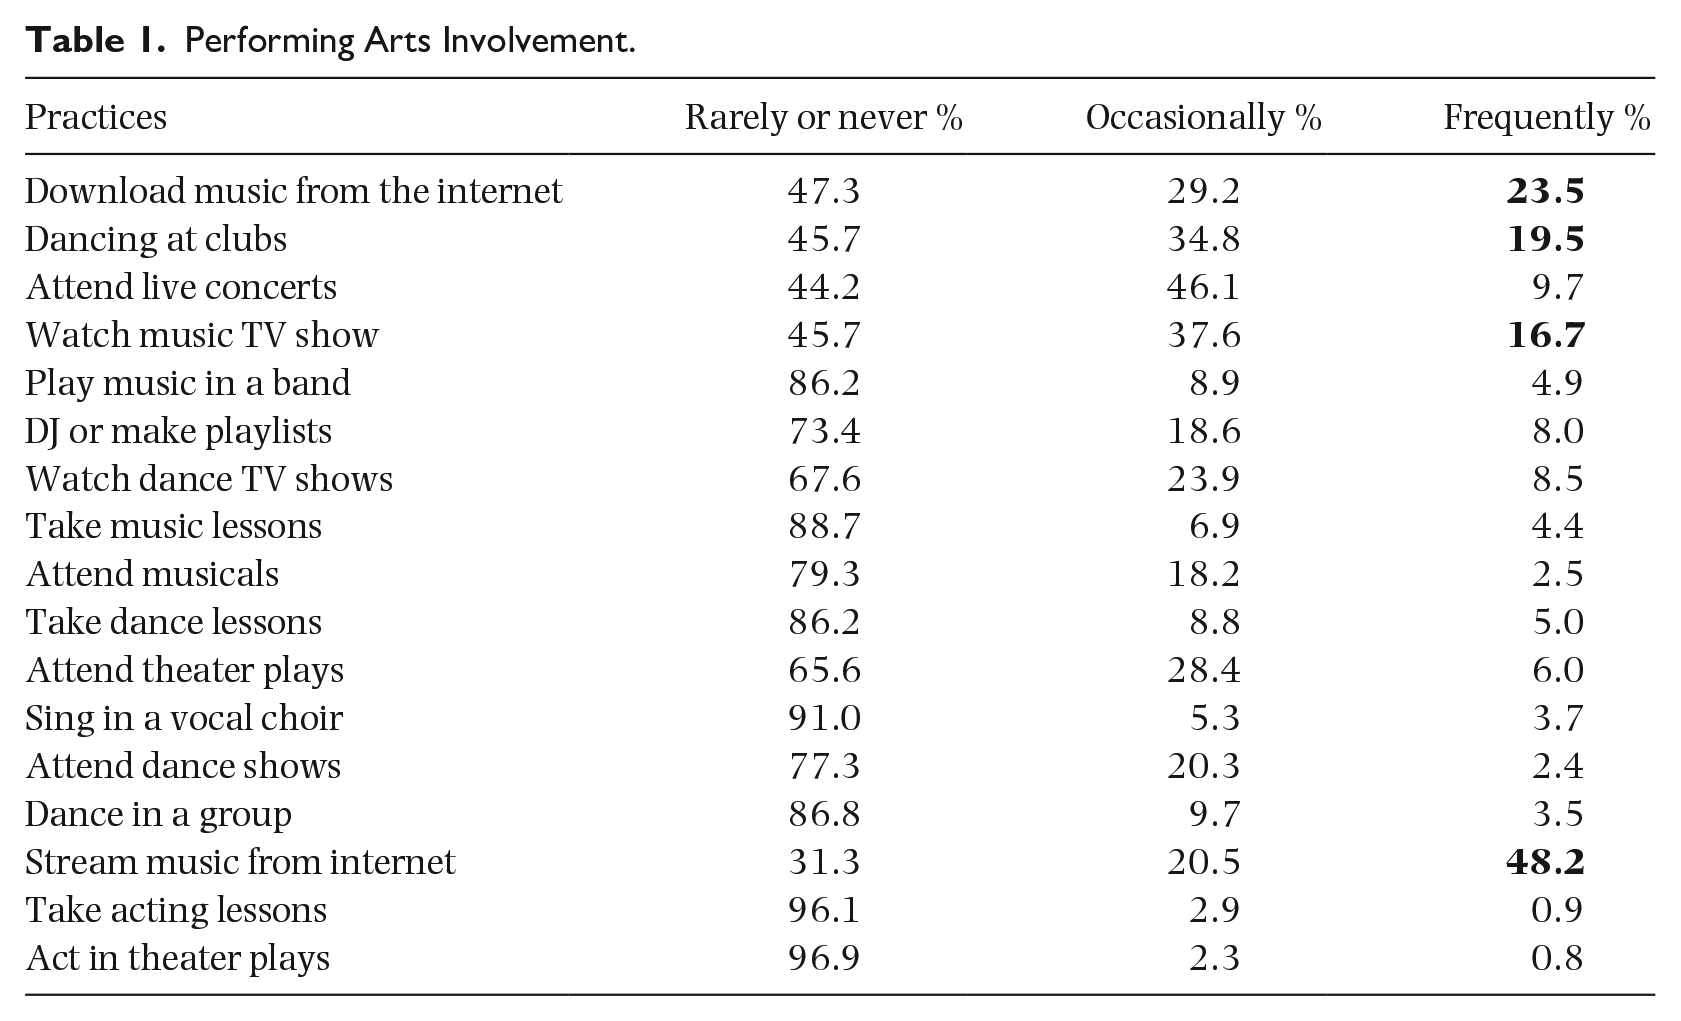
Survey participants were first presented with a variety of performing arts activities, including music, theater, and dance, to find out how often they practiced or consumed them (Table 1). In the frequently column, the top 4 in bold, out of 17, were related to music. Streaming music was remarkably ranked first (48.2%), then downloading music from the internet (23.5%), dancing at clubs (19.5%), and finally watching music TV shows (16.7%). None of the others got a response percentage higher than 10%. Among the least popular ones were acting in theater plays (0.8%) and taking acting lessons (0.9%).
Performing Arts Involvement.
Summary statistics of participants’ assessment of music genres are displayed in Table 2. Average scores for underlying and expressed preferences across genres are shown in columns 2 and 3. Top ranking genres by underlying preferences are Singer-songwriter (3.84 out of 5), R&B and soul (3.68), and Electronic and techno (3.59). On the contrary, the most preferred music genres when participants graded a list of genres (expressed preferences) were International pop-rock (3.73), Singer-songwriter (3.47), and Spanish pop-rock (3.43). These findings suggest that music-genre preferences differ depending on the type of measure considered and so we proceeded to analyze discrepancies over music-genre preferences according to the instrument used (as well as participants’ familiarity and experience with music).
Reported Music-Genre Preferences by Song (Underlying) and Label (Expressed).
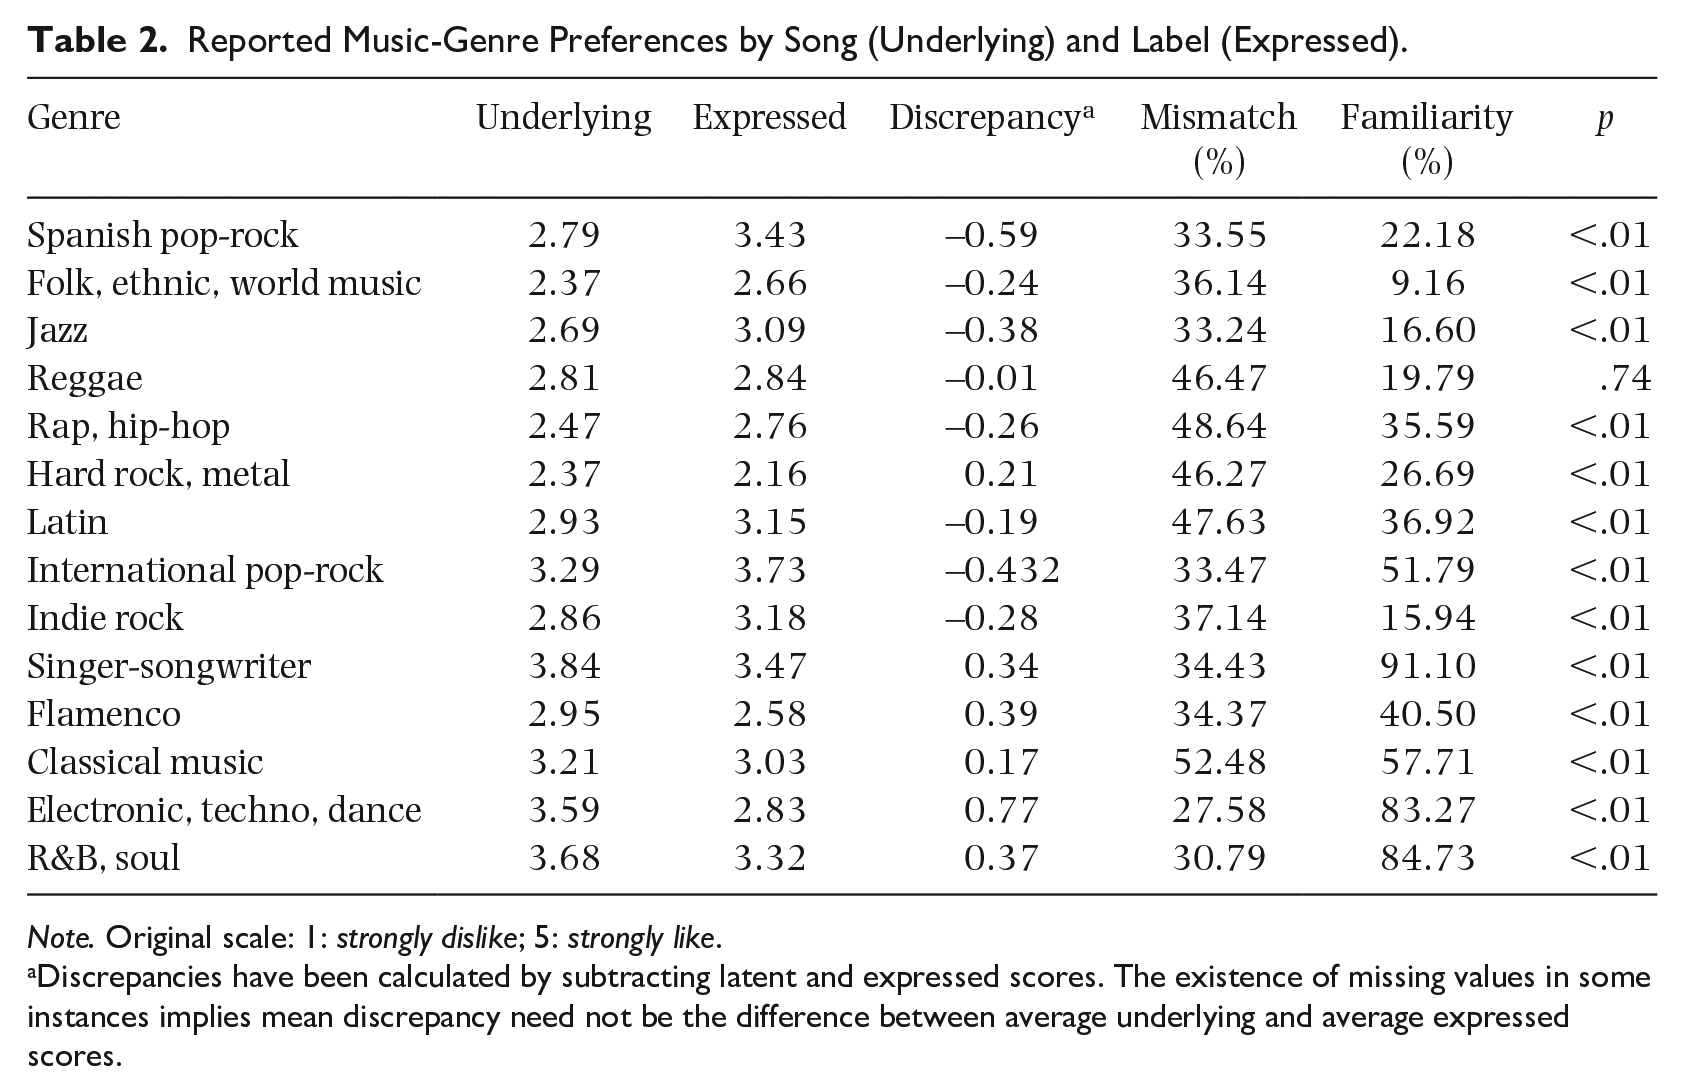
Note. Original scale: 1: strongly dislike; 5: strongly like.
Discrepancies have been calculated by subtracting latent and expressed scores. The existence of missing values in some instances implies mean discrepancy need not be the difference between average underlying and average expressed scores.
Discrepancies in assessing music-genre preferences
Table 2 not only analyzes the average assessment of the different genres, including scores for underlying/expressed preferences, but also the average discrepancy between them, measured as the difference between reported underlying and expressed preferences (discrepancy). The table also shows the percentage of individuals whose assessments using both instruments disagree (mismatch %) and the percentage of individuals who had heard the track before to assess underlying preferences (column labeled familiarity %).
Based on these metrics, Singer-songwriter (average underlying/expressed score = 3.84/3.47) has an average discrepancy of 0.34. Overall, 34.43% of the individual assessments disagree and 91.10% of the participants had already heard the selected track (high familiarity). Choosing a different genre, International pop-rock (average underlying/expressed score = 3.29/3.73) shows 33.47% disagreement, similar to the previous genre, while 51.79% of the participants were familiar with the track (medium familiarity). At the opposite side of the spectrum, familiarity with Folk, ethnic, and world music is 9.16% (low familiarity) but discrepancy is again similar, 36.14%, with lower average scores for preferences (average underlying/expressed score is 2.37/2.66).
Finally, a paired-samples t test on mean difference was run to identify systematic deviations when assessing music genres through direct/indirect instruments. The p value for the null hypothesis (mean difference equals 0) is shown in the far right column of Table 2. Following two anonymous referee’s suggestions, and given the number of paired t-tests run, significance levels have been set to 0.1% to address the higher probability of Type I error. Results are conclusive because, with the exception of Reggae, the null hypothesis is rejected in all cases. All in all, the foregoing evidence supports H1 in all genres but one. We can therefore conclude that individuals’ assessments of genres differ depending on whether indirect (underlying) versus direct (expressed) measures are used.
Interpretation of discrepancies between underlying and expressed preferences
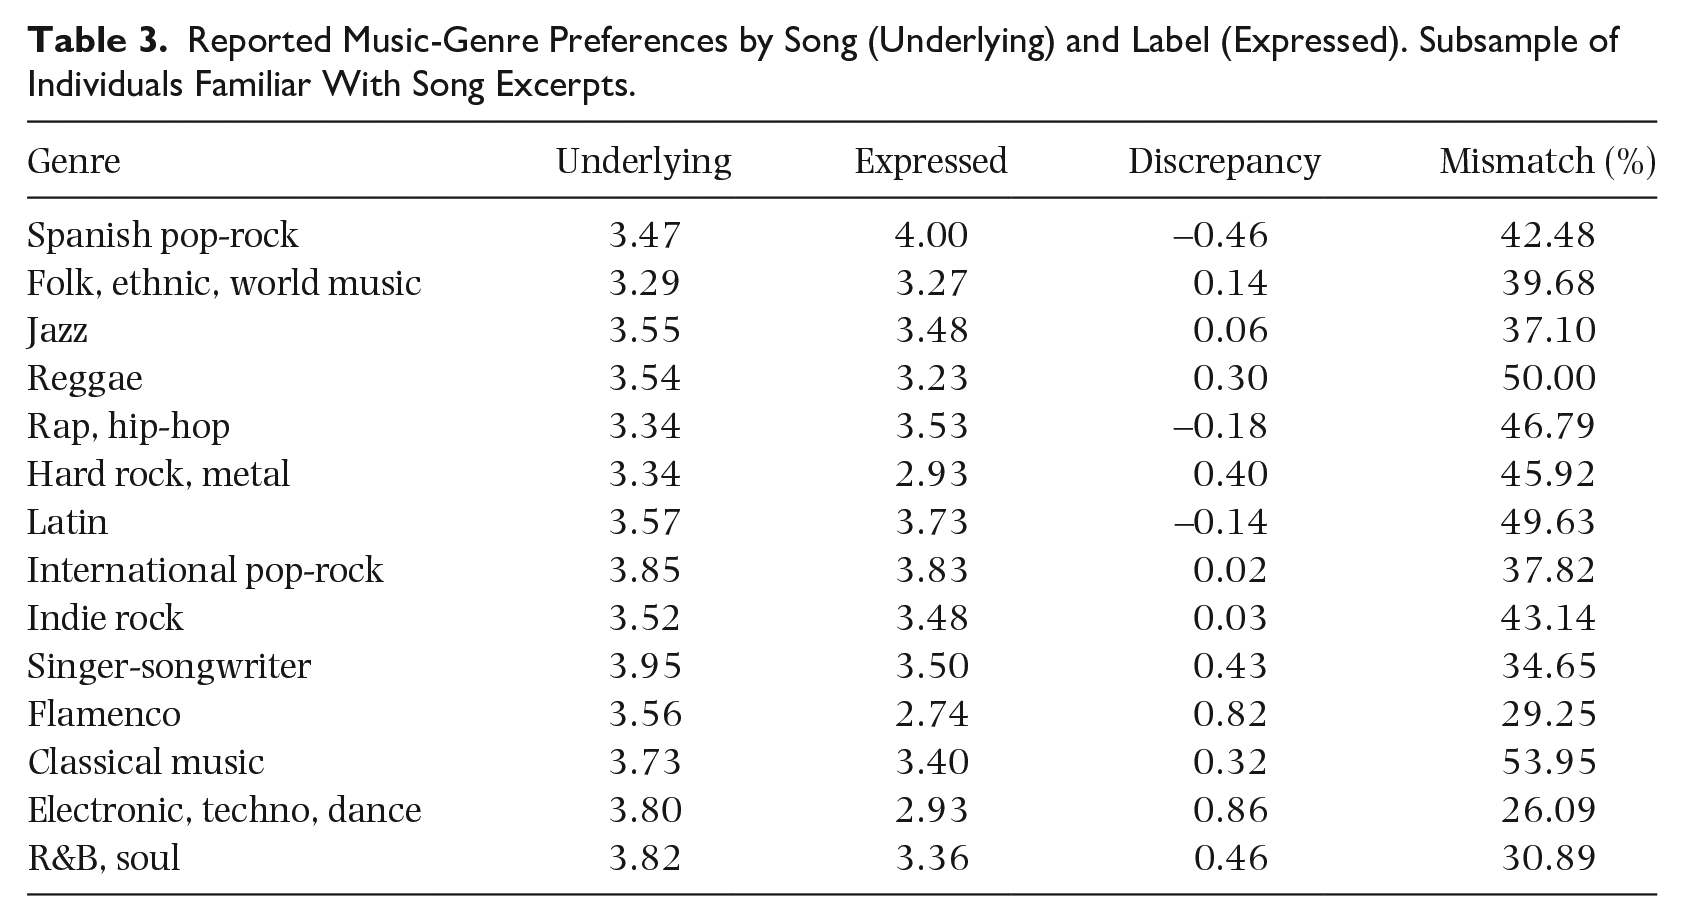
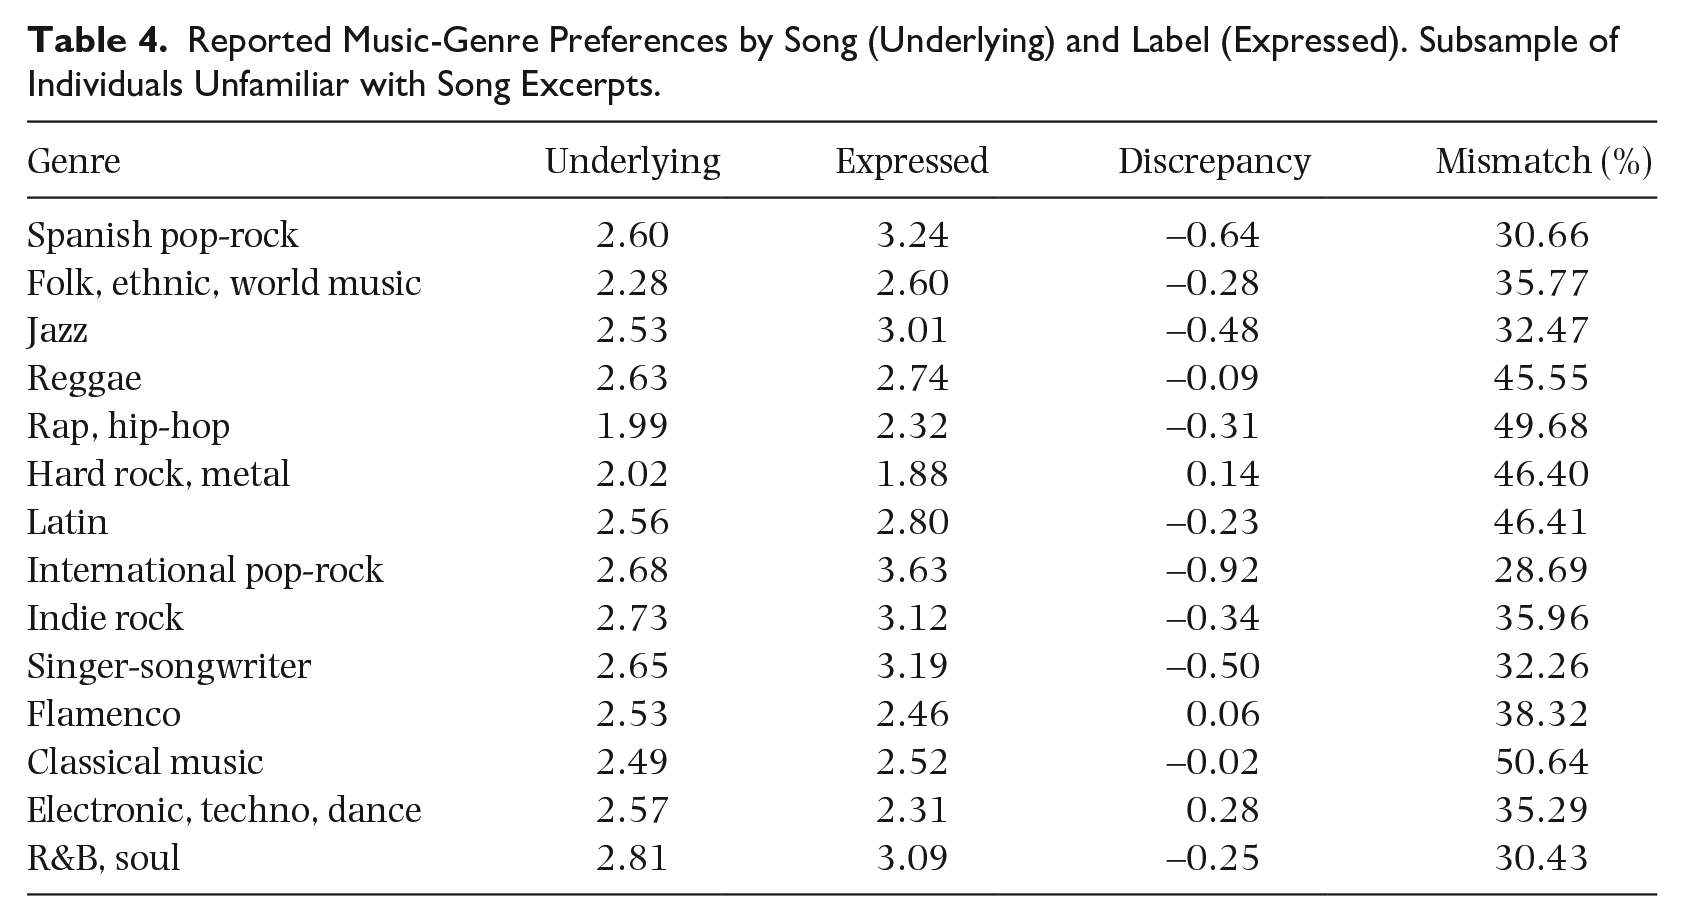
To control for familiarity when analyzing discrepancies, average results were conditioned on whether individuals were familiar with the songs they had to listen to while answering the questionnaire or not. This procedure yields two conditional distributions for music-genre preferences (underlying/expressed): Table 3 (participants had heard the song) and Table 4 (participants had not heard the song). In the first case, underlying scores are in most cases higher than expressed ones. Singer-songwriter (3.95), International pop-rock (3.85), and R&B and soul (3.82) obtained the three highest scores for underlying preferences. Table 4 shows that most discrepancies are negative, meaning that assessments through expressed preferences scored higher than those through underlying preferences, but both scores were lower than those shown in Table 3. The expressed preferences column shows that International pop-rock (3.63), Spanish pop-rock (3.24), and Singer-songwriter (3.19) were the most preferred music genres.
Reported Music-Genre Preferences by Song (Underlying) and Label (Expressed). Subsample of Individuals Familiar With Song Excerpts.
Reported Music-Genre Preferences by Song (Underlying) and Label (Expressed). Subsample of Individuals Unfamiliar with Song Excerpts.
Furthermore, assuming that discrepancies could be due to individuals measuring familiarity, namely, more familiar music will tend to get better scores, so discrepancy and familiarity were analyzed. The analysis only controls for average familiarity/discrepancy across genres so results must be taken with caution. Figure 1 shows the scatterplot for average discrepancy and familiarity by music genre, including the theoretical linear fit between both, which has a positive and significant slope (p value less than 1%). It also includes a (dashed red) reference line at the non-discrepancy locus, which splits the space into two parts. Genres above it show an average positive discrepancy, that is, participants’ direct assessment of a genre tends to be greater than indirect assessment. Below the reference line, genres exhibit an average negative discrepancy, that is, participants’ direct assessment of a genre tends to be lower than their indirect assessment. Overall, the plot also allows to classify genres in the familiarity-discrepancy space and singles out those with high familiarity and high positive discrepancy (Electronic, techno, and dance; R&B; and Singer-songwriter) and those with less familiarity and negative discrepancies (Jazz, Spanish pop-rock and Rap, hip-hop).
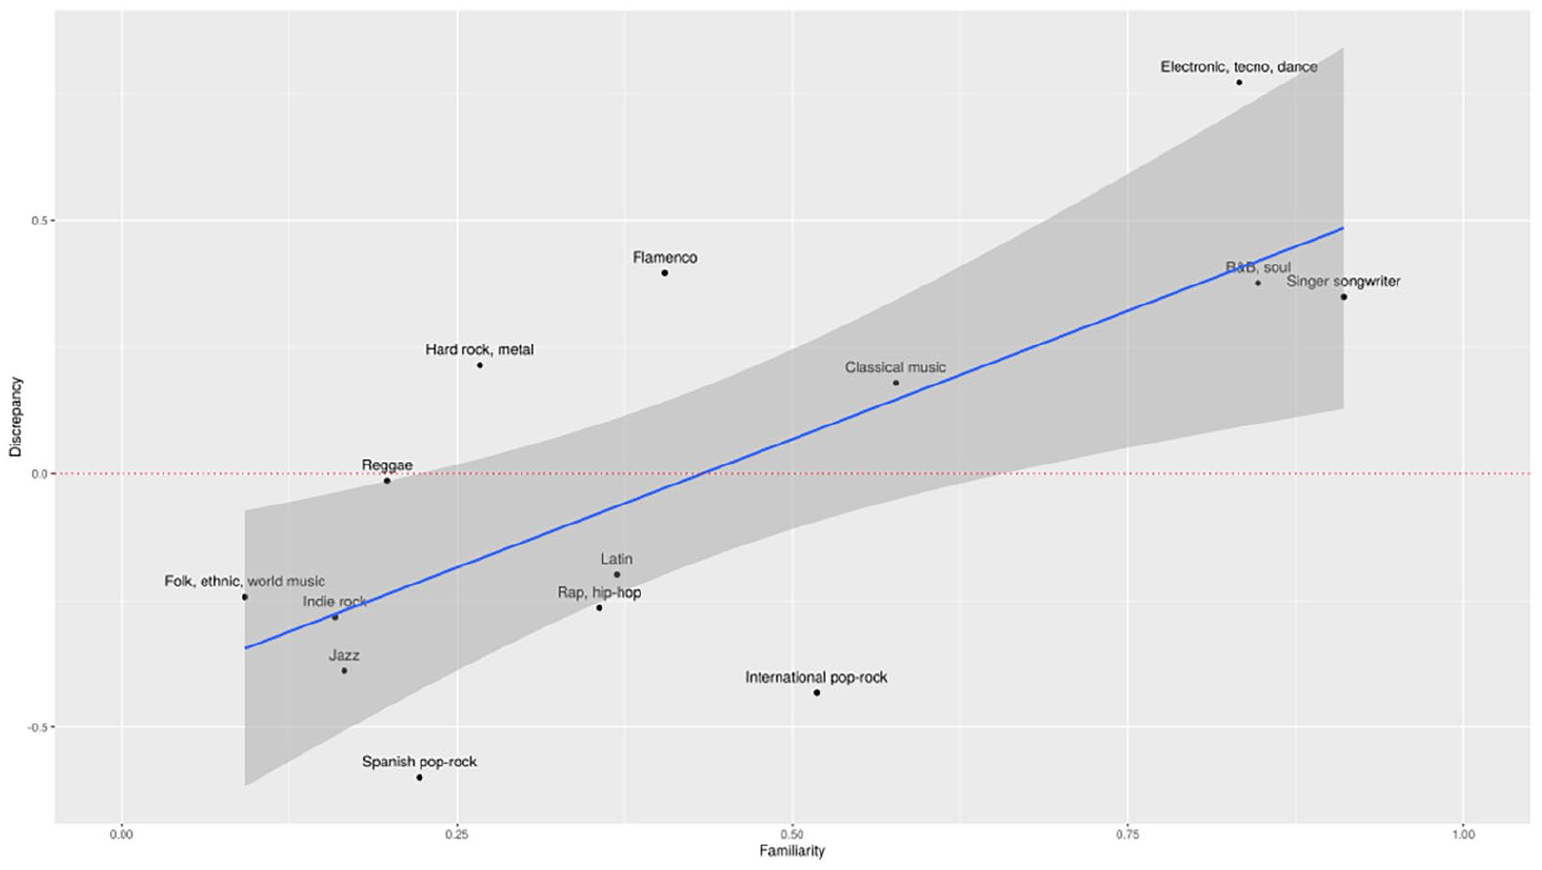
Scatterplot of Average Familiarity Versus Average Discrepancy.
While the above seems to suggest that average familiarity and discrepancies are positively related, we cannot take this exercise as hard evidence for the relationship between both variables at least for two reasons. First, this exercise shows the average relationship at genre level without any indication of what type of relationship holds at individual level. Second, we are not controlling for other factors that might be affecting assessment discrepancies. Therefore, a proper test of H2 is performed next when estimating a model to explain the observed inconsistencies in the assessment of genres.
Modeling discrepancies
Individual traits explaining discrepancies when assessing music genres are analyzed next. Specifically, we expect skills and competences allowing participants to consistently assess genres to be associated with personal traits, structural constraints, and the individual’s cultural capital. To formulate an operational definition of cultural capital, we resort to cultural participation. In this framework, it is considered a manifest variable of an individual’s cultural capital. In the rest of the section, we formulate and estimate a binary dependent variable model of the discrepancies in terms of observable individual traits (socio-demographic variables, education, and cultural capital as proxied through cultural participation) plus latent or unobservable features through the estimation of individual and genre-specific random effects.
First, to put forward and estimate a multilevel logistic model, discrepancies are mapped into a binary variable. In doing so, observed discrepancies are transformed into a dependent variable that defines two possible states (consistent/inconsistent) for each individual’s assessment of a genre.
Consistent assessment is defined when underlying and expressed preferences are roughly equal. When the two measurements differ by a tolerance not greater than ±1 points, the assessment is deemed to be consistent.
Inconsistent assessment happens when underlying and expressed preferences differ by more than the preset tolerance.
Figure 2 shows the distribution of the binarized discrepancies across genres. It displays both the unconditional (all individuals in the sample are included; top) and the conditional distribution (subsample of individuals unfamiliar with the specific songs they heard; bottom). The latter shows the genres sorted in terms of decreasing familiarity. From Figure 2, two things become apparent. First, discrepancies are genre-dependent, which could suggest an inherent complexity in the consistent assessment of certain music genres. Second, familiarity affects the distribution of consistency across genres.
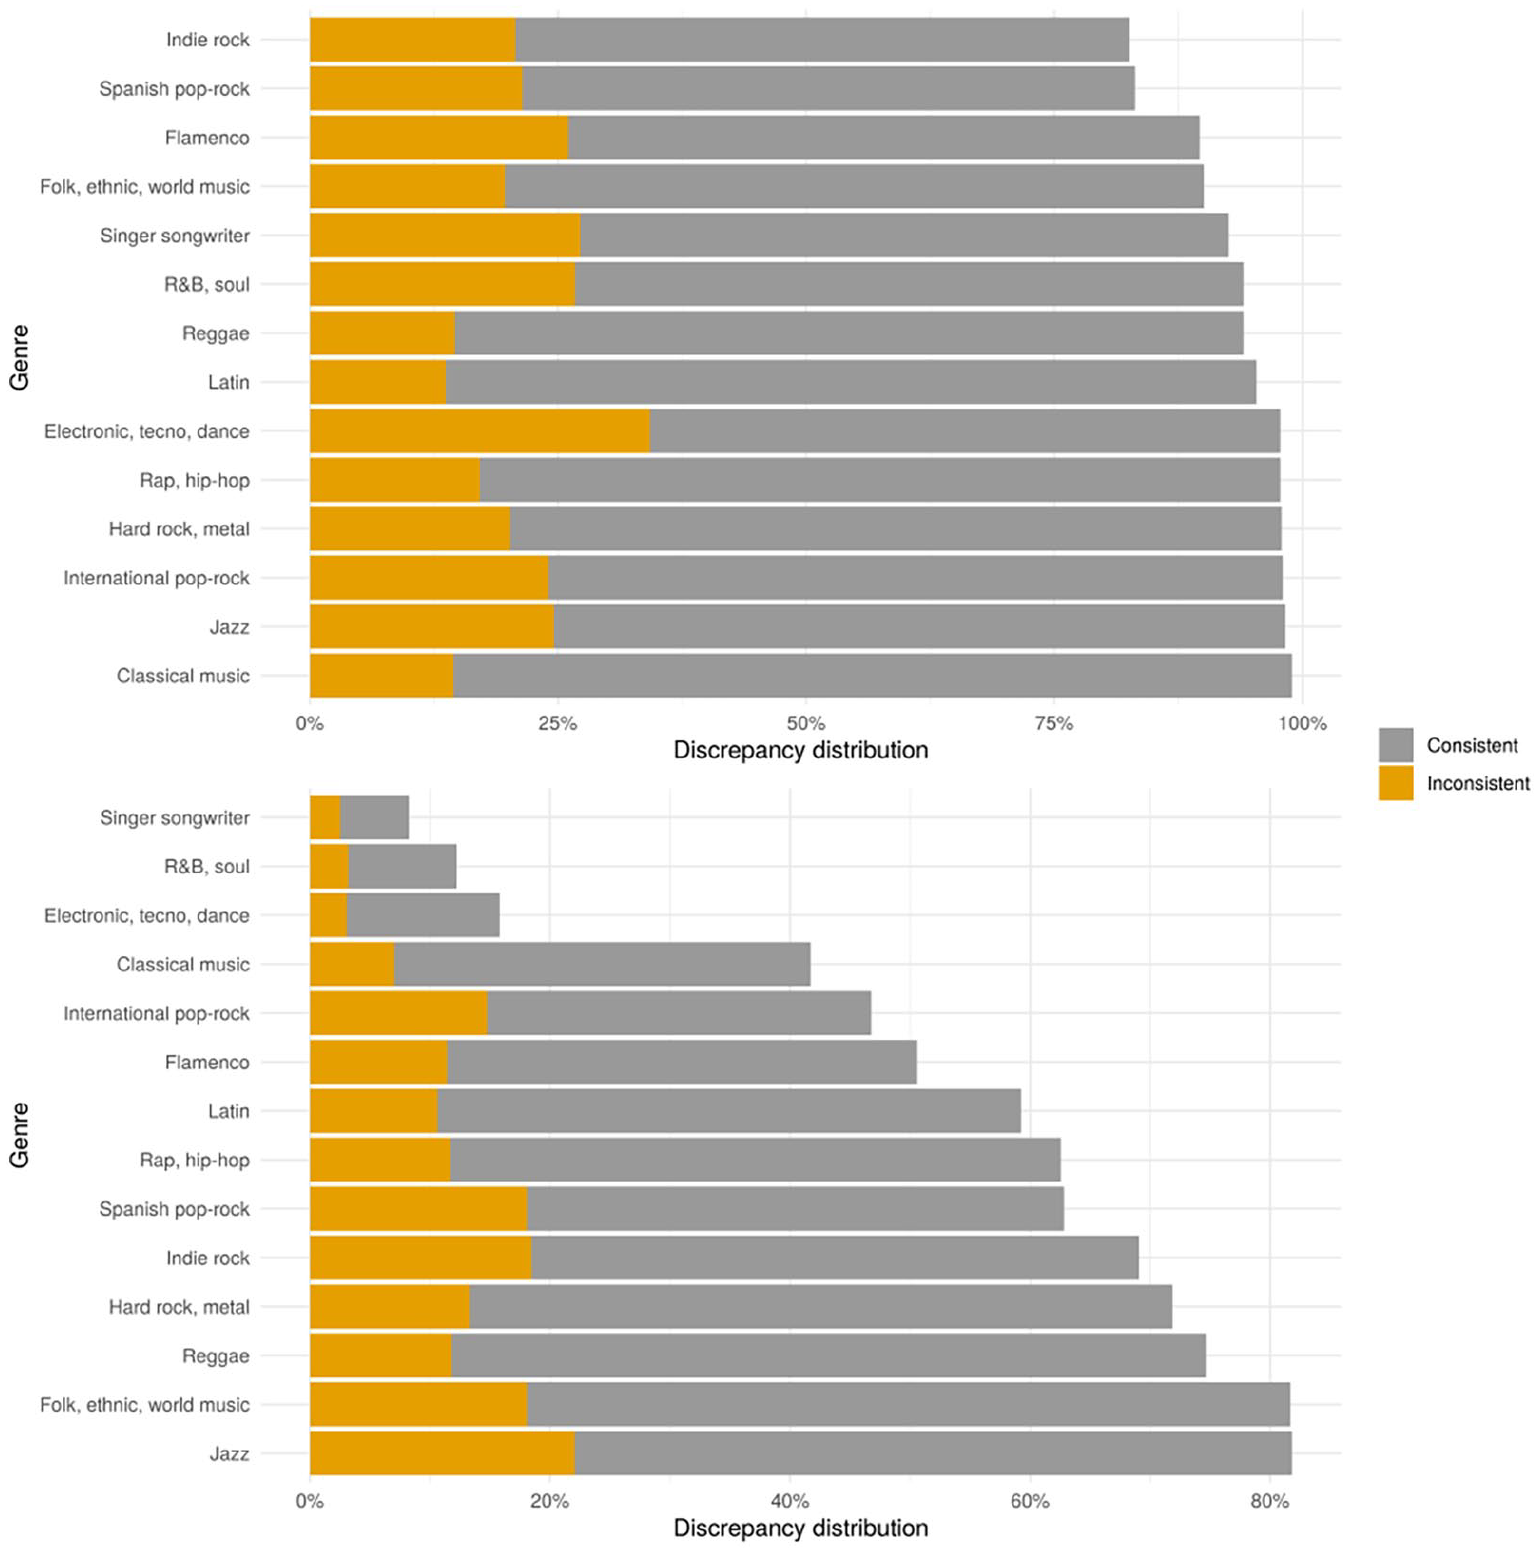
Discrepancy Distribution: Unconditional (Top) and Conditional on Unfamiliarity (Bottom).
As for the explanatory variables, we controlled for socio-demographics: (log of) age, gender, nationality (being Spanish), education (a factor with four levels: no completed education, primary-secondary, high school, university), workplace situation (a factor with six levels: student, self-employed, employee, unemployed, housekeeper, retired), and two binary variables to account for the personal situation of the survey-taker (has children/has partner).
In addition to socio-demographics, cultural participation is measured through a list of 17 items participants were presented with (see Table 1). To summarize these, they were transformed into binary variables (1 = frequently, 0 = occasionally/rarely or never) and a MCA was then applied. This approach allowed us to reduce the dimensionality of cultural participation into five variables or dimensions that account for more than 50% of the observed variability. These five dimensions can be summarized as follows:
Performing arts goers. This dimension scores higher for those mainly attending theater, dance, performances, and musicals; taking acting lessons; singing in a band or choir; and acting in theater plays.
Recorded music users. Scores are inversely related to downloading, streaming, dancing in clubs, performing as a DJ, or making playlists (i.e., higher values for this dimension mean lower recorded music participation).
Music participants. In this dimension, higher values increase the likelihood of playing music, taking music lessons, and attending live music concerts.
TV viewers. A dimension that is correlated to watching music and dance shows on TV.
Dance fans. This variable increases with a decreasing likelihood of taking dance lessons and dance in groups (i.e., the higher values for this dimension mean lower dance participation).
Furthermore, the model includes the binary variable familiar to control for whether or not individuals are familiar with the selected excerpt when assessing a genre indirectly (underlying preferences). Note that familiarity enters as an explanatory variable and as an interaction with the dimensions that measure cultural participation. Furthermore, a random slope for familiarity across genres is also included in the model (see below).
Finally, the estimation includes random effects. First, two random intercepts at the individual and genre levels to measure unobserved heterogeneity that emerges between individuals and genres. The individual-level intercept aims at capturing variability due to latent differences across individuals and not captured elsewhere in the model (i.e., it measures participants’ diverse proficiency in consistently evaluating genres). The genre-level intercept explicitly includes a measure of the intrinsic difficulty or complexity of different genres and how this translates into diverging individuals’ assessments through direct/indirect methods. Second, the effect of familiarity is allowed to randomly change at genre level.
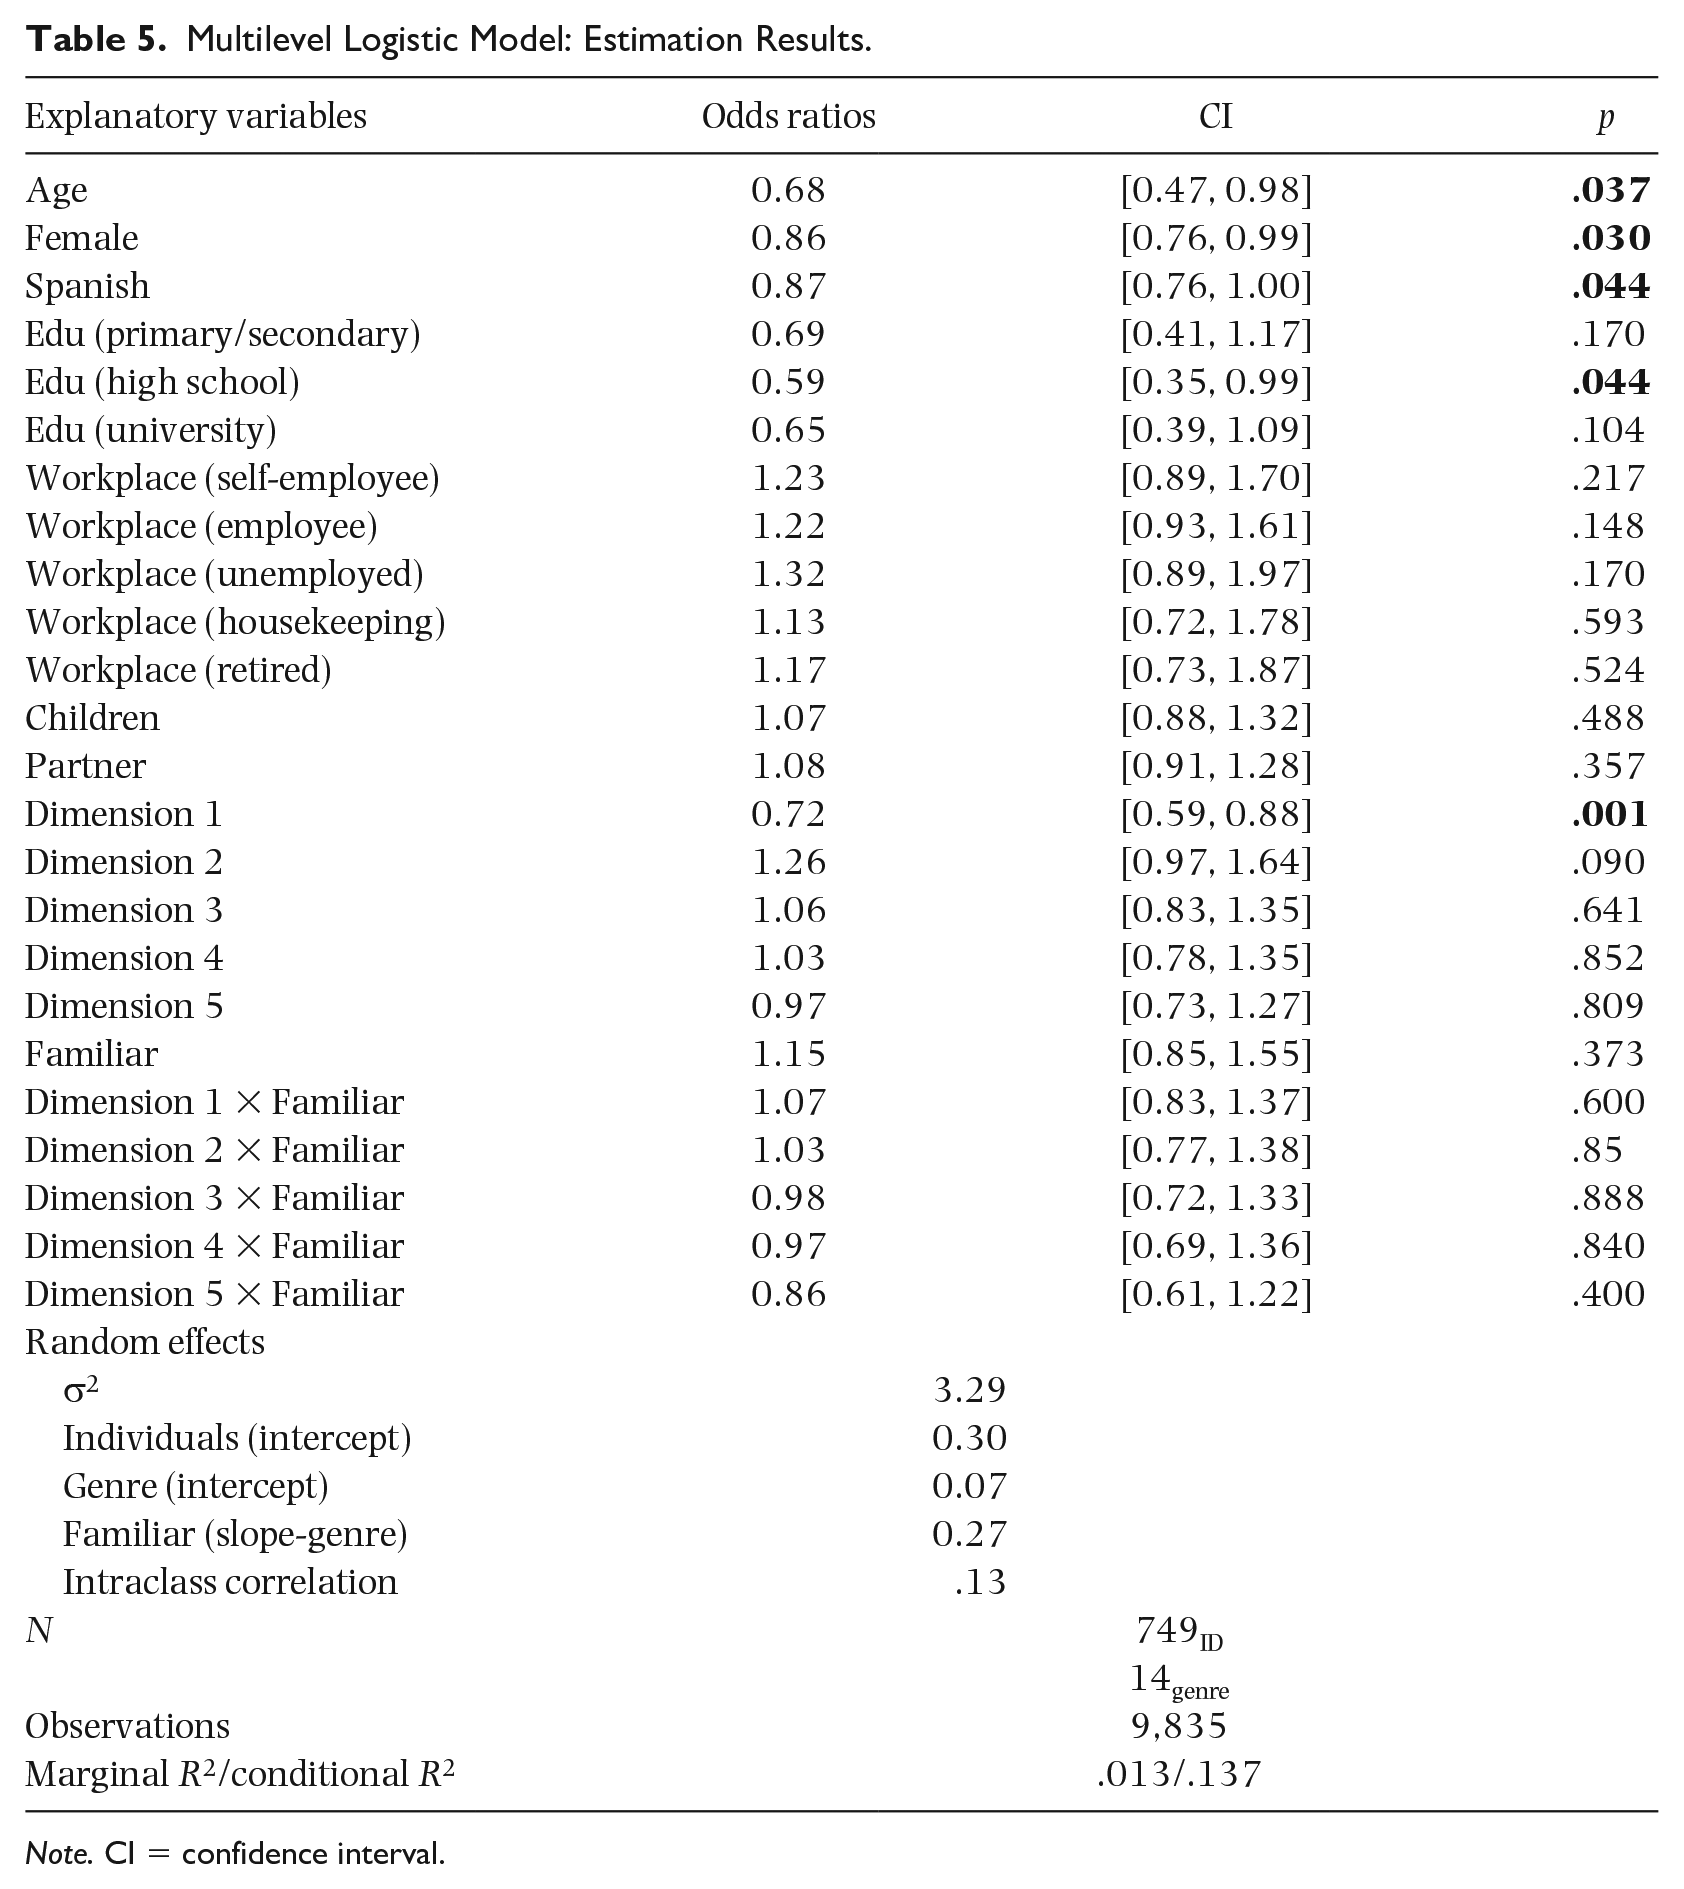
Estimation results are presented in Table 5. Coefficients are transformed into proportional odds ratio and 95% confidence intervals (CIs) and p values are included. A variable with a significant and greater than one odds ratio implies it increases the odds of consistency (other variables held constant). Conversely, a significant and less than one odds ratio (bold in the table) decreases the likelihood of a consistent assessment.
Multilevel Logistic Model: Estimation Results.
Note. CI = confidence interval.
Only a few socio-demographic variables are significant. The odds ratios for age (0.68), being a woman (0.86), being Spanish (0.87), and having a high school qualification (0.59), compared with the reference case of having no qualifications, are all less than one and so decrease the probability of consistently assessing music-genre preferences through direct and indirect means (i.e., underlying preferences largely differ to expressed ones).
As for cultural participation, we see that performing arts goers (Dimension 1, odds ratio equal to 0.71) and (marginally) recorded music users (Dimension 2, odds ratio 1.26; p value is 10%) reduce the probability of a consistent assessment. Note that Dimension 2 is measured on an inverse scale so the odds ratio should be interpreted accordingly as an inverse (less than one) result. All in all, there is a direct effect of cultural participation on the measurement of genre preferences in that performing arts goers and (marginally) recorded music users are more likely to assess genres inconsistently. Put in different terms, cultural participation is related to a higher absolute value of the discrepancy between the two measurements. This finding in turn supports the idea that cultural participation increases the bias between reported music preferences when using direct/indirect methods. Overall, estimation results are consistent with H3, as cultural participation does influence discrepancies in music preferences.
With all other things being equal, familiarity does not seem to play a role in consistency of assessment. We find no evidence either of a direct or an indirect effect of interaction with cultural participation. However, the random slope at the genre grouping is more complex to interpret, as discussed below.
Estimated random effects are indicative of between-individual and between-genre unobserved differences. These yield an intraclass correlation equal to .125, which implies that 12.5% of the total variability can be explained by the grouping structure (individuals/genres) in the population. Figure 3 summarizes the information about the between-genres random effects. The pane on the right plots the estimated CI for the genre-level random intercepts. It shows how certain genres are more likely to be consistently assessed (Reggae, Classical music, Latin, Rap hip-hop, or Hard rock and metal) while others are more likely to be inconsistently assessed (such as International pop-rock, Indie, or Jazz). Note that consistency (inconsistency) means that participants’ assessments through both measurements are more (less) aligned which, in turn, could reflect the differential complexity of genres. The left pane shows a different impact on genres of the explanatory variable familiar. Here, we see familiarity with certain genres decreases consistency (namely, R&B and soul; Electronic, techno, and dance; Flamenco or Hard rock and metal), while in other cases, familiarity increases consistency (International pop-rock, Latin, Jazz, or Spanish pop-rock). Therefore, the evidence suggests a complex interaction between familiarity and assessment that, among other things, is highly dependent on the genre under consideration. Still, evidence is highly inconclusive and ambiguous with respect to H2.
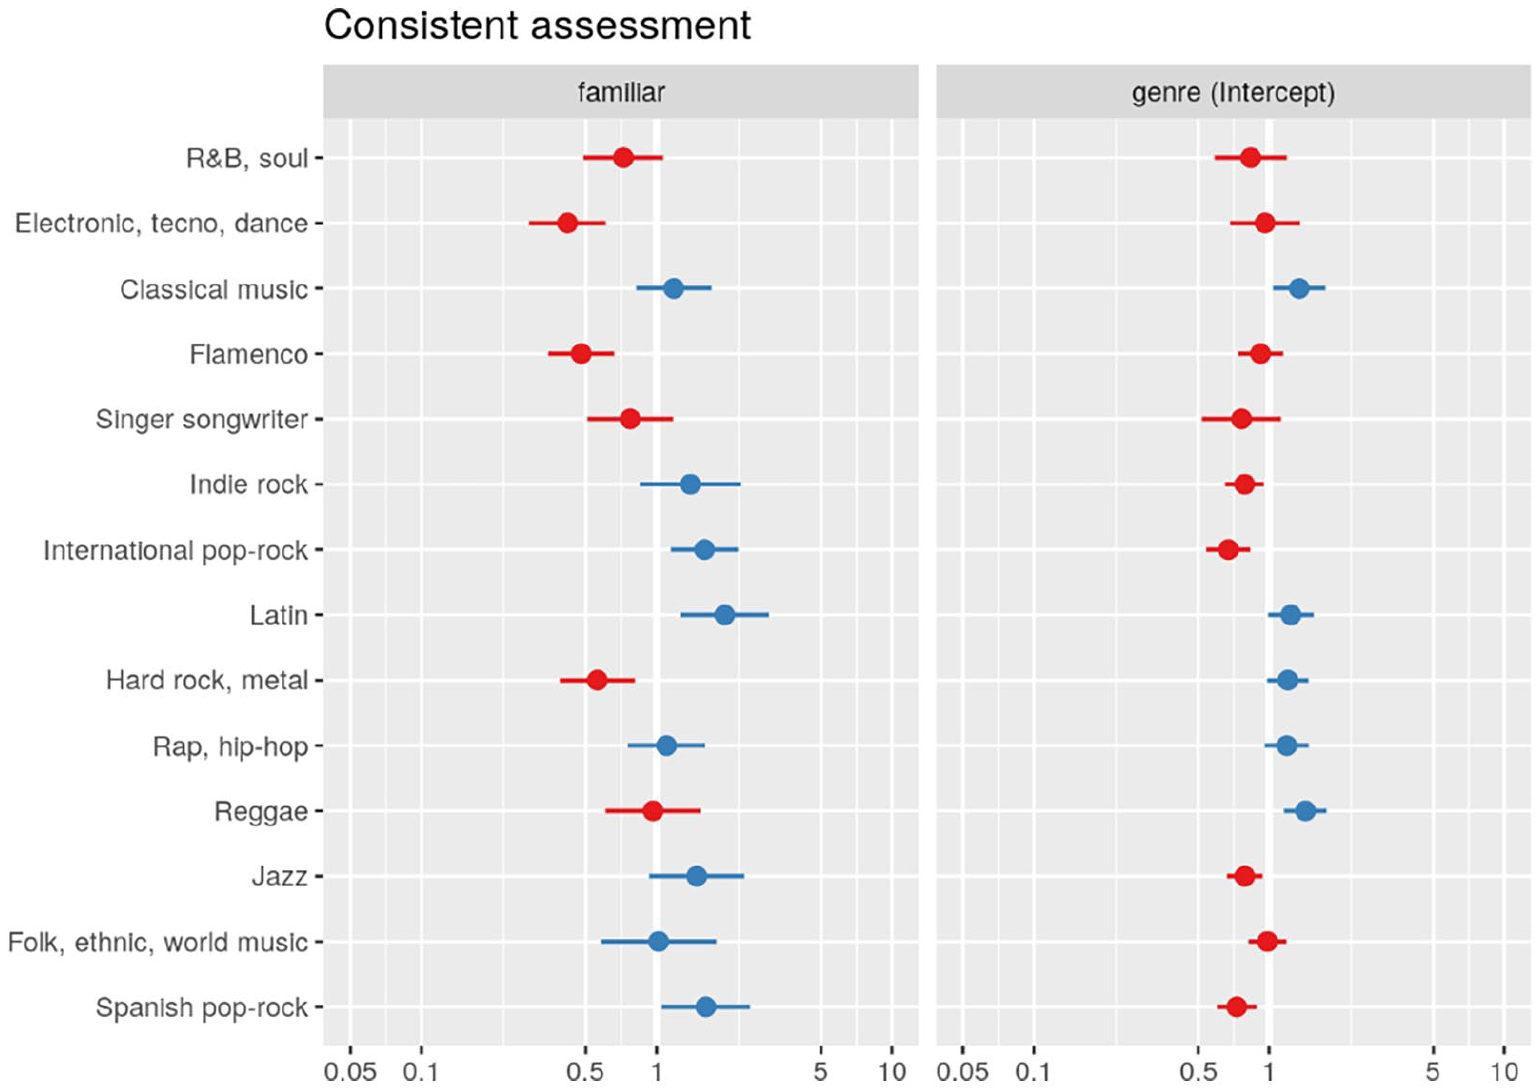
Estimated Random Effects Across Genres: Random Slope for Familiarity (Left Pane) and Intercept (Right Pane).
To better understand the type of association between cultural participation and consistency of assessment, we plot the predicted probability of a consistent assessment versus cultural participation: Figure 4 (performing arts dimension) and Figure 5 (recorded music dimension). In both cases, the probability of consistent assessment is predicted for the different genres and by familiarity.
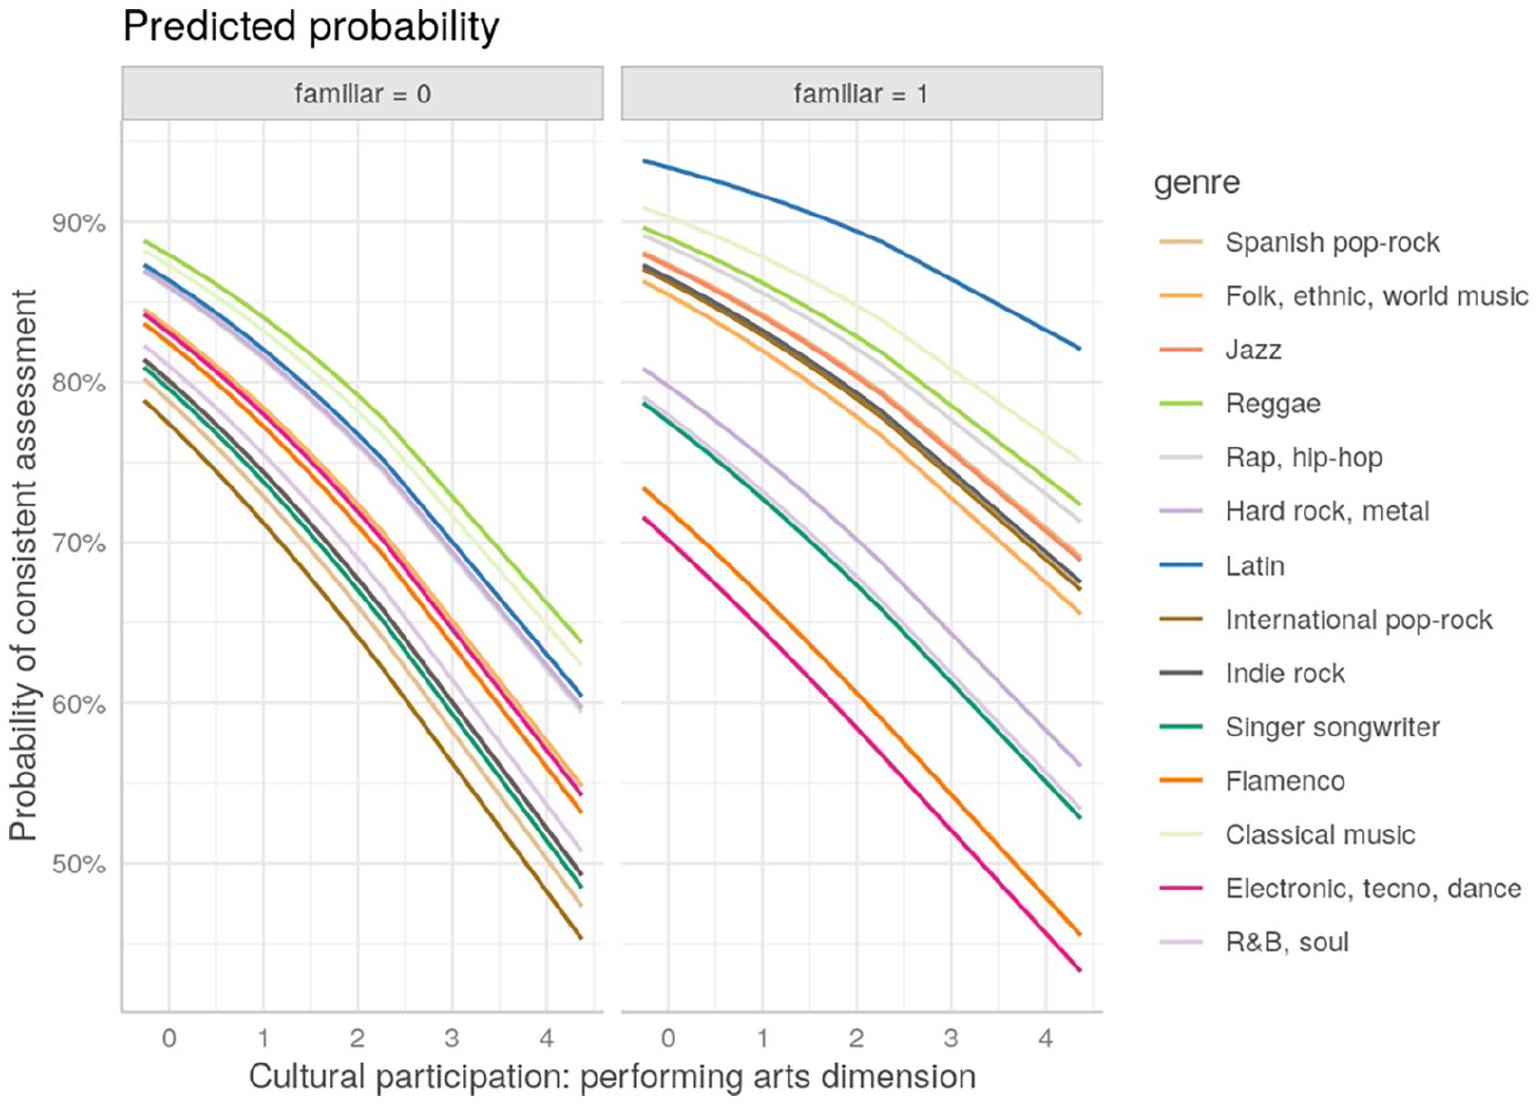
Predicted Probability and Cultural Participation: Performing Arts.
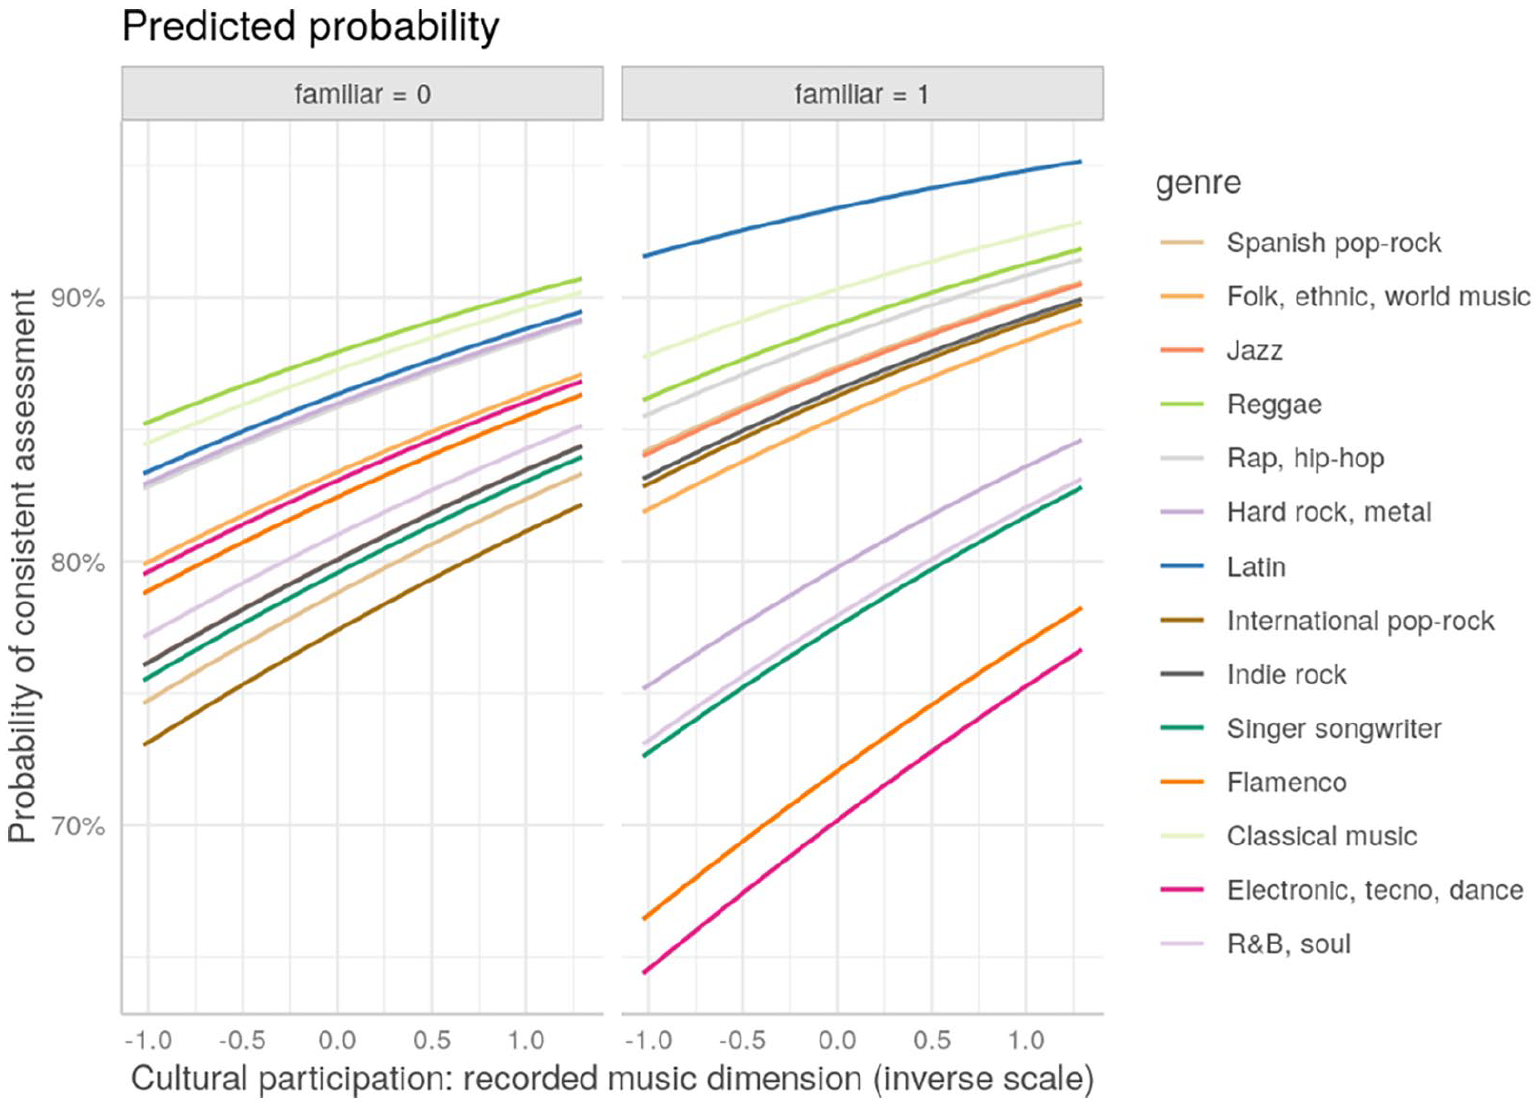
Predicted Probability and Cultural Participation: Recorded Music.
Figure 4 shows that, overall, increasing cultural participation through performing arts reduces the probability of consistent assessments. However, this varies with genre and familiarity. Similar results are observed in Figure 5 for recorded music use. Note that the horizontal scale is inverted in this case: higher values are associated with lower use of recorded music.
Both figures tell a similar story. Consistency in the assessment of genres is affected by the specific type of genre, familiarity and, in an unambiguously negative fashion, by cultural participation. Familiarity has a differential impact on different genres, altering the likelihood of discrepancies. Take Latin, for instance. In both figures, familiarity with this genre increases the probability of consistently assessing it for all different values of cultural participation. In contrast, Electronic, techno, and dance are more consistently assessed by individuals without prior knowledge of the excerpt used. All in all, while some clear-cut results emerge, some others suggest an inherent complexity in the relationship between some variables.
Discussion
In the literature, music preferences have been measured through direct and indirect procedures. Considering that the type of measurement is a key issue, the present research aims at analyzing the potential discrepancies that emerge in the assessment of music-genre preferences when using direct and indirect measures. Following the distinction made by Warren et al. (2011), we compare the approaches most commonly used by economists and behavioral decision theorists (direct measures) and the ones most commonly used by psychologists (indirect measures) with a multidisciplinary perspective in the study of preferences.
Results from our survey show that assessments of music genres differ according to the measure used. Indirect techniques developed to find out underlying preferences, through listening to songs, showed most music genres scoring lower than when using direct techniques, used to obtain expressed preferences by considering a list of labels. This outcome could mean that people tend to be more confident when assessing something they think they know rather than listening to songs, as they may focus more on how the music affects their likings and emotions. This difference is consistent with the existence of a framing effect due to the way preferences are measured, as Slovic (1995) noted.
We found that the two types of measurement gave different most preferred music genres. Singer-songwriter, R&B, and Electronic were the top three music genres when measuring underlying preferences, whereas International pop-rock, Singer-songwriter, and Spanish pop-rock were top scoring when expressed preferences were considered. Consequently, not having an accurate knowledge of what a music genre is, for instance, Electronic, may influence an individual’s set choice. Note that this finding is in line with the discussion in Dunn et al. (2011), who claim that analyzing music preferences using labels is difficult due to their ambiguity. It could be added that the inherent difficulty of assessing a genre based on a label is not only due to the precise definition of that label but also due to the precise association of the label with a specific cultural manifestation, which may be linked to the competences and skills individuals accumulate through cultural participation.
Based on participants’ assessments using both metrics, a measure of the inconsistency in music-genre preferences, the discrepancy between the two, was calculated and further analyzed controlling for familiarity (having heard the song before) as a key variable. The results show that Singer-songwriter is the most preferred music genre regardless of the use of direct or indirect measures or whether the study was conducted on the whole sample or just on those who were familiar or not familiar with the genres. Some music genres, however, score better with indirect measures (e.g., R&B) and others with direct instruments (e.g., International pop-rock).
The logistic regression links discrepancies to cultural capital and to individual and genre-specific latent traits, that is, random effects. Three important findings emerge from the estimated model.
First, after controlling for personal traits (through observed and latent heterogeneity as captured by the individual-level unobserved variability), empirical evidence supports an association between discrepancies and specific forms of arts participation (particularly performing arts and recorded music). This finding, in turn, suggests a connection between cultural skills and competences and the outcome of preferences measurement. Remarkably, this connection shows that performing arts goers and recorded music users are more likely to inconsistently assess music genres. A possible explanation could be related to the fact that these individuals are more aware of the differences in what is being measured through the different methods, hence they are better equipped to ascertain differences between abstract categories and specific instances.
Second, the evidence of a genre-specific unobserved heterogeneity (through the estimated genre-level random intercepts) indicates that assessing certain genres pose more challenges to individuals. In other words, the degree to which individuals correctly assess a genre using the two measurements is genre-dependent, which could point to the higher cognitive complexity in the identification of certain genres.
Third, a complex relationship was found between familiarity and discrepancies. While direct estimates were non-significant, random slopes and predicted probabilities have shown genre-dependent effects that, in turn, could be linked to the differential complexity that the assessment of a music genre poses for participants.
To conclude, the findings of this article highlight the importance of clearly identifying the methodology used in research on music-genre preferences as it may have relevant implications on results. Specifically, this research suggests that direct and indirect methods to measure music preferences may be capturing different dimensions.
Finally, this work presents some limitations. First, non-probability sampling does not allow results to be extrapolated. It would be interesting to replicate this study with a randomly selected sample. Second, in relation to the indirect measure, choosing just one single song to help overcome problems related to participants’ fatigue, even though previously selected by experts to identify a genre, could be somehow biased.
Footnotes
Acknowledgements
The authors would like to thank the students of Fundamentals of Marketing Research (academic year 2018–2019) at the University of Valencia for their help in the fieldwork.
Funding
The author(s) received no financial support for the research, authorship, and/or publication of this article.

Data availability
The data that support the findings of this study are available on request from the corresponding author.