
Abstract
Although numerous public closed-circuit television (CCTV) initiatives have been implemented at varying levels in Taiwan’s cities and counties, systematic evaluations of these crime reduction efforts have been largely overlooked. To address this void, a quasi-experimental evaluation research project was designed to assess the effect of police-monitored CCTV on crime reduction in Taipei City for a period of 54 months, including data for both before and after camera installation dates. A total of 40 viewsheds within a 100-m (328 feet) radius were selected as research sites to observe variations in four types of crime incidents that became known to police during the January 2008 to June 2012 period. While crime incidents occurring in both the target and control sites were reduced in frequency after CCTV installation, results derived from time-series analysis indicated that the monitoring had no significant effect on the reduction of property crime incidents with the sole exception of robbery. With respect to the effects of comparing target and control sites, the average Crime Reduction Quotient (CRQ) was 0.36, suggesting that CCTV has an overall marginal yet noteworthy influence. Viewed broadly, however, the police-installed CCTV system in Taipei City did not appear to be as efficient as one would expect. Conversely, cameras installed in some observation sites proved to be significantly more effective than cameras in other sites. As a recommendation, future researchers should identify how particular micro-level attributes may lead to CCTV cameras working more effectively, thereby optimizing location choices where monitoring will prove to be most productive.
Introduction
In recent years, a marked and sustained growth has taken place in the use of closed-circuit television (CCTV) surveillance cameras in public places in Western countries. For example, one estimate puts the total number of public CCTV cameras in the United Kingdom at 4.2 million, or one for every 14 citizens (Piza, 2018; Welsh & Farrington, 2002). There are no nationwide estimates as of yet on the number of CCTV cameras operating in the United States; there are, however, many local accounts indicating that these security systems are being implemented at an unprecedented rate. The popularity of such systems is not limited to large urban centers, moreover (Fountain, 2006; Piza, Caplan, & Kennedy, 2014). For example, figures range from US$25 million spent on cameras in New York City, to US$5 million spent in Chicago on a 2,000-camera system distributed throughout the city, to more than US$10 million spent in Baltimore (McCarthy, 2007; Welsh & Farrington, 2002). There are also signs that other countries, most moving somewhat more cautiously than is the case in Australia, New Zealand, Sweden, and Demark, are increasingly implementing CCTV to prevent crime in high-risk public places (Gill & Spriggs, 2005; Goodwin, 2002; Ratcliffe, Taniquchi, & Taylor, 2009).
In line with the growth trends of CCTV development in a number of developed societies, the Taiwan National Police Agency (TNPA) introduced “Empowerment Projection of Policing” in 2005 and 2006, a program initiative under which local governments and all levels of police departments were strongly encouraged to install more CCTV systems in public areas and in motor vehicle parking lots in numerous cities and counties (Chang & Tsai, 2007; Wang & Kellar, 2011). According to the TNPA, as of 2015 many of the nation’s local police departments have had more than 155,028 monitoring cameras installed (Lai, Sheu, & Kuo, 2015). Among those cities and counties, the Taipei City Police Department (TCPD) took a lead and spent more than US$55 million to replace outdated videotape-based units with 13,699 new digital CCTV cameras in public areas during the 2009 to 2011 period (TCPD, 2011).
While police departments in many countries are implementing CCTV initiatives, several important gaps in our collective knowledge have been largely overlooked. First, are these surveillance systems on the streets effective in crime reduction (Welsh & Farrington, 2008)? Second, most of the assessment research has been conducted in Western societies, such as the United Kingdom and the United States, but very little has been done to investigate whether CCTV surveillance works well in non-Western societies (Lim, Kim, Eck, & Kim, 2016). Finally, as Ratcliffe et al. (2009) noted, more experimental or high-quality quasi-experimental research is needed if criminologists are to recommend with confidence that cities should be moving ahead with CCTV systems.
The purpose of our study was to fill these three gaps in our knowledge. First, the existing body of research literature and theoretical formulations developed largely in the West is applied to Taiwanese data leading to insightful comparisons. Second, time-series analysis and CRQ ratios (two-types of statistical tests) were employed to assess the hypothesized deterrence effects attributable to CCTV implementation in Taipei City. Finally, a quasi-experimental approach was implemented to gain further insight into the effectiveness of adopting the CCTV policy across four separate crime categories: theft from persons, vehicle theft, burglary, and robbery.
Literature Review
The Theoretical Foundation of CCTV Surveillance
In investigating the crime prevention potential of CCTV surveillance cameras, Deterrence theory provides the theoretical foundation for research in this area (Clarke, 1997; Welsh & Farrington, 2006, 2008). Under Deterrence theory, CCTV leads to crime prevention because potential offenders believe cameras may be monitoring their activity, putting them at an increased risk of detection and apprehension (Piza, 2018). A focus on offender perceptions aligns CCTV with the principal tenets of Rational Choice theory (Cornish & Clarke, 1986) which hold that crime is “purposive behavior designed to meet the offender’s commonplace needs” (Clarke, 1997, pp. 9-10). As argued by Ratcliffe (2006, p. 8), the primary aim of CCTV is the triggering of a perceptual mechanism in a potential offender “so that an offender believes if he commits a crime, he will be caught.” In similar fashion, the advocates of Routine Activities theory would most likely view the implementation of CCTV systems as representing the enhancement of “the presence of capable guardians” leading the public to feel safer (Cohen & Felson, 1979). Stated differently, citizens and local elected officials tend to view CCTV surveillance as expanding the reach of “the capable guardians” and increasing the subjective feeling of safety in public areas (Armitage, 2002; Armitage, Smyth, & Pease, 1999). Given the predominance of these three major theories over the past three decades, and their close connection to CCTV system implementation, it is no wonder that CCTV has emerged as a mainstream crime prevention tool in contemporary societies across the world.
The Earlier Evaluations of CCTV Impact on Crime
The earlier evaluations of CCTV on crime reduction took place in the United Kingdom in the 1990s where substantial funding for public CCTV was provided to a handful of locales which were broadly viewed as successful vis-à-vis crime prevention (Welsh & Farrington, 2008). In this regard, three quarters of the Home Office budget was allocated to CCTV-related projects from 1996 to 1998 (Armitage, 2002). Researchers who evaluated these major CCTV systems have dutifully attempted to document crime reduction that could be attributed to these systems (Phillips, 1999). For example, according to a Home Office Research Group study evaluating CCTV systems in Birmingham, King’s Lynn, and Newcastle, Brown (1995) reported that the use of CCTV cameras did reduce property crime in each of the three town centers. The reductions occurred mainly in the areas of the burglary of shops, but also were found to occur in the areas of theft of and from vehicles. In terms of personal crime, the evidence of crime reduction was less clear. While robbery and theft from persons increased in New Castle and Lynn despite CCTV, the monthly incidents of personal crime decreased compared with areas not covered by CCTV cameras (see also, Short & Ditton, 1996). In addition, similar pre- and postimplementation evaluations have been conducted in a variety of sites, including shopping centers (e.g., Honess & Charman, 1992), parking facilities (e.g., Tilley, 1993b), public housing complexes (e.g., Chatterton & Frenz, 1994), buses (e.g., Poyner, 1992), and in small businesses (e.g., Tilley, 1993a) to look at whether the targeted crimes decreased after the installation of CCTV (Welsh & Farrington, 2008). Overall, the documented research at the time leads to the conclusion that CCTV can indeed be effective in deterring property crime, but the findings are much more mixed in relation to the prevention of personal crime (Phillips, 1999).
Although contributing to our collective knowledge regarding CCTV’s effectiveness on crime reduction, these early studies tended to suffer from some specific methodological shortcomings which have been highlighted in the subsequent literature (Piza, 2012; Ratcliffe et al., 2009; Welsh & Farrington, 2002). Short and Ditton (1995) identified a set of five methodological shortcomings worthy of note in prior research. First, the overall body of CCTV research relies on the use of pre- and postinstallation time periods which were too short in duration to evaluate the effectiveness of CCTV in crime reduction. Second, prior studies typically failed to disaggregate crime rates into specific categories of interest, failing to document increases and/or reductions in crime types in specific types of crime in favor of measuring overall crime levels. Third, and more importantly, many of the early evaluations failed to utilize comparable control areas for comparing the occurrence of various types of crime incidents in CCTV and non-CCTV areas (Piza, 2012).
Some prominent researchers’ reviews have highlighted the fact that a significant inverse relationship exists between strength of research design and study outcomes: Weaker research designs tend to produce evidence of stronger effects, while stronger research designs tend to produce evidence of weaker effects (e.g., Weisburd, Lum, & Petrosino, 2001). This suggests that numerous evaluations of public CCTV may be “biased upward” due to this proclivity toward relatively weak and pooled outcomes-based designs (Piza, 2012). Clearly, a high-quality research design with multiple outcome measures and featuring the most rigorous statistical analysis is called for at this time (Ratcliffe et al., 2009).
Recent Evaluations of CCTV Impact on Crime
Sherman, Farrington, Welsh, and MacKenzie (2002) developed a quasi-experimental model which focused on the measurement of change in crime before–after the installation of CCTV simultaneously in both target and control area. Furthermore, they measured change over a significant stretch of time following the implementation of camera surveillance. In their systematic review of assessments of CCTV implementation efforts, Welsh and Farrington (2002) identified what they consider to be the four essential criteria for a study on CCTV. Those critical criteria were the following: (a) CCTV was the main intervention examined; (b) the outcome measure was crime (specifically, police recorded crime statistics); (c) evaluations had a minimum methodological design that incorporated at least before–after crime measures simultaneously in experimental and comparable control areas alike; and (d) there was a noteworthy rate of occurrence in a set of 20 crimes recorded in the experimental area prior to CCTV implementation.
The vast improvements made in high-quality CCTV camera systems with digital replay capability, with pan, tilt, and zoom functions and with enhanced quality of images for interpretation over the course of the past decade as greatly enhanced both crime analysis and clearance rates for crimes. Improved resolution (both spatial and temporal) and lower storage costs have enabled academic researcher to adhere more closely to Welsh and Farrington’s (2002) criteria. Those recent studies conducted in the United States (Piza, 2012), including Caplan, Kennedy, & Petrossian (2011), La Vigne, Lowry, Markman, & Dwyer (2011), Mazerolle, Hurly, & Chamlin (2002), Piza et al. (2014), and Ratcliffe et al. (2009) add greatly to our growing knowledge base regarding CCTV. These more recent studies also feature some significant innovations in methodology and study design: (a) Some studies have drilled down to provide a more place-specific rather than general neighborhood level of focus and examine the extent to which antisocial behaviors or crime incidents captured by cameras vary within and in the vicinity of CCTV installation locations (e.g., La Vigne et al., 2011; Mazerolle et al., 2002). (b) Some scholars have examined the impact of cameras on crime reduction within defined distances of CCTV cameras areas as compared with matched control areas over a substantial period (e.g., La Vigne et al., 2011; Piza et al., 2014; Ratcliffe et al., 2009). For example, Caplan and colleagues (2011) used cameras installations as target areas and randomly selected control sites to assess the effect of CCTV on specific crimes (i.e., shootings, auto thefts, property thefts, and thefts from autos) in Newark, New Jersey, over a period of 26 months. (c) Some scholars have made use of an innovative method to measure the possible displacement effects of camera system implementation (e.g., La Vigne et al., 2011; Ratcliffe et al., 2009). For example, La Vigne and colleagues (2011) evaluated the impact of the open-street CCTV initiative on crime in three major U.S. cities: Baltimore, Chicago, and Washington, DC. Their evaluation led them to report somewhat mixed, but nonetheless promising findings. In Baltimore, they found that in three of the four camera areas a significant decrease in both property and violent crimes took place with no displacement effect; in Chicago, in stark contrast, one test area experienced a significant reduction in total crime with diffusion of benefit and without displacement; in Washington, DC, after controlling for potential confounding variables, some benefit of deterrence with no significant displacement was observed and reported.
Other innovations can be found in these rigorous more recent studies, such as the use of disaggregated crime data featuring specific crimes of interest to different stakeholders in the vieweshed of open-street CCTV cameras. In addition, Geographical Information System (GIS) mapping technology (e.g., Caplan et al., 2011; Piza et al., 2014; Ratcliffe et al., 2009) and use of advanced statistical analyses, such as hierarchical linear modeling (HLM; e.g., Ratcliffe et al., 2009), pooled time series (e.g., La Vigne et al., 2011), and estimates for weighted displacement quotients (WDQ; e.g., Ratcliffe et al., 2009) have all been applied to our collective effort to understand the consequences of CCTV system implementation. Overall, those studies suggest that CCTV cameras are deterring crime generally; studies have reported rather mixed benefit across types of crime, but typically accord small to modest effects in crime prevention as a general rule (Piza, 2012).
More recently, Lim et al. (2016) used a quasi-experimental design and made use of statistical analyses and data collection methods developed in the West to study CCTV outcomes in South Korea. Following Ratcliffee et al.’s (2009) work, they designated target areas, control areas, and buffer areas for 40 CCTV cameras in nine sites with a 48-month long research study in the city of Chuncheon. HLM and WDQ were featured in their study appropriately. Their results indicated that, on average, open-street CCTV did not show a statistically significant effect on the reduction of either serious crimes or disorder crimes. However, they found importantly that the benefits attributable to CCTV were higher in serious crimes than in disorder crimes. They concluded that results are similar to findings reported in Western societies.
The Lim et al. study is one of the very few efforts to have been devoted to understanding how CCTV effects do or do not materialize in the same ways in a non-Western setting. Their study in South Korea inspires us to contribute to the fund of shared understanding on CCTV implemented in non-Western settings. Here we have attempted to apply the innovative research designs and methodologies developed in Western societies to Taiwan’s Taipei city, using archival evidence from TCPD’s CCTV system of surveillance cameras.
Method
Research Background and Setting
Taipei is the capital and fourth largest city in Taiwan. This city covers 272 square kilometers, with an estimated 2014 population of more than 2,600,000 citizens (Taipei City Government, 2015). The TCPD is the second largest municipal police force in Taiwan, with about 7,000 sworn officers as of 2015 (TCPD, 2016). The former Mayor Hau Lung-Bin, PhD, took office in 2007 and swiftly began to invest in cutting-edge technologies to boost the police department’s ability to monitor and control crime in the city more effectively. Shortly after implementation of CCTV, citizen survey results indicated that more than 75% of Taipei citizens were “satisfied” with the efforts of the TCPD with respect to crime prevention and crime control (TCPD Poll, 2010). One prominently publicly broadcasted initiative of substantive scale was that of the installation of street-level, police-monitored CCTV cameras.
In 2009, the Taipei City Government spent approximately 1.6 billion NTD (50 million USD) to install 13,699 police-monitored CCTVs consisting of five types throughout Taipei public areas. First, the Type A recording device, namely, street-level monitor, consisted of a standard camera that was generally mounted on neighborhood light poles at sidewalks, roads, lanes, and intersections within plain view. These cameras had the ability to zoom and pan 180 degrees. The images captured were digitally recorded with a hard drive capacity sufficient to store images for up to 2 weeks. A total of 11,933 (or 87% of all cameras) of these neighborhood cameras were installed in Taipei. Second, Type B devices included infrared cameras which were mounted on traffic signs and telephone poles at major roads, expressways, and key traffic intersections. These units had the ability to zoom, pan 360 degrees, and tilt 180 degrees to catch the plane of targeted vehicles. A total of 1,300 (or 9% of all cameras) Type B cameras were installed. Third, Type C cameras were fixed, million mega pixels high-performance cameras. Similarly, they functioned to zoom, pan 360 degree, and tilt 180 degrees. Whereas the Type B devices only monitor a single lane on an express way, the Type C devices were designed to monitor three lanes at the same time. A total of 342 (or 0.3% of all cameras) devices were installed at main traffic roads, namely, avenues and boulevards. Type C1 devices included rotary, million mega pixels cameras; a total of 80 (or 0.05% of all cameras) were installed at main traffic roads that connect to other adjacent cities such as New Taipei City and Keelung City. Finally, License Plate Recognition (LPR) cameras used for searching targeted vehicles were added to the initiative; however, only 44 (or 0.03% of all cameras) LPR cameras were installed due to limited budgetary resources at the time of the initiative. As a result, the total CCTV density is 55 cameras per km2 in Taipei City which is the largest system in Taiwan, followed by Chiayi City (53/km2), and Hsinchu City (43/km2; Lai et al., 2015).
According to a TCPD’s (2011) report, rules for locating police-monitored CCTVs mandated using only those locales or areas which met one or more of the following key criteria: hot spots for property crimes (38.7%); hot spots for violent crimes (10.2%); a documented expression of public concerns (namely, problematic areas wherein local citizens have publically voiced a safety concern; 22.2%); main traffic roads adjacent to satellite cities (21.1%); tunnels, bridges, and other key transportation assets (7.8%). The CCTV initiative was in operation from January 2009 through the end of 2011.
Research Procedure
The 11,933 neighborhood cameras (Type A) in operation were used for our current study. These cameras are within plain view of pedestrians, bicyclists, motorcyclists, and other vehicle type owners. In addition, these units have the greatest motion range, and their opaque housing is the most likely to constantly produce a sense of omnipresent monitoring of the viewshed. With the valuable assistance of TCPD’s officials, the researchers selected a cross-section of neighborhood cameras that were installed at roads, lanes, and intersections from July 2009 and December 2011. Next, 20 observations were collected with more than 40 monitors used as target sites. 1 In this study, we use the term observation” rather than camera or monitor because each observation consists of images captured by at least one camera. In an intersection, for example, the TCPD normally installed two cameras to expand the scope of viewshed because each camera only pans 180 degrees. Moreover, some main intersections consist of at least three roads; hence, the TCPD installed more than two cameras in those locations trying to produce a sense of omnipresent monitoring of the viewshed there.
The criteria employed to collect 20 target sites were based on the following considerations: (a) CCTV cameras were installed in those locations where the public had expressed the greatest concern for their safety such as shopping settings, night markets, parking lots, and metro exits; (b) each observation used in the study should consist of at least two cameras with opposed directions to expand the scope of the viewshed area; (c) within a 100-m (328 feet) 2 radius of each observation, there could be no other nonobservation camera present; and (d) each observation must occur at substantial distance from other observations. At the same time, 20 matched sites which were treated as controls and corresponded to each target site were selected from public areas in which no installed cameras were featured. Four guidelines were used in the collection of those 20 control sites: (a) each control site should be adjacent to its target site but at least 200 m away; (b) within a 100-m (328 feet) radius of each observation, no other nonobservation camera could be found; (c) each control site matched similar characteristics in each target site such as sociodemographics, crime problems, policing activities (e.g., patrolling beats) and use of land; and (d) each control site should be at a substantial distance of at least 200 m from other sites. 3
The observation period lasted 54 months, from January 2008 to June 2012, providing an average 27-month period both before and after CCTV installation. At the same time, CCTV’s deterrent effect was precisely paid attention to with respect to four types of crime incidents (namely, theft from persons, vehicle theft, burglary, and robbery) occurring within a 100-m (328 feet) radius of each observation (for target and control sites alike): theft from persons, vehicle theft, burglary, and robbery. Crime data were obtained from the Municipal Criminal Investigation Branch (MCIB) of the TCPD. In the MCIB database system, GIS software was used to assist in the collection of crime incident data. For example, once the target and control sites were identified, their XY coordinates were obtained and used to locate and then download aerial images of these places via the GIS system. For the purpose of research, the four crime incidents which had been reported to the police within a 100-m (328 feet) radius of each observation were identified on a biweekly basis for analysis.
Hypotheses
Three principal hypotheses are investigated in this study:
Analysis
Event count time series
In our study, a longitudinal analysis procedure, time-series analysis, was employed which was implemented in the STATA (version 13) software package. As a traditional analytical strategy for event count data, Poisson regression models are somewhat limited given that that the process which generates the events is assumed to be independent of time. Stated more precisely, the times between events are assumed to be independent and exponentially distributed. This assumption, however, imposes a very strong set of restrictions because most event data violate the time period independence assumption in one way or another. For many time-series event count observations, the number of events occurring at time t depends on the number of events that have occurred at some earlier time period, typically denoted as t − 1. If this is the case, failing to account for the underlying temporal effect causes dynamic misspecification of the conditional mean that can result in possible inefficient estimations.
The Poisson exponentially weighted moving average (PEWMA) and Poisson autoregressive (PAR) models featured in STATA both capture this set of dynamics by estimating a time-dependent mean of the event count process. The PEWMA model fits well to the event series in which the mean number of observed events in the present is a weighted by the sum of all the past events. In other words, the mean number of events evolves over time based on an exponentially weighted moving average in the PEWMA model (Brandt, Williams, Fordham, & Pollins, 2000).
Unlike the PEWMA model, the PAR model is suitable for modeling cyclical and short-memorized event count processes that are mean-reverting in nature. In the case of the PAR(ρ) model—that is, PAR with ρ autoregressive lags—use is made of a covariate matrix Xt and μ = exp(Xt · δ); the effect of a change in the regressor represented by Xt on the mean number of counts at time t is determined by calculating the value of the first derivative of the mean function for this change (see Brandt & Williams, 2001 for details).
There is no specific statistical significance test available for determining whether a specific event count time series (ECTS) is better estimated by PEWMA or PAR(ρ). Diagnostics of the dynamics of ECTS, however, can be carried out by using the autocorrelation function (ACF) and partial autocorrelation function (PACF) routines featured in STATA by plotting the time series of dependent variables. The diagnostic process of ACF for general AR(1) structures—even for count data—is analogous to standard Gaussian procedures (Brandt, Williams, & Fordham, 1998). Doing so with our dependent variables—that is, the incidents of theft from persons, vehicle theft, burglary, and robbery—in the target and control sites, it was not possible to identify a specific preferred model, but several good candidates were identified on the basis of the time series and ACF as depicted in Figures 1 and 2. We estimated a PAR(1) and PAR(2), both of which are reasonably consistent with the ACF of the series for certain crimes (e.g., theft from persons). In addition, we also estimate a Poisson regression model which would be the preferred model if the series were indeed time-independent, and we estimated a negative binomial model in which the events were assumed to be overdispersed.
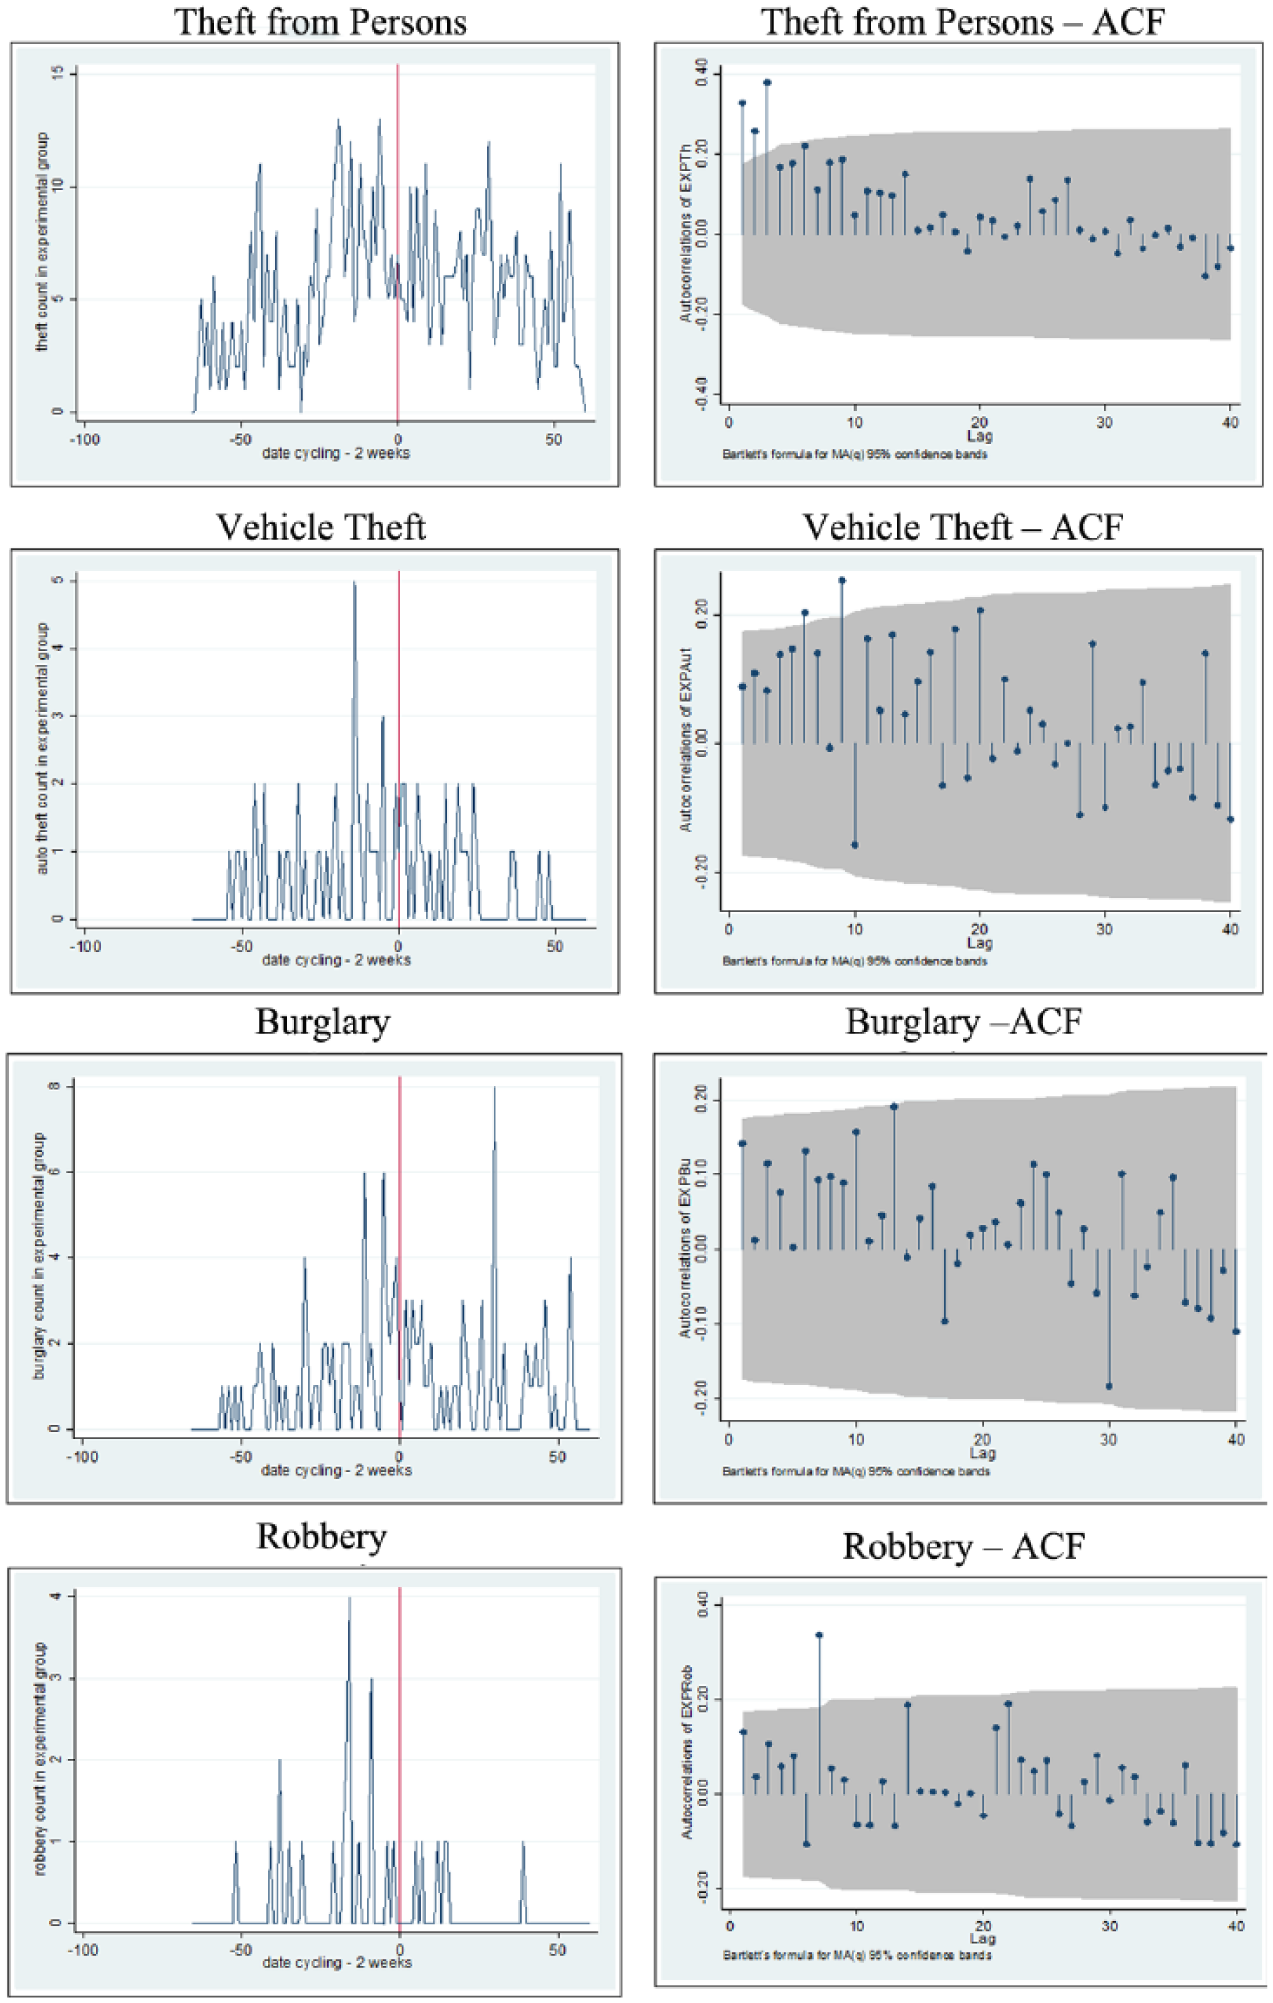
Time series and autocorrelation plots for four types of crime incidents known to the police in experimental groups.
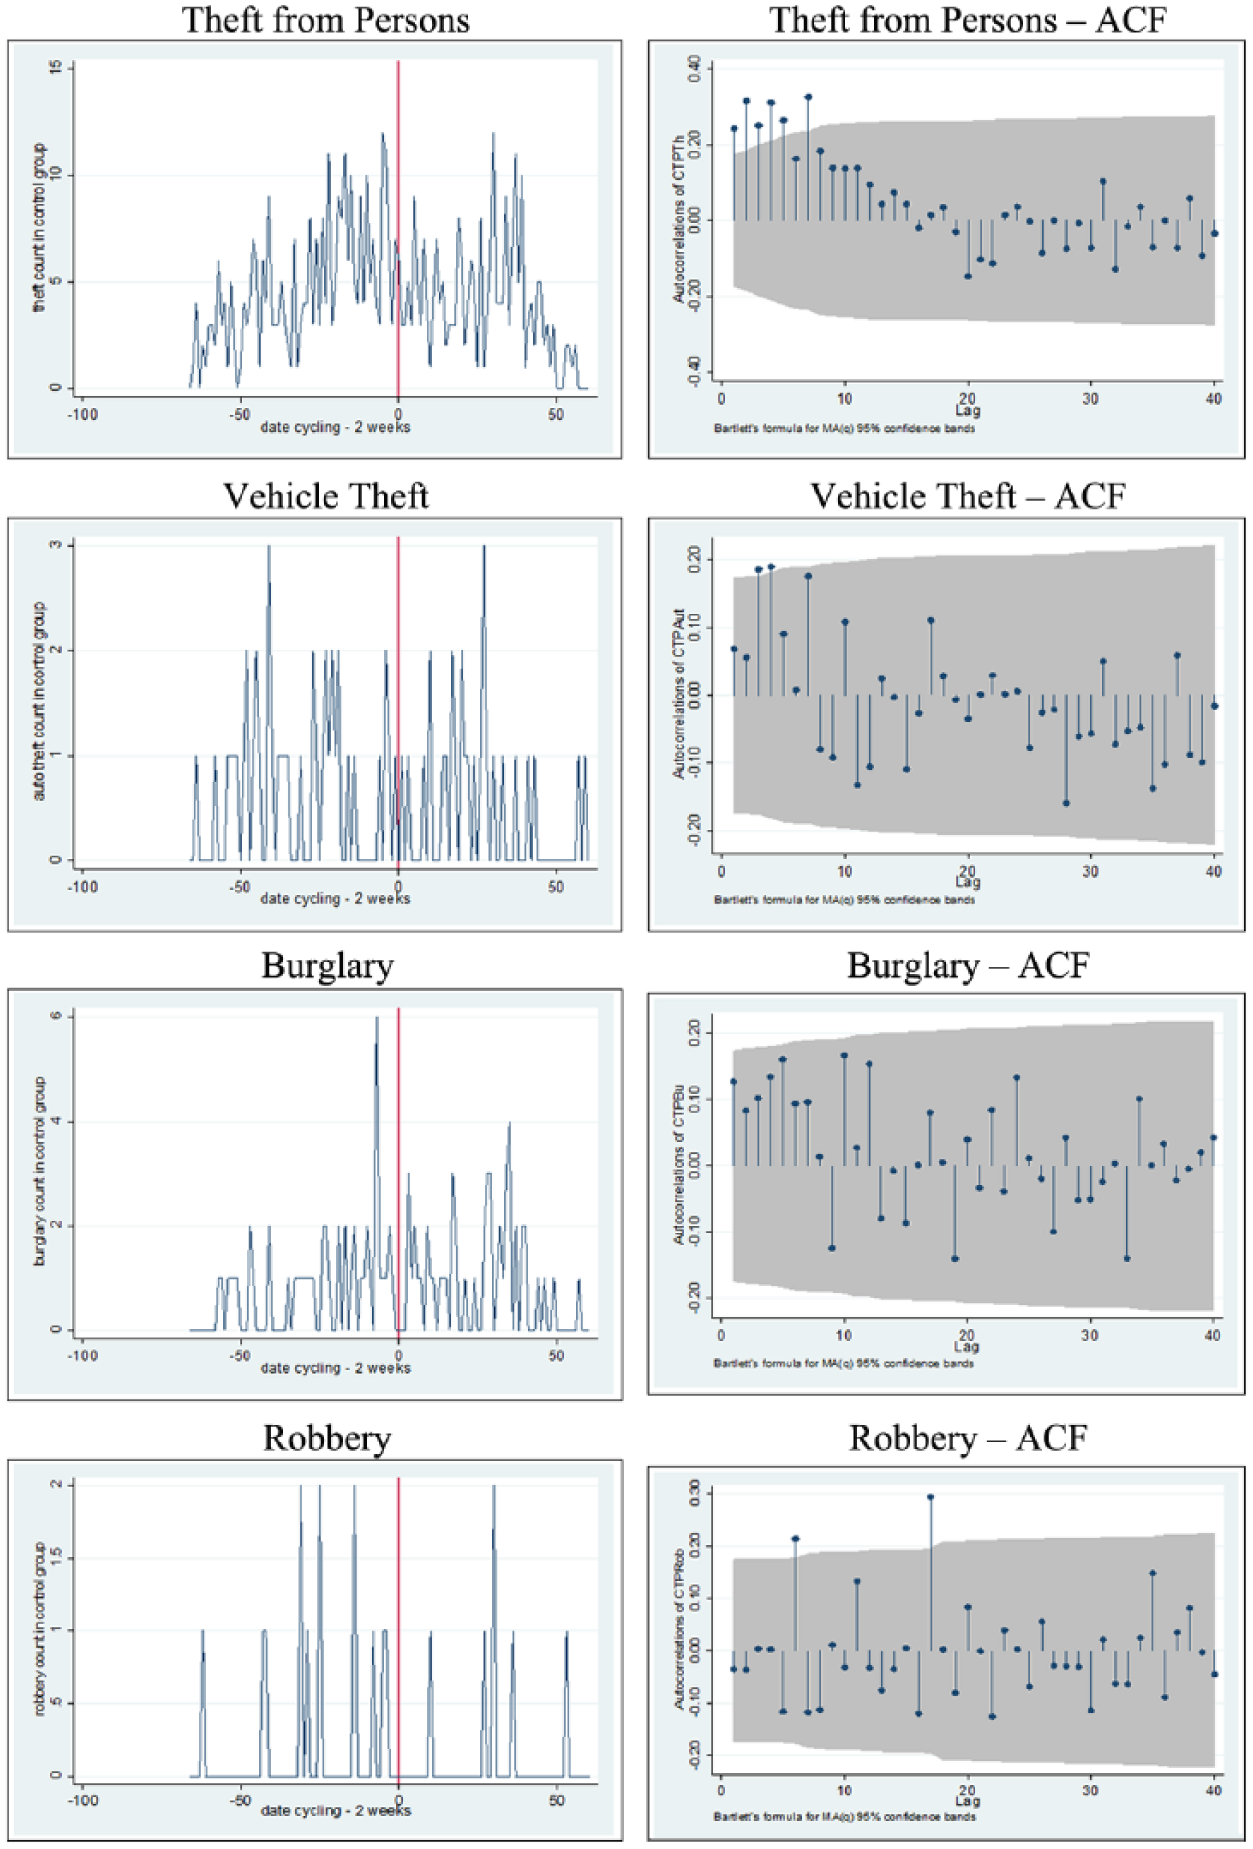
Time series and autocorrelation plots for four types of crime incident known to the police in control groups.
Next, an intervention component was created to assess the effect of CCTV on crime reduction. The intervention component included two distinct variables. One variable measured the temporary CCTV effect, with the code value of one indicating the time point at which CCTV installation went into effect and zeros otherwise. The second variable measured the permanent CCTV effect, with zeros for the time points before the installation of CCTV and ones otherwise.
CRQ
Drawing on the work of Bowers and Johnson (2003) featuring the WDQ, we created a formula and dubbed it the Crime Reduction Quotient (CRQ) 4 to determine whether there were crime reduction differences between the matched target and control sites. We expect that the CRQs among the target observations would drop significantly after CCTV installation when compared with those same CRQs among those control observations. The formula for the index in question is as follows:
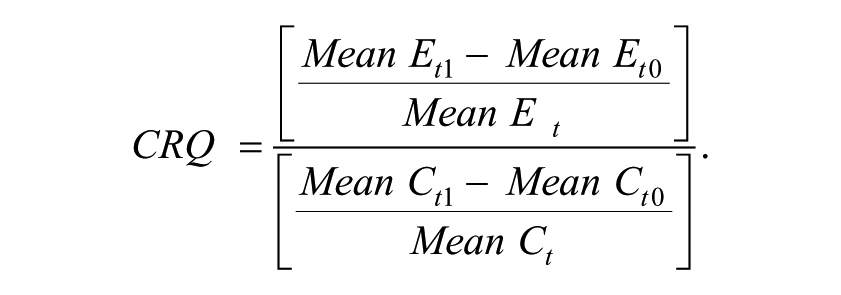
The symbol E refers to the target sites, and the designation C refers to control sites. Mean E represents the average count of crime incidents occurring in the target sites, and Mean C in turn represents the average count of crime incidents occurring in the control sites. Also, t1 is the period after CCTV installation and t0 is the period before CCTV installation. The t refers to all observation period of 54 months. We hypothesize that the average count of crime incidents occurring after CCTV installation will be less than the average count of crime incidents occurring before CCTV installation. Dividing the sum of those average counts by the observation period produces the quotient. Following that operation, we calculate two quotients, one for the target and one for the control conditions. If the CRQ had a value greater than 1.0, this meant that crime reduction in the target sites was significantly greater than any crime reduction in the control condition. This finding was our expected result and would be consistent with our hypothesis.
Findings
Descriptive Statistics
The principal objective of our research was to evaluate the deterrent effects of police-monitored CCTV cameras on four types of crime incidents occurring within a 100-m radius (328 feet) of each observation from January 2008 to June 2012.
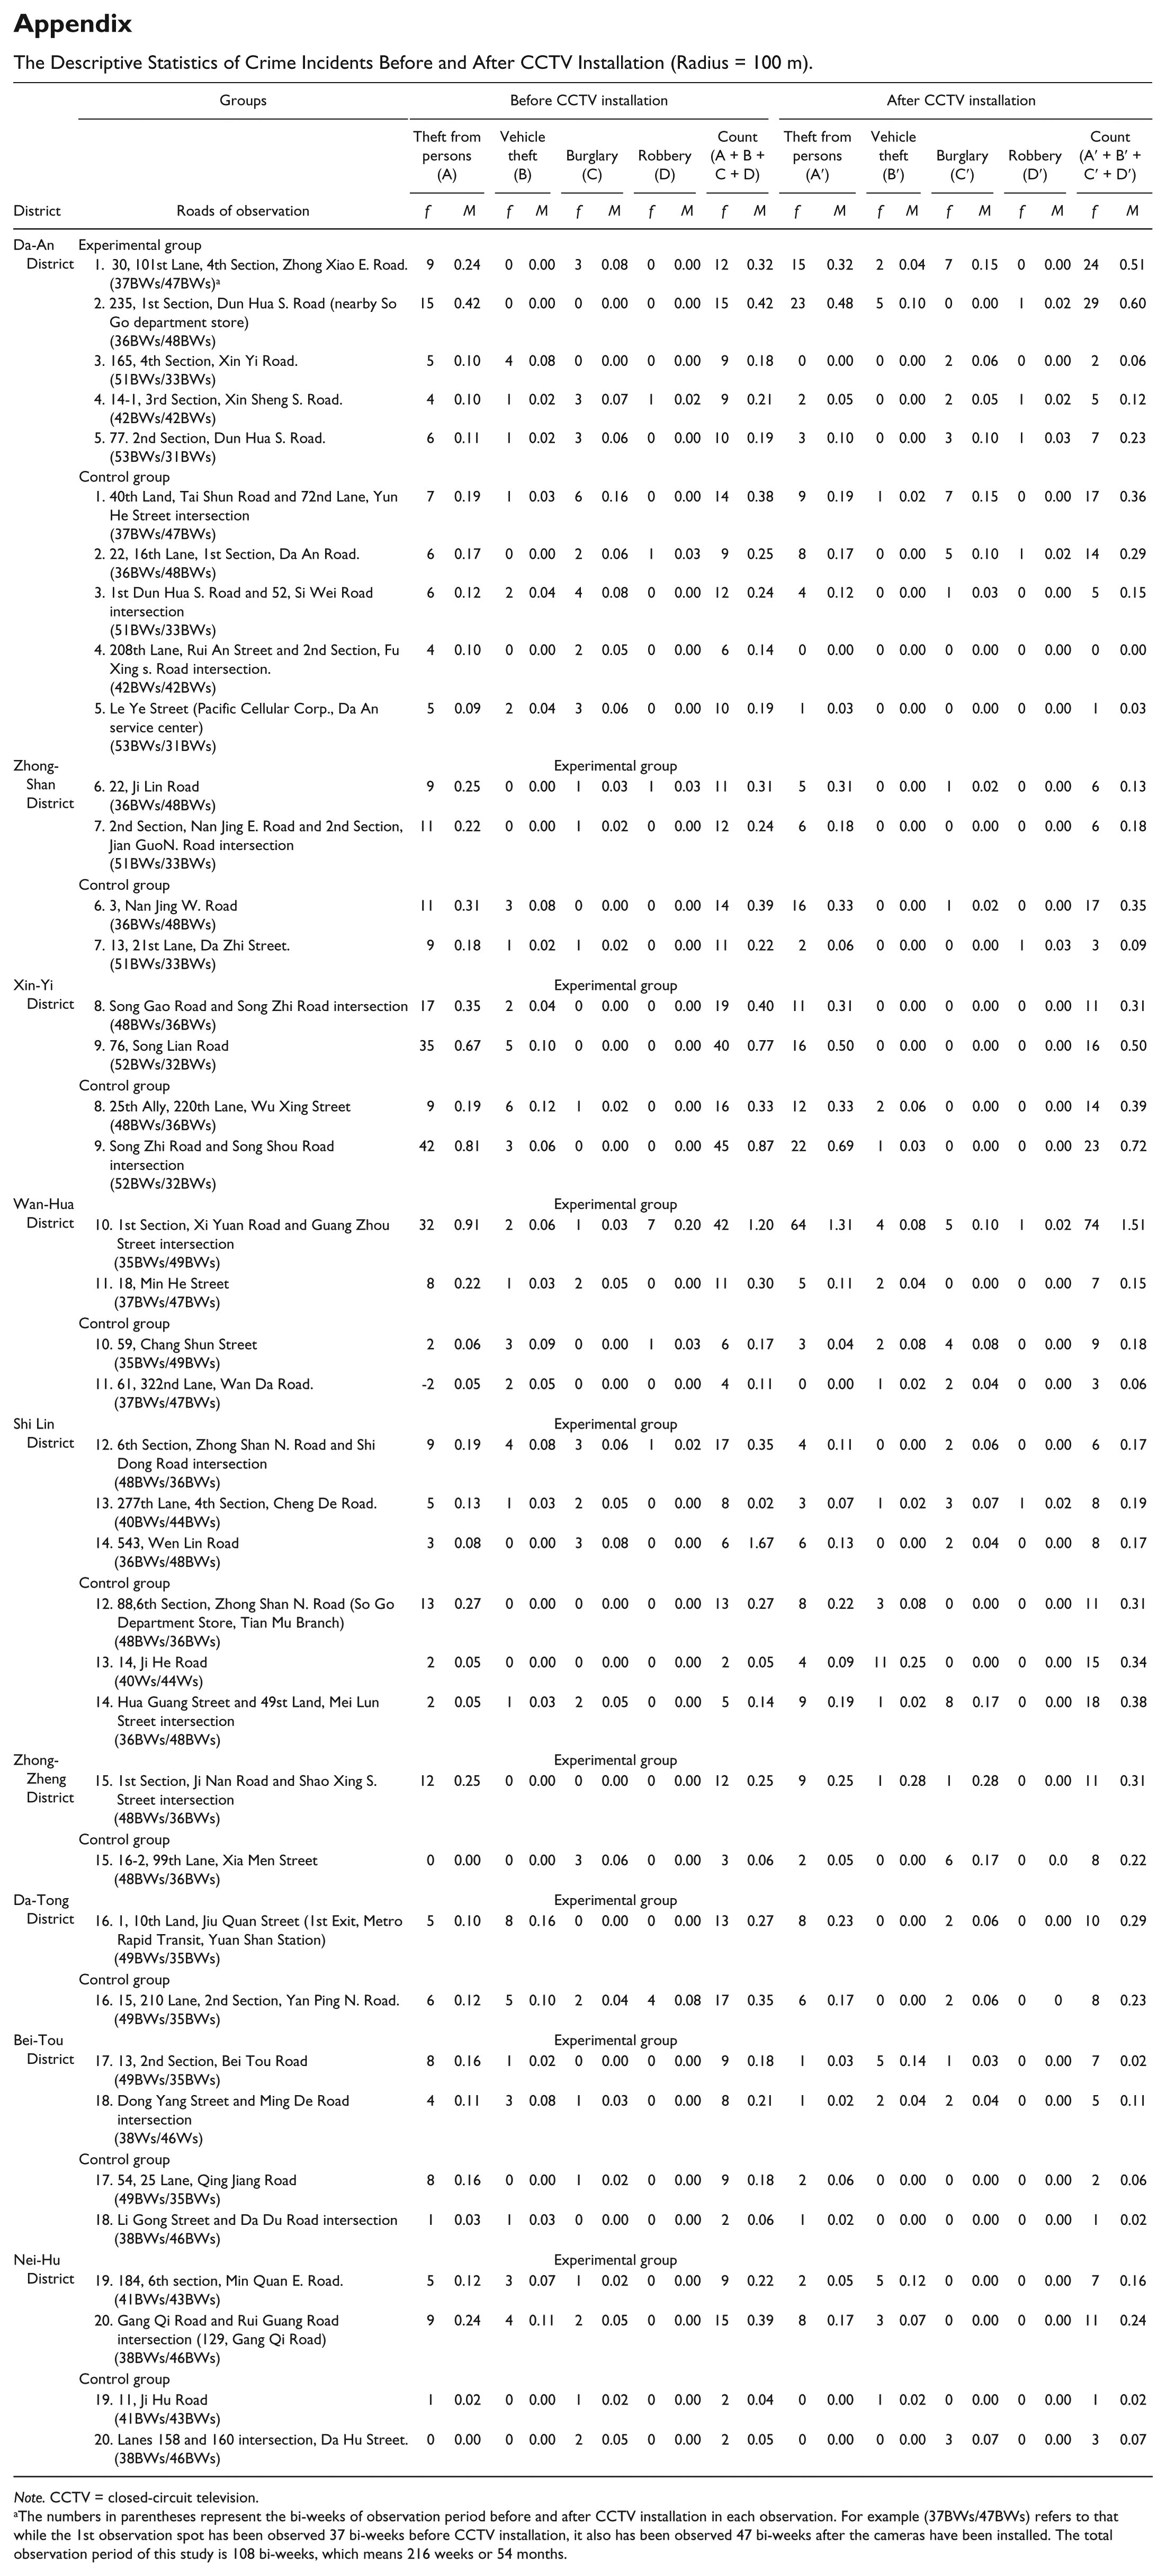
Appendix presents the descriptive statistics for 40 observations (20 target and 20 control sites) during this 54-month survey period. First, among five target sites in Da-An District, two observations showed a trend of crime reduction after CCTV installation, whereas three observations revealed an overall level of crime increase after CCTV installation. In terms of control sites, one observation (namely, 22, 16th Lane, 1st Section, Da-An Road) showed an increasing trend of total crime events after CCTV installation. The other four control sites in Da An district presented a trend of crime reduction.
As for the Zhong-Shan district, in all four observations, no matter whether in the target or control sites, there was a trend of crime reduction after CCTV installation. For example, in one observation in the control site (namely, 13, 21st Lane, Da-Zhi Street), the total crime incident rate decreased by 59% after CCTV installation. Also, in the observation of 22, Ji Lin Road in the target site, the total crime incident rate declined by 58% after CCTV installation.
With respect to the Xin-Yi District, only one control site (namely, 25th Ally, 220th Lane, Wu-Xie Street) showed a trend of crime incident increase, whereas the other sites presented a trend of crime incident reduction after CCTV installation. In the Wan-Hua District, the 1st Section, Xi-Yuan Rd. and Guang-Zhou St. intersection witnessed an increase of total crime incidents, whereas the other three observations showed either no difference or a trend of crime incident reduction.
In terms of the Shi-Lin District, on one hand, two target sites showed an insignificant difference before and after CCTV installation (namely, No. 277, Sec. 4, Cheng De Rd. and No. 543, Wen-Lin Rd.); on the other hand, the observation at the intersection of Sec. 6, Zhong-Shan N. Rd. and Shi-Dong Rd. witnessed a clear trend of decrease among total crime incidents. In contrast, among the control sites three of them showed an increased level of total crime incidents. In other words, the three observations’ crime data collected from the Shi-Lin District registered an increase in the overall crime rate over the 54-month observation period.
In Zhong-Zheng District, two observations, regardless of target or control sites, were found to have an increased level among those in total crime incidents. With respect to the Da-Tong District, while the target sites showed a slight increase of crime incidents before and after CCTV installation, the matched control sites showed a trend of crime incident reduction. With respect to two target sites and two control sites collected in the Bei-Tou District, all presented a trend of crime event reduction. Finally, in the Nei-Hu District, similarly, except for the Lanes 158 and 160 intersection featuring an increase in overall crime effect, the other three observations presented a trend of crime incident reduction (including two target sites).
Table 1 displays the frequencies and means for each of the four types of crime incident known to the police before and after CCTV installation during the surveyed 54 months. First, theft from persons was the most frequently occurring incident across target and control sites alike, as well as during the before- and after-CCTV installation project periods. Second, while the total crime incidents dropped after the CCTV installation by 9.4% in the target sites, the crime events occurring in the matched control sites also presented a downward trend by 13.4%. Specifically, three crime incident types (i.e., theft from persons, vehicle theft, and robbery) presented a trend of decrease which varied from 9.0% to 66.7 % in both target and control settings, except for burglary (increasing by 19.2% and 40.0%, respectively). Overall, it should be noted that the number of crime incidents that occurred in both target and control sites had decreased after CCTV installation. Of note, however, is whether the downward trend was statistically significant for each of the types of crime being monitored; this question must be examined by using more advanced statistical tools.
The Frequency of All Types of Crime Incidents Occurred the Observation Groups (Radius = 100 m).
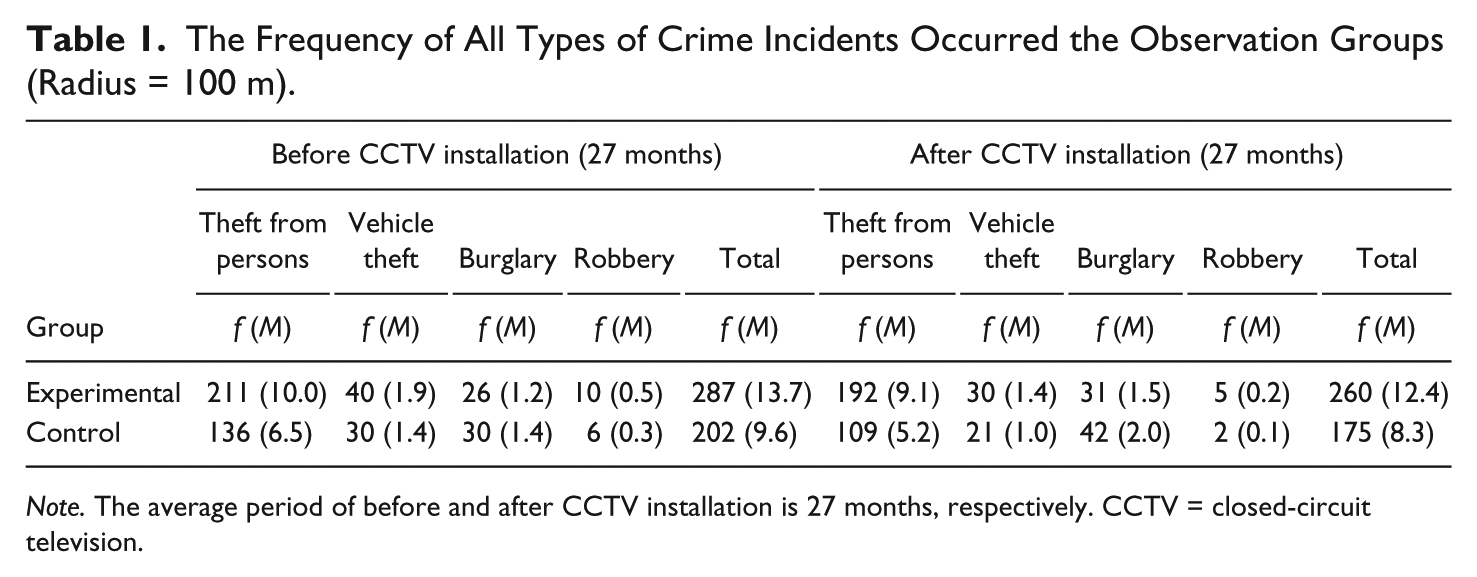
Note. The average period of before and after CCTV installation is 27 months, respectively. CCTV = closed-circuit television.
An Interrupted Time-Series Analysis
Estimation results for each type of crime incident which occurred within every 2-week period are presented in a series of tables. Using these data, we compared the results derived from four models (i.e., PAR(1), PAR(2), Poisson regression, and negative binomial regression) for the crimes of theft from persons, vehicle theft, burglary, and robbery in the target and control sites, respectively. Here, we not only report coefficient estimates and standard error results but also compute the percentage changes for the CCTV interventions. For the Poisson and negative binomial regression models, the percentage change in the odds for a unit change in a regressor is

For the PAR(ρ), the estimated percentage change in the counts for Δzt can be calculated by
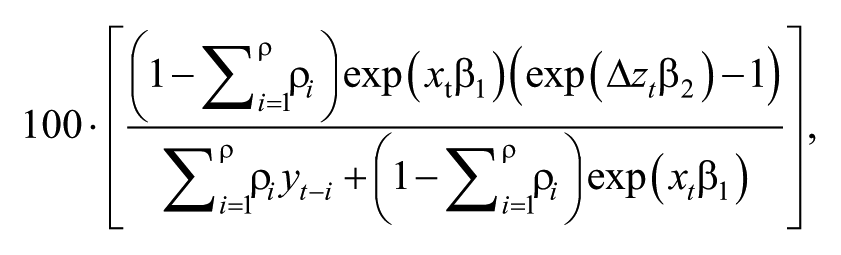
where Xt = [xt, zt] and β = [β1, β2] are the regression parameters for xt and zt, respectively.
As shown in Tables 2 to 4, the CCTV installation intervention had neither a temporary nor permanent significant impact on crime reduction on theft from persons, vehicle theft, and burglary incidents as determined from all four estimation methods employed among target sites. However, the four regression models generated a significant negative post-CCTV intervention effect on robbery in target sites, as shown in Table 5; this finding was consistent with our original hypothesis. The coefficients were almost identical across the four models, indicating that there is about a 60% decrease in robbery occurrence due to the CCTV installation in the long run. It should be noted that the number of robbery incidents did not appear to witness a significant change in the matched control sites after the time of CCTV installation. Additional analyses using the same four regression models were conducted for each type of crime incident using a monthly cycle. A very similar set of results was produced using that time period, thus suggesting that our findings on crime reduction effects are likely robust and reliable.
A Comparison of Estimation Results for Theft on the Street.
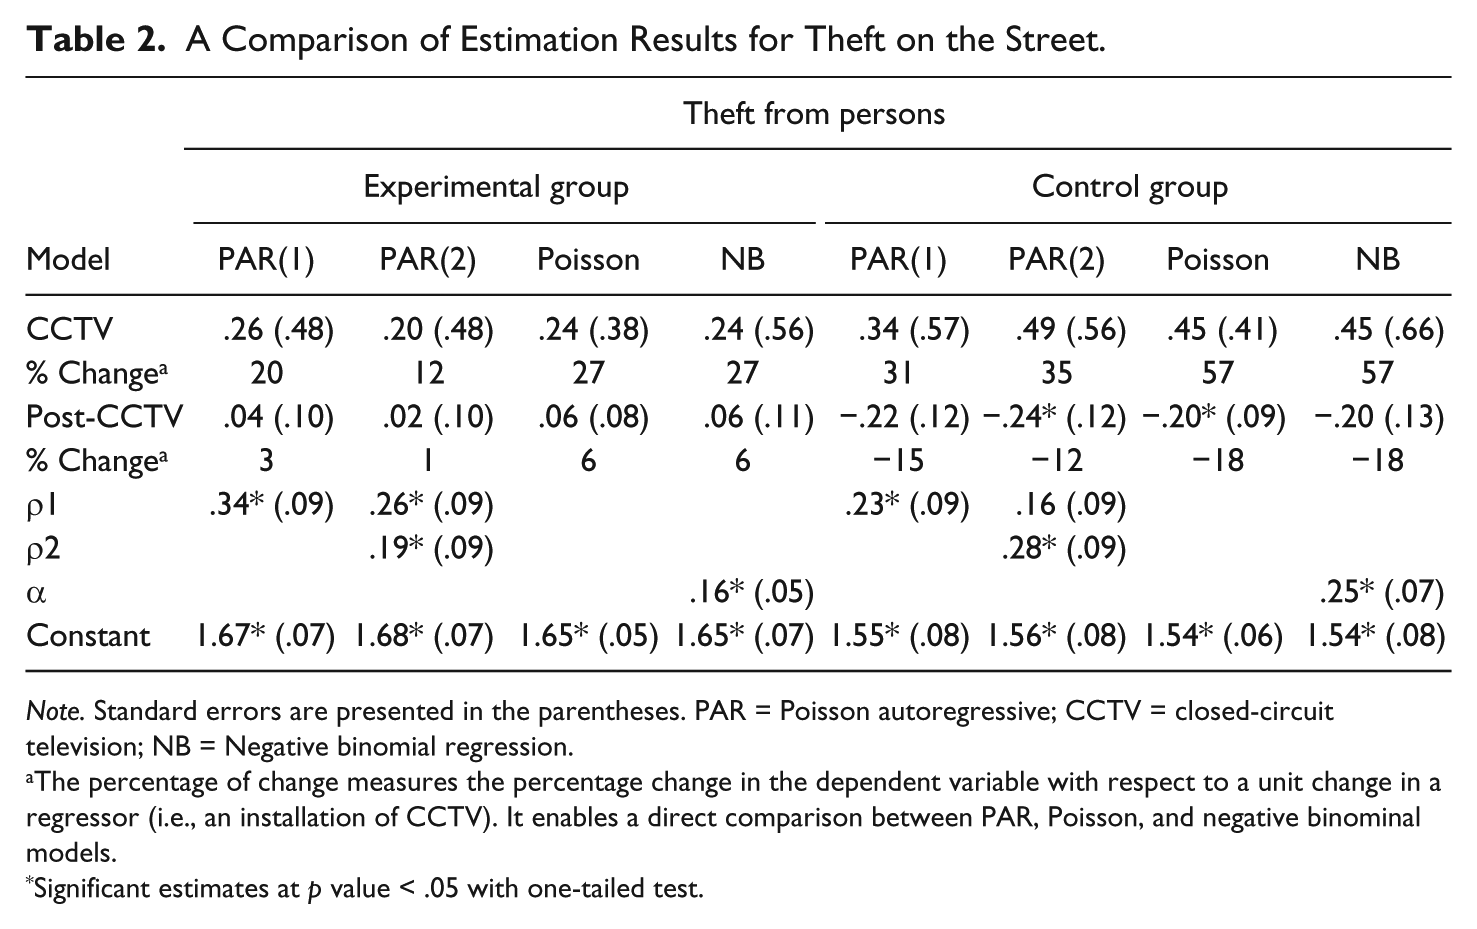
Note. Standard errors are presented in the parentheses. PAR = Poisson autoregressive; CCTV = closed-circuit television; NB = Negative binomial regression.
The percentage of change measures the percentage change in the dependent variable with respect to a unit change in a regressor (i.e., an installation of CCTV). It enables a direct comparison between PAR, Poisson, and negative binominal models.
Significant estimates at p value < .05 with one-tailed test.
A Comparison of Estimation Results for Vehicle Theft.
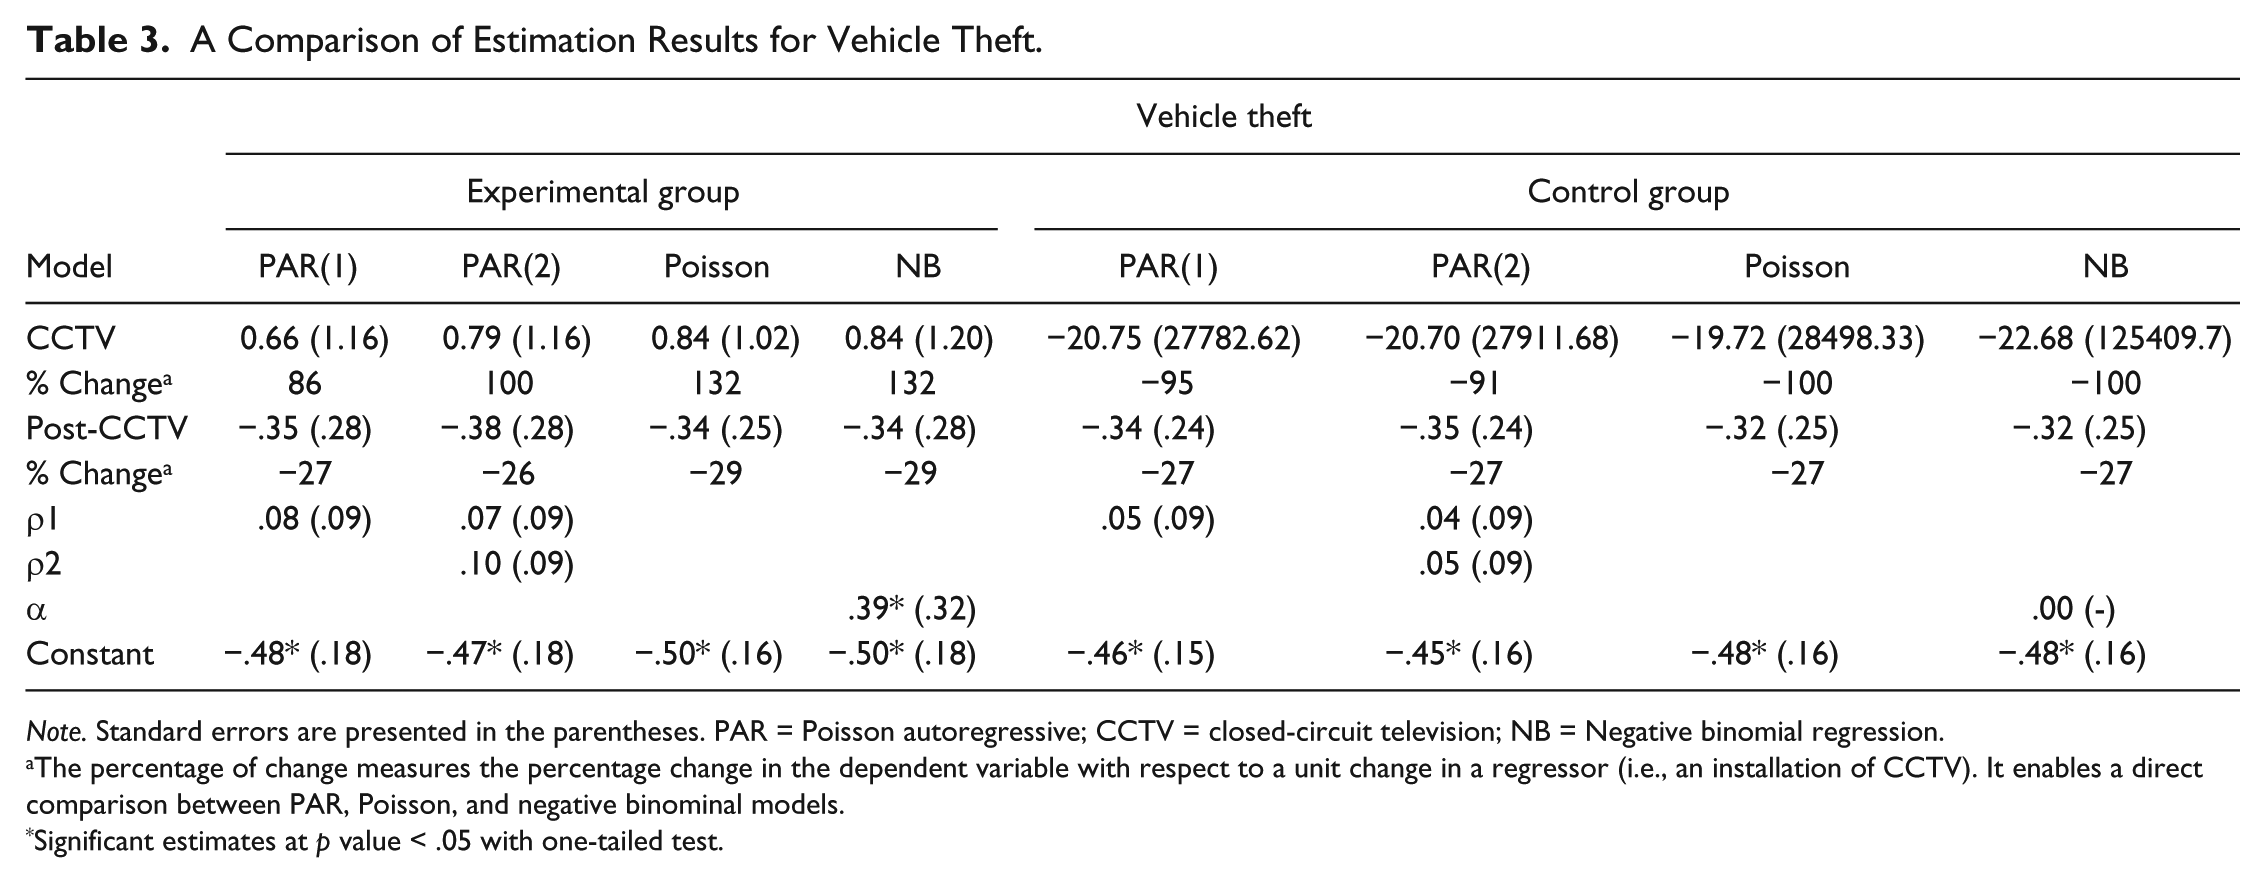
Note. Standard errors are presented in the parentheses. PAR = Poisson autoregressive; CCTV = closed-circuit television; NB = Negative binomial regression.
The percentage of change measures the percentage change in the dependent variable with respect to a unit change in a regressor (i.e., an installation of CCTV). It enables a direct comparison between PAR, Poisson, and negative binominal models.
Significant estimates at p value < .05 with one-tailed test.
A Comparison of Estimation Results for Burglary.
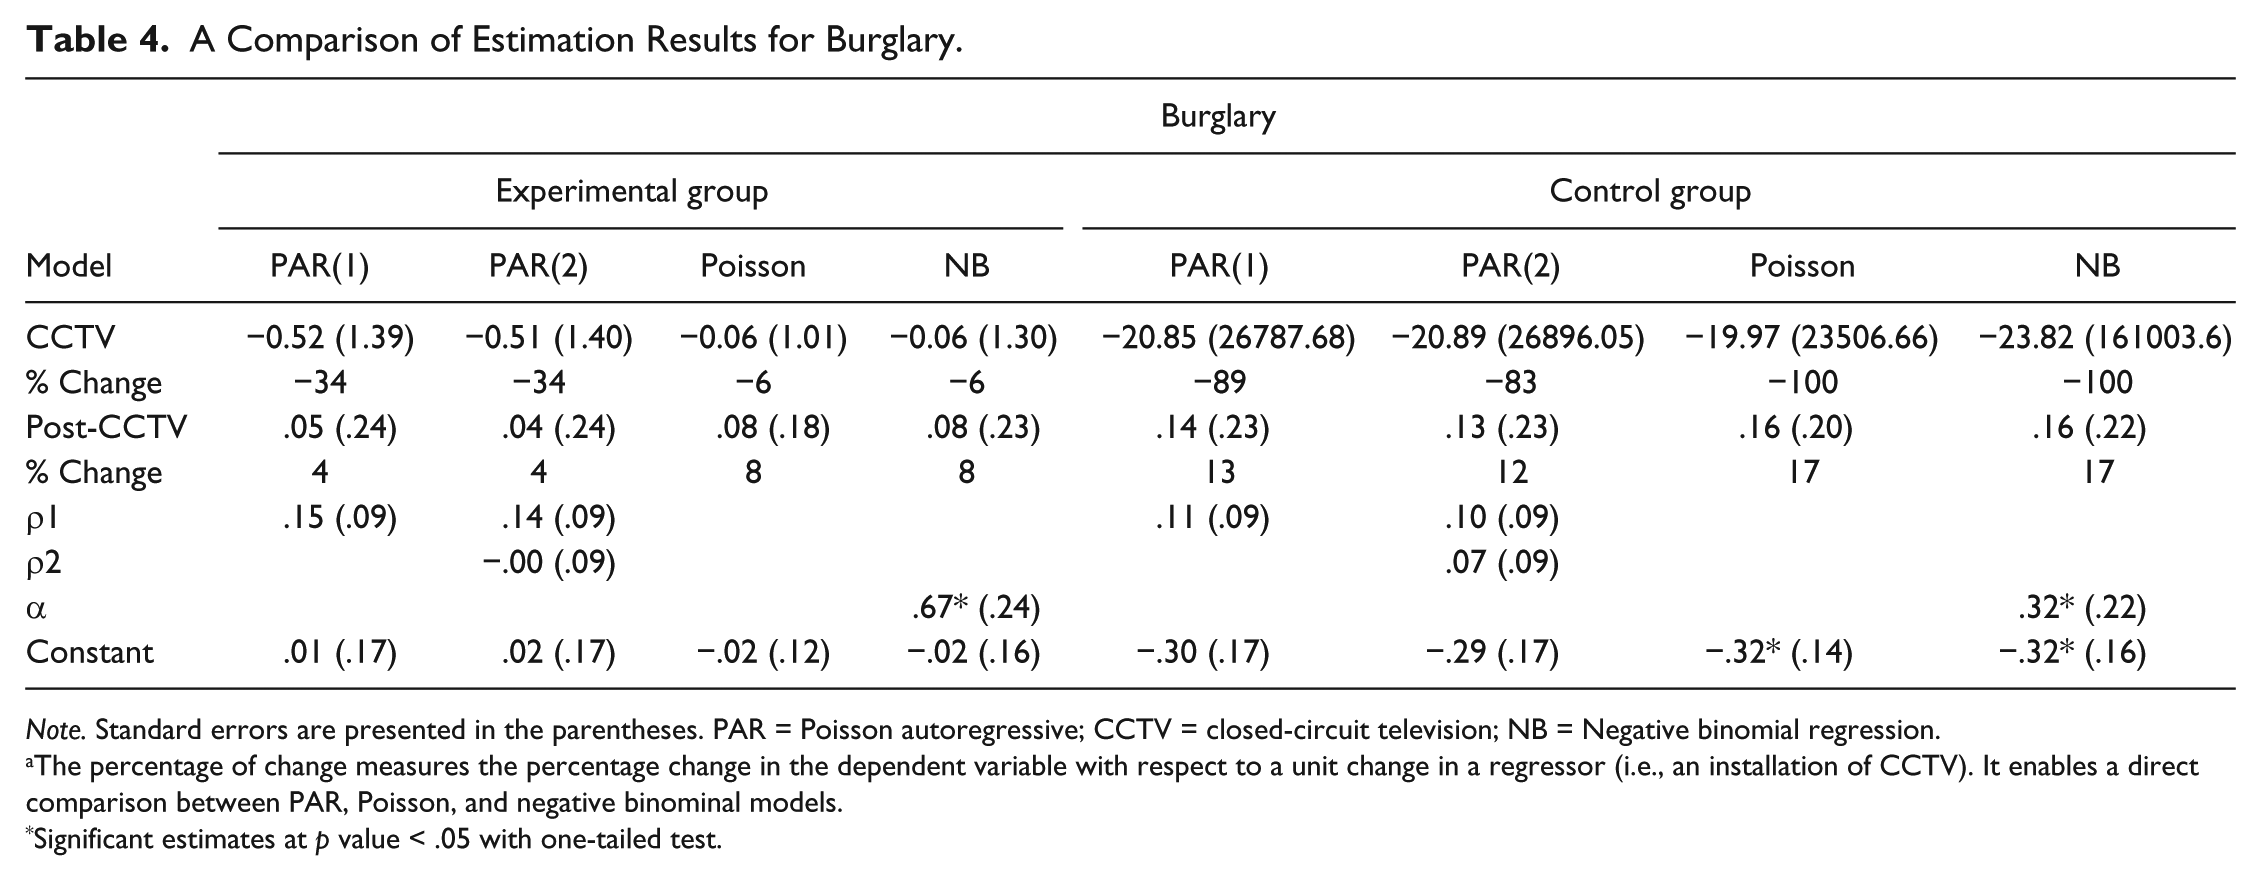
Note. Standard errors are presented in the parentheses. PAR = Poisson autoregressive; CCTV = closed-circuit television; NB = Negative binomial regression.
The percentage of change measures the percentage change in the dependent variable with respect to a unit change in a regressor (i.e., an installation of CCTV). It enables a direct comparison between PAR, Poisson, and negative binominal models.
Significant estimates at p value < .05 with one-tailed test.
A Comparison of Estimation Results for Robbery.
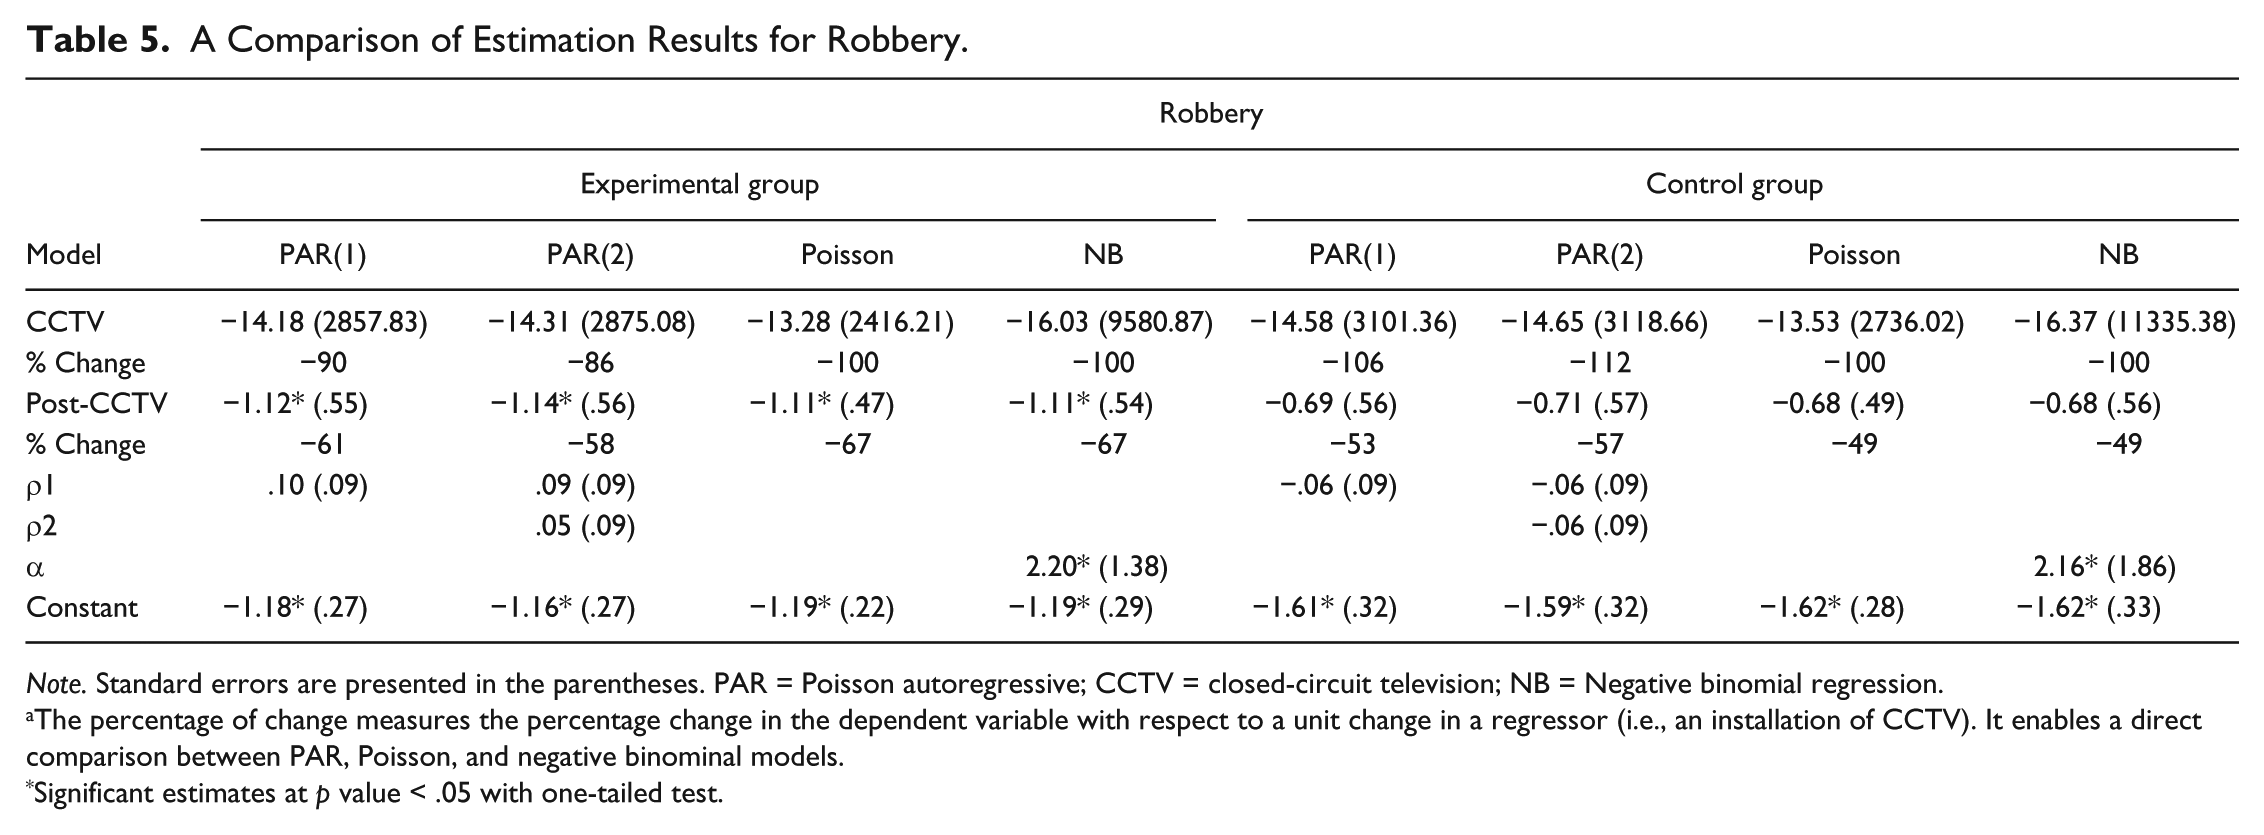
Note. Standard errors are presented in the parentheses. PAR = Poisson autoregressive; CCTV = closed-circuit television; NB = Negative binomial regression.
The percentage of change measures the percentage change in the dependent variable with respect to a unit change in a regressor (i.e., an installation of CCTV). It enables a direct comparison between PAR, Poisson, and negative binominal models.
Significant estimates at p value < .05 with one-tailed test.
Difference in Analysis on Comparison
Following the criteria identified by Welsh and Farrington (2002), whose work incorporated before-and-after CCTV intervention measures of crime incidence in target and comparable control areas, we also examined the crime reduction effects between target and control sites. In this regard, the CRQ was developed to examine the differences between target and control condition outcomes. Figure 3 presents the study findings in this regard. As shown, the average CRQ for all target to matched control site crime reduction comparisons was 0.36, which is lower than 1; this finding suggests that the overall effects of crime reduction among these target sites were lower than for their control condition counterpart sites.
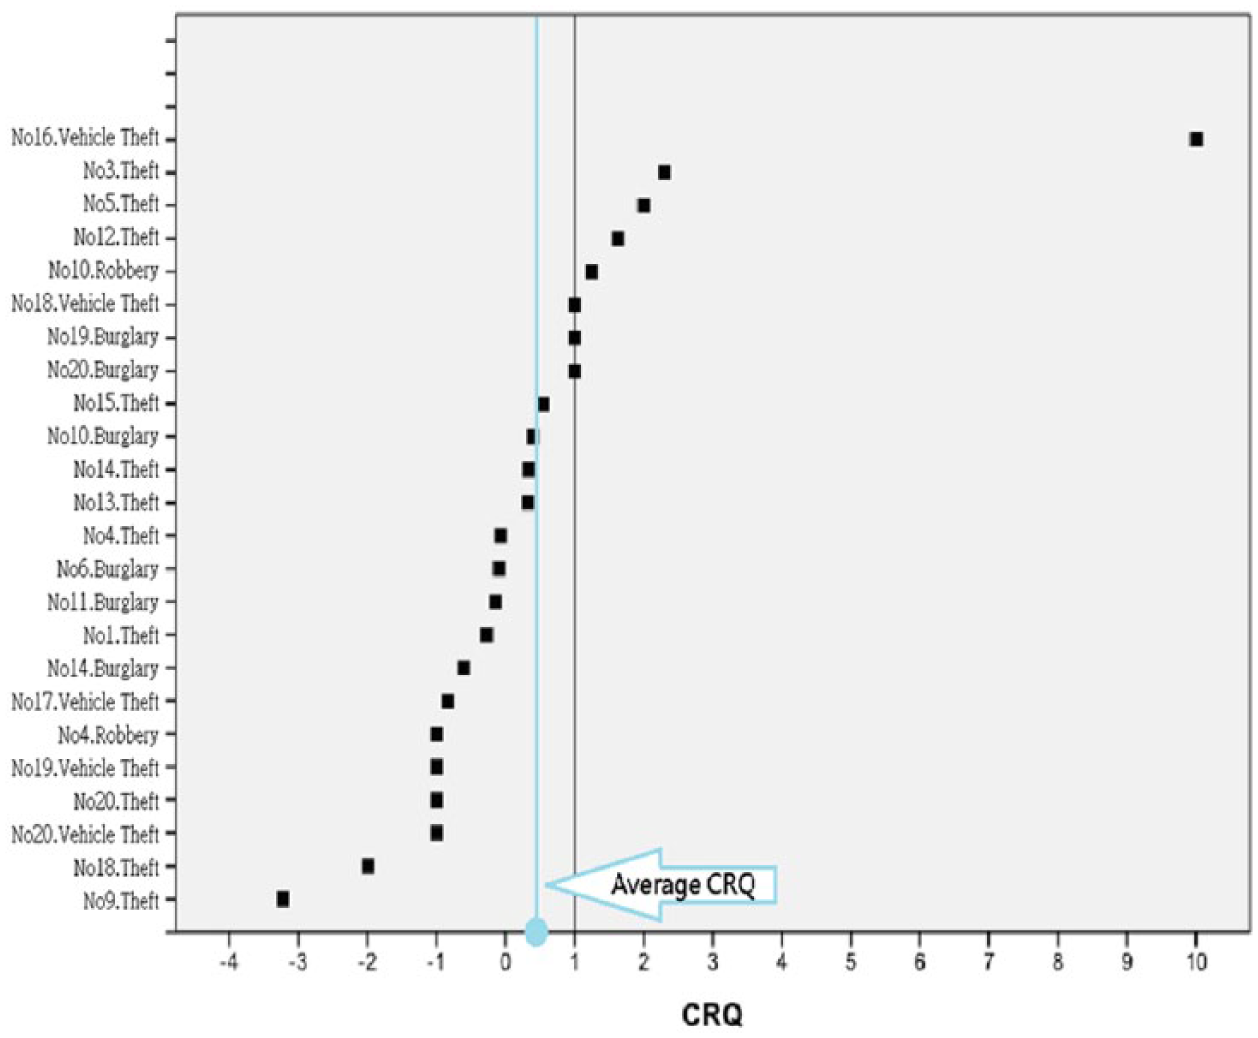
The effects of crime reduction between experimental and control groups (radius = 100 m).
However, it must be noted at the same time that in 8 out of 20 target sites significant positive impacts on crime reduction (CRQ equal to 1 and above) were documented, as follows: No. 16’s vehicle theft (CRQ = 10.0), No. 3’s theft from the person (CRQ = 2.3), No. 5’s theft from persons (CRQ = 2.0), No. 12’s theft from persons (CRQ = 1.63), No. 10’s robbery (CRQ = 1.25), No. 18’s vehicle theft (CRQ = 1.0), No. 19’s burglary (CRQ = 1.0), and No. 20’s burglary (CRQ = 1.0).
By contrast, in 12 target sites their CRQs were found to be less than 1, suggesting that the levels of crime reduction in those target sites were lower than those in their matched counterpart sites after CCTV installation. Namely, No. 9’s theft from persons (CRQ = −3.22), No. 18’s theft from persons (CRQ = −1.99), No. 20’s vehicle theft (CRQ = −1.0), No. 20’s theft from persons (CRQ = −1.0), No. 19’s vehicle theft (CRQ = −1.0), No. 4’s robbery (CRQ = −1.0), No. 17’s vehicle theft (CRQ = −0.84), No. 14’s burglary (CRQ = −0.6), No. 1’s theft from persons (CRQ = −0.27), No. 11’s burglary (CRQ = −0.15), No. 6’s burglary (CRQ = −0.09), No. 4’s theft from the person (CRQ = −0.07), No. 13’s theft from the person (CRQ = 0.33), No. 14’s theft from persons (CRQ = 0.34), No. 10’s burglary (CRQ = 0.4), and No. 15’s theft from persons (CRQ = 0.54).
Overall, although most matched target and control sites had comparisons, unexpectedly, they failed to produce evidence of a statistically significant effect. Stated differently, we found nonetheless that the introduction of CCTV cameras in some sites did produce a significantly beneficial effective on theft from persons, robbery, burglary, and vehicle theft incidents. Such findings do open the door to the analysis of factors associated with the optimality of location decisions pertaining to camera installation and the refinement of CCTV use in crime prevention work.
Discussion and Conclusion
Discussion
Police-monitored CCTV initiatives have been largely utilized as methods of monitoring public space over the past decade in Taiwan. While of late there is a growing number of research projects conducted in Western societies directed toward evaluating the effects of CCTV on crime prevention, this issue has been largely overlooked despite the widespread adoption of the technology. Drawn from theoretical framework and research designs developed in the West, the current study examines the effectiveness of police-monitored CCTV on street crime incidents in Taiwan’s Taipei city. Also, a quasi-experimental test including 20 target areas and 20 matched control areas via time series and CRQ were utilized to analyze the crime-reduction effects of each open-street CCTV observation site. Some significant findings are noteworthy and are addressed here.
First, the main findings derived from time-series analysis indicate that, except for robbery crimes, the CCTV initiative failed to demonstrate either a temporary or permanent effect on those property crime incidents (i.e., theft from persons, vehicle theft, and burglary) that were systematically tracked among the target sites. With respect to the effects of comparing matched target and control sites, results of the CRQ comparisons indicated that while most CCTV cameras had only a marginal effect on crime reduction, a few camera-equipped sites witnessed significant favorable effects on theft from persons, robbery, burglary, and vehicle theft incidents. Except for the crime of robbery, our data do not provide much support for the first hypothesis. In addition, our data provide only marginal support for the second and third hypotheses. In addition, to this overall characterization of the findings, other noteworthy findings deserve further discussion.
Second, although the counts on the collective totals of all four types of crime incidents known to the police in the target sites declined by 9.4%, the comparable figure for the matched control sites dropped by 13.4 % during the same 54-month period. To be specific, three crime types (i.e., theft from persons, vehicle theft, and robbery) presented a decreased trend that varied from 9.0% to 66.7 % in both target and control conditions; however, burglary increased by 19.2% and 40.0%, respectively. Nevertheless, using statistically more powerful comparisons drawn from time-series analysis and the CRQ statistic show no evidence to support the view that CCTV cameras promote the deterrence of burglary crimes. This finding for Taipei City is rather consistent with previous studies conducted elsewhere in the world (see also Gill & Spriggs, 2005, for further review).
Third, the existing literature suggested that the effectiveness of CCTV cameras is rather dependent on the micro-level/local place-based environment wherein they are installed (Caplan et al., 2011; La Vigne et al., 2011; Lim et al., 2016; Piza et al., 2014; Ratcliffe et al., 2009). Namely, in some observations the counts of theft from persons and vehicle theft significantly dropped after the CCTV cameras were installed. Taking the Metro Rapid Transit, Yuan-Shan Station (the No. 1 target site in Da-Tong District, see the appendix) as the first example, the evaluation research study revealed that theft from persons significantly increased, whereas the vehicle theft rate significantly decreased during the same 54-month time period. After consulting with the local police department, the police officers there reported that the International Floral Expo (IFE) held in November 2010 to April 2011 had a great impact on crime fluctuations. For example, thousands of Taiwanese citizens and tourists from other countries visited the IFE every weekend during that period. As a result, theft from persons counts increased even though the TCPD allocated many sworn officers and deployed more CCTV cameras in the vicinity. Similarly, theft from persons and vehicle theft counts increased, respectively, whereas burglary incidents decreased in frequency in the No. 2 target site (Gang-Qi Road and Rui-Guang Road Intersection) in Nei-Hu District. Based on these mixed findings, we conclude that the introduction of the CCTV systems was associated with varied impacts on crime in different sites featuring differing conditions (Ratcliffe et al., 2009). Such social events (e.g., IFE) and unique locations (e.g., new open MRT stations, school areas, and residential areas) being viewed as situational characteristics would influence the effect of CCTV installation and monitoring on crime (Lim et al., 2016).
Finally, and most importantly, while there was no significant change in rates of property crime incidents before and after CCTV installation, the outcome of the time-series analysis indicated that there was an overall downward trend in robbery. The installation of CCTV cameras produced a significant impact on robbery reduction, however, only in the target sites as was hypothesized. Generally speaking, robbery incidents known to the police are relatively few in number based on the existing literature developed in Western societies, contributing to the difficulty of evaluating the impact of CCTV cameras on robbery crimes known to the police (Ratcliffe et al., 2009). While our finding is not the case that robbery was unaffected by CCTV, Piza et al. (2014) noted that a CCTV system seeks to change an offender’s perception such that she or he believes if they commit a crime they will be caught. When robbers perceive that a monetary target has been secured and monitored by a CCTV camera, his or her intention to rob will be deterred. More supportive research in this regard is warranted in the future.
Given the overall finding of a much less positive effect on the four types of crime investigated than expected, we would like to offer possible explanations for the findings reported here. First off, we take note of Von Hoffer’s (2011) analysis of the long-term violent and property crime statistics (1750-2008) kept in Scandinavian countries indicating that changes in criminal sanctions appear to have had negligible effects on crime incidence over this vast stretch of time. These changes have included the use and subsequent abolition of the death penalty, a gradual replacement of imprisonment with alternative sanctions, and the shifting use of fines—sometimes less onerous, sometimes more. This very modest impact on the commission of crime rates could also possibly be happening in our study by using CCTV cameras to deter potential offenders. Von Hoffer also suggested that “an empirically informed criminal justice policy should look first for means of prevention, other than those offered by the criminal justice system (p.42).” We undertook our study as a direct response to this challenge by exploring crime prevention via the use of strategically located cameras where important public places are monitored to promote public safety.
Table 6 displays crime rate trend data of both property and robbery crimes in Taipei City over the course of the past decade. Crime rates decreased significantly over the course of the decade, going from 2,315 per 100,000 population in 2002 to 1,561 per 100,000 population by 2015—a 33% decrease. Furthermore, property and robbery crimes featured in our study decreased by 38% (for theft from persons) to 90% (for auto theft). It might be fairly stated that Taipei City has stepped into a “Low Crime Era” over this period of time. Chang and Tsai (2007) noted that at all levels of governments in Taiwan, several progressive policing strategies based on theoretical criminology—specifically Rational Choice Theory, Routine Activities Theory, and Situational Crime Prevention—have been adopted. For example, Hot Spots Policing, Broken Windows Policing, vehicle licensing, parts marking, the disruption of stolen goods markets were all theory—Informed and evidence-based policing practices were employed over the past two decades in most population centers across the country (Sheu & Chen, 2013). Those evidence-based policing strategies often lead to observed crime reduction outcomes hoped for by the police and their stakeholders. Notably, the long-term trend of crime rate reduction began as early as the turn of this century and was continuing to take place during our study period. It is quite possible that low crime levels may also lead to low deterrence levels on crime reduction, suggesting that most observations will have insignificant effects on crime reduction following the period during which CCTV camera installation took place.
Statistics of Property and Robbery Crime in Taipei City (2002-2015).
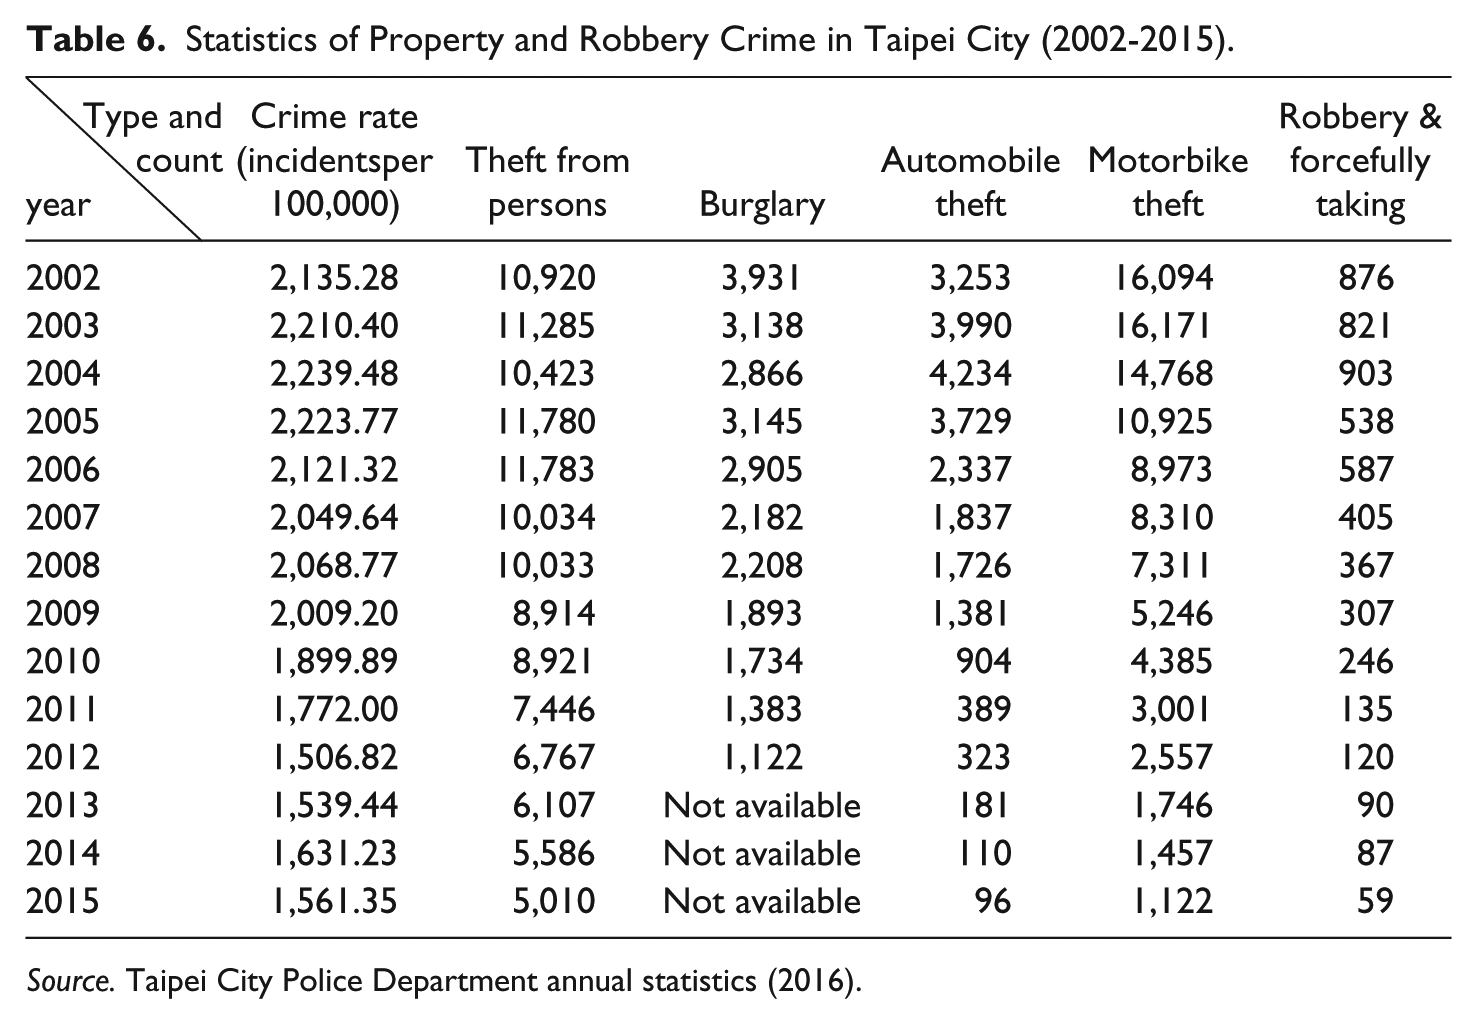
Source. Taipei City Police Department annual statistics (2016).
Policy Implications
First, although many people, primary among them law enforcement officials, continue to place great faith in CCTV cameras for achieving crime prevention, the addition of more sites under surveillance is unlikely to results in much additional gain in crime prevention. Second, the police would be wise to develop additional proactive policing strategies and undertake alternative crime prevention initiatives. For example, the New York City police department’s COMPSTAT policing could potentially be implemented in Taipei City because the government would like to invest more of its budgets on high-tech policing in future years. The NYPD’s experience serves as an appropriate role model for how to establish and manage a technology and information-intensive program that many police agencies across the United States and other countries around the world have put into effect with beneficial results.
Third, while many residents, neighborhood managers, and local and national legislators have pressured the TCPD to install evermore CCTV cameras around the country, the leadership of police departments should express proper caution concerning an ever-greater coverage of public spaces. The privacy rights of citizens should be thoughtfully maintained in consideration. Forth, police department leadership should encourage the private sector corporation, retail businesses, and neighborhood-level governments to not only install CCTVs where they are thought to be needed but also to participate in proactive crime prevention planning (i.e., organizing neighborhood watch programs, installing burglar alarm systems, and recruiting and retaining more uniformed security officers).
Finally, the primary mission of all CCTV systems should be to improve criminal investigation and promote the prosecution of crime rather than simply seek to produce a deterrent effect. Based on the statistics reported by the TCPD (2012), for example, the clearance rate of robbery increased from 52.4% in 2010 to 85.5% in 2011, due in substantial part to the assistance of video evidence collected by CCTV cameras. Concurrently, the burglary clearance rate also increased from 40.1% to 63.9%. Although the benefits of CCTV installation on crime reduction are indeed rather limited, the increase of clearance rates on criminal investigation should be seen as an important extra benefit when CCTVs are appropriately employed.
Limitations
Some limitations should be acknowledged in the evaluation research reported here. First, CCTV’s density in Taipei City is basically much higher than is the case for other Taiwanese counties and cities. For example, while the Taipei City government installed 13,699 CCTV cameras in public areas over the past 3 years, only 3,109 were installed in Taoyuan County over the period 2002 to 2010 (Wu, 2011). According to TCPD statistics, CCTV’s density is 155 persons per km2, meaning that Taipei City is highly covered by these police-installed cameras in public areas. As a direct result, it was very difficult to design as many valid observation sites as would be ideal. Initially, our evaluation followed the criteria identified by Welsh and Farrington (2002) in the hope that the more crime counts collected in each observation site, the more accurate we would be in documenting the effects of CCTV. Unfortunately, several collected observation site data reports showed zero crime incidents during the surveyed period due to the relatively close distance between CCTV installments. However, if each selected observation site had extended its radius (e.g., 200 m rather than 100 m), the deterrent effects of collected CCTVs would be influenced by those adjacent and unobserved CCTVs.
Second, due to the aforementioned fact of CCTV’s high density of cameras installed in public spaces (i.e., traffic roads and intersections, parking lots, and sidewalks in business areas), it is difficult to collect more control sites to conduct a systematic matched comparison of target and control sites. Furthermore, because the control sites were selected adjacent to the target areas and it was assumed that they could exist just beyond 100 m, there was inevitably a significant possibility of contamination (e.g., displacement or diffusion of benefits) from the target areas to the control areas (Piza, 2018). To reduce the influence from open-street CCTV installed in a target area, Lim et al. (2016) defined a control area as the area from 400 to 800 m away from a matched target area. Recent evaluation research has focused on the use of propensity score matching (PSM) as a useful technique to identify suitable control sites in quasi-experimental studies (Piza, 2018). In addition, PSM would minimize the multivariate distance between the control and target sites, thus aiding statistical interpretation and reducing the variance between matched pairs. Drawing from the work of Bowers and Johnson (2003), we created the CRQ formula that helped us to successfully identify if there was a reduction in crime between matched target and control areas. Further research in relation to this subject is clearly warranted.
Third, theoretically a random assignment provides the best avenue for reducing selection bias by creating treatment and control conditions that are statistically equivalent across pertinent variables (Cook & Campbell, 1979). As all documented evaluation of CCTV have occurred post hoc, randomization of treatment and control conditions has not been possible (Piza, 2018). Actually, CCTV sites are largely permanent fixtures, with cameras being hardwired to physical structures and wireless networks configured to stream footage to/from specific locations. Moreover, expenditures related to CCTV deployment routinely total in the millions of dollars when hardware, software, and maintenance expenses are considered in total (La Vigne et al., 2011), suggesting it is difficult to assume “comparability” between each paired target and control sites. In our case, TCPD invested 50 million USD to install 13,699 CCTV cameras via 3.3 million for maintenance every year. At the beginning of this study, we asked the TCPD’s officials to remove or shut down some installed CCTV cameras for a period to accommodate a quasi-experimental design for this evaluation; despite our detailed request, they were unwilling to accommodate our request.
Finally, privately owned CCTVs would also lead to unexpected influences regarding our evaluation because we had no effective way to exclude them (e.g., asking those sectors or residents to remove their CCTVs during surveyed period). Future researchers should take into consideration how such CCTVs systems lead to crime incidence outcomes in combination with public space monitoring CCTV systems.
Footnotes
Appendix
The Descriptive Statistics of Crime Incidents Before and After CCTV Installation (Radius = 100 m).
| District | Groups |
Before CCTV installation |
After CCTV installation |
||||||||||||||||||
|---|---|---|---|---|---|---|---|---|---|---|---|---|---|---|---|---|---|---|---|---|---|
| Roads of observation | Theft from persons(A) |
Vehicle theft |
Burglary |
Robbery |
Count |
Theft from persons(A′) |
Vehicle theft |
Burglary |
Robbery |
Count |
|||||||||||
| f | M | f | M | f | M | f | M | f | M | f | M | f | M | f | M | f | M | f | M | ||
| Da-An District | Experimental group | ||||||||||||||||||||
| 1. 30, 101st Lane, 4th Section, Zhong Xiao E. Road. (37BWs/47BWs) a |
9 | 0.24 | 0 | 0.00 | 3 | 0.08 | 0 | 0.00 | 12 | 0.32 | 15 | 0.32 | 2 | 0.04 | 7 | 0.15 | 0 | 0.00 | 24 | 0.51 | |
| 2. 235, 1st Section, Dun Hua S. Road (nearby So Go department store) (36BWs/48BWs) |
15 | 0.42 | 0 | 0.00 | 0 | 0.00 | 0 | 0.00 | 15 | 0.42 | 23 | 0.48 | 5 | 0.10 | 0 | 0.00 | 1 | 0.02 | 29 | 0.60 | |
| 3. 165, 4th Section, Xin Yi Road. (51BWs/33BWs) |
5 | 0.10 | 4 | 0.08 | 0 | 0.00 | 0 | 0.00 | 9 | 0.18 | 0 | 0.00 | 0 | 0.00 | 2 | 0.06 | 0 | 0.00 | 2 | 0.06 | |
| 4. 14-1, 3rd Section, Xin Sheng S. Road. (42BWs/42BWs) |
4 | 0.10 | 1 | 0.02 | 3 | 0.07 | 1 | 0.02 | 9 | 0.21 | 2 | 0.05 | 0 | 0.00 | 2 | 0.05 | 1 | 0.02 | 5 | 0.12 | |
| 5. 77. 2nd Section, Dun Hua S. Road. (53BWs/31BWs) | 6 | 0.11 | 1 | 0.02 | 3 | 0.06 | 0 | 0.00 | 10 | 0.19 | 3 | 0.10 | 0 | 0.00 | 3 | 0.10 | 1 | 0.03 | 7 | 0.23 | |
| Control group | |||||||||||||||||||||
| 1. 40th Land, Tai Shun Road and 72nd Lane, Yun He Street intersection (37BWs/47BWs) |
7 | 0.19 | 1 | 0.03 | 6 | 0.16 | 0 | 0.00 | 14 | 0.38 | 9 | 0.19 | 1 | 0.02 | 7 | 0.15 | 0 | 0.00 | 17 | 0.36 | |
| 2. 22, 16th Lane, 1st Section, Da An Road. (36BWs/48BWs) |
6 | 0.17 | 0 | 0.00 | 2 | 0.06 | 1 | 0.03 | 9 | 0.25 | 8 | 0.17 | 0 | 0.00 | 5 | 0.10 | 1 | 0.02 | 14 | 0.29 | |
| 3. 1st Dun Hua S. Road and 52, Si Wei Road intersection (51BWs/33BWs) |
6 | 0.12 | 2 | 0.04 | 4 | 0.08 | 0 | 0.00 | 12 | 0.24 | 4 | 0.12 | 0 | 0.00 | 1 | 0.03 | 0 | 0.00 | 5 | 0.15 | |
| 4. 208th Lane, Rui An Street and 2nd Section, Fu Xing s. Road intersection. (42BWs/42BWs) |
4 | 0.10 | 0 | 0.00 | 2 | 0.05 | 0 | 0.00 | 6 | 0.14 | 0 | 0.00 | 0 | 0.00 | 0 | 0.00 | 0 | 0.00 | 0 | 0.00 | |
| 5. Le Ye Street (Pacific Cellular Corp., Da An service center) (53BWs/31BWs) |
5 | 0.09 | 2 | 0.04 | 3 | 0.06 | 0 | 0.00 | 10 | 0.19 | 1 | 0.03 | 0 | 0.00 | 0 | 0.00 | 0 | 0.00 | 1 | 0.03 | |
| Zhong- Shan District | Experimental group | ||||||||||||||||||||
| 6. 22, Ji Lin Road (36BWs/48BWs) |
9 | 0.25 | 0 | 0.00 | 1 | 0.03 | 1 | 0.03 | 11 | 0.31 | 5 | 0.31 | 0 | 0.00 | 1 | 0.02 | 0 | 0.00 | 6 | 0.13 | |
| 7. 2nd Section, Nan Jing E. Road and 2nd Section, Jian GuoN. Road intersection (51BWs/33BWs) |
11 | 0.22 | 0 | 0.00 | 1 | 0.02 | 0 | 0.00 | 12 | 0.24 | 6 | 0.18 | 0 | 0.00 | 0 | 0.00 | 0 | 0.00 | 6 | 0.18 | |
| Control group | |||||||||||||||||||||
| 6. 3, Nan Jing W. Road (36BWs/48BWs) |
11 | 0.31 | 3 | 0.08 | 0 | 0.00 | 0 | 0.00 | 14 | 0.39 | 16 | 0.33 | 0 | 0.00 | 1 | 0.02 | 0 | 0.00 | 17 | 0.35 | |
| 7. 13, 21st Lane, Da Zhi Street. (51BWs/33BWs) |
9 | 0.18 | 1 | 0.02 | 1 | 0.02 | 0 | 0.00 | 11 | 0.22 | 2 | 0.06 | 0 | 0.00 | 0 | 0.00 | 1 | 0.03 | 3 | 0.09 | |
| Xin-Yi District | Experimental group | ||||||||||||||||||||
| 8. Song Gao Road and Song Zhi Road intersection (48BWs/36BWs) |
17 | 0.35 | 2 | 0.04 | 0 | 0.00 | 0 | 0.00 | 19 | 0.40 | 11 | 0.31 | 0 | 0.00 | 0 | 0.00 | 0 | 0.00 | 11 | 0.31 | |
| 9. 76, Song Lian Road (52BWs/32BWs) |
35 | 0.67 | 5 | 0.10 | 0 | 0.00 | 0 | 0.00 | 40 | 0.77 | 16 | 0.50 | 0 | 0.00 | 0 | 0.00 | 0 | 0.00 | 16 | 0.50 | |
| Control group | |||||||||||||||||||||
| 8. 25th Ally, 220th Lane, Wu Xing Street (48BWs/36BWs) |
9 | 0.19 | 6 | 0.12 | 1 | 0.02 | 0 | 0.00 | 16 | 0.33 | 12 | 0.33 | 2 | 0.06 | 0 | 0.00 | 0 | 0.00 | 14 | 0.39 | |
| 9. Song Zhi Road and Song Shou Road intersection (52BWs/32BWs) |
42 | 0.81 | 3 | 0.06 | 0 | 0.00 | 0 | 0.00 | 45 | 0.87 | 22 | 0.69 | 1 | 0.03 | 0 | 0.00 | 0 | 0.00 | 23 | 0.72 | |
| Wan-Hua District | Experimental group | ||||||||||||||||||||
| 10. 1st Section, Xi Yuan Road and Guang Zhou Street intersection (35BWs/49BWs) |
32 | 0.91 | 2 | 0.06 | 1 | 0.03 | 7 | 0.20 | 42 | 1.20 | 64 | 1.31 | 4 | 0.08 | 5 | 0.10 | 1 | 0.02 | 74 | 1.51 | |
| 11. 18, Min He Street (37BWs/47BWs) |
8 | 0.22 | 1 | 0.03 | 2 | 0.05 | 0 | 0.00 | 11 | 0.30 | 5 | 0.11 | 2 | 0.04 | 0 | 0.00 | 0 | 0.00 | 7 | 0.15 | |
| Control group | |||||||||||||||||||||
| 10. 59, Chang Shun Street (35BWs/49BWs) |
2 | 0.06 | 3 | 0.09 | 0 | 0.00 | 1 | 0.03 | 6 | 0.17 | 3 | 0.04 | 2 | 0.08 | 4 | 0.08 | 0 | 0.00 | 9 | 0.18 | |
| 11. 61, 322nd Lane, Wan Da Road. (37BWs/47BWs) |
-2 | 0.05 | 2 | 0.05 | 0 | 0.00 | 0 | 0.00 | 4 | 0.11 | 0 | 0.00 | 1 | 0.02 | 2 | 0.04 | 0 | 0.00 | 3 | 0.06 | |
| Shi Lin District | Experimental group | ||||||||||||||||||||
| 12. 6th Section, Zhong Shan N. Road and Shi Dong Road intersection (48BWs/36BWs) |
9 | 0.19 | 4 | 0.08 | 3 | 0.06 | 1 | 0.02 | 17 | 0.35 | 4 | 0.11 | 0 | 0.00 | 2 | 0.06 | 0 | 0.00 | 6 | 0.17 | |
| 13. 277th Lane, 4th Section, Cheng De Road. (40BWs/44BWs) |
5 | 0.13 | 1 | 0.03 | 2 | 0.05 | 0 | 0.00 | 8 | 0.02 | 3 | 0.07 | 1 | 0.02 | 3 | 0.07 | 1 | 0.02 | 8 | 0.19 | |
| 14. 543, Wen Lin Road (36BWs/48BWs) |
3 | 0.08 | 0 | 0.00 | 3 | 0.08 | 0 | 0.00 | 6 | 1.67 | 6 | 0.13 | 0 | 0.00 | 2 | 0.04 | 0 | 0.00 | 8 | 0.17 | |
| Control group | |||||||||||||||||||||
| 12. 88,6th Section, Zhong Shan N. Road (So Go Department Store, Tian Mu Branch) (48BWs/36BWs) |
13 | 0.27 | 0 | 0.00 | 0 | 0.00 | 0 | 0.00 | 13 | 0.27 | 8 | 0.22 | 3 | 0.08 | 0 | 0.00 | 0 | 0.00 | 11 | 0.31 | |
| 13. 14, Ji He Road (40Ws/44Ws) |
2 | 0.05 | 0 | 0.00 | 0 | 0.00 | 0 | 0.00 | 2 | 0.05 | 4 | 0.09 | 11 | 0.25 | 0 | 0.00 | 0 | 0.00 | 15 | 0.34 | |
| 14. Hua Guang Street and 49st Land, Mei Lun Street intersection (36BWs/48BWs) |
2 | 0.05 | 1 | 0.03 | 2 | 0.05 | 0 | 0.00 | 5 | 0.14 | 9 | 0.19 | 1 | 0.02 | 8 | 0.17 | 0 | 0.00 | 18 | 0.38 | |
| Zhong- Zheng District | Experimental group | ||||||||||||||||||||
| 15. 1st Section, Ji Nan Road and Shao Xing S. Street intersection (48BWs/36BWs) |
12 | 0.25 | 0 | 0.00 | 0 | 0.00 | 0 | 0.00 | 12 | 0.25 | 9 | 0.25 | 1 | 0.28 | 1 | 0.28 | 0 | 0.00 | 11 | 0.31 | |
| Control group | |||||||||||||||||||||
| 15. 16-2, 99th Lane, Xia Men Street (48BWs/36BWs) |
0 | 0.00 | 0 | 0.00 | 3 | 0.06 | 0 | 0.00 | 3 | 0.06 | 2 | 0.05 | 0 | 0.00 | 6 | 0.17 | 0 | 0.0 | 8 | 0.22 | |
| Da-Tong District | Experimental group | ||||||||||||||||||||
| 16. 1, 10th Land, Jiu Quan Street (1st Exit, Metro Rapid Transit, Yuan Shan Station) (49BWs/35BWs) |
5 | 0.10 | 8 | 0.16 | 0 | 0.00 | 0 | 0.00 | 13 | 0.27 | 8 | 0.23 | 0 | 0.00 | 2 | 0.06 | 0 | 0.00 | 10 | 0.29 | |
| Control group | |||||||||||||||||||||
| 16. 15, 210 Lane, 2nd Section, Yan Ping N. Road. (49BWs/35BWs) |
6 | 0.12 | 5 | 0.10 | 2 | 0.04 | 4 | 0.08 | 17 | 0.35 | 6 | 0.17 | 0 | 0.00 | 2 | 0.06 | 0 | 0 | 8 | 0.23 | |
| Bei-Tou District | Experimental group | ||||||||||||||||||||
| 17. 13, 2nd Section, Bei Tou Road (49BWs/35BWs) |
8 | 0.16 | 1 | 0.02 | 0 | 0.00 | 0 | 0.00 | 9 | 0.18 | 1 | 0.03 | 5 | 0.14 | 1 | 0.03 | 0 | 0.00 | 7 | 0.02 | |
| 18. Dong Yang Street and Ming De Road intersection (38Ws/46Ws) |
4 | 0.11 | 3 | 0.08 | 1 | 0.03 | 0 | 0.00 | 8 | 0.21 | 1 | 0.02 | 2 | 0.04 | 2 | 0.04 | 0 | 0.00 | 5 | 0.11 | |
| Control group | |||||||||||||||||||||
| 17. 54, 25 Lane, Qing Jiang Road (49BWs/35BWs) |
8 | 0.16 | 0 | 0.00 | 1 | 0.02 | 0 | 0.00 | 9 | 0.18 | 2 | 0.06 | 0 | 0.00 | 0 | 0.00 | 0 | 0.00 | 2 | 0.06 | |
| 18. Li Gong Street and Da Du Road intersection (38BWs/46BWs) |
1 | 0.03 | 1 | 0.03 | 0 | 0.00 | 0 | 0.00 | 2 | 0.06 | 1 | 0.02 | 0 | 0.00 | 0 | 0.00 | 0 | 0.00 | 1 | 0.02 | |
| Nei-Hu District | Experimental group | ||||||||||||||||||||
| 19. 184, 6th section, Min Quan E. Road. (41BWs/43BWs) |
5 | 0.12 | 3 | 0.07 | 1 | 0.02 | 0 | 0.00 | 9 | 0.22 | 2 | 0.05 | 5 | 0.12 | 0 | 0.00 | 0 | 0.00 | 7 | 0.16 | |
| 20. Gang Qi Road and Rui Guang Road intersection (129, Gang Qi Road) (38BWs/46BWs) |
9 | 0.24 | 4 | 0.11 | 2 | 0.05 | 0 | 0.00 | 15 | 0.39 | 8 | 0.17 | 3 | 0.07 | 0 | 0.00 | 0 | 0.00 | 11 | 0.24 | |
| Control group | |||||||||||||||||||||
| 19. 11, Ji Hu Road (41BWs/43BWs) |
1 | 0.02 | 0 | 0.00 | 1 | 0.02 | 0 | 0.00 | 2 | 0.04 | 0 | 0.00 | 1 | 0.02 | 0 | 0.00 | 0 | 0.00 | 1 | 0.02 | |
| 20. Lanes 158 and 160 intersection, Da Hu Street. (38BWs/46BWs) |
0 | 0.00 | 0 | 0.00 | 2 | 0.05 | 0 | 0.00 | 2 | 0.05 | 0 | 0.00 | 0 | 0.00 | 3 | 0.07 | 0 | 0.00 | 3 | 0.07 | |
Note. CCTV = closed-circuit television.
The numbers in parentheses represent the bi-weeks of observation period before and after CCTV installation in each observation. For example (37BWs/47BWs) refers to that while the 1st observation spot has been observed 37 bi-weeks before CCTV installation, it also has been observed 47 bi-weeks after the cameras have been installed. The total observation period of this study is 108 bi-weeks, which means 216 weeks or 54 months.
Acknowledgements
The authors acknowledge with gratitude the assistance provided by TCPD’s Crime Prevention Division and Municipal Criminal Investigation Branch. The opinions expressed do not represent the official position of the Taipei City Police Department or other governmental agencies. Sincere thanks is also extended to Dr. Nicholas P. Lovrich and Yichun Yu for their generous assistance and comments offered during our initial versions. Without their great efforts, this research article would not have been possible.
Declaration of Conflicting Interests
The author(s) declared no potential conflicts of interest with respect to the research, authorship, and/or publication of this article.
Funding
The author(s) disclosed receipt of the following financial support for the research, authorship, and/or publication of this article: This research was funded by the National Science Council in Taiwan (NSC 101-2410-H-305-042).