
Abstract
This study computes the Discomfort Index, also known as the Misery Index, for 276 European Union NUTS2 regions to determine how “suffering” a region is or not before and after the global crisis. The geographical distribution of European Union regions according to their discomfort has deeply changed in the post-financial crisis years.
Since the 2008 economic and financial crisis, the need for a handy indicator to determine how a local economy is doing has rapidly emerged. To this aim, we construct a Regional Discomfort Index (DI), an economic indicator originally introduced by Arthur Okun in the 1970s, and then updated by Barro (1999), and, finally, by Hanke (2011). The latest available version is the algebraic sum of the interest rate, inflation, and unemployment rates, minus the year-over-year percent change in per-capita gross domestic product (GDP) growth. Despite its rather simple calculation, 1 the DI is considered a proxy for determining living conditions of average citizen in a given country, since persistently high inflation, interest, and unemployment rates are more likely to damage the economy and to have deep social consequences, but higher GDP per capita growth might mitigate these negative factors.
At the best of our knowledge, the DI has been used to test some empirical relation with social variables (e.g. Dadgar and Nazari, 2018; Lean and Tang, 2009; Saboor et al., 2017) and to construct the World Table of Misery Index Scores for 2013 (Hanke, 2011). There is no evidence of a DI at a lower territorial unit, namely at the regional level. We tackle this issue using the framework of Hanke (2011), which allows us to include variables at different scale, namely regional and national:
The European Union (EU) Regional DI is computed for the pre-crisis and post-crisis benchmark periods, 2 namely as the average over the periods 2005–2006 and for 2014–2015, respectively. 3 The scores allow us to examine how the geographical pattern of the Regional DI is evolving as a consequence of the crisis. Figures 1 and 2 show the distribution of the EU Regional DI in the years 2005–2006 and 2014–2015, respectively, where the smaller values (lighter) represent the regions with lower discomfort and greater values (darker) regions with higher discomfort. We combine standard visualization mapping and cartogram to identify areas in proportion to population.
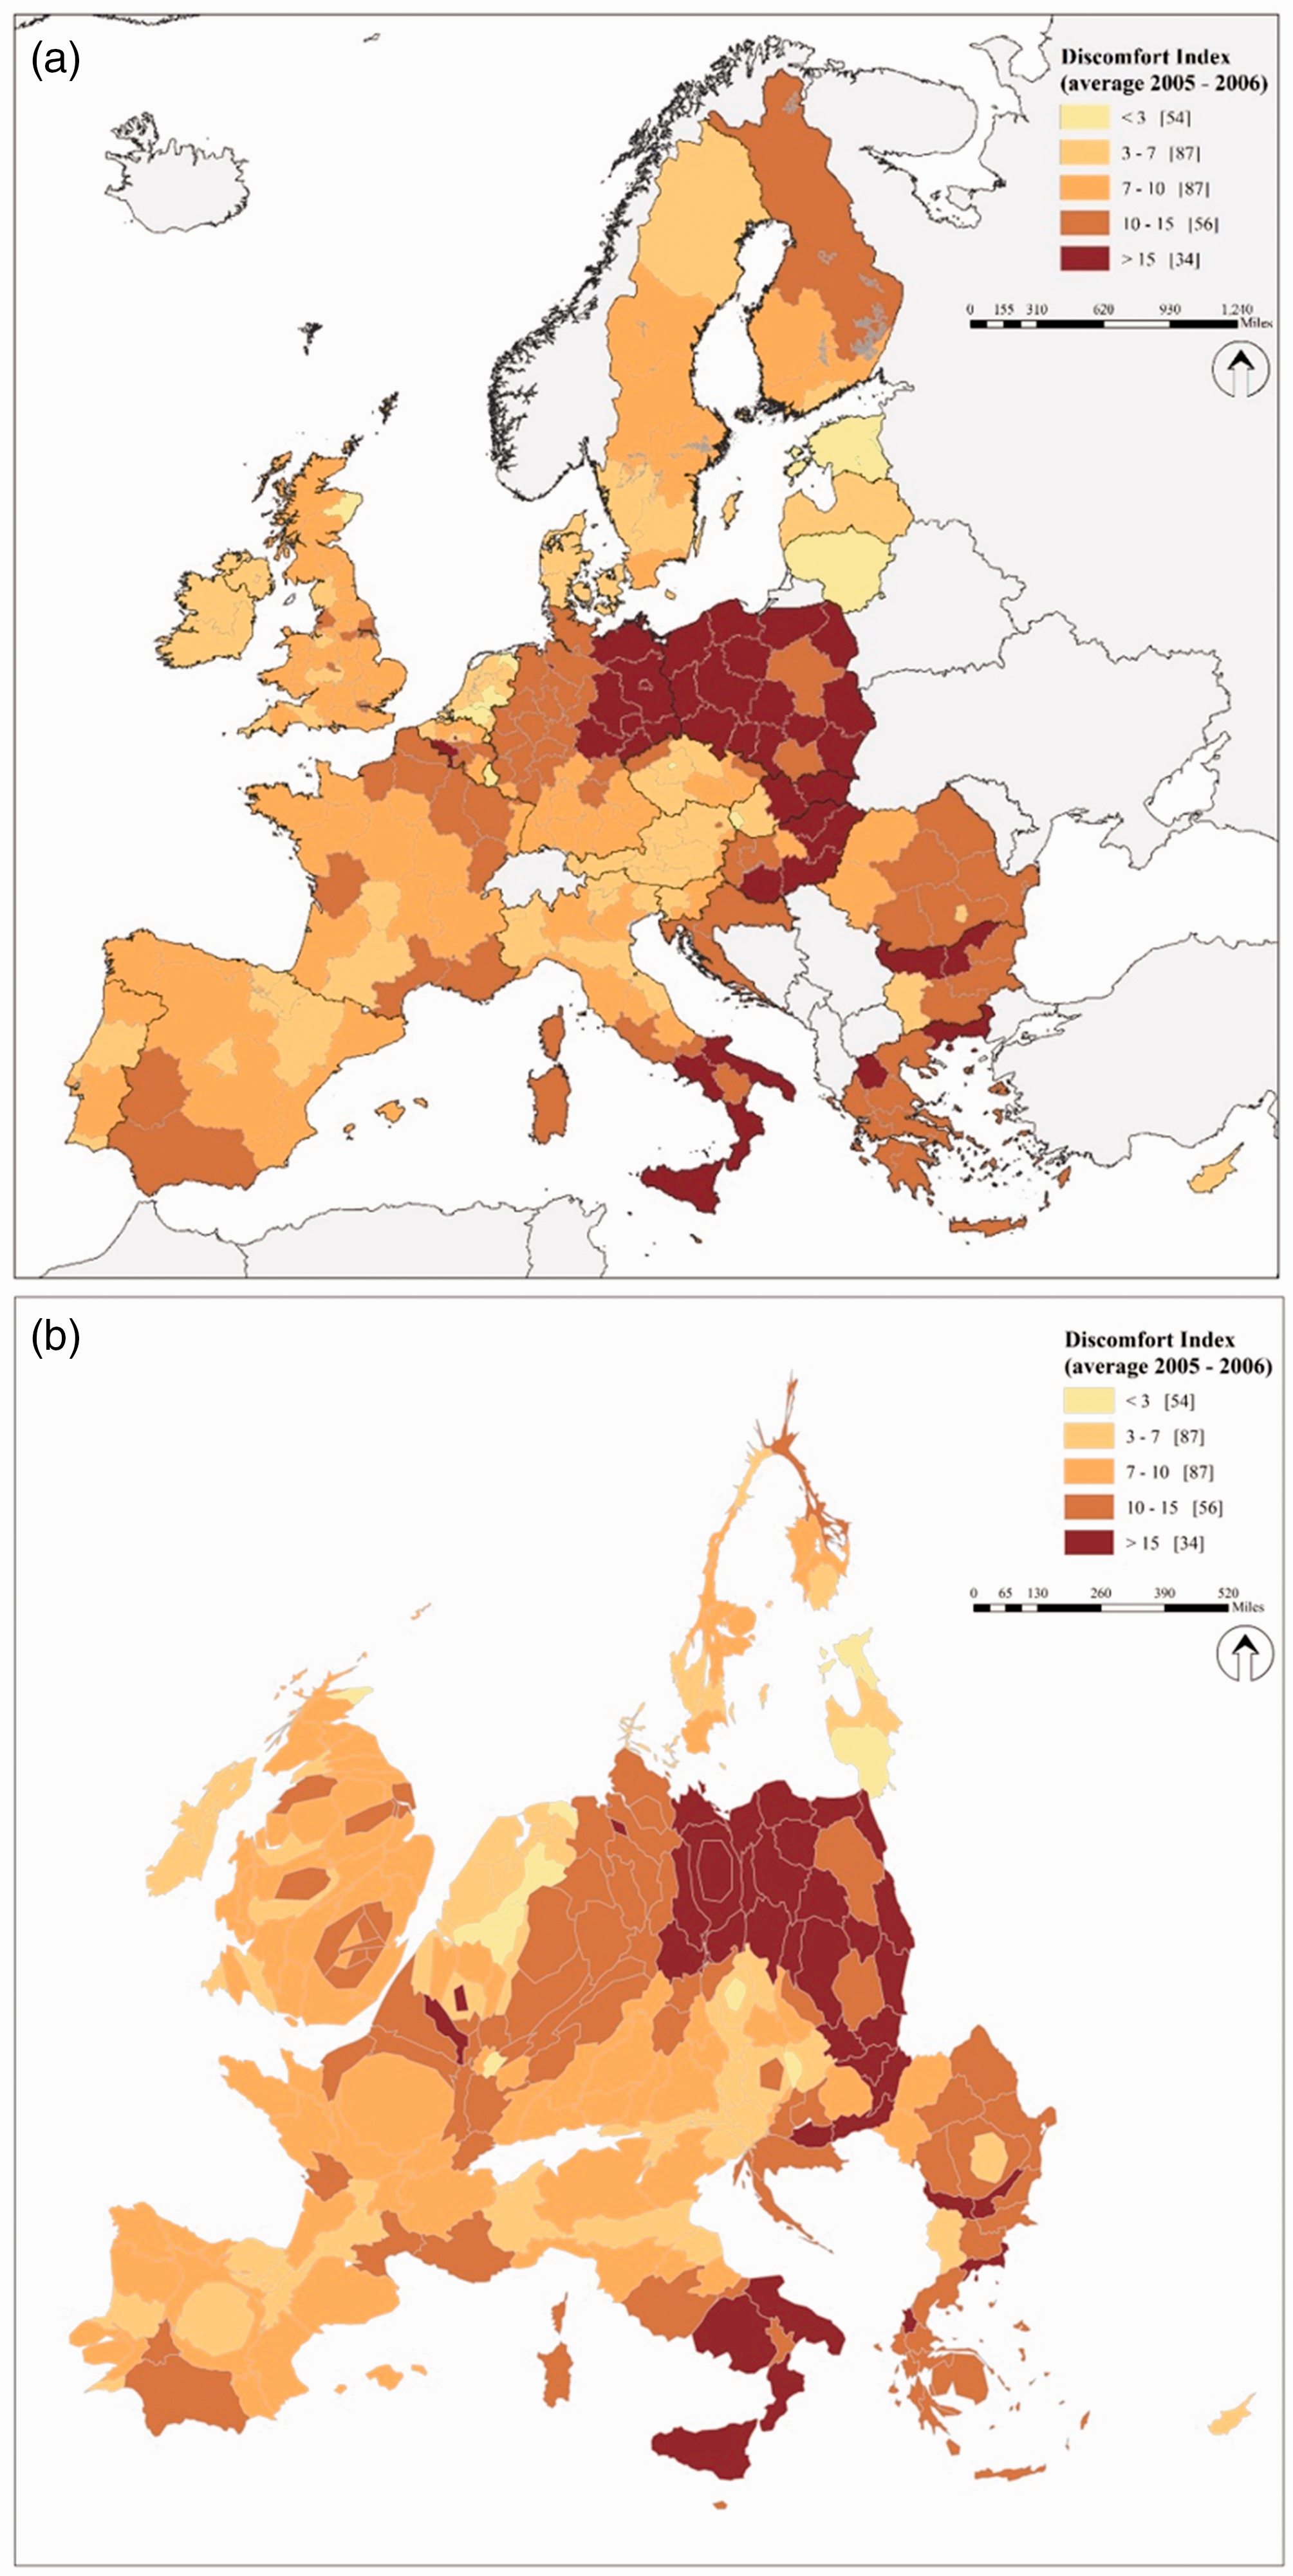
The EU Regional Discomfort Index over the pre-crisis period (2005–2006), by NUTS2 (a). The cartogram of EU Regional Discomfort Index. It notes that areas are shaped by their size on the cartogram (b).
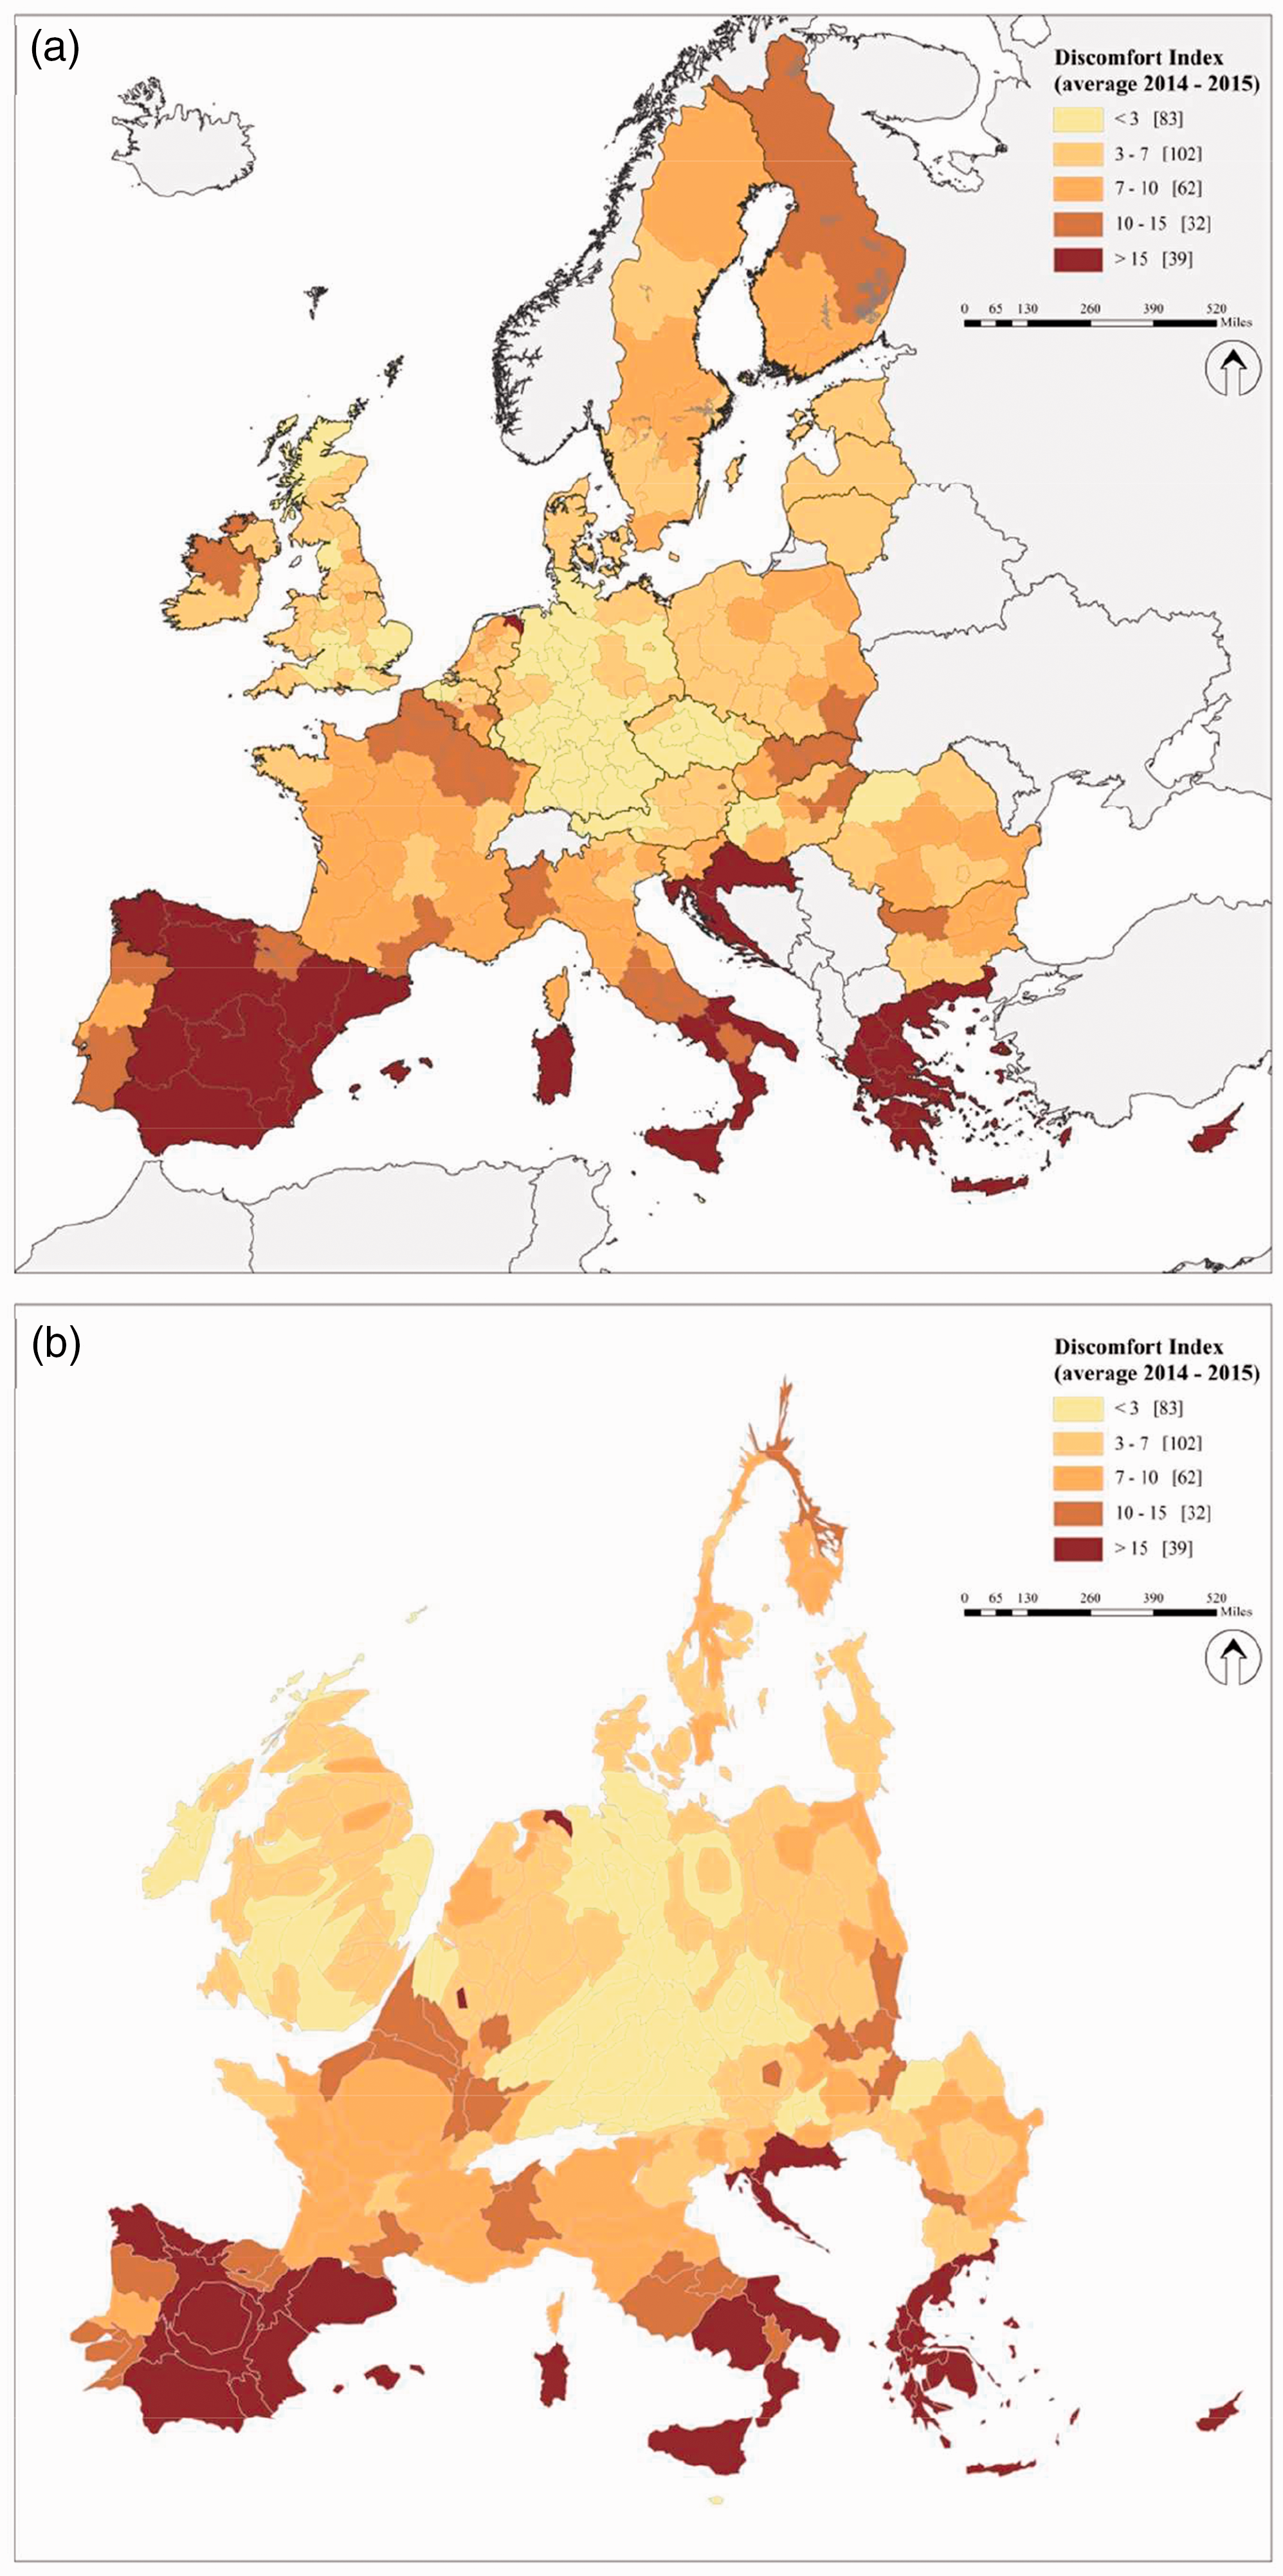
The EU Regional Discomfort Index over the pre-crisis period (2014–2015), by NUTS2 (a). The cartogram of EU Regional Discomfort Index. It notes that areas are shaped by their size on the cartogram (b).
We borrow from Dadgar and Rahmani (2011) the thresholds to determine optimum values for DI. In standard economic circumstances, DI would be less than 7%, values up to 10% would be tolerable, and scores above 10% are usually associated with greater economic shortfall probability. 4
In the period examined, the major discomfort contributing factors have a regional scale and are unemployment rates and per capita GDP annual growth, acting in opposite directions. As an example, in 2005–2006, the 10.2 value of DI in the Greek region Attica (EL30) and in UK region Lancashire (UKD4) is driven by different components. Being inflation and interest rate quite similar in the two countries, the higher GDP per capita growth mitigates unemployment in EL30 and the contrary happens in UKD4. 5
Not surprisingly, the spatial pattern of the Regional DI changed as consequences of the crisis:
The number regions with values of DI below 7% increased by over 30% in the post-crisis period (from 141 to 185). Regions in this group prior to the crisis belonged mainly to Western Europe (North of Italy, Spain and Portugal, South-west of France, Ireland, Benelux, Denmark, Sweden and Austria). In the eastern EU, only regions of Czech Republic, Hungary, Slovenia and the Baltics were part of this class. In the post-crisis period, the regions with the lowest discomfort located in eastern EU are across Germany, Austria, Great Britain, Benelux, and Denmark. Across eastern countries, we have the Baltic Republics, Poland, Czech Republic, and Hungary. The number of regions with DI scores in the tolerable range 7–10% decreased by 29% as a consequence of the crisis (from 87 to 62). Regions across Austria, France, Bulgaria, Sweden, Finland, northern Italy have tolerable values of DI in both periods. Spain and Portugal worsened their condition shifting to the class of regions with more discomfort, while Great Britain improved. Regions with values of DI above 10% decreased by 22% in the post-crisis (from 90 to 71). Regions across South of Spain and Italy, north and eastern Germany, Finland, Croatia, Poland, Bulgaria, and Greece belonged to this class prior to the outbreak of the crisis. Among these, in the post-crisis period, Croatian, Greek, and southern Italian regions continued to belong to this class, while whole Spain and Portugal fall in this class.
In the period before the beginning of the global economic crisis and after the end of the euro area-specific sovereign debt crisis, the spatio-temporal distribution of the Regional DI in EU has deeply changed.
Summing-up the results, we can identify two main trends in the spatio-temporal distribution of the Regional DI in EU referred to the pre- and post-crisis periods.
The first refers to the decreasing number of regions suffering a high level of discomfort and the diminishing level of average Regional DI. 6 The second is the location of the regions bearing the highest discomfort that shifted from Eastern Europe to the South of Europe.
The spatial pattern of Regional DI is not homogeneous among regions with diversified population density. In some countries like Austria, UK, or Bulgaria, there are not negligible differences between capital cities and sparsely rural areas. Furthermore, before the crisis, highly densely populated regions were generally more affected by discomfort than after the crisis.
Least discomfort regions, benefiting from favorable and more stable economic circumstances, are located in Germany, Great Britain, and the Baltics. A combination of political stability, competitive economic activity, and favorable labor market has been key in recovering from the crisis, influencing the discomfort across EU regions. It is worth mentioning that the DI, despite its simplicity, has been empirically applied in social sciences to explore the dynamics and development of new types of socially dangerous behavior. 7 The EU Regional DI can be used as a basis to explore the impact of existing policies and further inform future policies for the prevention of disorders or crimes and for the protection of public safety and territorial equality. A deep knowledge of the Regional DI dynamics could potentially even allow to prioritize territorial oriented strategy.
Footnotes
Authors’ note
Declaration of conflicting interests
The author(s) declared the following potential conflicts of interest with respect to the research, authorship, and/or publication of this article: The authors are solely responsible for the content of the paper. The views expressed are purely those of the authors and may not in any circumstances be regarded as stating an official position of the European Commission.
Funding
The author(s) received no financial support for the research, authorship, and/or publication of this article.