



Abstract
Shrinking cities have spread across the globe in recent decades, characterizing significant population loss, economic decline, and decay in spatial quality. To maintain global economic prosperity in the context of urban shrinkage and support decision making in the direction, it is necessary to accurately identify shrinking cities on a global scale. We utilize redefined natural city boundaries and the LandScan dataset to identify and map shrinking cities experiencing population loss on the globe. As a result, we have identified 5004 shrinking cities worldwide, with a total area of 126,930 km2 during 2000–2019. The ratio of which in number and in area is 27% and 22%, respectively. The shrinking cities are clustered and mainly located in Europe, Eastern Asia, and northeastern United States. There are 41 countries with more than 20 shrinking cities on the globe. The number of shrinking cities in China reached 679, which is the most. Among the 41 countries, the median value of the natural cities’ shrinking ratios of Iraq, Iran, Austria, South Africa, Russia, Georgia, and Belarus is >50%, indicating that the urban population loss in these countries is relatively serious. Our findings can be used to inform decision makers and urban planners to adjust the “growth-oriented” planning paradigm and adopt precise strategies, to form a healthier urban development.
Affected by globalization, de-industrialization, suburbanization, and population aging (Martinez-Fernandez et al., 2012; Reckien and Martinez-Fernandez, 2011), shrinking cities (SCs) have spread across the globe in the recent decades, characterizing significant population loss, economic decline, and decay in spatial quality (Pallagst, 2009). To maintain global economic prosperity in the context of urban shrinkage and support decision making in the direction, it is necessary to accurately identify SCs on a global scale. The previous studies are mostly at the national or regional level, for instance, Long and Wu (2016) identified 180 SCs in China using the township-level population censuses in 2000–2010, Wiechmann and Wolff (2013) identified SCs in 37 countries in Europe during 1990–2010. From the global perspective, Oswalt and Rieniets (2006) utilized census data of administrative cities to identify SCs with >100,000 residents worldwide in 1950–2000 and formed the first spatial distribution map of the global SCs. However, (1) there has been no update for the global SC mapping since 2000 and (2) the use of statistic data to identify the shrinkage in the administrative city is confronted with the heterogeneity of city definitions and criteria, making it not easy to make the results comparable at the country level (Wiechmann and Wolff, 2013).
To fill both the existing research gaps, we aim to identify and map SCs on the globe after 2000 (2000–2019), thanks to the emerging open LandScan dataset which represents the population distribution at approximately a 1 km (30″ × 30″) spatial resolution. We utilize the LandScan dataset on the globe in 2000 and 2019 to identify SCs experiencing population loss.
First, we redefine the city system on the globe using the city delineation method of a natural city (NC) to make cities in various countries comparable (Jiang et al., 2020). An NC is defined based on the agglomerated area of construction land in our research and without incorporating any statistical information. This is a bottom-up approach to defining cities in a natural way (Long et al., 2018). They can better reflect the distribution of physical urban areas worldwide in comparison with the administrative cities. The minimum size of an NC is set as 5 km2 in this study. We refer to the high-resolution mapping of global urban land shared by Liu et al. (2018) and redefine NCs on the globe in 2000. Second, we calculate each NC's population in 2000 and 2019 using the LandScan dataset and regard an NC as SC if its population loss during 2000–2019 is >10% according to the criterion set by Oswalt and Rieniets (2006) and Pallagst et al. (2009). As a result, we have identified 5004 SCs (27% of all 18,360 NCs worldwide), with a total area of 126,930 km2. Considering the city boundary change during 2000–2019, we also replicate our experiment while redefining NCs in 2015 (Liu et al., 2018). The ratio of SCs in number and in area based on the 2015 NC worldwide is 26% and 21%, respectively, similar to the results with 2000 NCs. Both the scenarios using different NC boundaries indicate similar SC identification results. Therefore, we will focus on the result using the 2000 NCs in the following discussion.
In order to compare the shrinkage of cities between different countries, we statistically analyze the distribution of SCs worldwide at the country level. Figure 1 shows the spatial distribution of identified SCs and non-SCs in countries with no <10 NCs (NCs = SCs + non-SCs in the map) and 1 SC, respectively, from 2000 to 2019, which can represent the distribution of SCs globally to a large extent. We find that SCs have spread to most countries in the world, but are clustered and mainly located in Europe, Eastern Asia, and the Northeastern United States. At the country level, the proportion of SCs (the SC proportion at the country level = (number of SCs)/(number of NCs)) in 14 countries is >40%. These countries are mainly concentrated in Europe, such as Moldova, Lithuania, Serbia, Hungary, Ukraine, Romania, etc. In addition, there are 41 countries around the world with >20 SCs. They are China, the United States, Russia, Germany, Ukraine, France, Italy, India, Poland, Japan, etc. The number of SCs in China reached 679, which is the most on the globe. From the shrinking ratios of NCs in corresponding countries, we can see that the median value of Iraq, Iran, Austria, South Africa, Russia, Georgia, and Belarus is over 50%, which indicates that the degree of urban population loss in these countries is relatively serious.
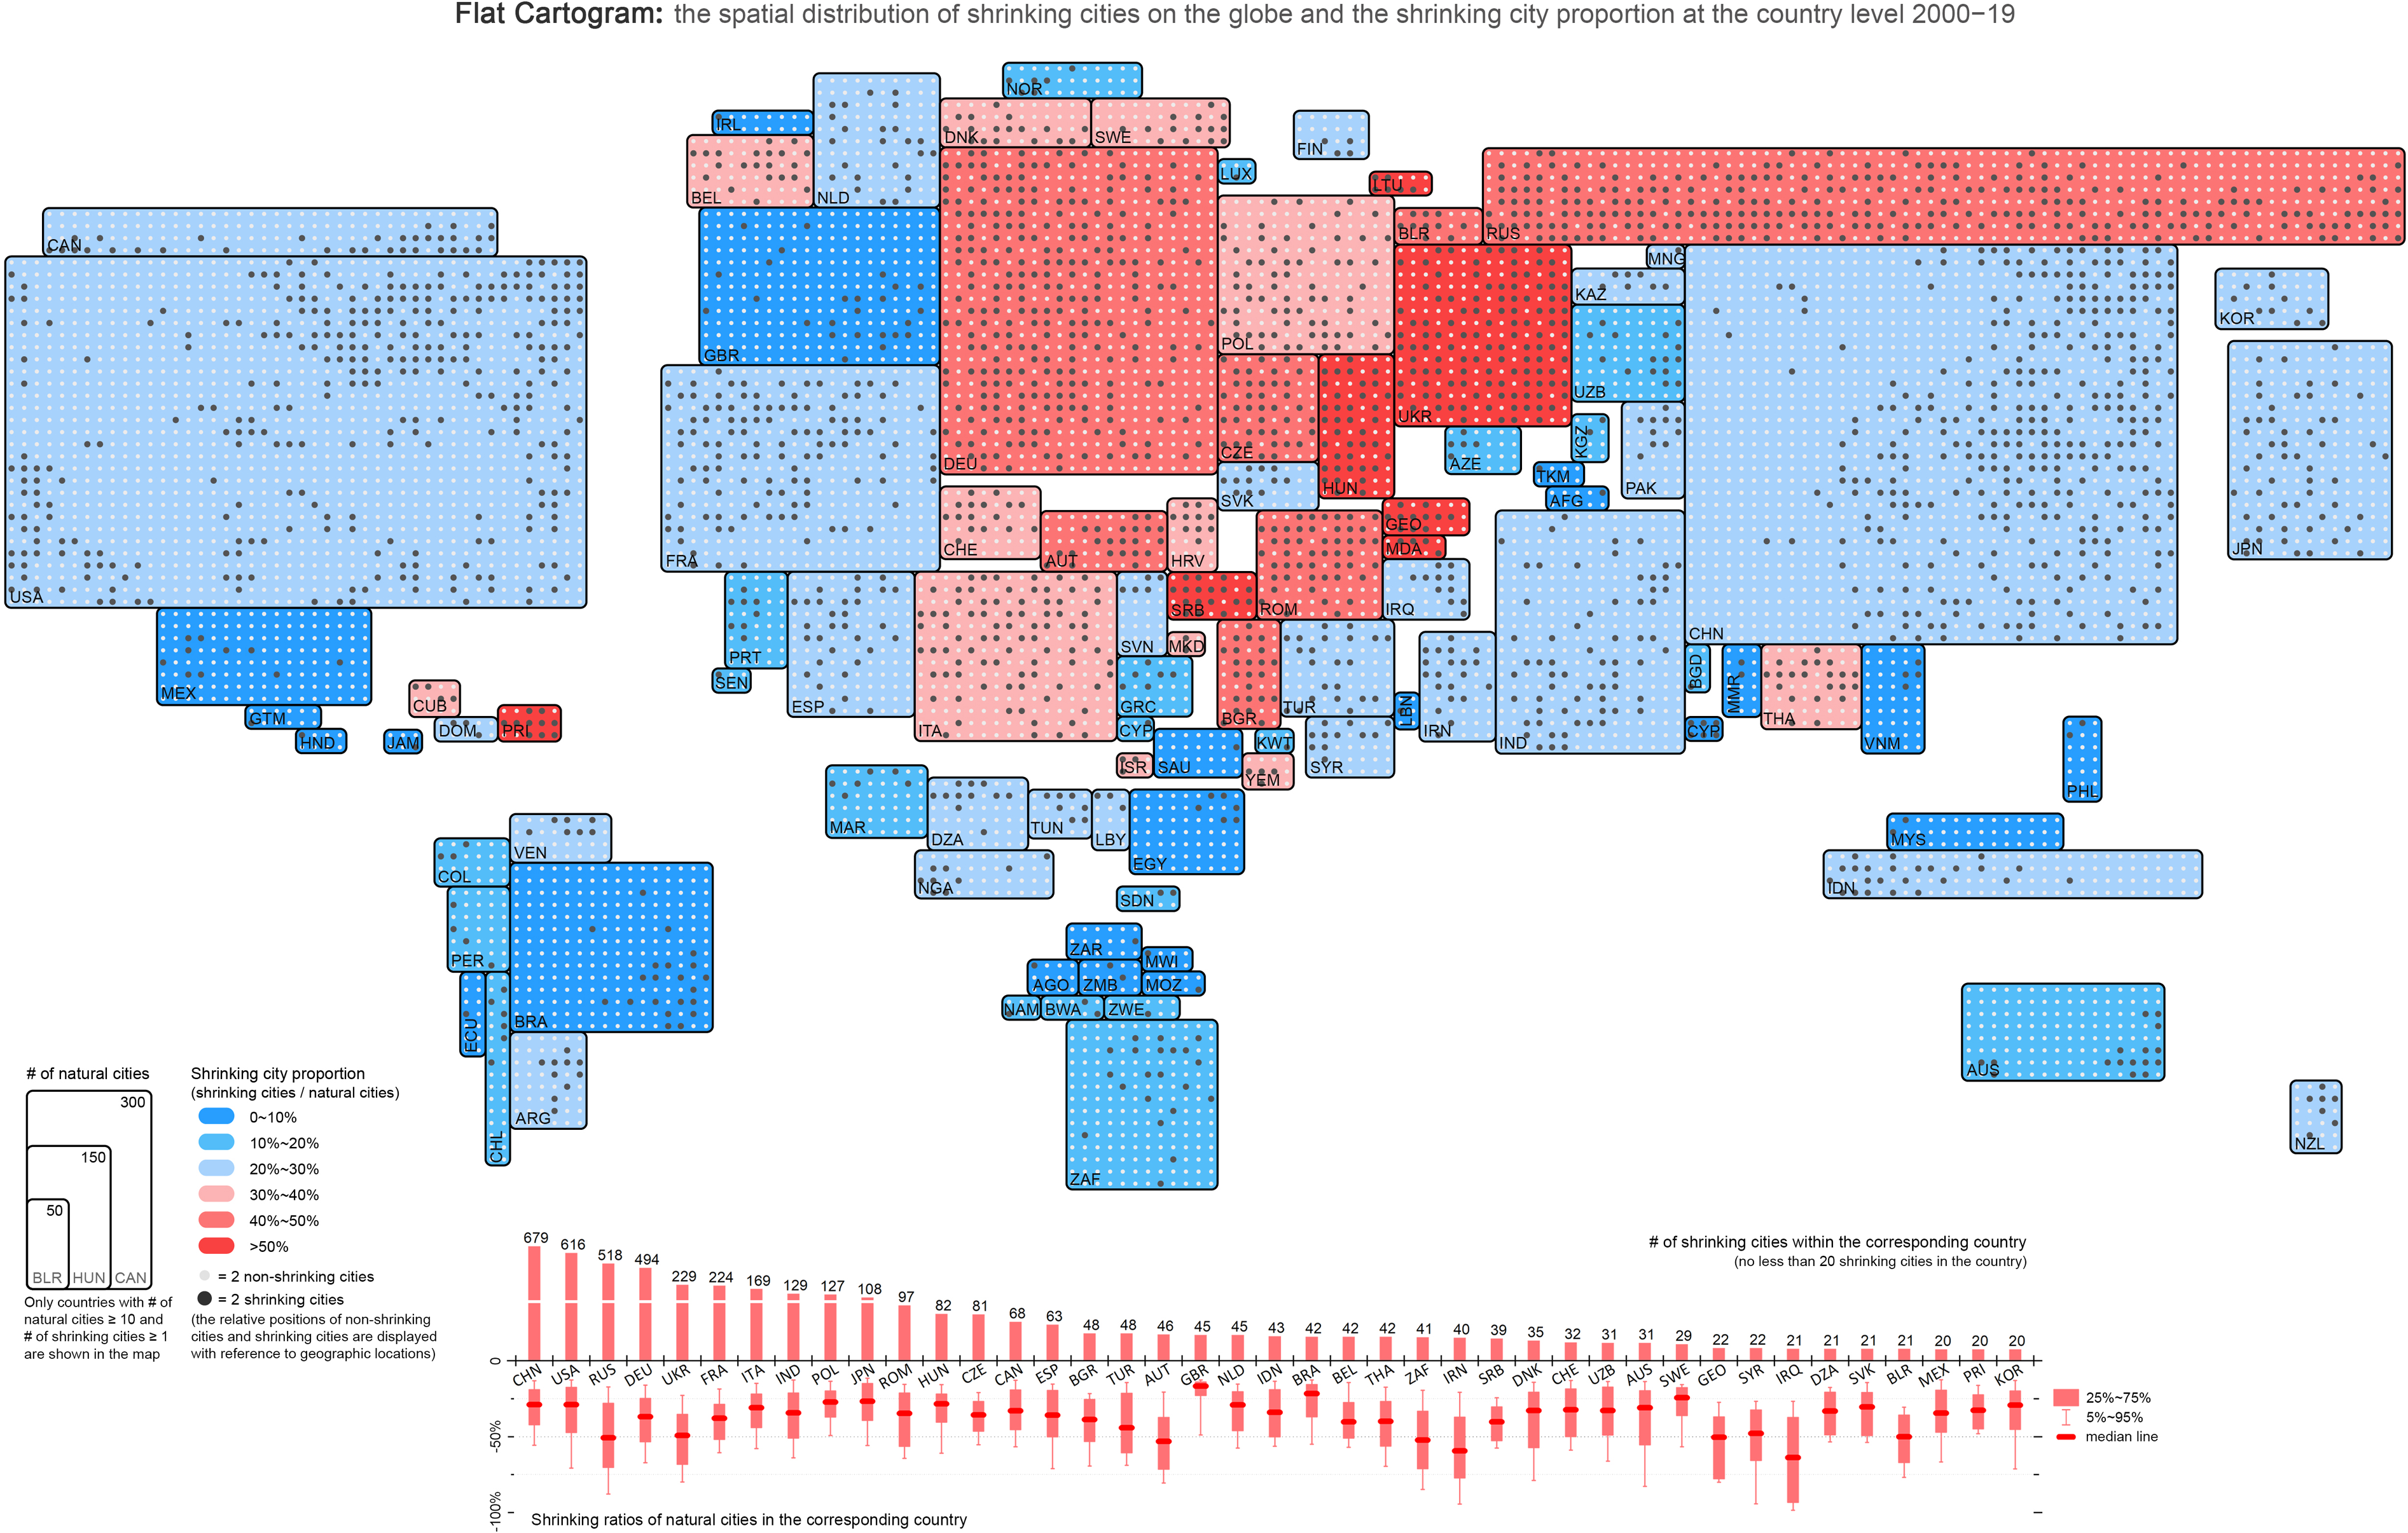
Flat cartogram of the spatial distribution of shrinking cities (SCs) on the globe and the SC proportion at the country level 2000–2019. Only countries (97) with a number of natural cities ≥10 and number of SCs ≥1 are shown on the map. The relative positions of non-SCs and SCs are displayed with reference to geographic locations. The bottom bar graphs and box plots, respectively, show the countries (41) with >20 SCs and the corresponding median shrinking ratios (changes in population at the city level between 2000 and 2019).
This research utilizes NC boundaries and emerging open LandScan dataset to identify and map the spatial distribution of SCs more accurately and comparably at the country level from a global perspective. The profile of SCs on the globe presented in the study clearly demonstrates that urban shrinkage is a universal and increasingly important fact as well as a major challenge for future urban policies such as planning and urban research on the planet (Wiechmann and Wolff, 2013). We believe that this study can remind decision makers and urban planners to adjust the “growth-oriented” planning paradigm and adopt precise strategies, to form a healthier urban development paradigm (Long and Wu, 2016).
Software
ArcGIS 10.6 is used to estimate the population loss of NCs in the world, and to statistically analyze the proportion of urban shrinkage at the national level. Referring to the obtained results, a flat cartogram was produced using Adobe Illustrator CS6.
Sources of data
LandScan dataset in 2000 and 2019 can be open access at https://landscan.ornl.gov/landscan-datasets. The 2000 and 2015 high-resolution mapping of global urban land can be found online at http://www.geosimulation.cn/GlobalUrbanLand.html.
Footnotes
Declaration of Conflicting Interests
The authors declared no potential conflicts of interest with respect to the research, authorship, and/or publication of this article.
Funding
The authors disclosed receipt of the following financial support for the research, authorship, and/or publication of this article: This work was supported by the National Natural Science Foundation of China (grant number 51778319).
