
Abstract
As the world's largest developing country, most Chinese cities are experiencing both population shrinkage and spatial expansion in the context of rapid urbanisation. To address the negative impacts of urban shrinkage in a targeted manner, it is necessary to accurately identify shrinking cities in China. In this study, we utilise the sixth and latest seventh population census data to identify and map shrinking cities in China that are experiencing population loss between 2010 and 2020. As a result, we identified 1507 shrinking districts and counties (52% of all 2896 districts and counties in China), with a total area of 4.4 million km2, covering almost 46% of China's territory. In addition, we further found that from 2010 to 2020, there are 266 shrinking cities in China, an increase of 86 (12%) compared with 2000–2010. This indicates that the situation of shrinking cities in China has become more critical. From the perspective of spatial distribution, Chinese shrinking cities are clustered, mainly in the northeast and central regions. We also plot the proportion of shrinkage in a deformed form to reveal which prefecture-level cities are losing population from 2010 to 2020. Our findings provide policymakers and urban planners with a reference and warning that measures should be taken to adjust the growth-oriented planning paradigm to reverse the negative impact of population loss on urban development.
Since the 1960s, the phenomenon of urban shrinkage, characterised by population loss, industrial decline, urban vacancy and underutilisation of existing urban infrastructure, has continued to spread and has evolved into a widespread phenomenon of urban development globally (Hu et al., 2021). As the world's largest developing country, the number of shrinking cities (SCs) in China continues to rise in the context of rapid urbanisation (Meng et al., 2021), with most cities experiencing both population shrinkage and spatial expansion, exacerbating the waste of land resources and pressure on local finances. To address the negative impacts of urban shrinkage in a targeted manner, it is necessary to accurately identify China's SCs.
Since the Chinese government conducts population censuses at 10 years interval, most existing studies use the fifth and sixth censuses data to identify SCs in China from 2000 to 2010 (Wu and Qi, 2021; Zhou, et al., 2017), for instance, Long and Wu (2016) identified 180 SCs in China using the censuses during 2000–2010. Due to the lack of long-term continuous permanent population data, researchers have utilised nightlight data to identify the SCs in China in recent years (Jiang et al., 2020). However, (1) nightlight data is one of the clearest views of human settlement patterns available, but it cannot precisely reflect the size of the permanent population; (2) using data from different sources to analyse the shrinkage of China's administrative cities leads to heterogeneity in results that make it difficult to support government decisions (Wiechmann and Wolff, 2013).
Now that the latest data from Seventh National Population Census, namely the permanent population data for 2020, have been released, we calculated the rate of population change for 2010–2020 for each district and county in Mainland China using the census data and considered a district or county that experienced population loss during 2010–2020 as shrinking according to the criterion set by Long and Wu (2016). (The shrinking counties, districts and cities in China for 2010–2020 identified in the study do not include the Xinjiang Uygur Autonomous Region (XUAR) because the seventh census data for the counties and districts in XUAR have not yet been released.) As a result, we identified 1507 shrinking districts and counties (52% of all 2896 districts and counties in China), with a total area of 4.4 million km2, covering almost 46% of China's territory (Figure 1). Meanwhile, we identified the districts and counties that experienced shrinkage from 2000 to 2010 based on data from the fifth and sixth censuses. Due to the adjustment of China's urban administrative divisions from 2000 to 2020, we used the latest administrative divisions to make the identification results for the two periods comparable. The results show that 1046 of China's 2896 districts and counties lost population, with a proportion of 36% and 31% in number and area, respectively.
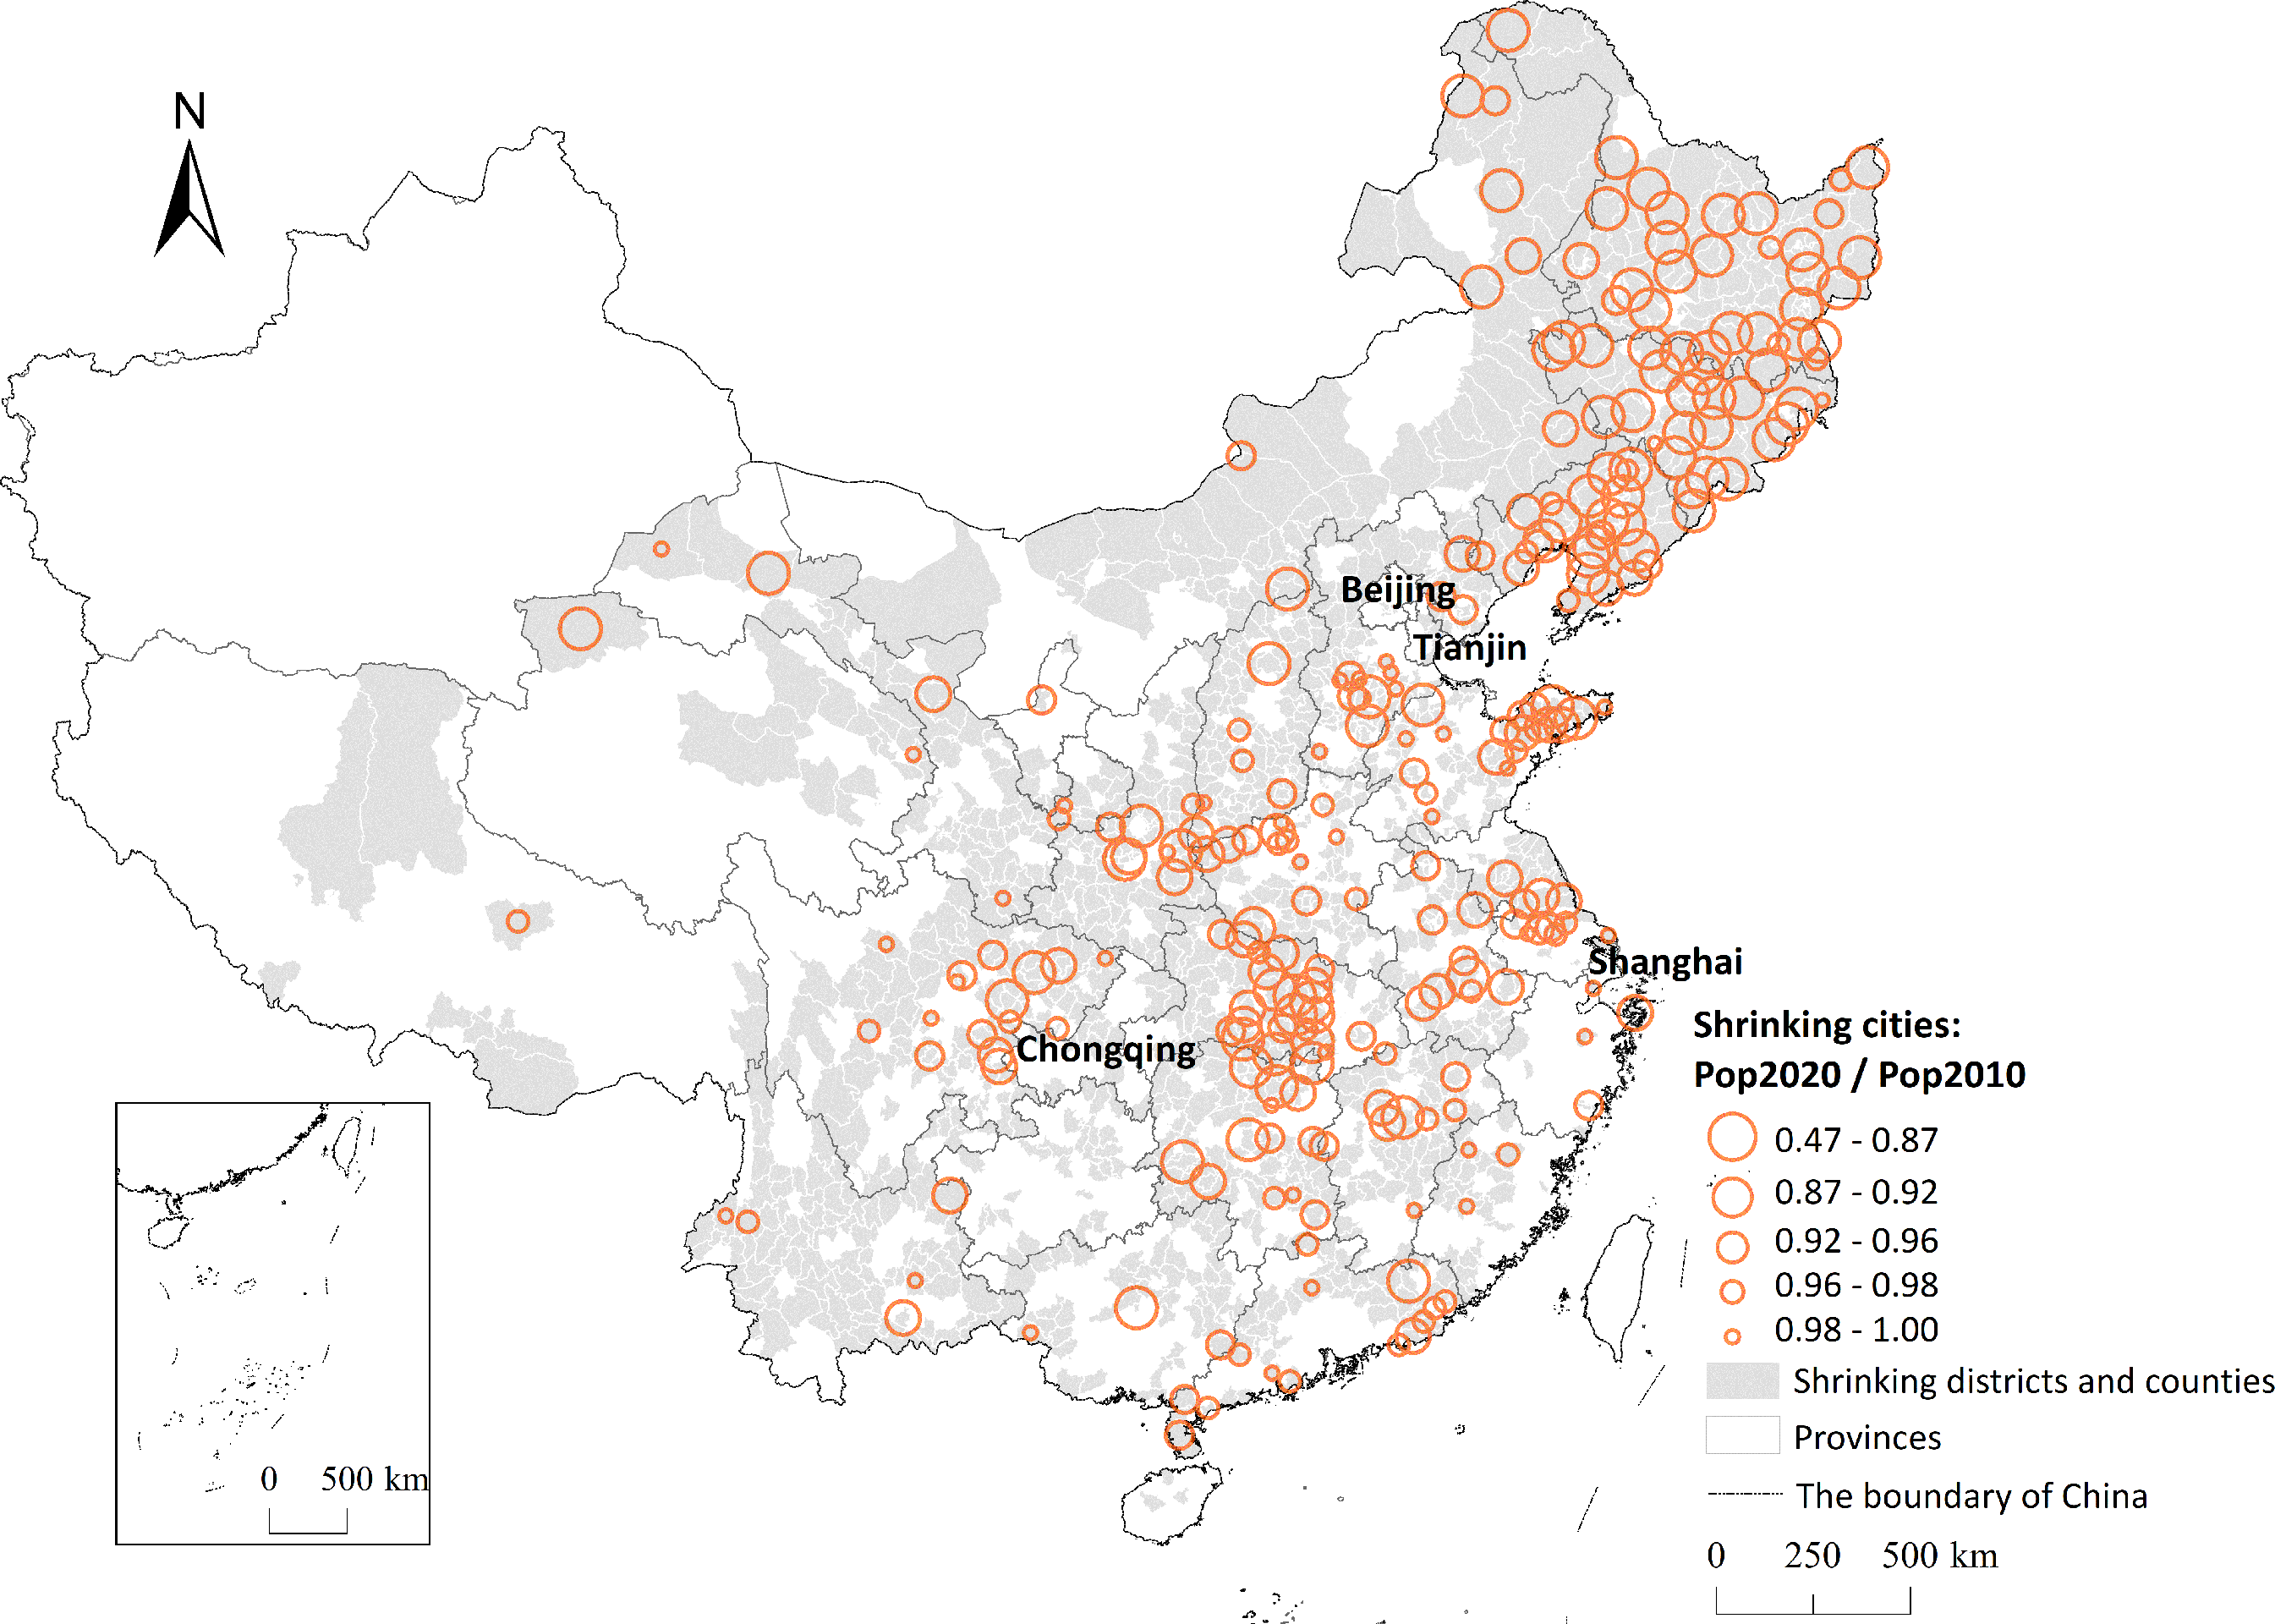
Shrinking territories at the county, district and city levels in China from 2010 to 2020.
In addition to districts and counties with population loss, we found 266 SCs from 2010 to 2020 (Figure 1), accounting for 39% of all 684 cities in China (684 cities proper is composed of 386 county-level cities, districts of 4 municipalities and 294 prefecture-level cities, excluding counties), an increase of 86 compared to the results identified by Long and Wu (2016) for the period of 2000–2010. The SCs were mainly located in the central region of China during 2000–2010 and further expanded and concentrated in the northeastern region of China during 2010–2020, which originated from a large number of old industrial and resource-based cities in the northeast. Considering the restructuring of the administrative divisions of some Chinese cities, we re-identified SCs from 2000 to 2010 using the latest urban administrative divisions combined with data from the fifth and sixth censuses. As a result, we identified 193 SCs, which is similar to the result identified by Long and Wu (2016). We also draw a featured graph of the population density in 2020 and revealed which prefecture-level cities are experiencing population decline from 2010 to 2020 (Figure 2).
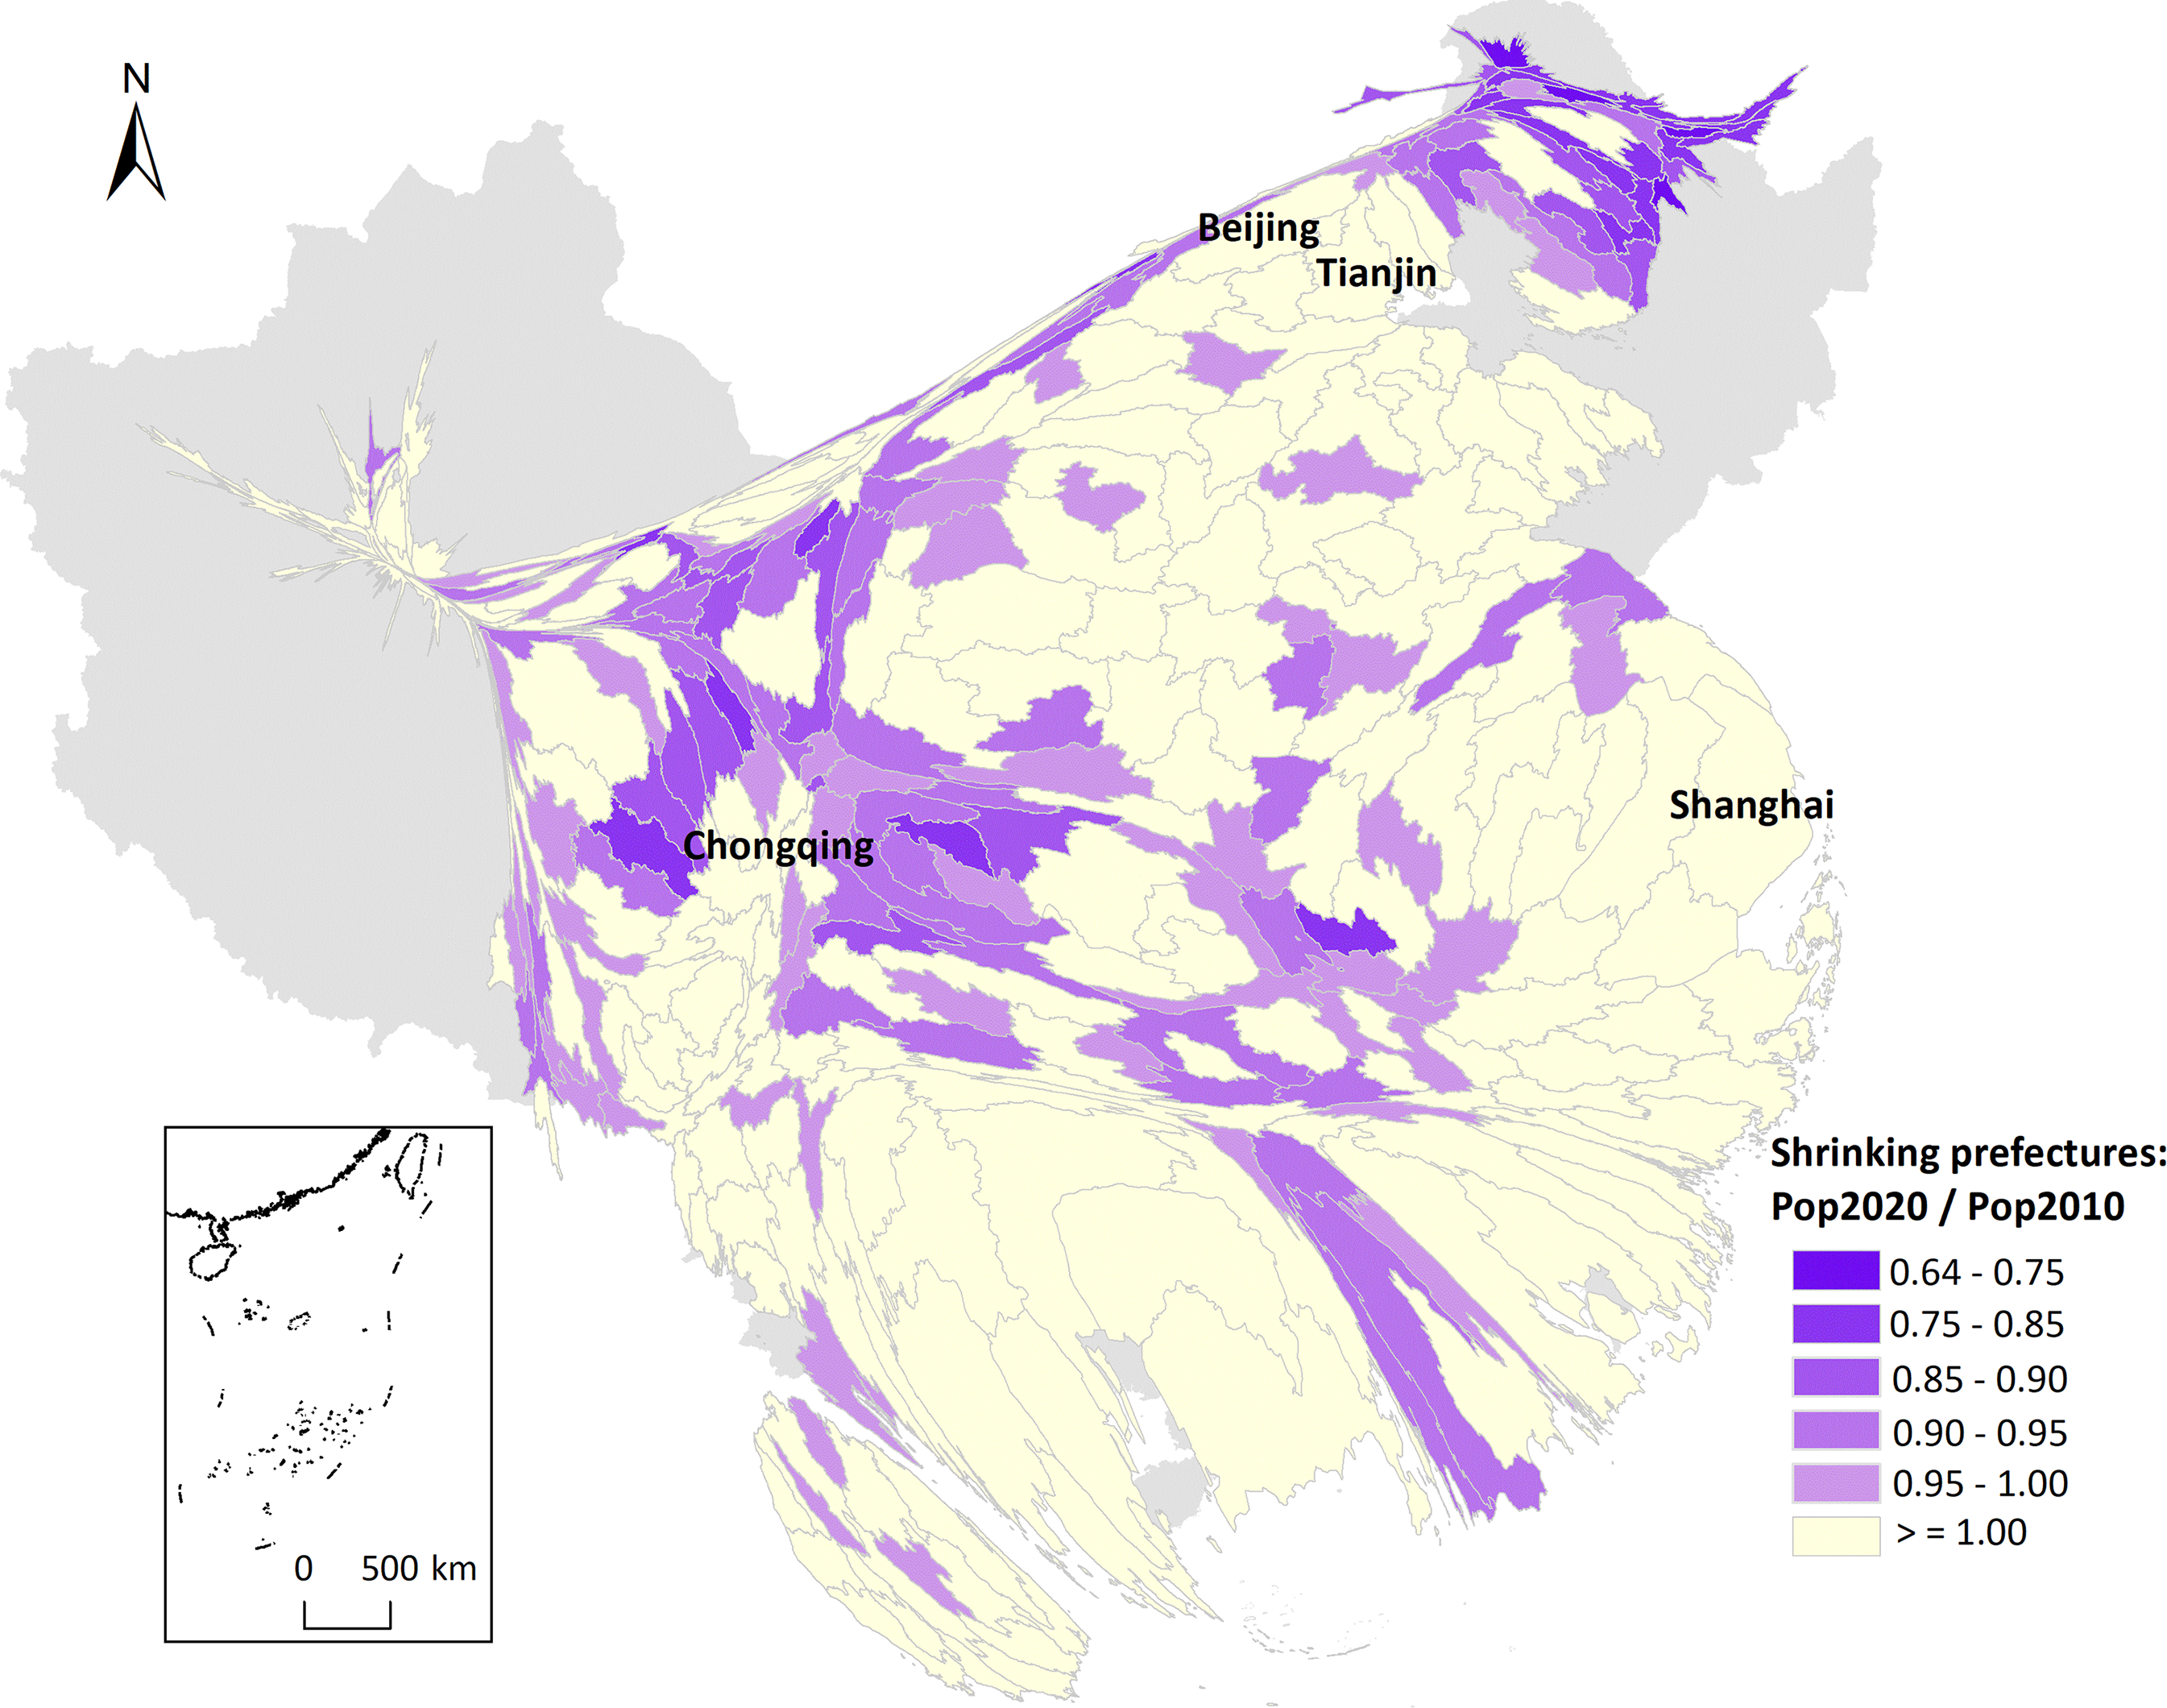
Population density of prefecture-level cities in 2020 and the spatial distribution of shrinking prefecture-level cities in China from 2010 to 2020.
The results show that China's SCs are expanding and spreading, which provides policymakers and urban planners with a reference and warning, which measures should be taken to adjust the growth-oriented planning paradigm to reverse the negative impact of population loss on urban development.
Software
Population loss in Chinese cities was estimated using ArcGIS 10.6 and featured charts were created with reference to the results obtained.
Data source
The census data for 2000–2010 are publicly available from the National Bureau of Statistics of China (http://www.stats.gov.cn/). The 2020 census needs to be obtained by consulting the Seventh Census Bulletins issued by local governments in China, which can be found online at: https://tjgb.hongheiku.com/%e4%b8%ad%e5%9b%bd.
Footnotes
Acknowledgements
Declaration of conflicting interests
The author(s) declared no potential conflicts of interest with respect to the research, authorship, and/or publication of this article.
Funding
The author(s) disclosed receipt of the following financial support for the research, authorship, and/or publication of this article: This work was supported by the National Natural Science Foundation of China (grant numbers 51778319, 52178044).