



Abstract
A complete tour of metro users consists of their journeys inside the carriage and various activities outside the carriage, in particular, those in or around metro station areas (MSAs). To fathom out the spatiality and magnitude of those activities, which involve substantial interactions among people or with urban spaces, we assume that (a) metro users who spent 30 min or more together in or around the same MSA would physically interact with at least another person there; (b) the more an MSA sees metro riders co-presenting there the higher social interaction potential (SIP) there is; (c) SIP of an MSA is positively correlated with the number of distinct riders co-presenting in that MSA. By exploiting two-day metro smartcard data of Wuhan, China, we use the number of distinct riders co-presenting in that MSA to measure and visualize the MSA-level SIP in that city. Our visuals show the SIP varies across MSA and time of the day. Some MSAs have higher SIP in the daytime whereas other MSAs have higher SIP at the nighttime. Few MSAs continuously have high SIP. These results inform us where and when SIP would be the highest and the lowest across MSAs, which can facilitate metro operators’ monitoring and management of MSAs on the one hand and help businessmen and officials decide where and when to provide services and/or sell products across MSAs.
Trip distribution of public transit is of great significance to reveal the cities’ spatial structure, people's collective movement, and urban vibrancy (Estupiñán and Rodríguez, 2008; Ingvardson and Nielsen, 2018; Xiao et al., 2020). Taking advantage of transit smartcard data, numerous studies have characterized various collective mobility patterns of public transit users (Ma et al., 2013; Nassir et al., 2015). However, most of the existing literature pays attention to the duration and frequency of public transit trips only. Little has been done on how passengers spend their time after reaching their destinations and how many passengers co-present and possibly interact in different destinations. For the majority of public transit users, their activity chains consist of several trips, and they are likely to interact with other people or patronize certain urban spaces in between two consecutive trips (Bouman et al., 2013).
The temporal length, spatial distribution, and frequency of stays between two consecutive trips of metro passengers provide an innovative lens to detect the possible activities taking place in metro station areas (MSAs), areas within a reasonable walking/travel time from a metro station. The more metro passengers staying in an MSA for a longer time, the more probably that MSA would generate more social interactions due to more co-presences of at least metro passengers (Bowlby, 2011).
To fathom out those co-presences and associated potential social interactions by MSAs, we assume that
metro users who spent 30 min or more in or around the same MSA would physically interact with at least another person there; the more an MSA sees metro riders co-presenting there the higher social interaction potential (SIP) that MSA has; SIP of an MSA is positively correlated with the number of distinct riders co-presenting in that MSA.
By exploiting two-day metro smartcard data of Wuhan, China, we use the number of distinct riders co-presenting in that MSA to measure and visualize the MSA-level SIP in a city. The data is for March 13 and 14, 2017, a continuous 48 h to reveal the possible daytime and overnight social interactions. Passengers who alight at a station and later board the same station after a certain interval are singled out and are assumed to be engaged in social interactions with at least another person. The number of distinct riders co-presenting in an MSA therefore can be a proxy for SIP, and the higher the SIP, the more probable there are substantial social interactions.
Figure 1, a three-dimensional visual shows the top 20 MSAs with highest SIP value in Wuhan. Horizontally, the base of each column corresponds to the center of an MSA, i.e., the centroid of a metro station. Vertically, the height of each column represents the time segments of the two days in question. The column's color, which ranges from light pink to dark red, represents the relative value of SIP across different time segments.
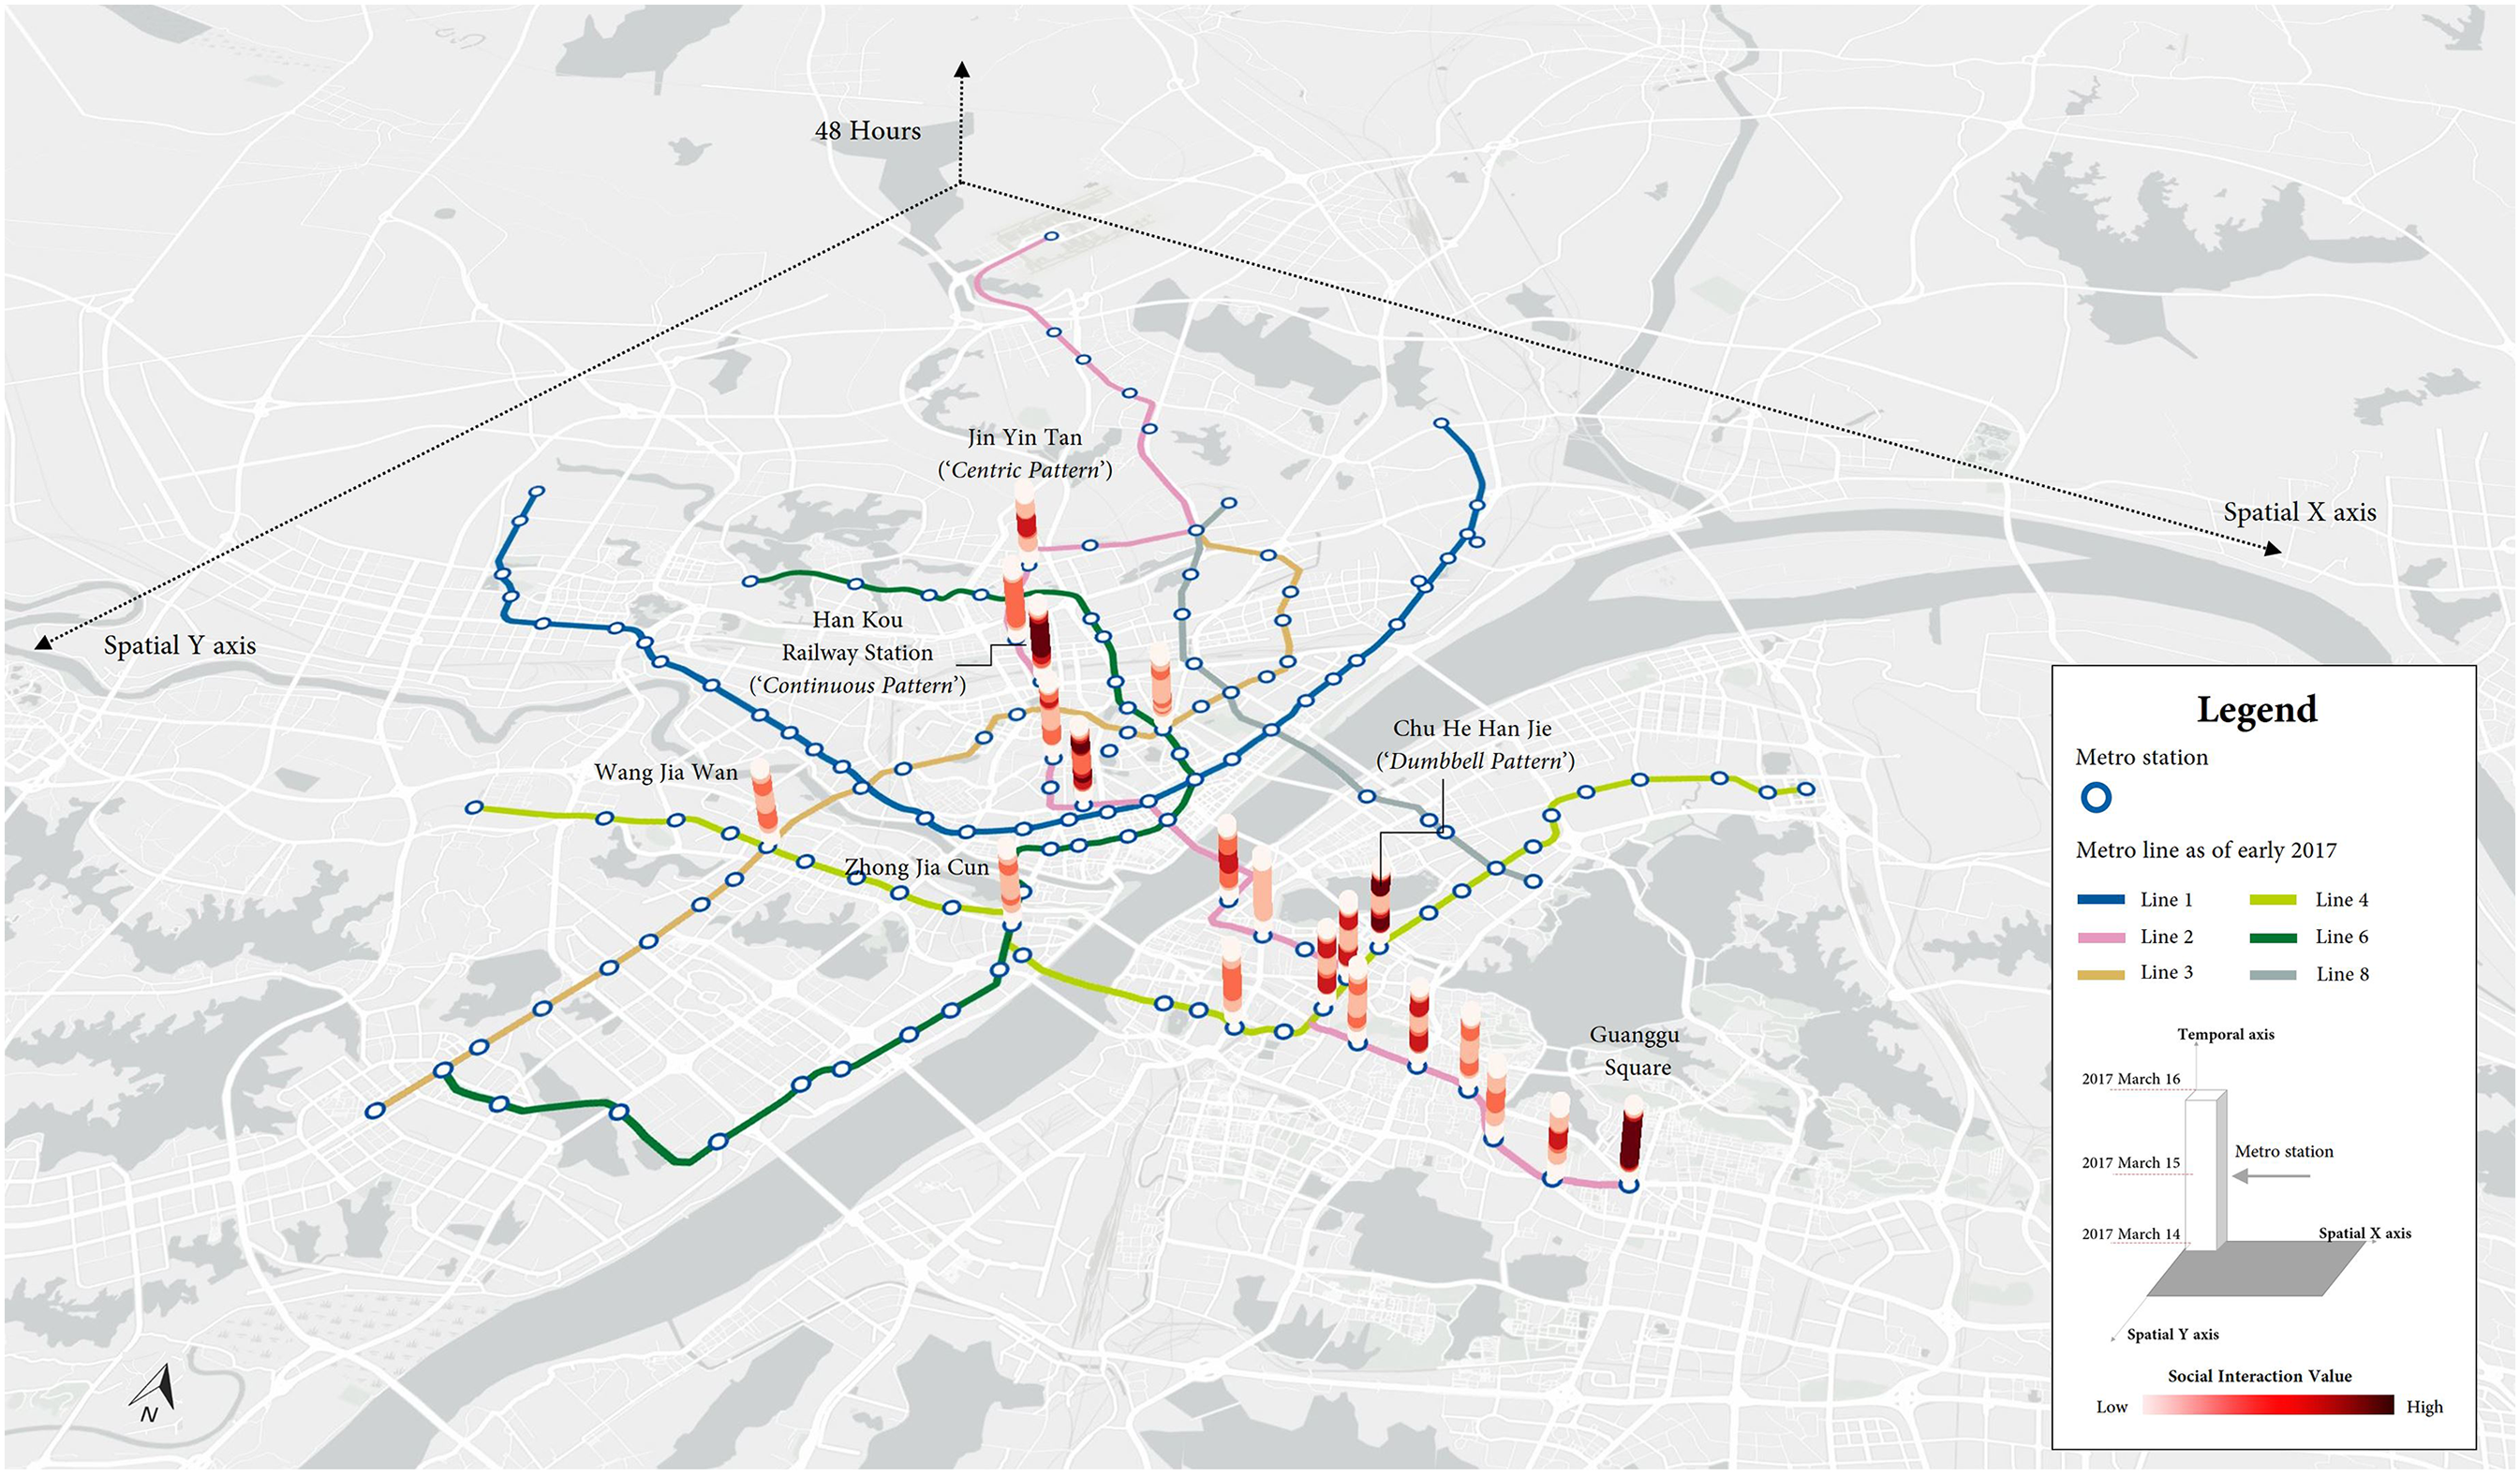
Top 20 metro stations with highest social interaction potential in Wuhan, China.
The visual allows us to detect the following SIP characteristics across MSAs and time segments. First, few MSAs continuously have high SIP and the SIP distribution of different MSAs across time segments vary notably from one another. Second, there are largely three types of the SIP distribution. One is “dumbbell pattern”, which means that these MSAs’ SIP is the highest during the daytime. Chu He Han Jie MSA is a case in point for this type of SIP distribution. There is a high concentration of service-based jobs in this MSA. Two is the “centric pattern”, which shows that there are a significant number of metro passengers co-present there at night. Jin Yin Tan station is an exemplar for this pattern. Three is the “continuous pattern”, which indicates that there are always many metro passengers co-present in the same MSA. Not surprisingly, Han Kou Railway Station is such MSA always with many metro riders concurrently staying there. Third, there is an uneven distribution of top 20 MSAs with the highest SIP across the space and different metro lines. Metro Line 2 boasts the most of such MSAs.
Despite the above findings, several caveats should be noted. MSAs attract not only metro riders but also other people. Thus, the co-presenting metro riders in an MSA only partially reflect the SIP of that MSA. Furthermore, a number of people simultaneously co-locate in the spot does not necessarily mean that those people would actually interact with one another. Even if they do interact, the format, quality, and impacts of their interactions cannot be unraveled using smartcard data alone. Nevertheless, SIP is an intriguing concept and has provided a new lens for us to revisit the value of different locales in our cities. This value is shaped by the co-presences of different people. However, different people may or may not have the homogeneous access to the most valuable locales. In addition, SIP can be used to facilitate metro operators’ monitoring and management of MSAs on the one hand and help businessmen and officials decide where and when to provide services and/or sell products across MSAs.
Tools: Space-time cube in ArcGIS Pro; Photoshop CS6
Footnotes
Declaration of conflicting interests
The authors declared no potential conflicts of interest with respect to the research, authorship, and/or publication of this article.
Funding
The authors disclosed receipt of the following financial support for the research, authorship, and/or publication of this article: This work was supported by Guangdong-Hong Kong-Macau Joint Laboratory Program [Project No.: 2020B1212030009].
