
Abstract
Vibrancy is one of the most desirable outcomes of transit-oriented development (TOD). The vibrancy of a metro station area (MSA) depends partially on the MSA’s built-environment features. Predicting an MSA’s vibrancy with its built-environment features is of great interest to decision makers as these features are often modifiable by public interventions. However, little has been done on MSAs’ vibrancy in existing studies. On the one hand, seldom has the vibrancy of MSAs been explicitly explored, and measuring the vibrancy is essential. On the other hand, because MSAs are interconnected, one MSA’s vibrancy depends on the MSA’s features and those of relevant MSAs. Hence, selecting a suitable metric that quantifies spatial relationships between MSAs can better predict MSAs’ vibrancy. In this study, we identify four single-dimensional vibrancy proxies and fuse them into an integrated index. Moreover, we design a two-layer graph convolutional neural network model that accounts for both the built-environment features of MSAs and spatial relationships between MSAs. We employ the model in an empirical study in Shenzhen, China, and illustrate (1) how different metrics of spatial relationships influence the prediction of MSAs’ vibrancy; (2) how the predictability varies across single-dimensional and integrated proxies of MSAs’ vibrancy; and (3) how the findings of this study can be used to enlighten decision makers. This study enriches our understandings of spatial relationships between MSAs. Moreover, it can help decision makers with targeted policies for developing MSAs towards TOD.
Keywords
Introduction
Transit-oriented development (TOD) is a land use–public transport integration approach aimed at mitigating a series of negative consequences triggered by the widespread private car dominance and urban sprawl. Metro station areas (MSAs), i.e. areas around metro stations where most people can comfortably walk or bike, are critical venues where TOD should be adopted and promoted. Out of various built-environment features of an MSA (e.g. density, diversity, and destination, namely 3Ds proposed by Cervero and Kockelman (1997)), which are costly to produce or cultivate, people often expect certain desirable outcomes/performances such as stable or even increased transit ridership and pedestrian activities (Loo and Du Verle, 2017; Loo et al., 2010; Nasri and Zhang, 2014; Noland and DiPetrillo, 2015; Sung and Oh, 2011; Zhou et al., 2018, 2019), accessibility to jobs and inhabitants (Lyu et al., 2019; Papa and Bertolini, 2015), improved air quality (Gu et al., 2019), and property price premium (Kay et al., 2014; Xu et al., 2016; Yang et al., 2020).
Urban vibrancy is an essential element for sustainable urban development (Hasan et al., 2013), which can enhance cities’ economic competitiveness (Brenner, 2014), facilitate human activities and social interactions (Jacobs, 1961), and maintain resilience (Dale et al., 2010). However, as a widely agreed-upon desirable characteristic concerning cities and their subareas, vibrancy has rarely been examined at the MSA level. Indeed, urban vibrancy is one of the most desirable TOD outcomes. A station area that has been developed according to TOD guidelines and principles, i.e. a TOD site, “creates more activity and vibrancy and community life in a center by having more people living closer together, who are walking, cycling, catching public transport and generally interacting with each other much more than if they lived further apart” (Curtis et al., 2009: 173). Therefore, accurately predicting MSAs’ vibrancy can produce beneficial guidelines for development towards TOD.
However, predicting MSA’s vibrancy is challenging owing to the following two facts. First, selecting appropriate proxies and developing comprehensive measures are critical. Urban vibrancy can only be measured indirectly through the reflection of its multifaceted attributes (Huang et al., 2019). Fortunately, in recent years, the availability of multi-source geo-referenced big and open data such as smartcard data and social media data has enabled us to observe various human activities and interactions, which can serve as good proxies for MSA’s vibrancy. Moreover, with techniques such as factor analysis, the underlying vibrancy beneath a variety of observable attributes can be revealed scientifically (Huang et al., 2019; Tu et al., 2020).
Second, more importantly, MSAs are not isolated. Various flows of people, goods, and information act as ties to connect individual MSAs into a dynamic and integrated system. Analyzing the spatial interaction relationships manifested by flows can help understand land-use characteristics of origins and destinations and their joint influence on urban vibrancy (Liu et al., 2015). Therefore, the prediction of one MSA’s vibrancy should incorporate spatial relationships between it and other MSAs. In other words, an MSA’s vibrancy depends on not only that MSA’s features but also those of relevant MSAs. Indeed, scholars have been aware of the importance of spatial relationships for a long time and have developed some specialized tools, including spatial regression methods. Due to the limitation of techniques and data sources, these tools and methods seldom consider spatial interaction based on real flows. Instead, they use alternative metrics such as contiguity and distance. For example, the two celebrated global spatial regression methods, namely spatial lag model and spatial error model, use exogenous spatial weight matrix while the local spatial regression method (i.e. geographically weighted regression) introduces kernel functions to measure spatial relationships based on either contiguity or distance (Anselin, 1988; Fotheringham et al., 2003). The rationale behind this is that metrics like contiguity and distance can partly reflect spatial interaction because of the distance decay effect on travel behavior. However, neither contiguity nor distance can fully capture the complexity of spatial relationships, especially in this very era when spatial interaction patterns have been transformed largely by advanced information and communication technologies and transportation technologies. Zhu et al. (2020), notably, compared the models equipped with adjacency (contiguity) metric and spatial interaction metric and found that the latter outperforms the former. However, seldom have the metrics, e.g. distance, network topology, and spatial interaction, been investigated and compared simultaneously in the same study. Comparative studies can produce valuable knowledge for the selection of appropriate metrics, which is vital for improving the prediction accuracy of models (cf. Zhu et al., 2020).
Recent advances in graph convolutional neural networks (GCNNs) have brought new opportunities to predict MSAs’ vibrancy more accurately than before. For one thing, GCNNs enable us to handle both linearity and nonlinearity issues, while traditional spatial regression methods can only deal with linear relationships (Zhu et al., 2020). For another, GCNNs can encode spatial relationships, which can be measured by various metrics through constructing graphs and learning deep representations of local graph structure and features of nodes. Through convolutional processes, each node can gain information from its neighbors (Kipf and Welling, 2017). This is especially suitable for us to account for spatial relationships between MSAs. Since GCNNs were proposed, they have shown great advantages in predicting passenger flows (Han et al., 2019), travel demands (Lin et al., 2018), functional characteristics of places (Zhu et al., 2020), etc.
Against the above background, this study introduces GCNNs to the study on MSAs. Taking spatial relationships into account, it attempts to quantify and predict MSAs’ vibrancy with MSAs’ built-environment features as input. MSAs in Shenzhen are chosen to operationalize the corresponding GCNN models. The aims of this study include: Examining the roles of different metrics of spatial relationships in predicting MSAs’ vibrancy. Exploring the predictability of single-dimensional and integrated proxies of MSAs’ vibrancy. Promoting the efficacy of built-environment features in generating vibrancy in MSAs based on spatial relationships.
The rest of this paper is organized as follows: Section “Methodology” explains the research methodology, including the identification of indicators, the construction of the MSA-based graph, and the implementation of GCNNs. Section “Study case and data” describes the study case and data preparation. Section “Results and discussions” elaborates on the findings and discusses them from the viewpoint of urban planning and design practices. Section “Conclusions” concludes the paper.
Methodology
MSAs’ vibrancy proxies
Urban vibrancy was described or conceptualized as the presence of lively street life (Jacobs, 1961), the perception of social life in public spaces (Gehl, 1971), and the pulse or rhythm of places that attract a wide variety of activities (Montgomery, 1998). Given that vibrancy always comes with an increase in human activities and interactions, three observable indices including social activity intensity (Chen et al., 2019; Wu et al., 2018a), economic activity intensity (Long and Huang, 2017; Ye et al., 2018), and pedestrian flow/density (De Nadai et al., 2016; Delclòs-Alió et al., 2019) were frequently used as proxies for urban vibrancy (Huang et al., 2019). Moreover, for MSAs, travel-related indices, e.g. ridership and pedestrian flow/density, can well reflect the performance. One of the most desirable outcomes of TOD is to encourage transit usage and walking and discourage car driving, particularly solo driving (Loo and Du Verle, 2017; Loo et al., 2010; Nasri and Zhang, 2014; Noland and DiPetrillo, 2015; Sung and Oh, 2011; Zhou et al., 2018, 2019). These can potentially promote social interactions and economic activities. To reflect as many dimensions of MSAs’ vibrancy as possible, in this study, four observable indices, including ridership, pedestrian density, social activity intensity, and economic activity intensity, were selected as proxies.
Recently, a number of novel studies have considered the multifaceted nature of urban vibrancy and integrated big and multi-source data with factoring or weighting methods (Jin et al., 2017; Huang et al., 2019; Tu et al., 2020). Following their works, this study uses the factor analysis method to construct a comprehensive proxy for MSAs’ vibrancy that combines various facets of vibrancy. The factor analysis method can capture joint variations among observed proxies closely correlated with each other and accordingly find unobserved latent common factors (Child, 1990). The extracted factor, which conveys the common information about the vibrancy proxies, was derived as an integrated vibrancy index in this study.
Associated built-environmental features
Good urban form/landscape/built environmental features are conducive to the development of vibrant streets, neighborhoods, and of course, MSAs (De Nadai et al., 2016; Huang et al., 2019; Long and Huang, 2017; Lynch, 1964; Mehta, 2007; Meng and Xing, 2019; Sung et al., 2013, 2015; Tu et al., 2020; Wu et al., 2018b; Ye et al., 2018; Yue et al., 2017; Zhang et al., 2020). The node-place model and its variants provide useful perspectives to understand how built-environment features function to sustain sufficient and continuous vibrancy in MSAs (Bertolini, 1999; Lyu et al., 2016; Vale, 2015). In these models, an MSA is decomposed into three correlated components: a node of the metro network (Node), a place where various socio-economic activities occur (Place), and a tie to facilitate the feedback cycle between the former two components (Tie). Intensification and diversification of land use in MSAs generate more activities, interactions, and travel demands, triggering higher transport provision, which then stimulates greater land development and vibrancy (Bertolini, 2005). During the process, a pedestrian-friendly built environment is an indispensable factor in achieving balanced and vital MSAs.
The “Node” component reflects accessibility of MSAs. A well-developed transit system can provide effective services, which increases accessible opportunities and promotes human activities and interactions. Two node features, namely access to transit and access to destinations, were found to have positive and significant effects on urban vibrancy (Long and Huang, 2017). They reflect the ease to get from one MSA to somewhere else by using transit and the capability to access opportunities, respectively.
The “Place” component involves land use features and building forms of MSAs. Jane Jacobs proposed four urban diversity metrics as conditions for street vibrancy, including mixed land uses, small blocks, buildings diverse in age and form, and concentration of buildings. These were afterward empirically tested in non-American contexts (De Nadai et al., 2016; Delclòs-Alió et al., 2019; Sung et al., 2013, 2015). Mixed land uses, as the first condition, ensures that people take full advantage of spaces. Through a combination of functions, e.g. residential, commercial, industrial, etc., spaces can be used in different ways at different times of the day. This leads to less driving, more pedestrians, social interactions, and economic activities. Additionally, MSAs’ abilities to offer green space, commercial service, and public service, which bring profound ecological, economic, and social benefits, have strong associations with urban vitality (Zhang et al., 2020). Urban design theories and many studies also highlighted that compact patterns of blocks and buildings are remarkable generators of urban vibrancy (Tu et al., 2020; Ye et al., 2018; Zhang et al., 2020). The two-dimensional building form measures the horizontal relationship between building space and ground space, while the three-dimensional building form reflects the vertical concentration of building space.
Regarding the “Tie” component, which reflects pedestrian accessibility, the street network is an important element that connects the other two components and stimulates vibrancy. Street network configuration with better centrality and detour rate can attract more pedestrians and create more opportunities for social interactions and communications (Ye et al., 2018). On the basis of the above, built-environmental features such as access to transit, access to destinations, land use mix, specific land uses, building form, and street network configuration, were carefully selected.
Designing spatial scenarios
In order to investigate the effects of different spatial relationship metrics in predicting MSAs’ vibrancy, we designed four spatial scenarios with the following three metrics: distance, network topology, and spatial interaction.
The first is the “null” scenario, which incorporates no spatial relationships. In this scenario, the setting is that MSAs are isolated from each other. Therefore, their vibrancy is supposed to be only influenced by their own built environment.
The second is the “distance” scenario, which embeds MSAs in spatial relationships defined by distance between MSAs. Specifically, all MSAs are set to be interconnected. The connections are weighted by the inverse of distance square

The third is the “network topology” scenario, which establishes spatial relationships according to the topological structure of metro networks, i.e. whether two MSAs are directly adjacent in metro networks

If MSA
The fourth is the “spatial interaction” scenario, which uses metro passenger flows to represent spatial interaction relationships

Constructing MSA-based graphs
The construction of MSA-based graphs involves the definition of vertices, vertex features, edges, and edge weights. In an MSA-based graph

The design of analysis scenarios, the construction of MSA-based graphs, and the prediction of vibrancy using GCNNs.
Predicting MSAs’ vibrancy
Applying traditional convolutional neural networks (CNNs) on non-Euclidean data that do not have regular structure could be problematic (Defferrard et al., 2016). By generalizing CNNs, GCNNs can operate directly on graphs and learn from both graph structures and vertex features (Kipf and Welling, 2017). It uses the graph Fourier transform to convert a graph into the spectral domain and introduces the graph convolutional filter to learn graph structures (Bruna et al., 2014).
Based on the above-defined graph

Assessing model performance
We assessed the performance of GCNN models by calculating their prediction errors. Specifically, we used the criterion of mean absolute prediction error (MAPE). For the whole model, the prediction error was calculated by

For model performance on individual MSA

Study case and data
The site
Shenzhen, which is located within the Pearl River Delta area of China, is selected as the site for empirical study in this research (Figure 2). As of 2018, there are 10 districts in Shenzhen, and Luohu and Futian districts are the central area. Shenzhen has a well-developed metro system, with 166 stations by the end of 2018. Having a relatively short history, Shenzhen is a well master-planned city, with a series of TOD policies and plans implemented there in a top-down manner. One can expect more impacts of built-environment features on MSAs’ vibrancy in Shenzhen when compared with most other cities. This feature would ensure that the empirical study is meaningful and does not end up with extremely low predictability.

The MSAs in Shenzhen (top) and the randomly selected MSA samples (bottom).
Gauging MSA boundaries
In this study, an MSA is defined as a buffer area around a metro station that people can comfortably access that station on foot (Singh et al., 2017). An MSA often covers a range of 400–800 m radius from a metro station. Jun et al. (2015) have compared multiple radii in their empirical studies in Seoul and suggested a radius of 600 m to be the most effective analysis scale for TOD sites. Based on this, a 600 m radius was adopted in this study. Prior studies often created the buffers around transit stations. However, it is the locations of entrances/exits of the stations that really matter. Hence, in this study, the buffers were generated based on locations of entrances/exits. Afterward, the buffers of different entrances/exits of the same station were merged, as shown in Figure 2.
Measuring MSAs’ vibrancy indices and associated built-environment features
We used the metro station-based ridership, the density of smartphone users, the density of Dianping reviews, and the density of Sina Weibo check-ins to measure the four single-dimensional proxies of MSAs’ vibrancy. These indices were calculated based on multi-source big and open data, including smartcard data, Baidu smartphone GPS positioning data, Dianping life service review data, and Sina Weibo GPS positioning data. Since the data are heavy tailed, they were then processed logarithmically. Afterward, we fused these standardized indices into an integrated vibrancy index. The next section will present more details on this.
A variety of open data were utilized to quantify the associated built-environment features. Specifically, based on travel time between metro stations and point-of-interest (POI) data, we calculated the number of POIs in the subarea within 30-min travel from a given MSA. Together with the dummy variable of whether an MSA is located in the central area, we intended to evaluate destination accessibility for MSAs. Moreover, metro frequency and number of bus directions were calculated to reflect transit capacity.
We used categories of POIs to calculate adapted entropy. In traditional land use data, the commonly used land use area cannot actually represent the real land use intensity due to the absence of vertical/height information. By contrast, POI data can reveal far more details about urban function than traditional land use data. We also extracted mixed-use buildings, green space, commercial service, and public service from POI data. Furthermore, based on building footprint and floor data, we calculated the ground space index and average building height for each MSA.
In addition, street network data were used to measure street network centrality and detour. The space syntax analysis method was employed with analyses performed in a radius of 600 m and distance measured by an angular metric. The analyses were carried out using the sDNA tool supported by the ArcGIS platform. More details about how the data were collected and how the indicators were calculated are presented in Table 1.
Vibrancy indices and built-environment predictors.

MSA: metro station area; POI: point-of-interest; API: application programming interface; NQPDA: network quantity penalized by distance in radius angular.
MSA sampling
In GCNN models, the observations (i.e. MSAs) are required to be divided into two groups: a training group for model training and a test group for examining model performance. As a semi-supervised method, GCNN models learn built-environment features and graph structures from all MSAs but learn vibrancy only from the training group. We applied a random sampling method to generate training groups, meanwhile treated the remaining unsampled MSAs as test groups. To facilitate comparative analyses and examine model performance at different training ratios, we used multiple sampling ratios ranging from 10% to 90%. Some sampling results are shown in Figure 1 (bottom). All of the nine sampling ratios were applied to the four scenarios to examine the stability of GCNN models.
Results and discussions
Evaluating vibrancy of MSAs in Shenzhen
As illustrated in Table 2, the single-dimensional vibrancy indices are moderately correlated, with Pearson correlation coefficients generally fall in the range of 0.6–0.8. This implies that socioeconomic and travel activities within MSAs share some similar patterns. With further evidence that KMO = 0.864 and p < 0.000 for Bartlett's tests, we are convinced that the adoption of the factor analysis method is appropriate. Based on the standardized single-dimensional vibrancy indices, a factor analysis was conducted with principal axis factoring as the factor extraction method in SPSS (version 25.0). A common factor, which has the largest eigenvalue and explains 68.86% of the variance, was extracted as an integrated vibrancy index. This means that it conveys the most common information about the four single-dimensional vibrancy proxies. As expected, the integrated vibrancy index has strong correlations with most single-dimensional vibrancy indices.
Solution of factor analysis and Pearson’s correlation coefficients between vibrancy indices.
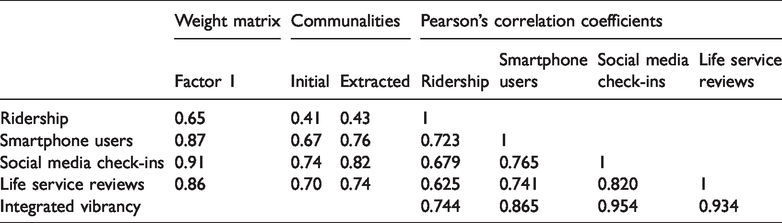
Figure 3 presents the spatial distribution of both single-dimensional and integrated vibrancy of MSAs in Shenzhen. The classification scheme of Jenk’s natural break was applied. Generally, spatial patterns of these single-dimensional and integrated vibrancy proxies are consistent with the results of Tu et al. (2020), who investigated multi-facet spatial dynamics of the vibrancy of Shenzhen at neighborhood level. Specifically, most MSAs with higher vibrancy are distributed in the central area (i.e. Luohu and Futian). The map of ridership shows that some vibrant MSAs are dispersed across the area outside the central area, suggesting a high metro dependency in these areas. As for smartphone users, they are highly concentrated in the MSAs of the central area, particularly those of Luohu, which are more pedestrian-friendly. In terms of Sina Weibo check-ins, high-vibrant MSAs arise at Luohu, Futian, and Nanshan. A possible explanation for intensive social media check-in activities in Nanshan might be the existence of tourist spots nearby and the increasing central role of Nanshan in Shenzhen. Regarding life service reviews, the spatial distribution is similar to Sina Weibo check-ins, but with a higher tendency of dispersion. Although we identified some discrepancies in the spatial distribution of these vibrancy proxies, the integrated vibrancy, which has eliminated as much bias as possible, presents a quite similar spatial pattern. Collectively considering all of the consistencies and differences, we believe that the integrated vibrancy can serve as a comprehensive proxy of the vibrancy of MSAs.

The spatial distribution of vibrancy of MSAs in Shenzhen.
Model performance across spatial scenarios and vibrancy proxies
Figure 4 displays the model performance across vibrancy proxies, spatial scenarios, and sampling ratios. The left chart presents the model performance at a 50% sampling ratio. As can be observed, in the “null” scenario that incorporates no spatial relationships, the GCNN models exhibit the lowest level of prediction accuracy with the largest means and standard deviations of

Model performance (MAPE1) across vibrancy proxies, spatial scenarios, and sampling ratios (Marker: mean MAPE1 values of the 50 repeated GCNN experiments; Error bars: standard deviation of MAPE1 values of the 50 repeated GCNN experiments).
The “network topology” and “spatial interaction” scenarios, which can capture the characteristics of spatial relationships of MSAs shaped by the metro system, have comparable model performances. This rather interesting finding strongly indicates the importance of metro network arrangement and real interaction relationships within the metro system in affecting and fostering the vibrancy of MSAs. By contrast, the “spatial interaction” scenario, which is represented by the actual travel behavior, outperformed the “network topology” scenario. A possible explanation for this might be that spatial relationships among MSAs are more than network adjacency. The measurement of spatial relationships involves both known rules (e.g. distance, network adjacency) and unknown rules underlying spatial relationships. For example, the interplay between two non-adjacent MSAs caused by the uneven allocation of resources may be much stronger than that between two adjacent MSAs that share similar land use patterns. The uneven allocation of resources generates travel demands, and studying traffic flows can facilitate a better understanding of spatial relationships between origins and destinations and their land-use characteristics. These may explain why the spatial interaction metric, as a direct measurement of traffic flows, outperforms the others.
The right chart in Figure 4 presents model performance under the best-performed scenario, i.e. the “spatial interaction” scenario. The model performances are relatively steady, only displaying a slight fluctuation across different sampling ratios. One interesting finding is that the models reach the lowest mean
Figure 4 also compares the model performance across the single-dimensional and integrated vibrancy proxies. It can be observed that the metro ridership and the number of smartphone users are more accurately predicted than the others. The one having the worst predictability based on current built environment features is the number of life service reviews, followed by the number of social media check-ins. As for the integrated vibrancy, it is predicted better than the former two but a little worse than the latter two. The desirable predictability of it further indicates the effectiveness and rationality of using built-environment features and GCNN to predict the integrated vibrancy of MSAs.
In order to further explore the influences of the spatial relationship metrics, we also examined the spatial distribution of model performance

The spatial distribution of model performance (MAPE2) across MSAs.
Promoting efficacy of built-environment features in generating vibrancy in MSAs based on spatial relationships
Built-environment features of MSAs in different spatial contexts may have different efficacies in generating vibrancy. The inconsistencies between built-environment features and vibrancy in MSAs may be subject to policy contexts, socioeconomic environment, industrial and population distributions, and time lag effect of development. Disclosing these inconsistencies can help provide policy makers and developers with reliable suggestions and predictable expectations for the cost-effective development of MSAs.
In this study, we utilized the residuals of the GCNN model, which equals the difference between the observed value and the predicted value of integrated vibrancy (estimated by built-environment features) to represent the inconsistencies between built-environment features and vibrancy in MSAs. A residual is positive when the predicted vibrancy value is smaller than the observed vibrancy value. Thus, a positive residual for an MSA indicates that the built-environment features have effectively generated an outcome of vibrancy. Conversely, an MSA with a negative residual means that its built-environment features are ineffective in generating vibrancy, or it has some underutilized potentials to enhance vibrancy.
In order to investigate the efficacy of built-environment features in generating MSAs’ vibrancy, we examined the spatial distribution of residuals across MSAs. We focused on the integrated vibrancy prediction models that were based on the “spatial interaction” scenario and adopted the 50% training ratio. Fifty repeated GCNN experiments were conducted to obtain stable and reliable results. As presented in Figure 6 (bottom), we can observe a clear spatial distribution pattern that more positive residuals (in red color) are concentrated in the central area, while most negative residuals (in blue color) are distributed outside the central area. Such a trend is consistent with the spatial development of Shenzhen. Since the central area of Shenzhen is highly developed, the potentials of the built-environment features of these MSAs are more likely to be fully realized. However, outside the central area, MSAs tend to have negative residuals. To maximize the benefits of transit and land use investments, TOD policies focusing on those MSAs should be established to achieve a desirable consistency between built-environment features and the performance of vibrancy. The thing we particularly highlight in this paper is to delve into those MSAs within their specific spatial contexts.

The spatial distribution of residuals (the difference values of actual integrated vibrancy values minus mean predicted integrated vibrancy values) across MSAs.
As illustrated in Figure 6, three typical MSAs with negative residuals (i.e. Yin hu, Chang ling pi, and Tang wei) were randomly selected as examples to show how spatial relationships should be considered to assist urban planning and design. These three MSAs are located in the central area, near the central area, and far from the central area, respectively. For each case, we used the spatial interaction metric to measure the spatial relationships with other MSAs. The top five spatial connections are mapped in Figure 6. The width of yellow lines indicates the strength of connections. The integrated vibrancy values of Tang wei, Chang ling pi, and Yin hu are 7.42, 6.17, and 8.86, which are below average. One possible explanation might be that intensive long-distance/time travel (e.g. Tang wei-Bi hai wan, Tang wei-Hou hai, Chang ling pi-Qing hu, and Yin hu-Che gong miao) leads to a lower level of neighborhood vibrancy (Wu et al., 2018b). To foster vibrancy in these cases as well as other MSAs that have unsatisfactory vibrancy owing to the ineffective translation of built-environment features into vibrancy, a comprehensive view of the closely connected MSAs is necessary. More reliable policies and promising design strategies would be made based on such a holistic view and further investigations into the relevant connections and resource allocations.
Conclusions
Predicting MSAs’ vibrancy is challenging, as vibrancy has a multifaceted nature and MSAs are interconnected. Given that one MSA’s vibrancy depends on not only that MSA’s built-environment features but also those of other MSAs, selecting appropriate spatial relationship metrics, which can effectively reflect the relevant information of MSAs’ spatial relationships, is essential for accurately predicting MSAs’ vibrancy.
In this study, we identified four single-dimensional vibrancy proxies and fused them into an integrated index. Moreover, we designed a two-layer GCNN model that can learn from both built-environment features of MSAs and spatial relationships between MSAs. We employed the model in an empirical study in Shenzhen, China, and compared the prediction accuracy between models incorporating different spatial relationship metrics. We confirmed the disparity in the prediction power of GCNN models when different spatial relationship metrics are employed and found that the spatial interaction metric can best reflect spatial relationships between MSAs. Given the multifaceted nature of vibrancy, we also incorporated both single-dimensional and integrated vibrancy of MSAs and compared their predictability. The findings suggest that the integrated vibrancy of MSAs can be well predicted by GCNNs based on the built environment features. Moreover, we utilized the residuals of the GCNN model to reflect upon the inconsistencies between the built-environment features and the integrated vibrancy, which allowed us to come up with tailored development proposals across MSAs.
Our contributions are threefold. First, we designed a replicable and verifiable GCNN model for MSAs’ vibrancy prediction. Second, different spatial relationship metrics are compared, and the superiority of network topology and spatial interaction metrics over the distance metric is confirmed. This provides useful references for future studies. Third, based on the residuals of the GCNN model, which can reveal if the built-environment features of MSAs can effectively generate an expected/desirable outcome of vibrancy, a holistic view of the closely connected MSAs is suggested to foster vibrancy in those MSAs with negative residuals. In the future, policy makers and developers can establish targeted policies for promoting the cost-effective development of MSAs.
Our understandings of spatial relationships among MSAs are developing and evolving all the time. There is still a long way to go before we can fully model relationships among MSAs. Nevertheless, this study shifts our focuses from an individual MSA to MSAs with spatial relationships. In the future, investigations on issues such as interpreting the details about the influences of neighborhood MSAs through explainers that can transform a black box into a white box is warranted. To take a step further, the GCNNs with spatial relationship taken into consideration have been proven valid and valuable in predicting MSAs’ vibrancy. These methods could also be exploited in the prediction of other expected outcomes of MSAs such as property values and accessibility of MSAs in the future.
Footnotes
Declaration of conflicting interests
The author(s) declared no potential conflicts of interest with respect to the research, authorship, and/or publication of this article.
Funding
The author(s) disclosed receipt of the following financial support for the research, authorship, and/or publication of this article: This research was supported by Hong Kong RGC Theme-based Research Scheme (No. T32-101/15-R).