
Abstract
Understanding the causes and effects of species invasions is a priority in ecology and conservation biology. One of the crucial steps in evaluating the impact of invasive species is to map changes in their actual and potential distribution and relative abundance across a wide region over an appropriate time span. While direct and indirect remote sensing approaches have long been used to assess the invasion of plant species, the distribution of invasive animals is mainly based on indirect methods that rely on environmental proxies of conditions suitable for colonization by a particular species. The aim of this article is to review recent efforts in the predictive modelling of the spread of both plant and animal invasive species using remote sensing, and to stimulate debate on the potential use of remote sensing in biological invasion monitoring and forecasting. Specifically, the challenges and drawbacks of remote sensing techniques are discussed in relation to: i) developing species distribution models, and ii) studying life cycle changes and phenological variations. Finally, the paper addresses the open challenges and pitfalls of remote sensing for biological invasion studies including sensor characteristics, upscaling and downscaling in species distribution models, and uncertainty of results.
Keywords
I Introduction
Biological invasions are a major consequence of global change and have had detrimental ecological and economic impacts on nearly all parts of the globe (Dullinger et al., 2013; Simberloff and Vitule, 2014). Invasive species continuously challenge biodiversity conservation, human and environmental health and natural resource management (see www.eea.europa.eu/highlights/invasive-alien-species-a-growing).
Invasive species can profoundly modify the structure and function of invaded ecosystems, alter biotic interactions and homogenize diverse plant and animal communities at large spatial scales, ultimately resulting in a loss of genetic, species and ecosystem diversity (Qian and Ricklefs, 2006). The negative economic impact of invasive species is estimated at over $100 billion annually in the USA alone (NRC, 2002), and more than £239 million in the UK (White and Harris, 2002), and some authors go as far as to claim that they are incalculable (Mack et al., 2000). Collectively, annual economic losses due to species invasions are about one order of magnitude higher than those caused by all natural disasters put together (see Ricciardi et al., 2011).
Given the negative economic and ecological impact of invasive species, a rapid method for detection and prediction of their arrival and spread is critical to allow an effective early assessment of species invasion risk and impact (Malanson and Walsh, 2013).
This review focuses on recent efforts to model the distribution of invasive species using remote sensing, and to stimulate debate on the potential of remote sensing for monitoring and forecasting biological invasions. Specifically, the article will discuss the strengths, challenges and drawbacks of remote sensing techniques such as: i) the use of remote sensing data in species distribution models (SDMs); ii) the potential of remote sensing to identify life cycle changes and phenological variations; and iii) open challenges and possible pitfalls regarding remote sensing for biological invasion studies including sensor characteristics, upscaling and downscaling problems in SDMs and uncertainty of results.
II The use of remote sensing (RS) in invasion studies
1 Using RS to detect and monitor plant invasions directly
Plant species invasions can potentially be detected directly by remotely sensed data based on the reflectance properties of vegetation in certain portions of the electromagnetic spectrum (called wavelength windows).
Multispectral sensors at a high spatial resolution have been used to detect tree and shrub invasive species. For example, Carter et al. (2009) demonstrated the power of using Quickbird data (4 bands, spatial resolution 2.44 m at nadir) to detect tamarisk (Tamarix spp.) along the Colorado River (USA) attaining a classification accuracy of 91%. However, there were large errors of commission since the moderate spectral resolution used was not sufficient to discriminate tamarisk and non-tamarisk riparian vegetation. A similar example is provided by Mullerova et al. (2013) detecting the distribution of Heracleum mantegazzianum. On the other hand, Wang (2008) demonstrated the greater appropriateness of AISA hyperspectral resolution imagery in comparison to Quickbird, and listed a series of recent successful studies of individual species detection by means of hyperspectral data.
In general, identifying individual species reliably using satellite-based and aerial imagery is challenging due to the difficulties of choosing and detecting optimal spectral wavelengths to differentiate the target species from others (which may only be possible at certain times of year), and controlling for the effects of vegetation structural characteristics (Chopping, 2011; Kempeneers et al., 2008; Pisek et al., 2011; Zeng et al., 2009) as well as identifying spatial associations between invasive and closely-related native species (Call and Nilsen, 2003). A number of invasive species have also been identified based on the uniqueness in leaf chemistry using both hyperspectral (Asner et al., 2008, Hestir et al., 2008; Somers and Asner, 2013b) and multispectral (Becker et al., 2013; Schneider and Fernando, 2010) analyses. Leaf water content has also been used successfully to detect invasive species. For instance, Underwood et al. (2003) were able to use airborne visible/infrared imaging spectrometer (AVIRIS) imagery with 4 m resolution to detect iceplant (Carpobrotus edulis) and jubata grass (Cortaderia jubata) in Mediterranean-type ecosystems of California because such invasive species showed higher leaf water content than native co-occurring species.
New prospects for improving the capacity of remote sensing to discriminate plant species come from laboratory studies on the characteristic emissivity spectra of plant species in the mid- and thermal infrared, and from foreseen advances in air-borne and space-borne hyperspectral thermal sensors (Ribeiro da Luz and Crowley, 2010; Ullah et al., 2012). As an example, it has been demonstrated that the leaf spectral reflectance measurements of Ailanthus altissima – an invasive tree species in Europe and North America (see Burkholder et al., 2011, and references therein) – are useful for determining the date of image acquisition and band selection, two of the main challenges in the design of remote sensing projects on vegetation.
2 Using RS to detect and monitor animal and pathogen invasions indirectly
Regarding animals and microscopic organisms such as pathogens, the majority of the most devastating invasive species listed by International Union for Conservation of Nature and Natural Resources (IUCN) are not amenable to straightforward measurement by remote sensing. This is because the majority of vertebrates and invertebrates, including parasites, and fungal/microbial species require indirect approaches unless they influence the reflective properties of the dominant canopy (i.e. plant) species (He et al., 2011). This phenomenon is also known as cross-taxon surrogacy or ‘cross-taxon congruency of community similarity’ (Su et al., 2004). These concepts can be applied to remote sensing detection as an indirect method to estimate animal species invasions.
For example, according to Araujo and Rozenfeld (2014), given two species sp1 and sp2, the probability of co-occurrence (spatial overlap) is given by

where p = probability of occurrence and I = interaction between species.
Hence, equation (1) could reliably be used to detect sp1 relying on its interaction with and the spatial distribution of sp2.
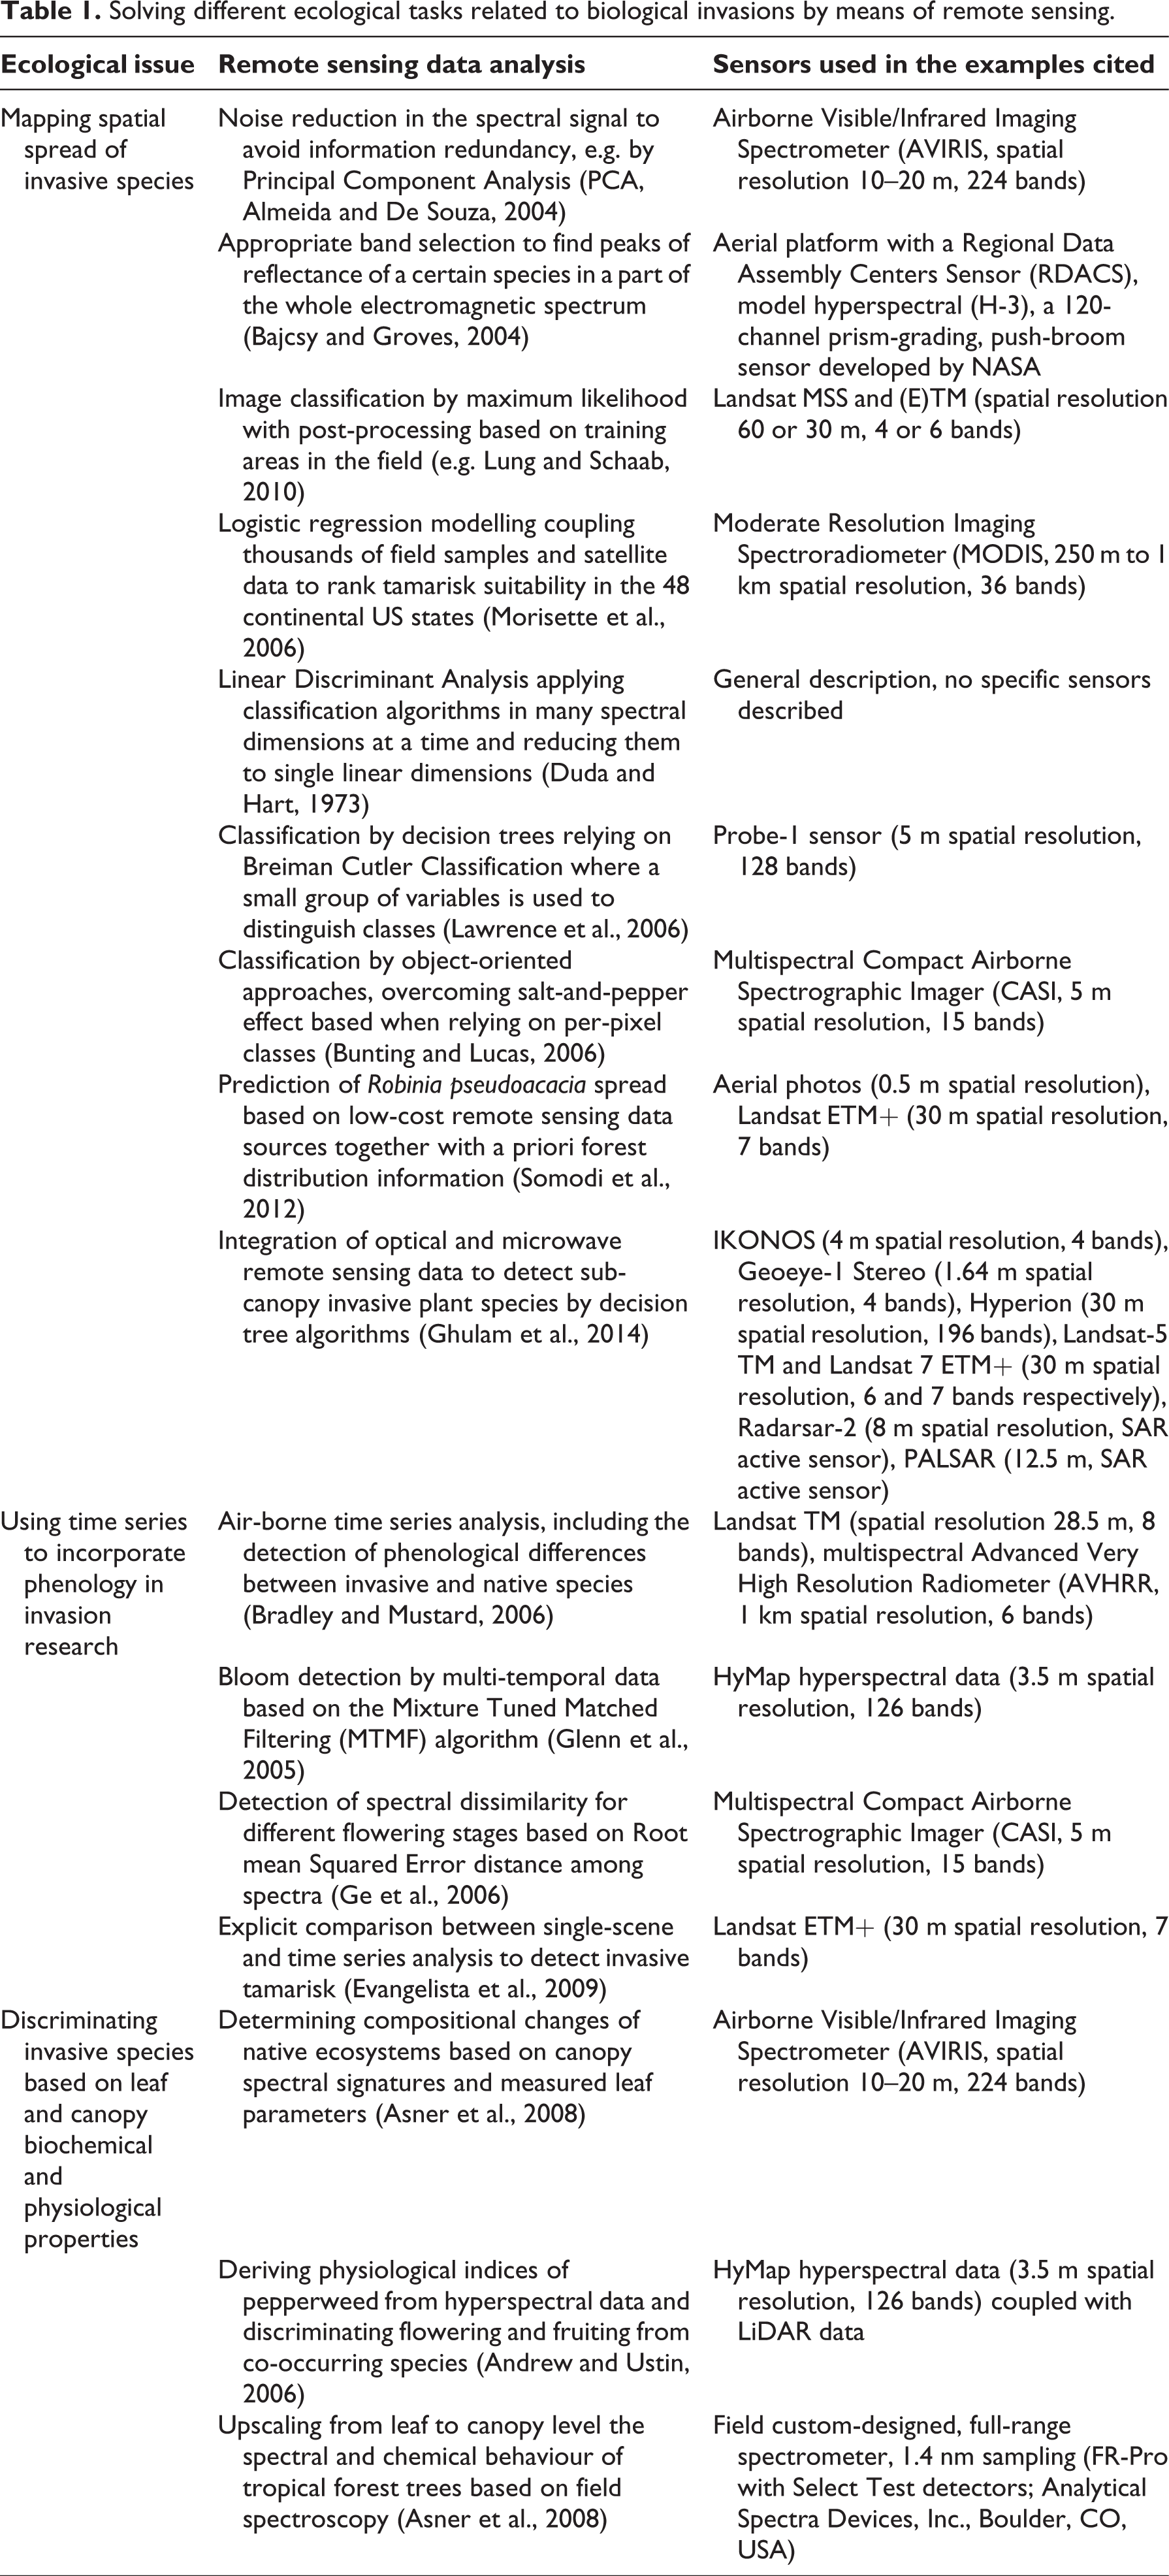
Consequently, the presence of hidden species (including understory plant species or animal species) might be revealed by taking advantage of their obligate ecological interactions with plant species that can be detected by remote sensors. For instance, the Normalized Difference Vegetation Index (NDVI), a reflectance-derived vegetation index, has been used to provide early warning and monitoring of invasive insects using the tight relationship between defoliation caused by these insects and vegetation indices (Eklundh et al., 2009; Gutierrez et al., 2010; Jepsen et al., 2009; see also Table 1). There are also several cases of pest damage that, while not strictly invasive, are illustrative of the potential of the NDVI plus remote-sensing approach. For example, mortality of lodge-pole pine induced by bark beetle was predicted and assessed using estimates of stand vigour derived from remote sensed data (Coops et al., 2009). Another interesting case is that of semi-arid areas where green vegetation development has been related to breeding and upsurge patterns of some insect pests such as locusts and insect vectors of human diseases such as mosquitoes (Anyamba et al., 2009).
Solving different ecological tasks related to biological invasions by means of remote sensing.
In addition, the Food and Agriculture Organization of the United Nations (FAO) has conducted pioneering studies on desert locusts in Africa using satellite data and NDVI (Cherlet et al., 1991; Hielkema et al., 1986) based on an approach used for plague locusts in Australia (McCulloch and Hunter, 1983). More recently, the same approach has been used to follow the movements of the East Asian migratory locust in China (Ji et al., 2004; Liu et al., 2008; Ma et al., 2005) as well as in Uzbekistan (Sivanpillai and Latchininsky, 2007). NDVI has also proven to be unexpectedly successful in animal ecology for predicting distribution, abundance and life history traits of herbivorous and non- herbivorous species (Pettorelli et al., 2011).
However, for insects, and particularly Lepidoptera, it has been suggested that high resolution space-borne synthetic aperture radar (SAR) or VHR satellite/air-borne hyperspectral data might be more appropriate (Reynolds and Riley, 2002). Moreover, the effectiveness of such measures could be enhanced by the combined use of other technologies to assess temporal changes in insect community composition resulting from individual species movement and migration (e.g. Riley and Drake, 2002). Refer to Table 1 for additional examples.
Although accurate estimates have proven difficult to obtain because of the complexity of human factors involved (Charrel et al., 2007), satellite imagery has played a critical role in monitoring disease vector development and dispersal (Ford et al., 2009) by linking environmental parameters to disease outbreaks. For example, the spread of the mosquito vector of Rift Valley Fever (RVF), a severe viral disease in Africa, has been monitored with the help of satellite data (Linthicum et al., 1987). Furthermore, by using a combination of satellite measurements including NDVI, Anyamba et al. (2009) made the first prediction of an RVF outbreak for the Horn of Africa. Similarly, satellite data are now being harnessed to monitor and predict vector presence and, therefore, malaria incidence (Caminade et al., 2014; Rogers et al., 2002; Tompkins and Ermert, 2013).
Though the majority of the studies have made use of NDVI as one of the ancillary variables for species distribution modelling, additional spectral indices have been used in invasive species mapping. For instance, the Enhanced Vegetation Index (EVI) has often been used as an alternative to NDVI as it is less influenced by background soil effects or saturation effects due to dense vegetation areas (Cord and Rödder, 2011). Furthermore, other indices, such as the Normalized Difference Water Index (NDWI), have been used for mapping Anopheles larval habitats, sources of malaria vectors (Machault et al., 2012).
Concerning hyperspectral imagery, narrow band indices have allowed investigation of different levels of plant stress and decline due to pest infestation. For example, Pontius et al. (2005) found that reflectance at a chlorophyll sensitive wavelength (R683 nm, using AVIRIS data), together with a Water Band Index (WBI, R970/R900), was able to predict the decline in eastern hemlock (Tsuga canadensis) forests due to the hemlock woolly adelgid (Adelges tsugae) pest. Refer to Table 2 in Pontius et al. (2005) for an exhaustive list of narrow band indices which have strong relationships with the decline of specific physiological responses.
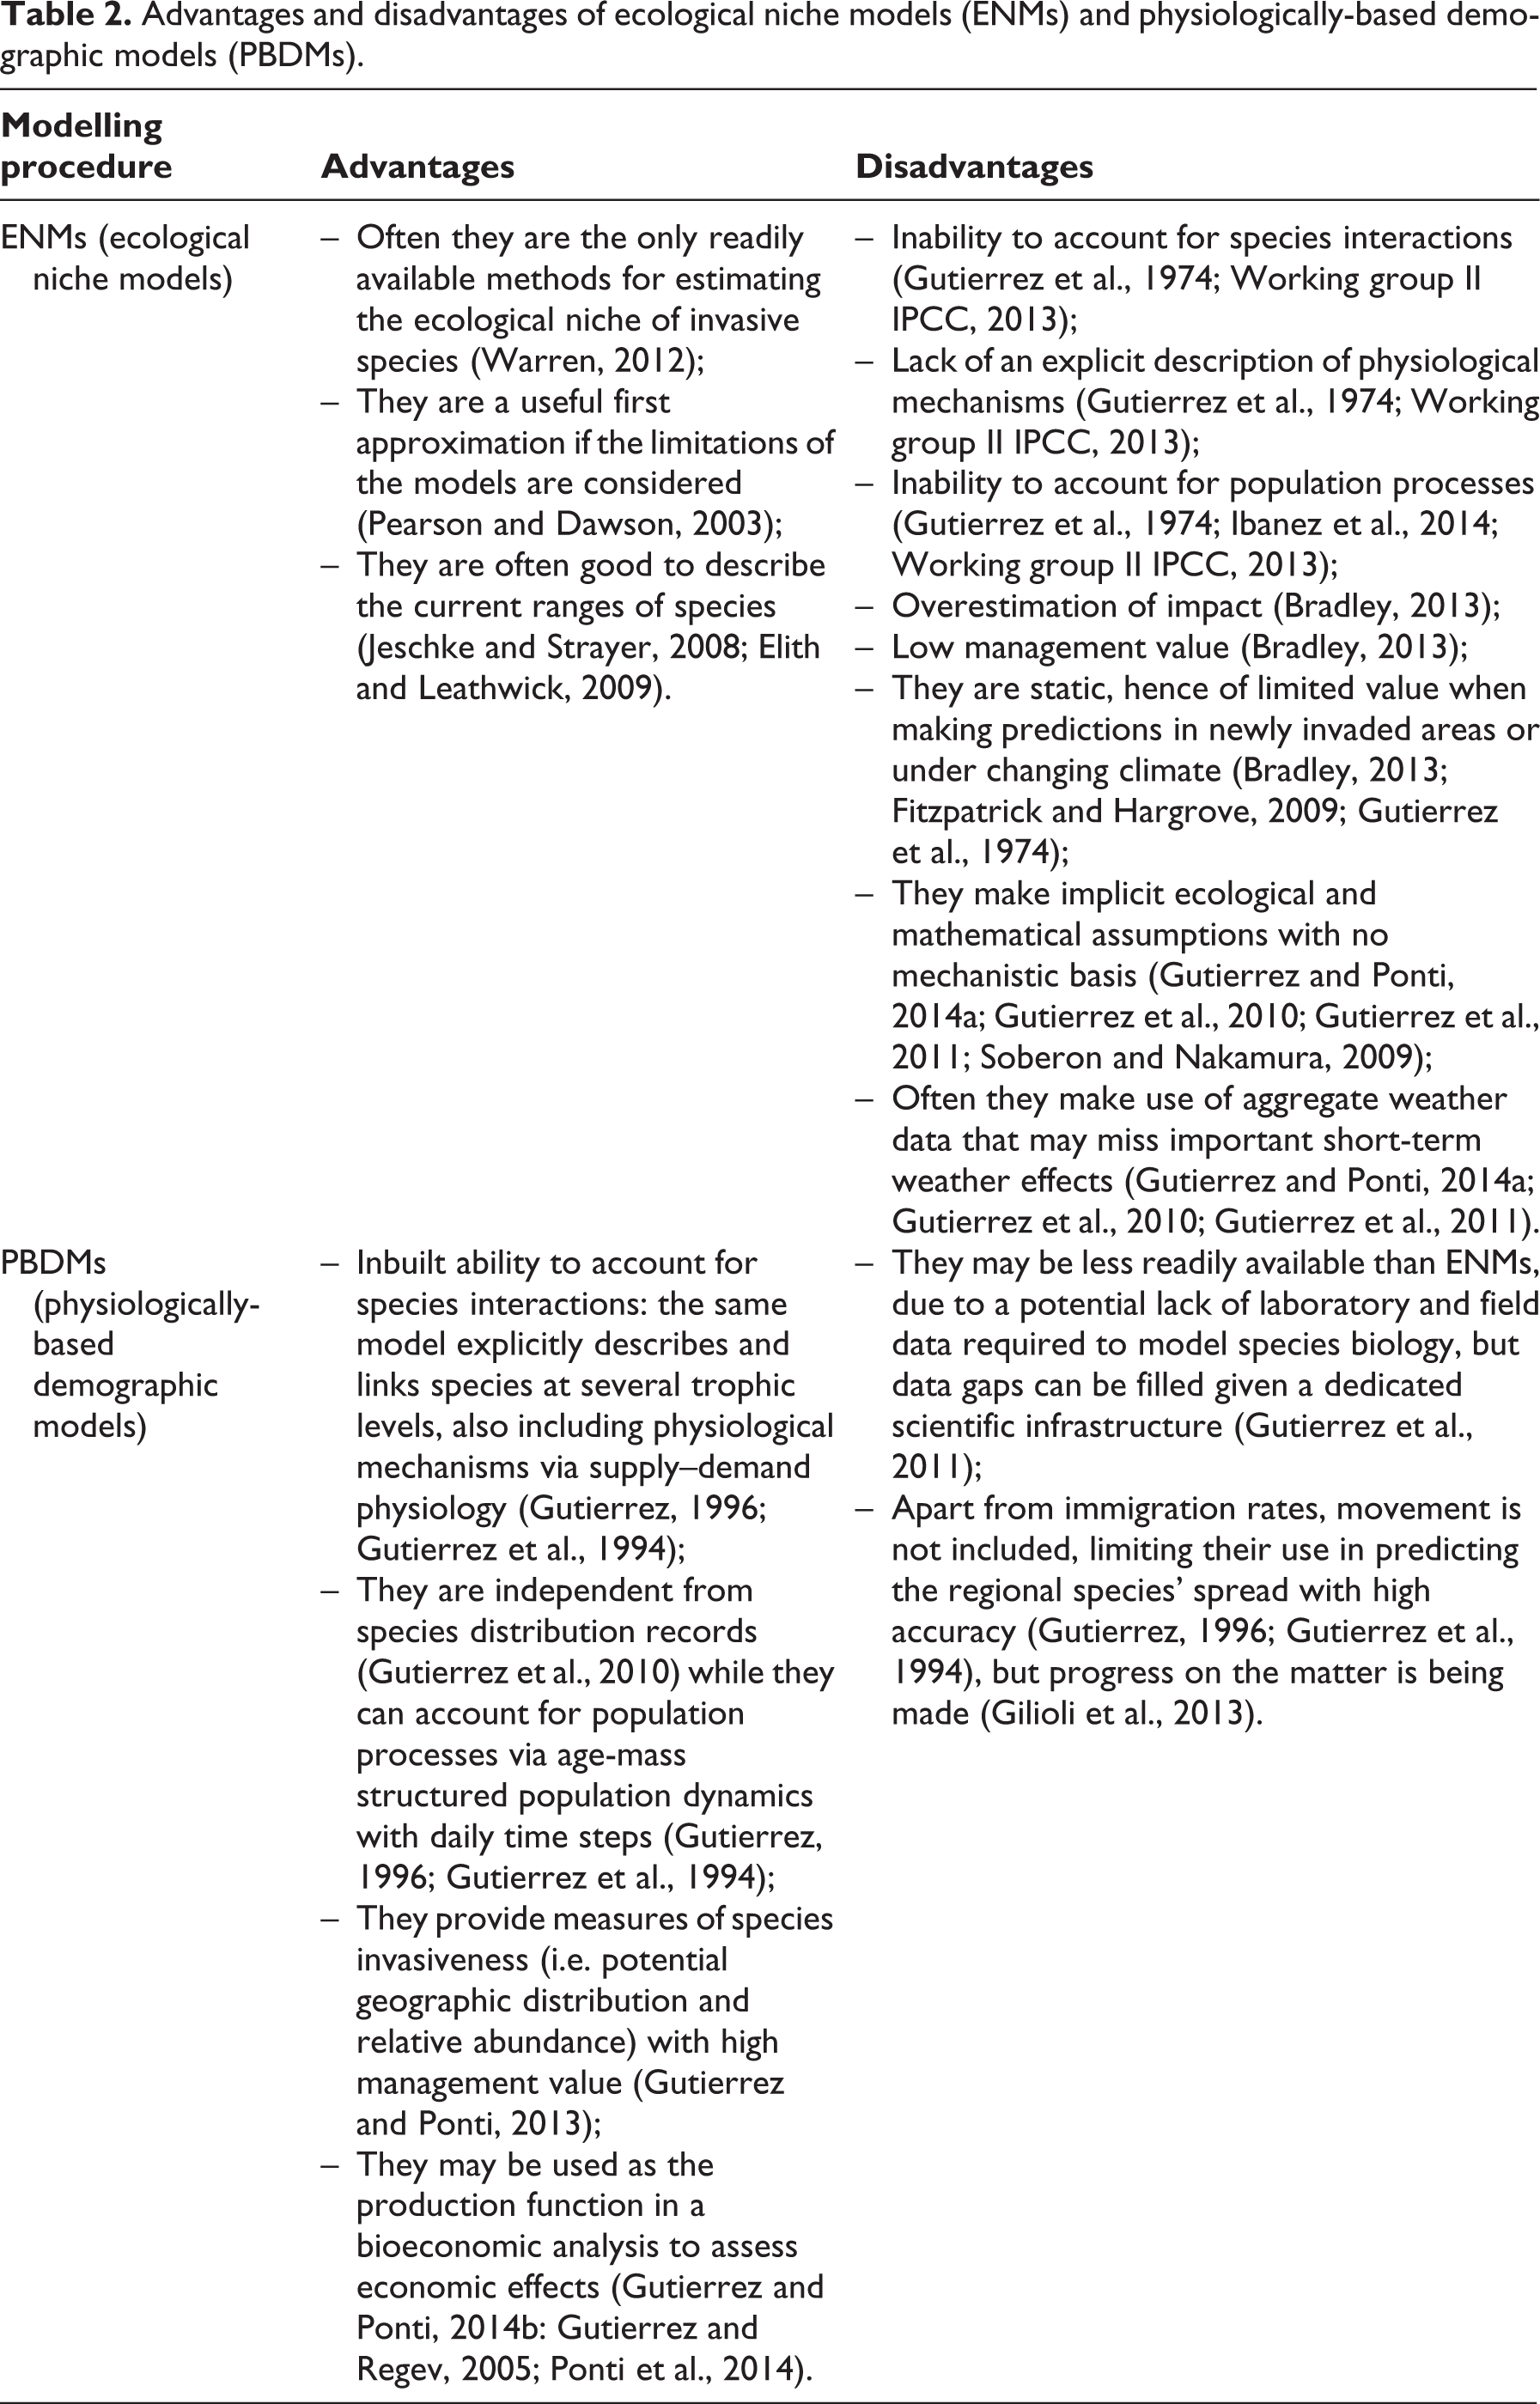
Advantages and disadvantages of ecological niche models (ENMs) and physiologically-based demographic models (PBDMs).
Aside from the use of spectral indices which might be similar in substantially different climatic regions (Fitzpatrick et al., 2008), land surface temperature (LST) has been used successfully in northern Italy (Rizzoli et al., 2007) for a risk assessment of tick-borne encephalitis virus (TBEv); an emerging zoonotic tick-borne pathogen whose life cycle is strictly related to variations in temperature, with an increasing incidence in central Europe during the last few decades (Carpi et al., 2008). In addition to mosquitoes and ticks, remote sensing has been applied successfully to the study of other arthropod vectors of disease such as blackflies (vectors of onchocerciasis), tsetse flies (sleeping sickness) and sandflies (leishmaniasis), which impact human health across the globe (Kalluri et al., 2007).
III Using remote sensing to improve species distribution models
SDMs may be correlative (ecological niche models, ENMs) or mechanistic (physiologically-based demographic models, PBDMs), and are rooted in niche theory (Chase and Leibold, 2003; Elton, 1927; Grinnell, 1917; Hutchinson, 1957). ENMs attempt to identify the set of conditions that best predict the geographic distribution of a species by means of algorithmic characterization of environmental features of sites of known occurrence (Elith et al., 2006; Pearson and Dawson, 2003; see Table 2). Each algorithm in this so-called correlative approach is designed to extract the relationship between environmental variability and occurrence of the target species (See Dormann et al., 2012, for a comparison between correlative and process-based SDMs). This relationship is then used to predict the probability of species distribution in non-sampled localities or areas based on their environmental conditions (Guisan and Zimmerman, 2000). ENM techniques vary in the way relevant explanatory variables are selected, how the contribution of each variable is weighted and how the occurrence patterns are predicted (Elith et al., 2006). In addition, while some model algorithms only use presence data, others require both presence and absence data (Elith and Leathwick, 2009). The selection of the appropriate model to use for analysis will depend on the availability of data and the underlying hypothesis. However, some already well-established methods, such as MaxEnt (Maximum Entropy, Phillips et al., 2006) or boosted regression trees (Elith et al., 2008), seem empirically to outperform several traditional techniques (Elith et al., 2006). Furthermore, ensemble modelling that combines information from multiple models to detect areas of high model agreement, where the invasive species is more likely to be found, appear to improve the likelihood of successful prediction (Stohlgren et al., 2010).
Remote sensing data have been used as ancillary spatial variables to improve species distribution models both spatially and temporally (e.g. Andrew and Ustin, 2009; Bradley and Fleishman, 2008; Gillespie et al., 2008; Saatchi et al., 2008). In particular, remote sensing may considerably improve the reliability of SDMs as these are usually based on occurrence data that are a poor proxy for abundance and tend to overestimate projected impact vastly (Bradley, 2013).
In addition, remotely sensed data layers can also be used to estimate the ecological niche of species in SDMs indirectly (see Peterson et al., 2011). This was done by Roura-Pascual et al. (2006), who used MODIS NDVI and EVI data as input to the Genetic Algorithm for Rule-set Prediction (GARP) ecological niche model to predict the potential geographic distribution of the Argentine ant (Linepithema humile), one of the five ant species ranked among the world’s 100 most successful and widespread invaders listed by the IUCN. In India, Narendra and Ramachandra (2008) analysed the relationship between NDVI and the location of nesting sites of different ant species, including some invasive species. Cord and Rödder (2011) used the MaxEnt model to show that, by including multi-temporal remote sensing data in the SDMs, it was possible to account for habitat availability. In Oregon, USA, Shirley et al. (2013) used boosted regression tree models to analyse relationships between distributions of birds and raw reflectance values from Landsat Thematic Mapper data. In that study, models based on individual reflectance bands were more accurate than those using only NDVI, and the authors concluded that freely available Landsat imagery may be particularly useful in developing SDMs when predictions at higher-resolution are required (Shirley et al., 2013).
Concerning habitat suitability modelling, Andrew and Ustin (2009) developed a habitat suitability model to assess the ability of advanced remote sensing data for evaluating habitat susceptibility to invasion by pepperweed (Lepidium latifolium) in California’s San Francisco Bay/Sacramento–San Joaquin River Delta. Their study used both predictor and response variables derived from remote sensing. In particular, the presence/absence data of the invasive species was drawn from a hyperspectral image. Predictor variables were derived from a high resolution LiDAR (light detection and ranging) DEM (digital elevation model). An aggregated classification and regression tree model was used to evaluate habitat suitability of pepperweed, finding that pepperweed invaded relatively more suitable (i.e. less stressful) sites along inundation and salinity gradients.
ENMs are widely used SDMs that interpolate or extrapolate from point observations over space in order to predict the occurrence of a species for locations where survey data are lacking (Franklin, 2010), and they show great potential for landscape functional connectivity studies (Mairota et al., 2011). The output of an ENM is a map indicating the potential distribution of a species, but it can also be applied to map higher levels of species assemblages such as communities or vegetation types (Casalegno et al., 2011; Ferrier et al., 2002). These maps are a basic tool for many aspects of resource management and conservation planning (Franklin, 2010). If the species under study is a pest or disease organism capable of affecting plants, animals or humans, then the prediction of its distribution or potential distribution may serve both public health and production-economy goals (Elith et al., 2006; Franklin, 2010; Guisan and Zimmerman, 2000; Gutierrez and Ponti, 2013; Peterson et al., 2011). In particular, predicting the potential distribution of invasive species using SDM correlative methods such as ENMs poses special challenges because in new scenarios the species can either occupy environments outside their native range or occupy a more restricted set of environmental conditions (e.g. see Guisan and Thuiller, 2005). Despite limitations, these methods can be very useful in predicting possible locations of spread on which managers can focus their attention to limit potential future damage (Zhu et al., 2007), and in many cases they are the only readily available methods for estimating the ecological niche of a species and may provide a useful first approximation if the results are interpreted with due consideration of the limitations of the models (Warren, 2012).
Given the ecological and economic importance that invasive species may have, the application of SDM and other approaches (e.g. indirect genetic or direct estimates of dispersal capabilities) to assess invasion risk is an active area of research (Franklin, 2010). However, recent literature deals clearly with the risks of policy or management failures associated with heavy reliance on correlative approaches (Barve et al., 2011; Dawson et al., 2011; Guisan et al., 2012, 2014; Petitpierre et al., 2012; Roubicek et al., 2010; Sinclair et al., 2010; Veloz et al., 2012; Webber et al., 2012; Wiens et al., 2009). These authors conclude that predicting the potential geographic distribution and relative abundance of invasive species requires both a realistic representation of the processes underlying species invasions, including the interactions with other species (e.g. trophic interactions), and that these processes are driven by climate independently of correlative measures of occurrence (Gutierrez and Ponti, 2013).
An alternative approach to correlative methods is the development of mechanistic PBDMs that capture the demographic response of a species to climate and trophic interactions and predict the distribution from its biology (Gutierrez and Ponti, 2013; Gutierrez et al., 1974; Gutierrez et al., 2005, 2010). The PBDM approach bridges the gap between field experiments used to study global change biology and climate envelope approaches used in macroecology (Kerr et al., 2007). By linking biological processes explicitly to their environmental drivers (not implicitly via proxies), and accessed via data layers of wide spatial and temporal coverage including remote sensing data, PBDMs bridge the gap between bottom-up (primarily physiological and population dynamics) and top-down (climatological) Geographic Information Systems (GIS) approaches for assessing on-ground ecosystem-level questions including biological invasions. For example, the prospective distribution of the glassy-winged sharpshooter (Homalodisca vitripennis) in North America was shown to be restricted by the action of egg parasitoids (Gutierrez and Ponti, 2013). The PBDM approach can also use species distribution data for validation, though such data are often lacking or too sparse to test the predictions.
Table 2 reports advantages and disadvan-tages of Ecological Niche Models (ENMs) and PBDMs (Physiologically-Based Demographic Models).
IV Life cycle changes and phenological variations captured by remote sensing
Phenological studies are critical to understand how species change and adapt their life cycles, especially in view of recent climate warming. Remote sensing has a great potential for directly tracking phenology for plants and indirectly determining temporal and spatial changes in habitat suitability for animals.
Different models have been developed to understand the nature of the geometry of vegetation in relation to its spectral behaviour (see Eastman et al., 2013; Förster et al., 2010; Nagai et al., 2010). While the concept of a spectral library has been proven for spectrally homogeneous and stable features (e.g. geological formations at coarse spatial scale), the spectral response of plant species varies with phenology, stress and environmental conditions (Kumar et al., 2001). This variation impairs the transferability of relations between vegetation and spectra and hence affects the use of spectral libraries (Eastman et al., 2013; Feilhauer and Schmidtlein, 2011). However, if the complete vegetation cycle can be included with measurements of field spectra, a relation between remote sensing imagery and a spectral library is possible for a given date of acquisition (Förster et al., 2010).
On the other hand, relying on time series data, phenological changes allow ecologists to gain better understanding of species life cycle events and seasonal dynamics of populations and assemblages. Phenology also plays a significant role in detecting and mapping the spatial distribution of invasive species in remote sensing applications (He et al., 2011). Multi-date remotely sensed images have become very useful in invasion studies. In particular, the unique phenology of some invasive species provides a sound basis for spectral differences between targeted species and co-occurring native vegetation (Evangelista et al., 2009; Ge et al., 2006; Peterson, 2005; Singh and Glenn, 2009; Williams and Hunt, 2004). Examples of an assemblage of invaders identified in this way include downy brome (Bromus tectorum), leafy spurge (Euphorbia esula), yellow starthistle (Centaurea solstitialis) and pepperweed (Lepidium latifolium).
Bradley and Mustard (2006) demonstrated how inter-annual data collected from the Advanced Very High Resolution Radiometer (AVHRR) can be used effectively to detect downy brome (Bromus tectorum) populations in the Great Basin. They were able to identify the phenological differences between the invaders and native flora within a single growing season. The same invasive species was also studied by Noujdina and Ustin (2008) using multi-date AVIRIS data in south-central Washington, USA. The authors compared the detectability of downy brome from single-date and multi-date AVIRIS data using a mixture-tuned matched filtering algorithm for image classification. They concluded that the use of multi-date data increased the accuracy of downy brome detection in the semi-arid rangeland ecosystems. The accuracy is a direct result of clear spectral differences controlled by phenological dissimilarities between downy brome and surrounding vegetation (see Figure 1).
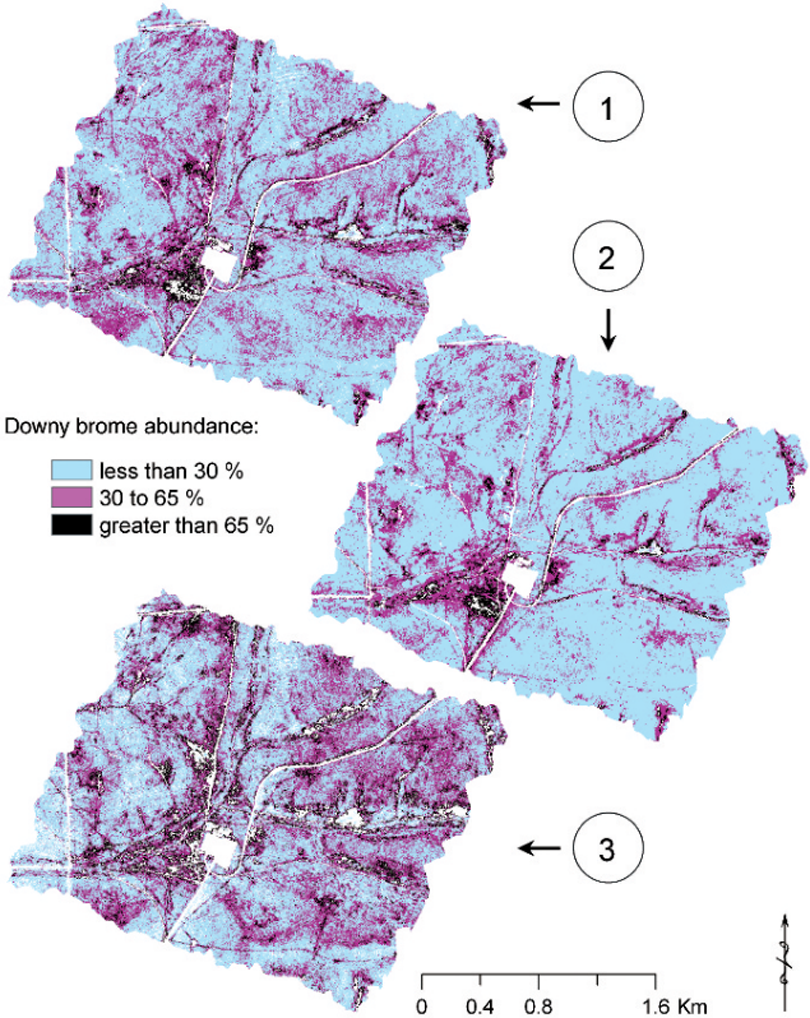
Maps of downy brome Bromus tectorum abundance predicted by the analysis of three different datasets derived from the air-borne hyperspectral Advanced Visible Infrared Imaging Spectrometer (AVIRIS): (1) Multi-temporal spectral stack; (2) July 2000 spectral data; and (3) May 2003 data. The overall accuracy coefficients for the three downy brome occurrence maps were: 0.81 for multi-temporal dataset, and 0.70 and 0.72 for 2000 and 2003 datasets (reproduced from Noujdina and Ustin (2008), under the permission of Weed Science and Allen Press Publishing Services).
Similarly, Glenn et al. (2005) used HyMap hyperspectral data collected over two years to detect the infestation of leafy spurge (Euphorbia esula) in Idaho, USA. A slight difference in leafy spurge reflectance was found between 2002 and 2003 images that was likely a result of slight changes in flowering time and date of the image acquisition. The authors also performed accuracy assessments for annual classification data and found that user accuracies were all above 70%, suggesting that the image processing methods were repeatable between years.
Phenology and other environmental attributes derived from remote sensing are crucial for both land cover/land use and habitat mapping using categorization schemes such as those developed by Food and Agriculture Organization of the United Nations (FAO) in the land cover classification system (LCCS) (Di Gregorio and Jansen, 1998, 2005) and by Bunce et al. (2011) in the General Habitat Categories (GHCs). Both are useful tools for the monitoring of habitat qualitative features from the perspective of vegetation dynamics induced by global warming coupled with anthropogenic disturbances (Franklin, 2010).
Hestir et al. (2008) successfully used hyperspectral remote sensing to identify both aquatic and wetland invasive weeds in the Sacramento–San Joaquin Delta: the terrestrial riparian weed, pepperweed (Lepidium latifolium); the floating aquatic weed, water hyacinth (Eichhornia crassipes); and the submerged aquatic weed, Brazilian waterweed (Egeria densa). They found significant differences in phenology among the three species. For example, Brazilian waterweed has two growth peaks, an early one during the beginning of the summer and another one during late summer. They suggested that a later acquisition in summer may reduce omission errors as plants may be given more time to grow to the water surface. They concluded that classification accuracy could be improved by mapping each phenological stage individually for all three invasive species.
In the tropics, time series of space-borne Hyperion data have been used to study the dynamic changes and invasive species in Hawaiian rainforests (Asner et al., 2006). The authors compared the structural, biochemical and physiological characteristics of an invasive nitrogen-fixing tree (Myrica faya) and a native tree (Metrosideros polymorpha) in humid montane forests. By using nine scenes of Earth Observing-1 Hyperion satellite data spanning a period from July 2004 to June 2005, including a transition from drier/warmer to wetter/cooler conditions, the authors successfully identified the basic biological mechanisms favouring the spread of an invasive tree species and provided a better understanding of how vegetation–climate interactions affect plant growth during an invasion process.
In general, most understory invasive species are hard to detect and map by remote sensing since they are usually hidden by overstory canopy. However, in some cases, a temporal window may exist when a clear phenology difference exists between native overstory species and understory invaders (Somers and Asner, 2013a). Wilfong et al. (2009) effectively detected the distribution of an understory invasive shrub, Amur honeysuckle (Lonicera maackii), in the deciduous forests of south-western Ohio, using phenological difference between Amur honeysuckle and co-occurring native tree species in the canopy. In this case, the invading shrub leafs out earlier in the spring and retains leaves longer in the fall than native deciduous species. Therefore, the best acquisition windows for remote sensing could possibly be the early spring and late fall when native deciduous species are leafless.
A key point when using remote sensing is the consideration of the correct time step in which a certain species and/or class may be detected. An example is provided by Evangelista et al. (2009) mapping tamarisk invasion in Arkansas River in south-western Colorado (USA). The authors demonstrated the power of using multi-temporal analysis to identify the time frames in which the phenological attributes of a plant species may help to discriminate invading tamarisk formations from other vegetation types (see Table 1).
Although it is possible to locate a few large species, such as elephants, using today’s high resolution remote sensing imagery, in contrast to plant species most animal species cannot be detected directly. Their elusive and secretive nature requires approaches based on proxies and surrogates of animal distribution and diversity such as habitat suitability, photosynthetic productivity, multi-temporal patterns, structural properties of habitat and forage quality, together with animal life cycles (Leyequien et al., 2007). For example, Neteler et al. (2011; see also Roiz et al., 2011) used temperature thresholds (derived from satellite MODIS data) which drive tiger mosquito (Aedes albopictus) survival in the Province of Trento (northern Italy) along with data on its life cycle in the area to provide both spatial distribution maps of the species and spread prediction in space and time. In Figure 2, applying the same approach, we estimated the areas suitable for Aedes albopictus within Europe for the year 2013, based on January mean temperature, average annual temperature and annual rainfall. The thresholds for these climatic parameters were taken from Kobayashi et al. (2002). The method is based on MODIS data at a resolution of 250m, which allowed us to estimate LST for creating thresholds and estimating the suitability for the insect. The LST values are available at http://gis.cri.fmach.it/eurolst/ (see also Metz et al., 2014).
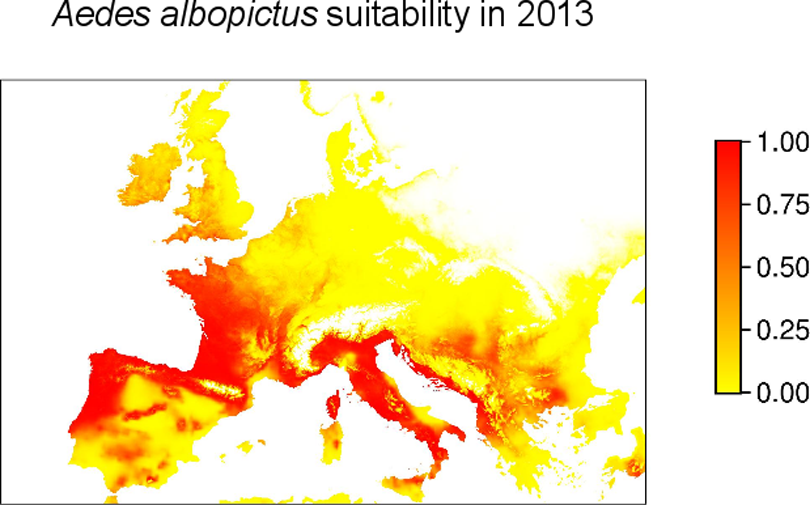
Animal species can be detected based on proxies and surrogates of animal distribution such as habitat suitability. In this example, reconstructing land surface temperature (LST) maps from remote sensing (MODIS data) may allow the prediction of the suitability for the spatial distribution of tiger mosquito (Aedes albopictus) and the forecasting of its spread in the future, under different climate scenarios. This Figure represents the potential spread of Aedes albopictus in South and Middle Europe in 2013 and has been created by the Free and Open Source Software GRASS GIS (Neteler et al., 2012).
In addition, band ratios, together with NDVI, LST, and rainfall, have been used to predict abundance, distribution and seasonality of disease-transmitting invertebrate vectors (see Leyequien et al., 2007, and references therein) such as the tsetse fly (Glossina spp.; Robinson et al., 1997), the midge (Culicoides imicola), vector of bluetongue virus (Baylis and Rawlings, 1998), and the gipsy moth (Lymantria dispar; Nelson, 1983). Similar approaches have been used to predict the abundance and distribution of vertebrate species such as the long-tailed colilargo (Oligoryzomys longicaudatus), the rodent responsible for hantavirus pulmonary syndrome in southern Argentina and Chile (Andreo et al., 2011), and the great gerbil, one of the rodent hosts of the Bubonic plague in central Kazakhstan (Wilschut et al., 2013).
V Open challenges and pitfalls regarding remote sensing for biological invasion studies
1 Sensor characteristics
Nagendra and Rocchini (2008) reviewed issues related to the resolution of remotely sensed data to study biodiversity, including biological invasion, and provided an extensive table with all the characteristics of such sensors (see Table 1 in Nagendra and Rocchini, 2008). According to this review, most of the relevant research in biodiversity and biological invasion is focused on throughput of hyper-spatial resolution data.
This observation was further reinforced by He et al. (2011), who showed a number of useful examples of studies relying on hyperspectral remote sensing to detect invasive species in different habitats and sites, from riparian vegetation in South California (Hamada et al., 2007), to terrestrial ecosystems in South Africa (Rouget et al., 2003), to California grasslands (Miao et al., 2006).
From this point of view, Nagendra and Rocchini (2008) also found that ‘the devil is in the detail’, providing several examples where remote sensing data with a higher fragmentation of the electromagnetic spectrum (higher spectral resolution) may outperform high spatial resolution data in studies of species patterns over space and time. This is particularly true considering the high level of noise in the spectral signal deriving from shadows when using hyper-spatial data.
As previously stated, in some cases direct detection of invasive plant species may rely on the spectral signature of a given species in the electromagnetic space. As an example, Somers and Asner (2012) distinguished invasive and non-invasive tree types using space-borne imaging spectroscopy to analyse the seasonal dynamics of the canopy hyperspectral reflectance properties. A similar methodology was applied by Bentivegna et al. (2012) to detect cutleaf teasel (Dipsacus laciniatus) in Missouri, while Yang and Everitt (2010) concentrated on invasive weed species. Moreover, in some cases, the hyperspectral information has been supported by LiDAR-based DEM (Asner et al., 2010), proving the availability of a wide range of remote sensing products for invasive species detection.
Furthermore, different classification methods may be adopted to make use of hyperspectral imagery profitably for detecting plant species invasion. Once specific spectral signatures of single vascular plant species (mostly trees and shrubs; Carlson et al., 2007) have been identified, different classification algorithms can be applied. When using hyperspectral data, the most commonly used algorithms are based on: i) unsupervised classification that aggregates pixels into classes based on spectral values with numerous clustering algorithms, including Isodata and K-means (Shanmugam et al., 2006); ii) maximum likelihood (e.g. Carter et al., 2009), which simply estimates each class mean and variation from training data; iii) linear discriminant analysis (LDA; Duda and Hart, 1973) using discriminant functions for each class based on the within-class covariance matrix; or iv) the spectral angle mapper (SAM; e.g. Clark et al., 2005), which is a spectral matching technique comparing each sample spectrum with several reference spectra (Kruse et al., 1993). Together with these algorithms, more recent techniques have been developed based on decision trees (e.g. random forest; Lawrence et al., 2006), or object-oriented approaches (Bunting and Lucas, 2006; Plaza et al., 2009).
Images acquired by hyperspectral sensors have been used to map invasive plants in various regions in the USA and other parts of the globe. Underwood et al. (2003) properly used the AVIRIS imagery with 4m resolution to detect iceplant (Carpobrotus edulis) and jubata grass (Cortaderia jubata) in California’s Mediterranean-type ecosystems using three image processing techniques (Minimum Noise Fraction Transform, Continuum Removal and Band Ratio Indices). Their study concluded that the Continuum Removal is a reliable method for depicting presence/absence of iceplant within the scrub community. However, the Minimum Noise Fraction Transform and Band Ratio Indices methods were most accurate in delineating the spatial distribution and density of iceplant and jubata grass.
When dealing with plant species, remote sensing direct detection is one of the most valuable methods and is akin to niche-based modelling techniques. This is true also when relying on multi-spectral sensors, i.e. when fewer spectral bands are available. As an example, Pouteau et al. (2011), modelling the distribution of the invasive tree species Miconia calvescens in Tahiti tropical rain forests, demonstrated that relying on direct remote sensing may outperform niche-based modelling techniques by comparing Support Vector Machine classification of Quickbird images (spatial resolution 2.44m at nadir) versus the GARP developed by Stockwell and Peters (1999). Table 1 represents a summary of the use of different remote sensing sensors and data analysis to solve ecological issues related to species invasion, while readers are referred to Underwood et al. (2007) and Huang and Asner (2009) for a description of case studies comparing different sensor types.
2 Upscaling and downscaling problems in SDMs
Compared to field observations, coverage and resolution of biophysical data derived from remote sensing satellite data substantially increase the potential to assess biological invasions under different climate change scenarios (e.g. those provided by the Intergovernmental Panel on Climate Change, IPCC) on a regional and global scale, especially given the increasing availability of satellite data with regional and global coverage and increasing resolution detail (Camps-Valls et al., 2009; Mendelsohn et al., 2007; Turner et al., 2003). This is because missing variables, inadequate duration, temporal and spatial gaps and declining coverage are pervasive limitations of field data (Clark et al., 2001; Pettorelli et al., 2005). On the other hand, satellite data are currently subject to errors that substantially reduce their ecological applications when not integrated with reliable field data (Kerr and Ostrovsky, 2003). Such integration of field and remotely sensed data now occurs through new interdisciplinary approaches that have collectively been termed ‘satellite ecology’ (Muraoka and Koizumi, 2009).
Remote sensing has long been used to estimate plant invasions by direct (and indirect) approaches, but the need to make predictions about higher trophic levels under climate change requires mechanistic alternatives to environmental proxies of invasion suitability.
Invasive species assessment currently faces the same key challenge as other ecosystem assessments: to determine how the biotic and abiotic context alters the direction and magnitude of climate change effects on biotic interactions (Davis et al., 1998; Tylianakis et al., 2008). However, the known mismatch between sparse field observations and the spatially and temporally continuous coverage of remote sensing data leads to a gap that has been addressed mostly via indirect correlative approaches in the form of ecological niche models (ENMs) (Kerr et al., 2007). ENM approaches have been successful in reducing this mismatch, but their correlative use of remote sensing data as proxies for environmental variables prevents a mechanistic assessment of biotic interactions under climate change and hence hampers reliable projections (i.e. extrapolation) outside observed climate space (Araujo and Luoto, 2007; Guisan and Thuiller, 2005; Tylianakis et al., 2008; van der Putten et al., 2010; Wardle et al., 2011; Zarnetske et al., 2012). PBDMs circumvent this limitation by explicitly modelling the weather-driven biology of the invasive weed, yellow starthistle, and its natural enemies (Gutierrez et al., 2005, 2010). Albeit substantially close to the correlative end of the process-correlation model continuum (Higgins et al., 2012), an interesting advance in the application of SDMs is provided by hybrid approaches (Midgley et al., 2010) which integrate landscape models (Mladenoff, 2004) and both SDM and population viability models (Akcakaya, 2000). Landscape models, in particular, allow simulation of spatially explicit simplifications of vegetation dynamics over large spatial scales.
Remote sensing has the potential for improving the reliability of SDMs for assessing biological invasions. When used with ENMs, remote sensing data may improve the management value of these correlative approaches that have proven to overestimate impact, with associated increased risk of policy or management failure. An alternative approach to correlative methods is mechanistic PBDMs where processes including those underpinning biological invasions are linked explicitly to environmental drivers that may be accessed via remote sensing. PBDMs have higher management value than ENMs as they predict the potential geographic distribution and abundance based on the mechanistic biology of species. However, the biology of an invasive species may be incomplete or poorly understood, and/or may require consideration in a trophic context. In addition, programming of the dynamics of the biology may be challenging for non-specialists, but standardized software could be developed that would facilitate implementation (e.g. Rocchini and Neteler, 2012). On the other hand, using an incomplete PBDM model may give false predictions of the geographic range and relative abundance of a species, and hence great care must be taken when developing and implementing such models.
3 Uncertainty of results
As stressed by Chilès and Delfiner (1999), once a predictive map is drawn, people tend to accept it at face value. However, thus far, species invasion estimates do not represent reality in a deterministic sense and are only estimates of potential presence. Therefore, the use of ‘maps of ignorance’ (Boggs, 1949) representing the bias or the uncertainty deriving from species distribution modelling, along with predictive maps, is strongly encouraged (Rocchini et al., 2011). Uncertainty can derive from a number of input data sources, such as the definition or identification of a certain species, as well as location-based errors.
Concerning the use of remote sensing data in direct species invasion detection, major sources of uncertainty derive mainly from: i) a mismatch between field and remote sensing grain (e.g. the pixel dimension is too big with respect to the pattern being studied; Carter et al., 2009, Table 1); ii) a mismatch between the phenological period and the spectral data being used, which may mean the species is not detected or its spread is underestimated (Evangelista et al., 2009, Table 1); iii) the classification of remote sensing data in vegetation or land use types, with pixels or resulting polygons representing species presence that are assumed to be internally homogeneous, which is rarely the case (e.g. Rocchini, 2010; Mairota et al., 2015).
Additionally, uncertainty in modelling plant species distribution with a direct approach based on the unique spectral signature of the invading species as discussed in section II.1 can be tangible. This is due to the nature of the variables derived from remote sensing used in the modelling. Typically, these variables are continuous remote sensing products such as NDVI, spectral bands, LAI, and so on; thus, the resulting distribution map could reflect the actual distribution of target species instead of their potential distribution patterns. This is more evident when the target species are in high abundance and in a unique phenological stage where they can be distinguished easily from co-occurring species by remote sensors (Bradley et al., 2012). Therefore, to reduce the uncertainty in the outcome of the modelling, other remotely sensed variables directly related to climate and topography should be used, such as MODIS LST data and microtopography from LiDAR. Further, when the resulting distribution maps are used for making management decisions, resource managers need to be more cautious about the possibility of underestimating the potential distribution of target species.
Finally, maps derived from the overlap of different thematic layers may lead to uncertainty related to the modelling procedure being adopted (Arbia et al., 1998). Hence the spatial distribution of uncertainty should explicitly be shown on maps (e.g. Bastin et al., 2013) to avoid ignoring overall accuracy or model errors. Quoting Swanson et al. (2013), ‘including such estimates alongside mean projections gives a map of ignorance as called for by Rocchini et al. (2011), highlighting areas where knowledge is lacking and could be improved with additional sampling effort or the inclusion of additional covariates’.
VI Conclusions
This article discussed methods used in tracking species range shifts and contractions such as SDMs and related model inputs derived from remote sensing. Furthermore, phenological studies aimed at mapping and detecting invaders at a broad spatial scale using air-borne or space-borne sensors were reviewed in detail. Lastly, open challenges and pitfalls regarding remote sensing for biological invasion studies were highlighted. We demonstrated the usefulness of remote sensing in directly mapping and modelling invasive plant species distribution patterns, and the indirect potential for remote sensing to detect such patterns in animal species and microorganisms such as pathogens.
Aside from potential global changes, species range shifts might be induced by direct anthropogenic causes, such as habitat destruction, or simply by assisted long distance dispersal (Nathan, 2006). For instance, increasing human mobility has facilitated the intentional or unintentional introduction of species beyond their natural geographic ranges (Ricotta et al., 2010). Land cover change is an additional key factor in biological invasions. Remote sensing provides an array of earth observation products that are valuable for understanding patterns of species abundance and range expansion (Pfeifer et al., 2012).
The aim of this article was to stimulate discussions on the potential of remote sensing in monitoring and estimating species invasions. With an increased imagery availability and advanced sensor technology, remote sensing provides a great opportunity for invasion biologists and resource managers to develop predictive models for invasion risk analysis and to draft early detection strategies. By integrating remote sensing products with field sampling data, significant progress can be made in detecting, mapping and modelling invasive taxa in a wide range of habitats and ecosystems.
Climate change is expected to expand further the risk of species invasions through novel disturbance regimes, elevated atmospheric CO2, altered dispersal patterns and relaxed physiological constraints of many plants and animals (Dukes and Mooney, 1999; Pearson and Dawson, 2003; Wiens et al., 2009). In this regard, the prediction of the potential geographic distribution and relative abundance of invasive species in their recipient communities (i.e. their invasiveness; see Gutierrez and Ponti, 2013; Gutierrez et al., 2011; Ponti et al., 2012) is crucial. Accurate measures of abundance are particularly important for making more relevant predictions and improving resource management (Bradley, 2013).
When species experience novel combinations of biotic and abiotic factors, such as during biological invasions (with climate change as an additional layer of complexity), predicting species invasiveness on correlative grounds based on scarce and costly field observations has shown to have serious limitations, especially from the management point of view. The best alternative would be to have direct observations of the invading species with wide geographic coverage, such as those provided by remote sensing imagery. However, most species except some plants cannot be sensed remotely, and hence remote sensing data might be used in conjunction with mechanistic rather than correlative modelling of invasive species (i.e. PBDMs vs ENMs) as a viable alternative that circumvents known limitations of correlative methods. In this way, invasive species assessment can be more relevant to management, and decision rules can be provided almost in real-time for wide geographic areas thanks to the increasingly rapid delivery of satellite imagery.
Studies have shown that climate change may increase the vulnerability of endemic species (Casalegno et al., 2010; see also Loarie, 2011) and enable range expansion of species from warm climate regions into previously colder regions (van der Putten et al., 2010). A recent report indicates that rapid range shifts are associated with climate change and that the rates of shift are two or three times greater than previously thought: the distributions of species have recently shifted to higher elevations at a median rate of 11 metres per decade, and to higher latitudes at a median rate of 16.9 kilometres per decade (Chen et al., 2011). This also implies that many invasive species will shift their geographic distributions, moving into areas where they were previously non-invasive or absent, thus making invasive species control and management even more complicated and costly. Moreover, both native and alien species can become invasive and alter an ecosystem’s taxonomic and structural composition. However, invasion by native plant species may ultimately lead to ecological succession and thus to vegetation types which retain certain conservation value according to current perceptions in particular areas. Invasion brought by alien species, instead, may imply more substantial and long-lasting modifications to vegetation dynamics, hence to both local and landscape food webs and efficiency in providing ecosystem services (e.g. carbon storage, biodiversity). In addition, the individualistic nature of species’ response to climatic changes, which is likely to lead to communities that are compositionally unlike those found currently (Mack et al., 2000; Pysek et al., 2014), is further complicated by local natural and anthropogenic disturbances (e.g. wildfires, grazing, management, land use change). A meaningful example is provided by Olofsson et al. (2014), in which single events such as fire can be localized and mapped by remote sensing. Such maps can be used as drivers to understand composition turnover over time related to the invasion of new niches by potentially invasive species. These events operate in synergy with global and regional shifts in climate and play a major role in shaping patterns of species distribution at regional and local scales (Franklin, 2010).
Footnotes
Acknowledgements
We are grateful to the handling editor, K Anderson, and to two anonymous reviewers for precious insights on a previous version of the manuscript.
Funding
Duccio Rocchini and Carol Ximena Garzon-Lopez were partially funded by the EU BON (Building the European Biodiversity Observation Network) project, funded by the European Union under the 7th Framework programme, Contract No. 308454. Duccio Rocchini was also partially funded by the ERA-Net BiodivERsA, with the national funders ANR, BelSPO and DFG, part of the 2012-2013 BiodivERsA call for research proposals. Annapola Rizzoli, Markus Neteler and Markus Metz were partially funded by the Autonomous Province of Trento (Italy), Research funds for Grandi Progetti, Project LExEM (Laboratory of excellence for epidemiology and modelling, ![]() ). The PhD Scholarship of Sajid Pareeth and Matteo Marcantonio is supported by FIRS>T (FEM International Research School e Trentino).
). The PhD Scholarship of Sajid Pareeth and Matteo Marcantonio is supported by FIRS>T (FEM International Research School e Trentino).