
Abstract
This paper presents the first estimates for the life expectancy of the very surface of bedrock desert landforms, such as bornhardts, cliff faces, fault scarp, inselbergs, ridge crests, and slickrock. The correlative dating method of varnish microlaminations yields minimum ages for the timing of the last spalling event caused by the physical weathering process of dirt cracking. Minimum percentage of a bedrock surface spalled per thousand years is a metric that can be estimated using multiple varnish lamination ages. Understanding rates of surface spalling provides a quantitative measure of Gilbert’s (1877: 105) weathering-limited ‘rate of disintegration’, because this metric directly links to the rock disintegration process of dirt cracking. Rates of percent surface spalled then translate into estimates of how long it takes for the very surface of a desert bedrock landform to die. For a variety of example landforms in the southwestern USA, the maximum time required to completely resurface a desert bedrock landform by spalling from dirt cracking ranges from 89 to 600 ka.
I Introduction
Landform antiquity has long been of fascination to geomorphologists (Gregory and Chase, 1992; Gunnell et al., 2017; King, 1948, 1963; Nishiizumi et al., 1993; Seong et al., 2016a; Twidale, 2002) for a variety of reasons including: understanding changes in transport-limited and weathering-limited landscapes (Gilbert, 1877); testing numerical models (Pelletier et al., 2007); understanding the origins of fossil landforms (Péwé, 1983); and connecting geomorphic processes to climatic changes (Richards, 2000). The focus of this paper rests on the stability of the very surface of bedrock landforms in warm deserts, where in order to assess their antiquity, geomorphologists commonly use the buildup of cosmogenic radionuclides through the metrics of surface exposure age and bedrock erosion rate (Cockburn and Summerfield, 2004; Gunnell et al., 2013; Heimsath et al., 2010; Phillips et al., 2016; Seong et al., 2016b).
The time since the very surface of the bedrock last spalled, however, is a different metric than information extracted from cosmogenic nuclide analyses. The phrase ‘very surface of bedrock landform’ is used throughout this paper to emphasise the notion of zero-surface erosion that can be evaluated through the study of rock varnish formed on top of desert bedrock surfaces (Liu and Broecker, 2007, 2008, 2013).
Erosion of bedrock surfaces occurs at scales ranging from submillimeter flaking to mass wasting of rock material meters thick. No matter the nature of the erosion event, however, the old land surface no longer exists. Inherently, cosmogenic nuclides are not able to provide information on the life expectancy of the very surface of a bedrock landform because stable nuclides, such as 3He, and radionuclides, such as 10Be, build up well beneath the landform’s surface (Cockburn and Summerfield, 2004; Phillips et al., 2016). The physics are clear that erosion events <10 cm will not reset this build-up clock (Duller, 2000; Phillips et al., 2016). Thus, cosmogenic nuclides are not able to address questions of when the last spalling event <10 cm took place (Cockburn and Summerfield, 2004; Dorn and Phillips, 1991; Phillips et al., 2016).
Studies of geomorphic processes influencing desert bedrock landforms reveal that spalling events <10 cm are quite common (Blackwelder, 1925; Dorn, 1995b; Dragovich, 1993; Hobbs, 1918; Mabbutt, 1977; Moses et al., 2014; Ollier, 1965; Paradise, 2005; Smith, 2009; Sumner et al., 2009; Viles, 2013; Viles and Goudie, 2007; Warke, 2007). Thus, geomorphologists must use methods other than cosmogenic nuclides to understand rates of such processes as dirt cracking (Ollier, 1965), exfoliation (Blackwelder, 1925), fire-induced spalling (Dragovich, 1993), clast-size reduction in desert pavements (Mabbutt, 1977), flaking from salt weathering (Smith, 2009), and other sorts of rock breakdown (Warke, 2007). This paper specifically explores how to measure rates of dirt cracking (Ollier, 1965) on desert bedrock landforms.
The rest of the paper employs necrogeomorphological terms, as befits this special issue. Erosion of the very surface of a bedrock landform, whether at millimeter or meter scales, is referred to as the mortality of that surface. Rock weathering is a poor term better called “rock decay” (Hall et al., 2012), or in this paper rock morbidity. How long it takes to completely erode the very surface of a bedrock landform is its longevity or life expectancy.
Why might the mortality of the very surface of a bedrock landform be important to understand, as opposed to values measured by cosmogenic nuclides, such as millimeters of erosion per thousand years? A necrogeographer might wish to understand the mortality of land surfaces for methodological, practical, and theoretical reasons.
Methodologically, determining the life expectancy of the very surface of a landform provides an independent comparison for other dating methods. In a blind study, the completely different chronometric strategies of varnish microlamination (VML) and cosmogenic dating generated comparable results (Marston, 2003). Indeed, cosmogenic nuclides reveal a chronometric signal consistent with VML patterns on Holocene and late Pleistocene timescales (Larson et al., 2016; Liu and Broecker, 2007, 2008, 2013). Cosmogenic nuclides build up in exposed rock surfaces, but surface exposure dating using cosmogenic nuclides is not sensitive to rock spalls <10 cm thick (Cockburn and Summerfield, 2004; Phillips et al., 2016). In contrast, even a millimeter of surface spalling will completely erase VMLs. Thus, similar results give confidence to both chronometric approaches because they are different methods with which to date geomorphic surfaces.
Practically, desert cities like Phoenix, USA place abundant infrastructure in the form of homes and roads at the base of bedrock slopes (Jeong et al., 2018). Understanding the longevity of bedrock surfaces generates insight into hazards from rock falls (Dorn, 2014) and debris flows (Dorn, 2016). Also from an applied perspective, geoarchaeological studies of rock art rely on the accumulation of rock coatings to measure the antiquity of a rock engraving or painting (Liu, 2018; Rowe, 2001; Whitley, 2008; Whitley et al., 2017).
To develop geomorphic theory further, many geomorphic processes do not reset the cosmogenic clock. For example, aeolian abrasion removes the upper few micrometers of a ventifact, but this does not impact the cosmogenic signal; in contrast, the cessation of aeolian abrasion antiquity can be studied by analysing rock coatings formed on top of a ventifacted surface (Dorn, 1995a; Dorn and Phillips, 1991). Precariously balanced rocks build up cosmogenic nuclides, even when rock material was buried in the upper meter of regolith, but VML dating provides vital insight into how long the very surface of a balancing rock has been exposed, as for instance capable of yielding insight into the timing of the last large earthquake event (Bell et al., 1998). The ability to learn the age of the present-day rock surface has the potential to do much more than provide factoids about the ages of exposed bedrock desert landforms of places like Mount Sinai in Egypt, Petra in Jordan, Spitzkoppe in Namibia, or Uluru in Australia. Learning when a surface last spalled is a new way to study the reshaping of desert bedrock landforms.
The purpose of this paper rests on developing the first estimate of the life expectancy of the very surface of a desert landform, or the amount of time required for all exposed bedrock of a desert landform to undergo spalling. Thus, this paper presents a new strategy on how to utilise VML dating in order to determine the timing of spalling of desert bedrock surfaces. The next section reviews the process of dirt cracking, a mechanical rock morbidity (weathering) process in warm deserts, and why identifying surfaces exposed by dirt cracking is the key to this research. Then, the paper details study sites, methods, and findings.
II Dirt cracking leaves behind evidence of rock morbidity
This section explains the importance of the process of dirt cracking that leads to rock spalling. Dirt cracking requires the existence of an initial fracture – and a variety of different processes fracture desert bedrock and boulders. Rock jointing (Ehlen, 2002; Engelder, 1987; Hobbs, 1967; Schultz, 2000; St Clair et al., 2015; Twidale and Bourne, 1978) creates inherent weaknesses to be exploited by the application of force. Thermal stresses imposed by insolation changes (Blackwelder, 1933; Hobbs, 1918; Moores et al., 2008; Paradise, 2005; Peel, 1974; Warke and Smith, 1998), moisture changes (Camuffo, 1995; Mabbutt, 1977; Moores et al., 2008), salt (McGreevy and Smith, 1982; Mortensen, 1933; Viles and Goudie, 2007), exfoliation (Blackwelder, 1925), and fire (Dragovich, 1993) all play a role in generating observed fractures.
The exact processes by which fractures undergo enough additional stress to detach or spall a bedrock surface can be difficult to establish. Thermal, moisture, fire, and other spall-producing stresses do not leave behind a unique signature indicating the process that led to a spall. In contrast, dirt cracking (Dorn, 2011; Ollier, 1965) leaves behind clear visual and geochemical evidence.
Dirt cracking occurs in positions where fractures accumulate the ubiquitous dust found in warm desert environments globally (Bullard and Livingstone, 2009; Goudie, 1978), including the region studied here in the southwestern USA (Brazel, 1989; Péwé et al., 1981). First identified as a process in Australia (Ollier, 1965), dirt cracking widens fractures through wetting and drying of the fines inside fissures as well as through the precipitation of laminar calcrete that extends the fracture deeper into the bedrock (Dorn, 2011). Dirt cracking was also identified in the Sinai Peninsula (Coudé-Gaussen et al., 1984) and then in the Sonoran Desert (Villa et al., 1995). Ollier (1965) postulated a positive feedback, confirmed by later research (Dorn, 2011), whereby each increment of fissure widening and deepening facilitates more dust infilling and deeper infiltration of laminar calcrete. Eventually, the fracture opens wide enough to cause spalling and exposes the walls of the rock fracture as the new surface of a bedrock landform.
A unique aspect of dirt cracking is that it leaves behind a visual and geochemical signature on the walls of the spalled rock fracture (Dorn, 2011). Fissure walls that are in contact with accumulated aeolian dust develop rock coatings of orange iron films (Villa et al., 1995; Dorn, 2011). When the fissure opens wide enough to allow rainwater to wash the walls clean of dust, a thin band of black rock varnish forms (Dorn, 1998, 2011). Also, laminar calcrete often occurs underneath and intercalated with orange iron film (Coudé-Gaussen et al., 1984).
Figure 1 exemplifies what the exposed wall of a fissure opened by dirt cracking looks like; variability in colour of the orange to red iron film depends on the abundance of ferrihydrate, goethite, or hematite. Manganese oxide colours the outer band black. Laminar calcrete is whitish because of its calcium carbonate-dominated composition.
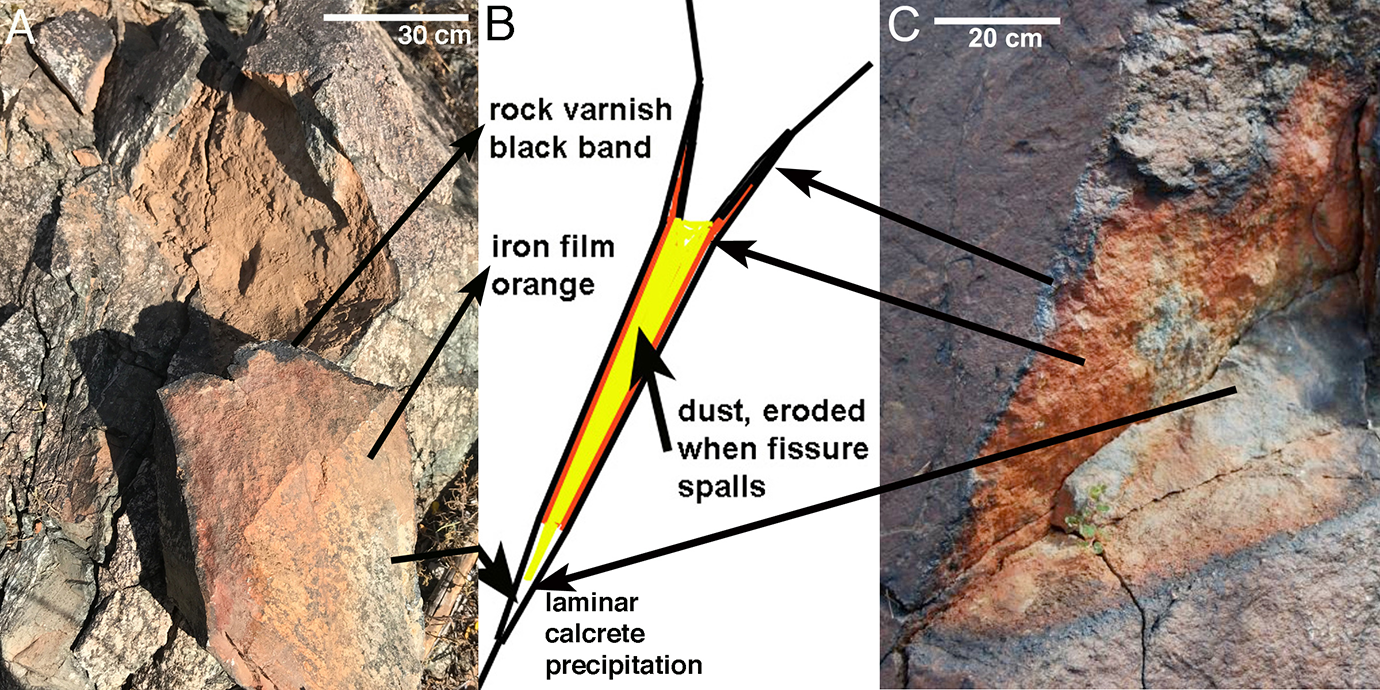
Dirt cracking wedges open joint faces in two ways: laminar calcrete precipitation and the wetting and drying of dust in the joints. (a) Fracture manually pried open and (c) fracture exposed naturally at South Mountain, Phoenix. Notice the abundance of dust in the pried-open fracture that has been washed away in the naturally open fracture (a). (b) Idealised diagram of rock coatings associated with fractures opened by dirt cracking.
Because dirt-cracking events leave behind a visual and geochemical signature, the VML pattern formed on top of a dirt-cracked surface informs on when the spalling event occurred. The VML correlative dating method requires calibration from numerical ages, such as cosmogenic nuclides or radiocarbon. Calibrated VML patterns, examined in ultrathin sections via light microscopy, exist for the Holocene and late Pleistocene in regions like the southwestern USA (Liu and Broecker, 2007, 2008, 2013).
III Study sites
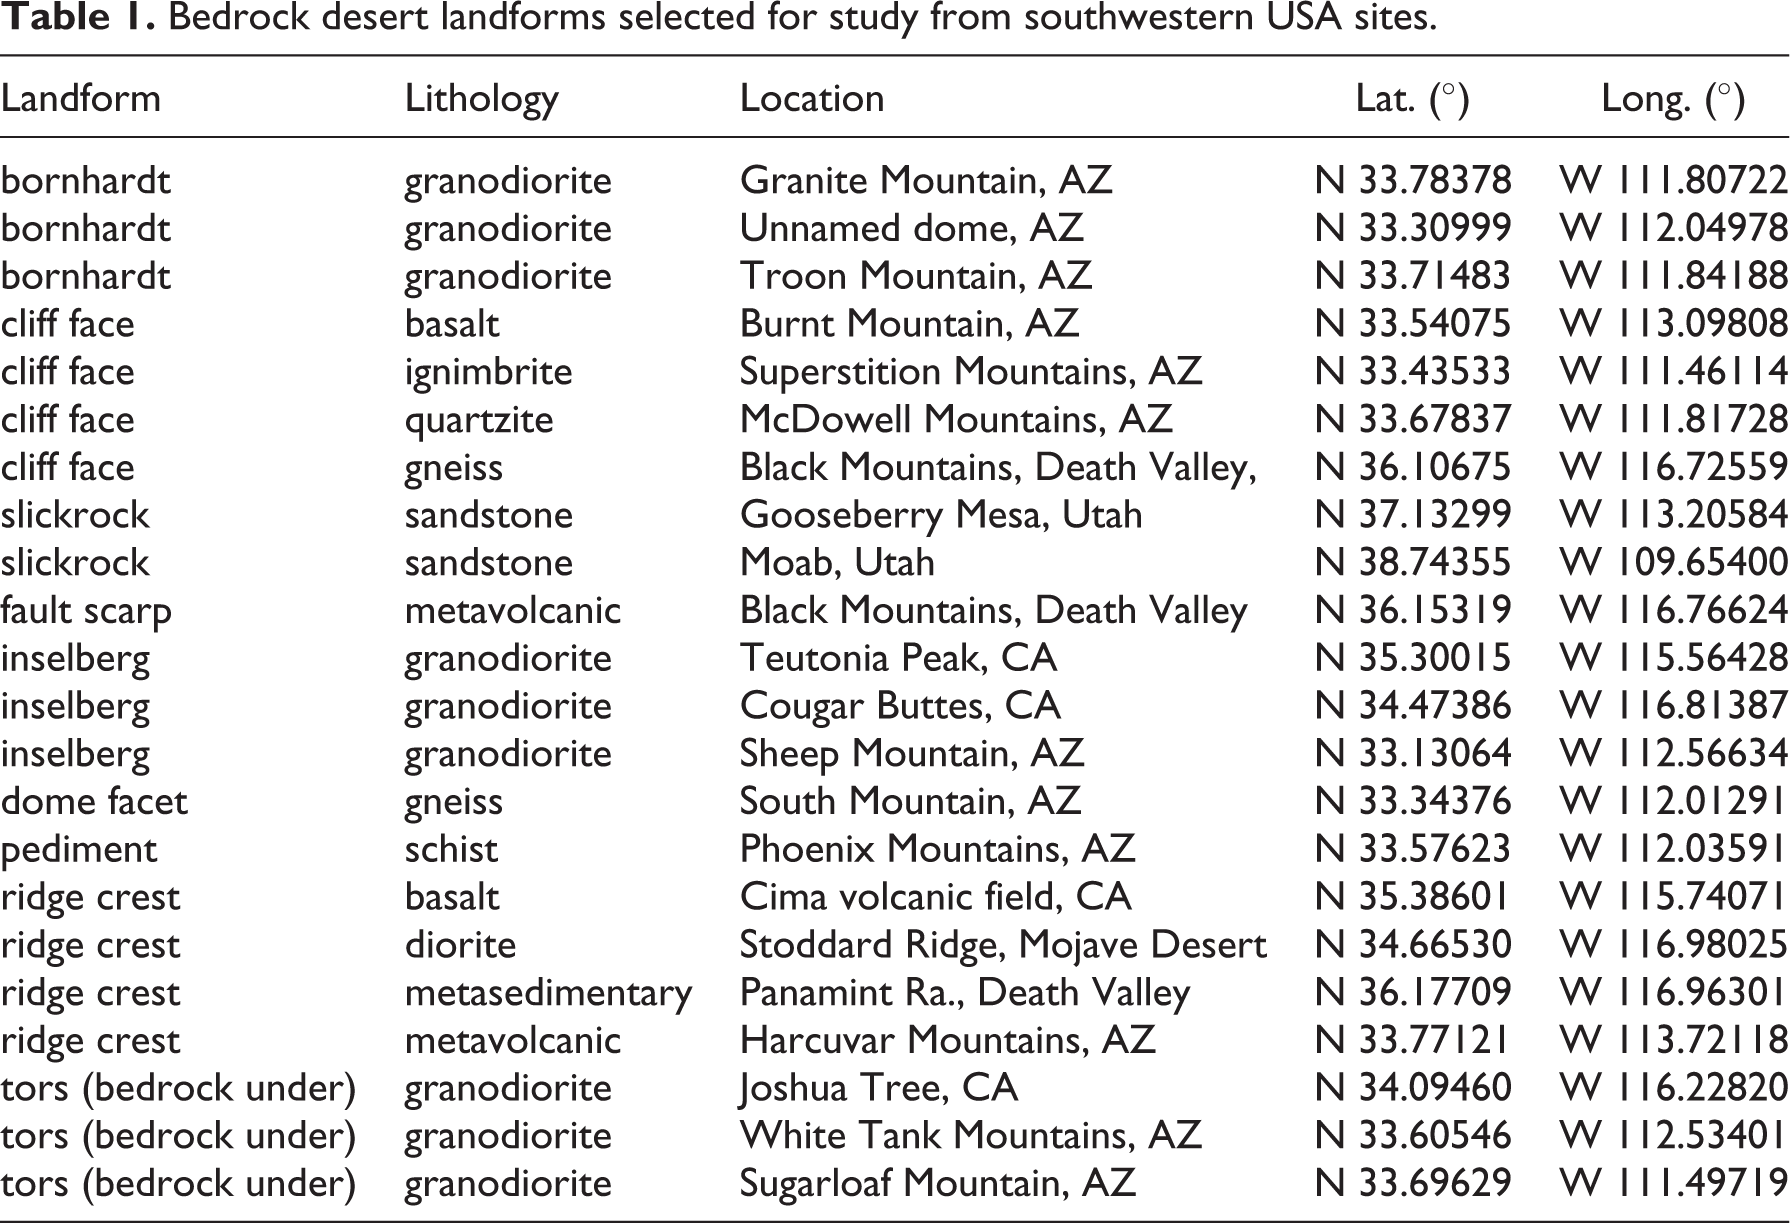
Twenty-two different bedrock landforms were selected for study in the southwestern USA. The landforms were not selected randomly. Instead, they were chosen because they exemplify the following classic desert bedrock landforms: bornhardts (Selby, 1982; Twidale and Bourne, 1978); cliff faces (Cooke et al., 1993; Howard and Selby, 2009); slickrock (Howard and Selby, 2009; Oberlander, 1977); fault scarp (Blackwelder, 1954; Sharp, 1982); inselberg backing a granitic pediment (Oberlander, 1989; Parsons and Abrahams, 1984; Twidale, 1981); non-granitic schist pediment (Mabbutt, 1966; Mabbutt, 1977); dome facets of a metamorphic core complex (Pain, 1985; Spencer, 2000); ridge crests (Gilbert, 1909; Mabbutt, 1977); and bedrock underneath tors (Cooke et al., 1993; Strudley et al., 2006). Table 1 presents the location, rock type, and landform type of the study sites. Figure 2 illustrates four of these locations.
Bedrock desert landforms selected for study from southwestern USA sites.

Examples of southwestern USA bedrock landforms selected for study: (a) Teutonia Peak (Davis, 1905), a granitic inselberg in the Mojave Desert; (b) Gooseberry Mesa, a sandstone mesa with abundant slickrock; (c) an ignimbrite cliff face in the Superstition Mountains, Arizona; and (d) Granite Mountain, a bornhardt in the Sonoran Desert. Push pins identify the centre of the sampling areas. The image follows permission guidelines for Google Earth (http://www.google.com/permissions/geoguidelines.html) and the scale bars generated by Google Earth are only approximate for that area of the oblique image.
IV Methods
4.1 Overview
This paper’s purpose rests in obtaining an estimate for life expectancy of the entire surface of a desert bedrock landform. Accomplishing this goal requires five steps, the first being the selection of landforms for the study. The second step generates an estimate of the percent of a bedrock surface that can be currently identified as being spalled by dirt cracking. In this case, digital image processing employed here generates a minimum value. The third step measures the VML age of rock varnish formed on top of dirt cracked surfaces and uses the oldest measured VML age in step four. Step four divides the minimum percent of the surface exposed by dirt cracking by the time it takes to cover the dirt cracking (using the oldest VML age measured). This generates a minimum rate of mortality (percent of a surface spalled) per thousand calendar years (ka). The reason for using the oldest VML age is to maintain the validity of interpreting this metric as a minimum rate of surface mortality from dirt cracking. Fifth, using the minimum rate of surface mortality from dirt cracking, it is possible to estimate the maximum time needed to resurface a bedrock landform by dirt cracking using a calculation: 100% of the bedrock surface divided by the rate of surface mortality (%/ka). Because the rate of surface mortality is a minimum, the output would necessarily be the maximum time for resurfacing a bedrock landform from the dirt cracking process.
4.2 Estimating the percent of a surface that can be identified as being ‘killed’ by dirt cracking
Study sites were not chosen randomly, but rather targeted select classic desert bedrock landforms. In contrast, the particular areas of a desert bedrock landform surface selected for detailed study were chosen through a random process. A sampling grid of nine even-area cells was laid out over each landform and a cell selected through a random number generator. The centre point of that cell served as the starting point for collection of data.
The method to estimate the identifiable percent of the bedrock surface exposed by dirt cracking began at the centre point of the randomly selected grid cell. This center point served as the starting point for parallel transects. For each transect, two measuring tapes were placed approximately 1.5 m apart. Digital images, approximately 1.5 × 1.5 m with a 600 DPI resolution, were collected every 3 m in the area between the two tapes.
Four parallel transects radiated out in cardinal directions from the centre of the randomly-selected grid cell provide an n of 40 1.5 × 1.5 m photographic frames for each transect, or 120 analysed for each landform, using digital image processing with the aid of Adobe PhotoshopTM and NIH image software (NIH, 2010). A photographic pole was employed to ensure that one image captured the entire 2.25 m2.
Since the dirt cracking process can be identified by areas of orange iron film ringed by a thin dark line of black varnish (Figures 1 and 3), these areas were turned into polygons manually for each 2.25 m2 frame using a Photoshop layer. The layer with polygons was then saved as a raster file. Transect tape scales established the area of each pixel. The area showing evidence of dirt cracking in the raster (TIFF) file was then processed with NIH image (NIH, 2010), yielding the number of pixels of surfaces spalled by dirt cracking. These data were then converted into a percentage of the rock surface exposed by dirt cracking.
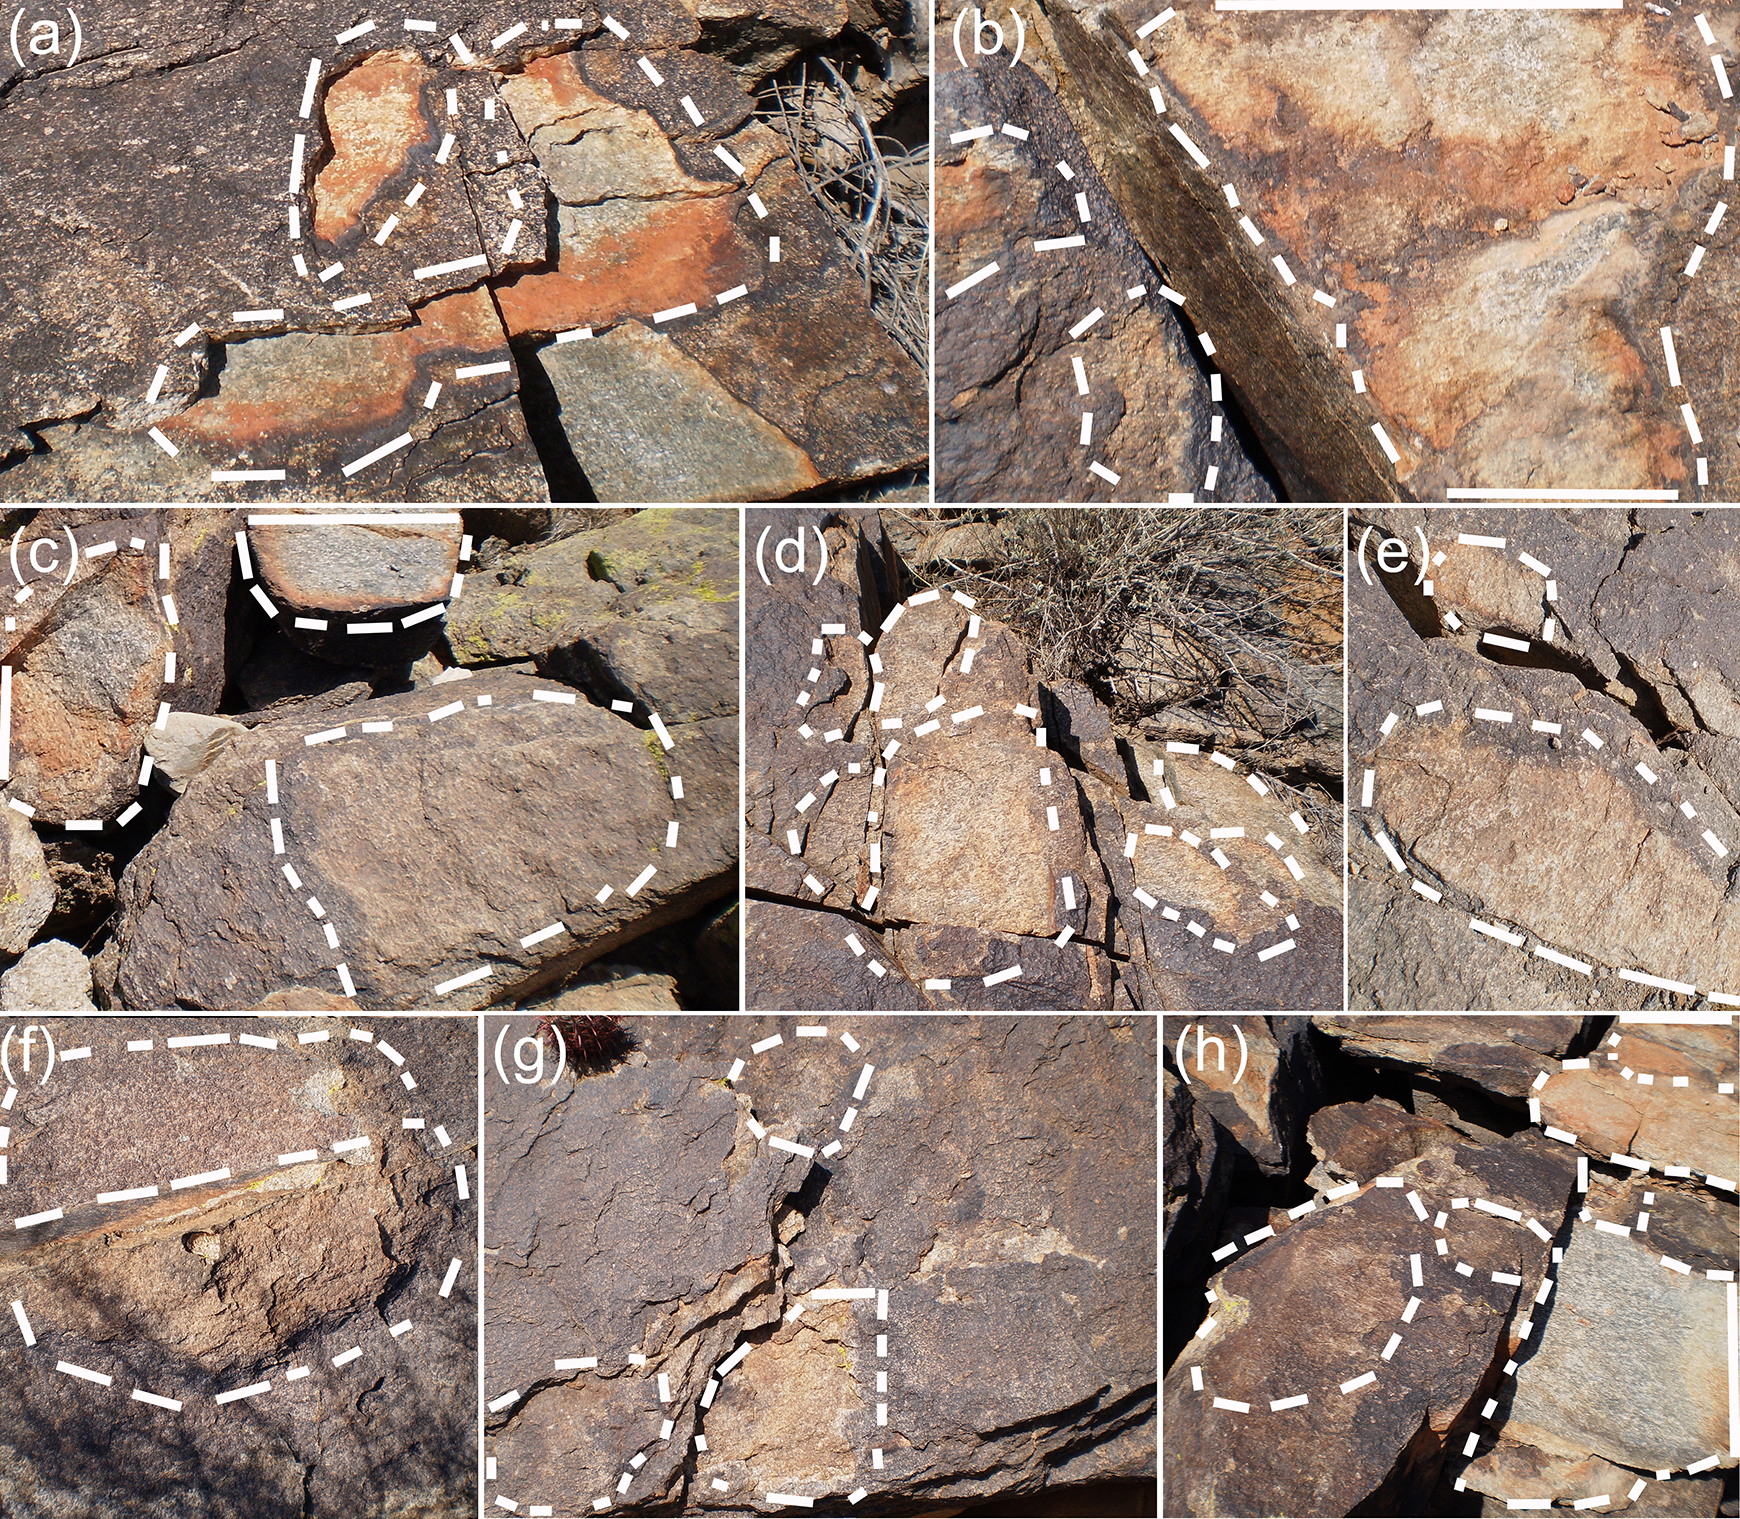
Examples of bedrock surfaces that can be identified as being exposed by dirt cracking, as evidenced by the pattern of rock coatings of orange films, black strips of rock varnish, and whitish laminar calcrete. White dashes and dots encircle the locations where the bedrock surface experienced mortality from spalling due to dirt cracking. These examples come from the South Mountain, Arizona, a metamorphic core complex dome facet landform. Each frame has a height of about 1 m. The lower-right spall in image (c) is where the sample in Figure 4(a) was collected.
A surface exposed by dirt cracking can only be identified before subaerial rock varnish accumulates to the point where it completely covers the dirt-cracking pattern. The compiled data are, thus, inherently minimum surface areas spalled by dirt cracking. Data are summarised as minimum average percent and minimum median of a bedrock surface exposed by dirt cracking.
4.3 Estimating time since dirt cracking
Ten samples were collected for VML dating from some of the 120 grid cells used for the digital image processing. Because sampling had to be at the locations where dirt cracking occurred, the distinctive visual pattern of orange and black rock coatings must be clearly noticeable (e.g. Figures 1 and 3). However, the objective was to determine the oldest identifiable dirt cracking events. As newer rock varnish accretes on top of the orange iron film, the appearance darkens. There comes a point at which it is not possible to know if dirt cracking exposed the surface. For example, there are many locations in Figure 3 where dirt cracking may have taken place, but the visual evidence is too speculative.
The strategy in sampling for VML dating was to collect only from locations where dirt cracking could only be barely, but clearly, recognised by the naked eye. The selection criteria also involved an understanding of sampling site microenvironment, potential water collection patterns, rock type, surface appearance, and aspect to try to select the slowest-accumulating varnish, since visual darkening of a surface alone is not a reliable age signal (Dorn, 2009; Dorn and Krinsley, 2011; Krinsley et al., 1990).
The VML dating method is based on the Holocene VML calibration (Liu and Broecker, 2007) and the late Pleistocene calibration (Liu, 2003, 2018). The process of VML dating employed here starts by preparing ultrathin sections, by polishing two sides of a sample until the varnish is thin enough to identify VML patterns, that are then compared with the latest calibrations established for the western USA (Liu, 2018). While this correlative method does not assign specific ages, varnish sequences can be placed in age ranges, where precision depends on the time intervals between calibrated VMLs. Since VML is calibrated to calendar years before present, ages are presented in thousands of calendar years before present (ka). Although 10 locations were sampled, processing stopped after six VML ages were obtained. The limit of six ages was based on number of samples feasibly processed for this study. The reason for collecting more samples than six is because microenvironmental factors, such as microcolonial fungi, can destroy VML sequences.
After the ultrathin sections were prepared, it became possible to obtain confirmation that the dirt cracking process spalled the surface. A relatively thick layer of orange iron film, sometimes on top of laminar calcrete, formed the base of most VML sequences (Figure 4). The VML age, therefore, is based on the VMLs that accreted on top of the orange iron film because the orange iron film originated inside the rock fissure, while the VML pattern develops in a subaerial environment.
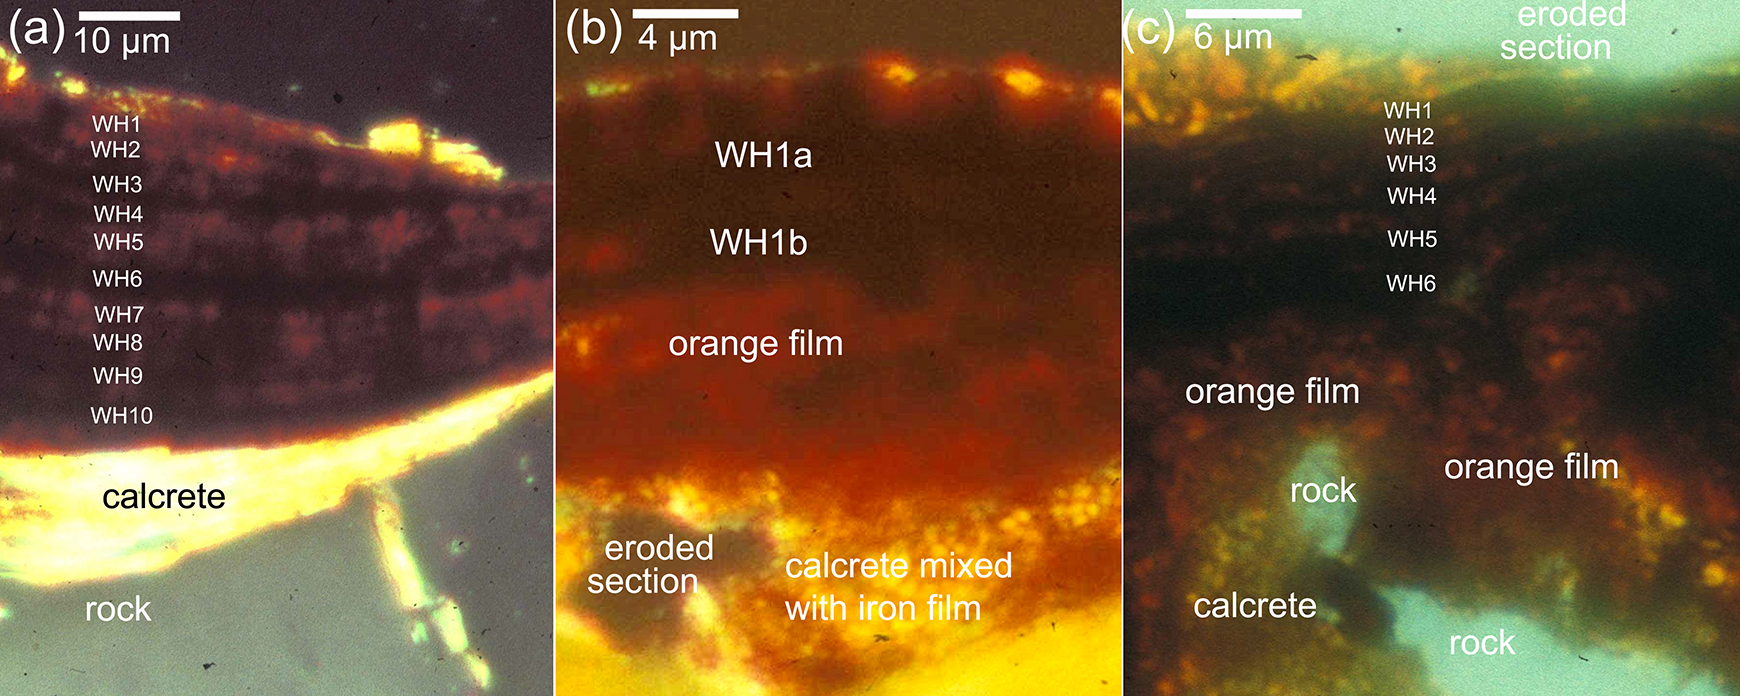
Ultrathin sections of rock varnish formed on top of coatings developed on the walls of fissures opened by the dirt-cracking process. The VML patterns are identified by Wet Holocene layers (WH1 through WH10) designations, following Liu and Broecker’s (2007) calibration. Eroded sections indicate locations where the thinning process completely destroyed the coating material. (a) 9.4 ka varnish formed on a metamorphic core complex dome facet, South Mountain, Arizona; in this case, rock varnish formed on top of the laminar calcrete; (b) 0.65 ka varnish formed on slick rock, Gooseberry Mesa, Utah; the Little Ice Age (WH1) unit is sometimes broken into subunits designed by a letter (e.g. WH1a, WH1b); note how the calcrete mixes with iron film at the base of the sequence; (c) 5.9 ka varnish formed on a fault scarp of Black Mountains, Death Valley, California; note how the calcrete is not present (right side of image c) and sometimes calcrete occurs under the orange film (left side of image c).
The VML ages for rock varnishes formed on top of exposed dirt-cracking coatings are minimum ages because there is always an orange layer at the bottom of the sequence that comes from the iron film that formed inside the fissure. In other words, because the VML sequences are identified by black VML layers, the length of time it takes to completely revarnish over an exposed coating means that it could be slightly older than the age of the black VML layer, but younger than the next oldest black VML layer. Thus, all VML ages are minimums.
4.4 Minimum rate of mortality and the maximum time needed to resurface a bedrock landform
A minimum rate for bedrock surface mortality can be calculated using the oldest VML age (ka) and the minimum percent of a surface that can be identified as having been spalled due to dirt cracking (D p, or percent of surface that died), or D p/ka. One hundred percent of the bedrock surface (S 100) divided by D p/ka yields a unit of thousands of calendar years:
There are two obvious errors to this approach. First, dirt cracking certainly spalls more bedrock surfaces than the measured values because the photographic approach to identify dirt cracking does not measure locales where varnish thickens to the point where the dirt-cracking colouration can no longer be seen. A second inherent error to this approach is the sampling protocol likely did not collect the very oldest VML sequences formed on top of a dirt-cracked surface.
Errors could be reduced in future studies by preparing more ultrathin sections from each landform. More thin sections could aid in the identification cof hard-to-see dirt cracking areas, since dirt-cracking coatings can be seen under the rock varnish (e.g. Figure 4). Similarly, more thin sections can identify older VML sequences. The trade-off made in carrying out this research rested in the extensive time commitment involved in the preparation of ultra-thin sections.
V Results
5.1 How much of a desert bedrock surface does dirt cracking spall?
Considerable variability exists in the percentage of bedrock desert landform surfaces spalled by dirt cracking, ranging from >4% to >22% (Table 2). It is important to stress that the averages and median values reported in Table 2 are minimums because the photographic method used here does not measure dirt-cracked surfaces that can no longer be visually seen. Still, the measurements made at over 2600 2.25 m2 sampling areas reveal that dirt cracking is a quantitatively significant rock morbidity (mechanical weathering) process for the studied bedrock desert landforms.
Life expectancy of desert bedrock landforms in thousands of calendar years and data needed to calculate this necrogeographic metric.
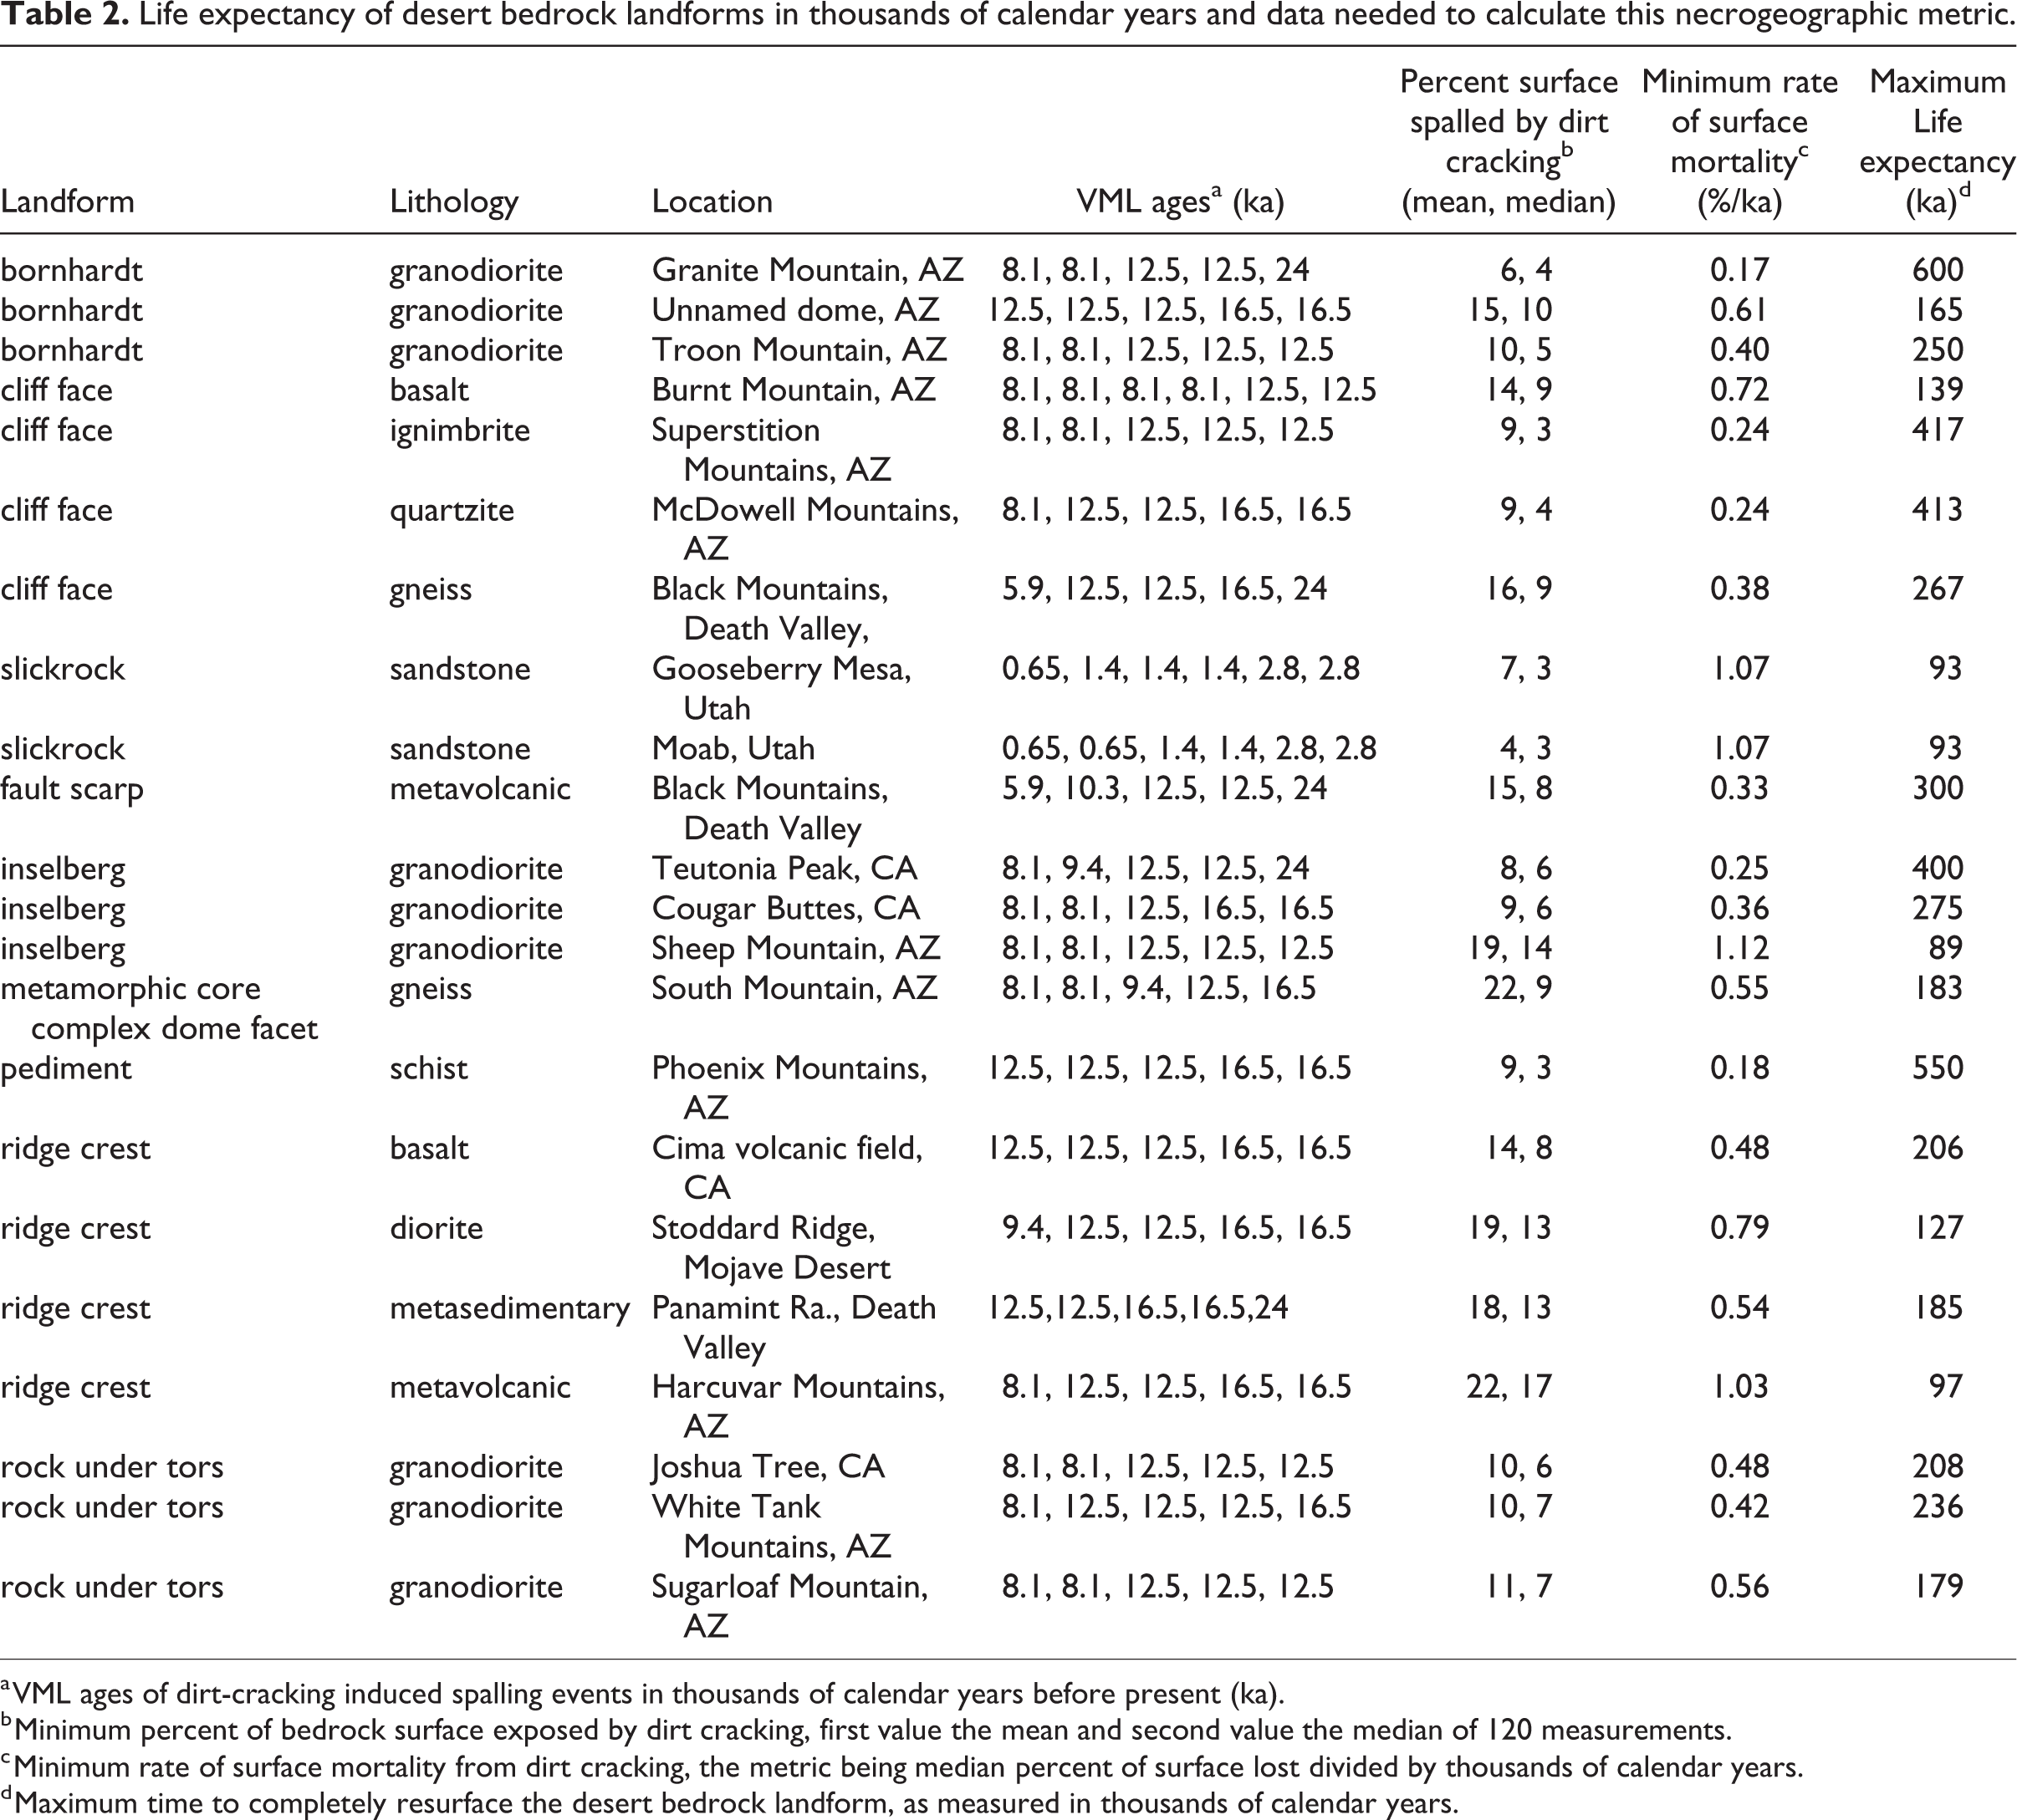
a VML ages of dirt-cracking induced spalling events in thousands of calendar years before present (ka).
b Minimum percent of bedrock surface exposed by dirt cracking, first value the mean and second value the median of 120 measurements.
c Minimum rate of surface mortality from dirt cracking, the metric being median percent of surface lost divided by thousands of calendar years.
d Maximum time to completely resurface the desert bedrock landform, as measured in thousands of calendar years.
No clear pattern exists with regards to rock type or landform (Table 2). Sandstone slickrock, granodiorite bornhardts and inselbergs, cliff faces of quartzite and ignimbrite, and schist pediments exhibit the lowest measurements of average areas <10% that have been spalled by dirt cracking. Ridge crests composed of diorite and metamorphic rocks, along with the dome face of a metamorphic core complex, display areas of surface mortality averaging 18–22%.
5.2 What ages are typical for dirt cracking not to be apparent?
The VML ages presented in Table 2 are interpreted as the oldest known locations where the visual signature of dirt cracking (e.g. Figures 1 and 3) can barely be identified. For the sandstone slickrock locations, dirt cracking became indistinct because the granular disintegration of the sandstone surface removed the dirt-cracking coating and overlying rock varnish. This took <2800 calendar years for the two slickrock sites.
For the rest of the sampling lithologies in Table 2, the difficulty in identification arose because subaerial black rock varnish effectively ‘painted over’ the dirt-cracking signal. This covering-up signal was almost complete in a timeframe of 5900–16,500 calendar years. It is important to not interpret these ages as the time it takes to completely varnish a surface because the dirt-cracking process already completely coated the rock face, effectively greatly accelerating the process of varnishing a surface.
5.3 What is the life expectancy of a desert bedrock landform?
The minimum rate of surface mortality for the sampled desert landforms ranges from 0.17 to 1.12 D
p/ka, with an average ± standard deviation of 0.55 ± 0.30 (Table 2). Minimum surface spalling rates of 1.03–1.12 D
p/ka are fastest for sandstone slickrock, a granodiorite inselberg, and a metavolcanic ridge crest. Minimum surface spalling rates of 0.17–0.24 D
p/ka are slowest for a granodiorite inselberg, a schist pediment, and cliff faces composed of ignimbrite and quartzite. The maximum life expectancy of the studied desert bedrock landforms spalled by the dirt-cracking process, thus, ranges from 89 to 600 ka (Table 2
VI Discussion
6.1 Scale issues
The number and range of field and laboratory-based methods available to study rock morbidity (weathering) expanded tremendously in just the past two decades (Dorn, 1995b; Moses et al., 2014). The proposed approach used here, of VML formed on top of surfaces created by dirt cracking, adds yet another strategy to measure the impact of rock morbidity. This approach falls under Moses et al.'s (2014) category of a microscope technique combined with field observations.
Four general sorts of scale issues confound research into rock morbidity (Viles, 2013) and potentially impact this project’s attempt to extrapolate microscope and field observations to entire desert bedrock landforms: (i) rock morbidity occurs over a wide range of timescales; (ii) rock morbidity rates change over time; (iii) rock morbidity varies across spatial scales; and (iv) rock morbidity rates and processes are patchy across space.
Viles’s (2013) first concern, regarding a wide range of timescales, is an issue in this research. The VML technique used to measure the mortality of a landform surface resulting from dirt cracking is applied here for just the last glacial-interglacial cycle. This is the time range that dirt cracking can be detected visually before it is covered over or before the surface again erodes away.
The second concern, that rock morbidity rates change over time (Brady et al., 1999; Viles, 2001, 2013), certainly impacts the findings of this research. Table 2 presents rates of percent of a surface spalled per thousand years (D p/ka), but only over the time period of the last 25 ka. However, D p/ka is used in Table 2 to calculate the longevity of an entire landform over timescales of 105 years. While a case could be made that the period of observation in the last 25 ka encompasses both interglacial and glacial worlds, dirt cracking should be more active during arid times in the Pleistocene that would enhance dust abundance (Dorn, 2011). Because the Pleistocene has many glacial intervals, it is certainly possible that slower rates of dirt cracking occurred during the wetter southwestern USA glacial periods (McAuliffe and van Devender, 1998; Wells, 1983).
Viles’s (2013) third concern of dirt cracking varying across spatial scales is certainly possible. The dirt-cracking process results in the spalling of a rock surface on the scale of a few centimeters to about a meter. The visual method employed here, analysing 120 2.25 m2 areas for each landform, however, does not necessarily measure the full range of spatial scales of the erosional impact of dirt cracking. Previously, Dorn (2011: 140) showed an example of a rock face exposed by dirt cracking >1 m in dimension; and the author has seen cases where dirt cracking split rock joints >5 m across. Thus, Viles's (2013) concern over varying across spatial scales is relevant and could be addressed in a follow-up study using a different method to study different spatial scales.
Viles’s (2013) fourth concern is that dirt cracking rates and processes are patchy across space. Certainly, the spatial variability of dirt cracking is evident among the different southwestern USA landforms studied here (Table 2); and also occurs over a single landform and within the scale of 1 m2 (Figure 3). The hope is that the visual method of analysing 120 areas across a single landform study site captures this spatial patchiness. But data gathered over much larger areas would be required to more fully assess this concern.
A fundamental scale concern is that this research attempts to use small-area studies (120 2.25 m2 squares) to analyse the erosional impact of dirt cracking on an entire desert bedrock landform. Others have cautioned against upscaling (Smith et al., 2002; Viles, 2001) that requires clear linkages between the scale where the process operates and the landform scale (Turkington et al., 2005). For this study, the linkage depends upon an assumption that 120 sampling grids reflect the impact of dirt cracking for the entire bedrock landform—a linkage that could be tested further through more extensively sampling.
6.2 Rate of varnishing vs time to cover up dirt cracking
How long does it take rock varnish to form? This topic has dozens of unsupported estimates in the literature, ranging from a few thousand years (Bull, 1984) to tens of thousands of years (Bull, 1991). Using objective data in warm deserts, the vertical rate of varnish accumulation is in the order of micrometers per thousand years (Dorn, 1998; Liu and Broecker, 2000). In more mesic microenvironments, even in a desert, rates can accelerate to micrometers per century (Spilde et al., 2013), with varnishing in humid settings reaching micrometers per decade (Krinsley et al., 2017). All of these studies, however, focus on varnish that ‘started from scratch’ on a bedrock surface and not on a pre-existing rock coating.
Thus, the research carried out here is not relevant to the question of varnish formation starting on a fresh rock surface. This is because the rock varnish analysed in this study grew on top of a surface already coated (Figure 3), most extensively by orange iron film that is a mixture of clays and iron oxyhydroxides (Dorn, 2011). Thus, knowing that rock varnish completely coats a rock fracture opened by dirt cracking in a range of 8000 to 16,000 calendar years should give pause to those trying to interpret ages from the visual appearance of varnish. Seeing a ‘well-developed’ varnish that completely coats a surface might not provide any useful insight into, for example, the age of a desert pavement or age of an alluvial-fan deposit—if the investigator fails to consider the possibility that the observed varnish formed on a surface spalled by dirt cracking.
There is a larger caution for those studying rock (or desert) varnish. Some carrying out varnish research purposely sample the best-looking varnishes (i.e., the darkest, the highest percentage of varnish coating the rock) in their research (Harrington and Whitney, 1987; Reneau et al., 1992; Whitney and Harrington, 1993). In my experience, the best-looking varnishes typically start from a surface exposed by dirt cracking. The reason is that the orange iron film acts as a primer. Individuals studying rock varnish, thus, should first evaluate the dirt-cracking process and make sure that the sampling strategy corresponds with the research question. For example, if the research question involves trying to estimate the age of an alluvial-fan surface or a fossil beach ridge of a paleolake, then only surfaces rounded and abraded by transport should be sampled.
6.3 Life expectancy of a desert bedrock landform surface and measuring GK Gilbert’s weathering-limited ‘rate of disintegration’
The life expectancies presented in Table 2 are maximum-limiting estimates for desert bedrock surfaces for two main reasons. First, the measured percent area of dirt-cracked surfaces misses areas completely covered over by accreting rock varnish. Second, dirt cracking is not the only process that spalls surfaces. An abundance of other rock morbidity processes operate on desert landforms (Brandmeier et al., 2011; Dorn et al., 2013; Gadd, 2017; Smith, 2009; Sumner et al., 2009; Viles, 2013; Warke, 2007), but life expectancies in Table 2 reflect only the process of dirt cracking.
An important related issue is GK Gilbert’s notion of a ‘weathering-limited’ landscape (Gilbert, 1877) and how it relates to the life expectancy of a desert landform surface. Weathering-limited is different from a detachment-limited condition (Ahnert, 1976). Gilbert (1877: 105) explained that ‘in regions of small rainfall, surface degradation is usually limited by the slow rate of disintegration; while in regions of great rainfall, it is limited by the rate of transportation’.
Rather than obtaining measurements of Gilbert’s (1877: 105) ‘rate of disintegration’, geomorphologists have tended towards measuring ‘detachment-limited’ systems (Howard, 1994). Howard (1994: 2261–2262) argued that the rate of transport of weathered materials is ‘limited by the ability of the flow to entrain or erode regolith (residual soils or colluvium) or bedrock, giving “detachment-limited conditions’”. Thus, detachment-limited systems can be analysed through sediment transport measurements over short timescales (Howard, 1994), while cosmogenic nuclides measure bedrock detachment rates over longer time spans (Cockburn and Summerfield, 2004).
The life expectancy metric in Table 2 is a measure of Gilbert’s (1877: 105) ‘rate of disintegration’ because the maximum-life expectancies of desert bedrock landforms in Table 2 directly links to spalling resulting from the disintegration process of dirt cracking. In other words, the results in Table 2 provide direct support for Gilbert’s (1877: 105) assertion of slow rates of ‘disintegration’ in warm deserts.
Given the lack of previous measurements of surface disintegration in weathering-limited landscapes, an important question is whether the maximum life expectancies in Table 2 make geomorphic sense. Certainly, the ongoing granular disintegration and millimeter-scale flaking that occurs on sandstone slickrock (Figures 2(b) and 5) explains why the VML ages on top of dirt cracking are not >2800 calendar years and, hence, the maximum life expectancy for the complete resurfacing of a slickrock is <93 ka (Table 2). It also makes sense that granitic inselbergs (<89–400 ka) (Figure 2(a)), granitic bornhardts (<165–600 ka) (Figure 2(b)), and bedrock underneath granitic tors (<179–236 ka) would have a wide range of life expectancies simply because the rock morbidity (weathering condition) of granitic materials varies tremendously from place to place. Similarly, it would also make intuitive sense that ridge crests in different rock types of basalt, diorite, metasedimentary, and metavolcanic rocks would vary in their longevity from <97 to <206 ka. But, what could be surprising to some is the lengthy longevity of ignimbrite (Figure 2(c)) and quartzite cliff faces at <413–417 ka and an active fault scarp in Death Valley, California at <300 ka.
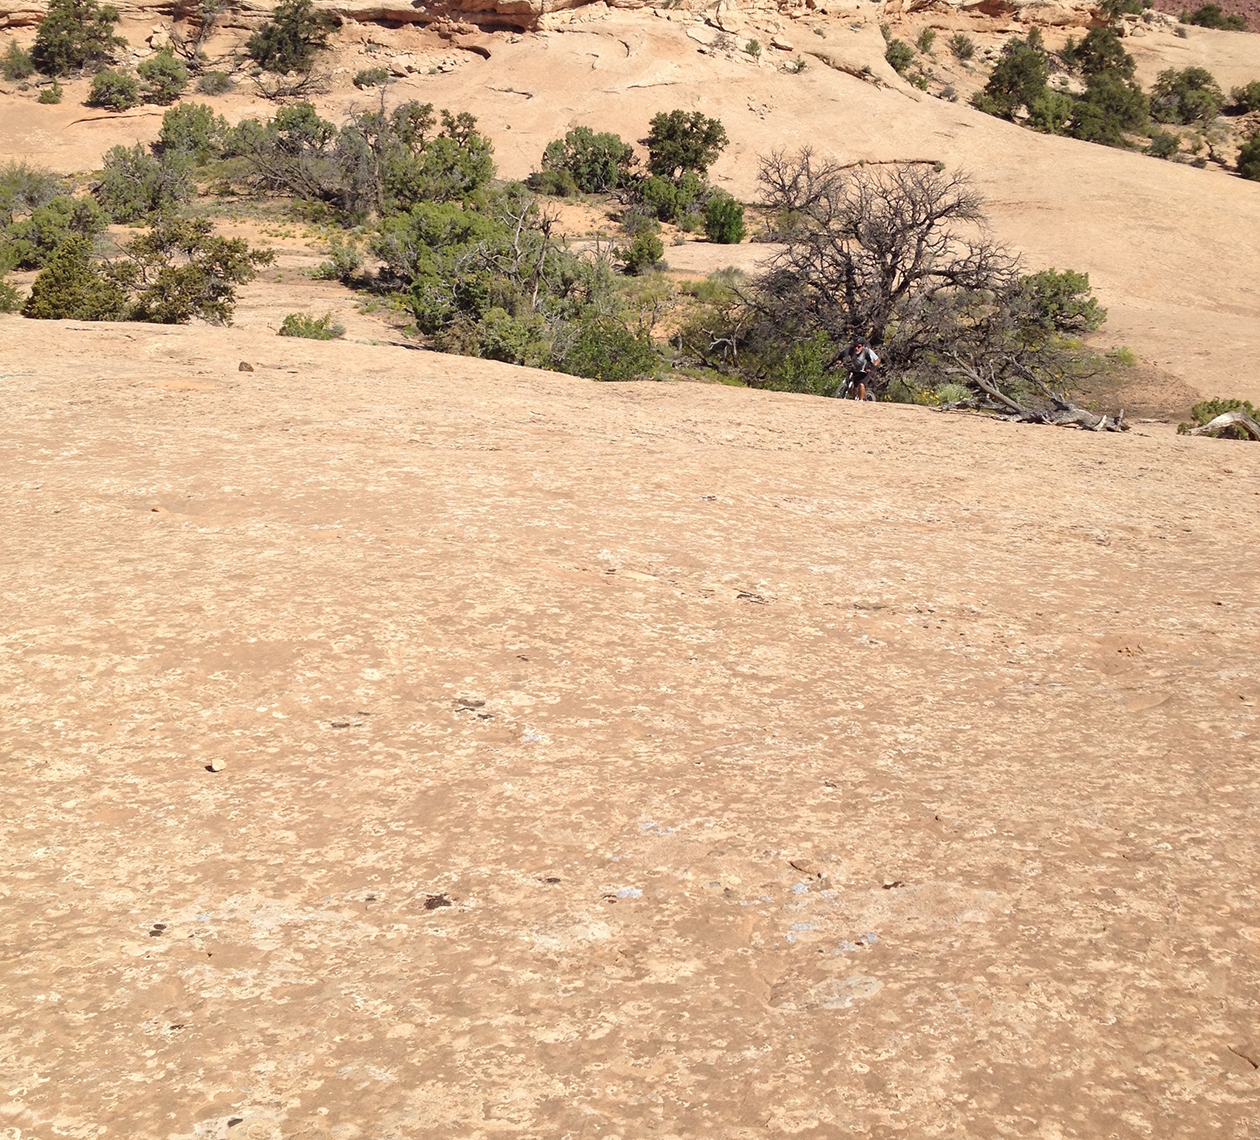
The Moab slickrock site exhibits the youngest VML ages for dirt-cracking surfaces (Table 2). The area of dirt cracking has medians of 3% for the two slickrock landforms. In contrast to the other landforms studied, surface death (spalling) due to processes other than dirt cracking (e.g. granular disintegration and millimeter-flaking of the sandstone) appears to be far more dominant than dirt cracking. Juniper trees 4 m tall provide a sense of scale for the background. The foreground is 7 m across.
6.4 Life expectancy of landforms and landscapes
The meaning of a palaeosurface, ancient landform, or ancient landscape varies considerably among different geomorphic researchers (Widdowson, 1997). Closed-system conceptual models of landform evolution (Davis, 1899, 1902, 1905; Penck, 1924) erode landscapes to low-relief ‘old age’ or endrumpf surfaces that represent the final stage of erosion—or a landscape close to death.
In more modern thought, ancient landscapes tend to infer an exposed land surface that is undergoing slow erosion (Carignano et al., 1999; Stewart et al., 1986; Twidale, 1998). Others use such techniques as cosmogenic nuclides (Belton et al., 2004), apatite (U-Th)/He, and fission track data (Danišík et al., 2012) to conclude that kilometer-scale exhumation of formerly buried landscapes explains the appearance of ‘seemingly’ ancient landscapes. Concomitantly, some point to the preservation of elements of nonglacial surfaces in landscapes that were glaciated (Goodfellow, 2007; Rea and Gemmell, 2009) as evidence for the preservation of ancient landscapes.
Consider relatively flat mountain summits that have long been interpreted as preserved erosion surfaces (Epis and Chapin, 1975; Jolivet et al., 2007). Support for this interpretation comes from the accumulation of cosmogenic nuclides, revealing that erosion rates of summit flats can be much less than adjacent basin-wide erosion rates (Small et al., 1997). Thus, while summit flat surface are still eroding, the form of a low-relief mountain summit can persist. In Bulgaria, for example, relatively slow rates of erosion produced summit erosion surfaces over a timescale of the last 45 million years (Gunnell et al., 2017).
Wide flat-top mesas in the hyperarid Negev Desert also exhibit the characteristic much lower erosion rates of the mesa itself (about 1 mm/ka) than the cliffs on the side (Boroda et al., 2014). This leads to a condition where desert pavement cobbles on top of the mesa can have exposure ages over a million years. Thus, even though change occurs slowly on top of wide mesas, the basic form remains for, potentially, millions of years.
Cosmogenic nuclide exposure dating reveals that ‘fossil’ landscape surfaces do exist. Some surfaces in the Atacama Desert have changed little since about 9 Ma in the Miocene (Nishiizumi et al., 2005). Desert pavements in the Atacama and Negev Deserts can reach ages of millions of years, while pavements in North America tend to survive for only hundreds of thousands of years (Seong et al., 2016a). Evidence that an erosion surface can survive for 1.4 Ma can also come from methods such as electron spin resonance (Pan et al., 2007). Thus, direct dating reveals the longevity of certain landforms, even if these landforms appear to have been slowly modified since their formation.
The aforementioned geomorphologists who identified ancient landforms and landscapes, all accept a certain amount of ongoing surface modification. The amount of surface loss is sometimes <1 m, sometimes <20 m, but a loss of even 100 m is acceptable to some (Small et al., 1997; Vernon et al., 2005).
Heretofore, however, prior research on landform antiquity has not yet taken an extremely strict interpretation focusing on the very surface of a landform. I argue here that the concept of resurfacing the entire surface of a bedrock landform has utility in identifying an end member in the interpretation of landform antiquity. The intent here is not to ignite a debate on ‘How much erosion it takes to truly kill a landform?’, but to note that it is possible to study processes and rates of the modification of the very surface of a landform. Thus, nil now exists on the number line of studies analysing ancient landscapes because even the loss of a millimeter results in the birth of a new landform surface.
VII Conclusion
GK Gilbert’s (1877: 105) notion of a ‘weathering-limited’ landscape assumes that the loss of a bedrock surface is limited by ‘the slow rate of disintegration’ of rock in warm deserts. This research provides direct support for Gilbert’s assumption by measuring the maximum life expectancy of the very surface of different classic desert bedrock landforms, such as bornhardts, cliff faces, inselbergs, and pediments. The time that it takes to spall the entire surface (defined as the upper millimeter) of studied desert landforms ranges from <89 to <600 ka.
Of the studied bedrock landforms, slickrock is the least stable, whereas a granitic bornhardt and a schist pediment retain their outer surface the longest. Thirteen of the 22 sites had maximum life expectancies between <100 and <300 ka and these included a range of rock types, including basalt, gneiss, granitic, and metasedimentary, comprising a variety of landforms, including bornhardt, cliff face, fault scarp, inselberg, metamorphic core complex dome facet, ridge crest, and bedrock under tors.
The key to this research is the dirt-cracking process (Dorn, 2011; Ollier, 1965), whereby the laminar calcrete and dust that accumulates in rock fissures exerts sufficient pressure to widen fissures to the point of surface spalling. The unique aspect of this rock-morbidity process is that it leaves behind a visual and geochemical signature that the dirt-cracking process opened a fissure.
An image processing technique measured the area of dirt-cracked locations. VML dating then provided calibrated ages (Liu, 2018; Liu and Broecker, 2007, 2013) for rock varnish that accumulated in a subaerial environment on top of dirt-cracking coatings. Thus, a minimum rate of surface spalling, or D p/ka, is calculated from the minimum percent of a surface that can be identified as having been spalled by the dirt-cracking process (D p) and VML age in thousands of calendar years before present (ka). Rates of surface spalling, or D p/ka, range from 0.17 to 1.12, with an average ± standard deviation of 0.55 ± 0.30.
A rate of mortality for the entire surface of a bedrock landform can be calculated by dividing 100% of the surface by D p/ka. This is just a rough maximum estimate for surface longevity, however, because more processes than dirt cracking contribute to the loss of a surface. Also, the measurement of dirt-cracked areas is inherently a minimum value; this is because dirt cracking can no longer be seen after it has been completely covered by subaerial rock varnish.
Abundant limitations exist in these findings. There are methodological limitations associated with measuring less than the full area exposed by dirt cracking and the inability to assign rates of surface loss (D p) to other rock morbidity processes. Viles's (2013) concerns apply to this study: scales where dirt cracking occurs range from mm2 to m2 areas; VML ages for the last glacial-interglacial cycle are applied to a timescale of hundreds of thousands of years; 120 2.25 m2 sampling areas may or may not truly represent the area of dirt cracking over an entire bedrock landform; and dirt cracking is a patchy process on different types of landforms, where slickrock, for example, is far less affected than ridge crests. Even with these limitations, however, it is apparent that the dirt-cracking process is quantitatively significant in contributing to Gilbert’s (1887) ‘rock disintegration’ in warm deserts.
Footnotes
Acknowledgements
I thank two anonymous reviewers for their painstaking efforts to improve the paper. This research was supported, in part, by a sabbatical from Arizona State University and a Guggenheim Fellowship.
Declaration of conflicting interests
The author(s) declared no potential conflicts of interest with respect to the research, authorship, and/or publication of this article.
Funding
The author(s) received no financial support for the research, authorship, and/or publication of this article.