



Abstract
Support practices (SPs) influence the magnitude of soil loss and can be readily influenced by human interventions to mitigate soil loss. The SPs factor is expressed as the P-factor in the widely used soil erosion model – the universal soil loss equation (USLE) – and its revised version. Although the effects of SPs on soil erosion are well recognized, the quantification of the P-factor for soil loss modeling remains challenging. This limitation of the P-factor particularly restricts the applicability of USLE-based models at large scales. Here, we analyzed the P-factor values in USLE-based models from 196 published articles. The results were as follows: (a) an increasing trend in the number of studies has been observed in recent years, especially at large scales; (b) the P-factor values for paddy fields, orchards, and croplands were 0.16 ± 0.15, 0.47 ± 0.12, and 0.49 ± 0.21, respectively, and in terms of different types of SPs, the P-factor values for terracing, contouring, and strip-cropping were 0.28 ± 0.18, 0.52 ± 0.24, and 0.49 ± 0.28, respectively; (c) various methods have been developed for P-factor qualification, although the methods that consider SP conditions were most frequently used in studies with relatively smaller areas (< 100 km2), suggesting that USLE-based models are in need of improvement via the quantification of the P-factor, particularly with respect to the regional and global scale; and (d) further improvements of the P-factor for soil erosion modeling should concentrate on building P-factor datasets at the regional level according to data on the effectiveness of SPs on soil loss control based on field experiments in published articles, using advanced image processing techniques based on higher-resolution satellite imagery and developing proxy indicators for P-factors at large scales.
I Introduction
Water-driven soil erosion is the most widespread form of soil degradation worldwide (Garcia-Ruiz et al., 2017; Maetens et al., 2012), and this erosion has been a major threat to soil quality and productivity, sustainable agriculture, crop production, and carbon stocks across the globe since the beginning of agriculture (Li and Fang, 2016). Soil erosion assessments and mapping of erosion-prone areas serve as a scientific base for soil conservation and watershed management (Patil, 2018). Therefore, the need has arisen to quantify the soil erosion rates, as they are of paramount importance to stakeholders and decision-makers during conservation planning processes.
Various soil erosion assessment models have been developed (De Vente et al., 2013; Karydas et al., 2014; Li et al., 2017a); however, certain disadvantages, such as model complexity and the high demand for input data by most models, reduce the applicability of these models to the large scales (Vente and Poesen, 2005). The universal soil loss equation (USLE) (Wischmeier and Smith, 1978) and its revised version (RUSLE) (Renard et al., 1997) have been widely applied to assess soil erosion in the past and predict soil erosion in the future at different spatial scales (Borrelli et al., 2017b; Panagos et al. 2015b) due to their simple structure and empirical basis (Naipal et al., 2015). Among the factors in the USLE and RUSLE, the support practice (SP) factor (P-factor) is important because many SPs have significant effects on reducing soil erosion (Wei et al., 2016; Xiong et al., 2018). The P-factor is defined as the ratio of soil loss with a specific SP to the corresponding loss with upslope and downslope tillage (Renard et al., 1997; Wischmeier and Smith, 1978). The P-factor accounts for control practices (e.g. contouring, strip-cropping, and terracing) that affect erosion potential of runoff by modifying the flow pattern, grade, or direction of surface runoff and by reducing the velocity, amount, and rate of runoff on the soil surface (Renard et al., 1997; Wischmeier and Smith, 1978). The lower the P-factor value is, the better the practice is for controlling soil erosion (Panagos et al., 2015a). The P-factor constitutes the most uncertain factor in the model (Arnhold et al., 2014; Ligonja and Shrestha, 2015; Panagos et al., 2015a; Renard et al., 1997).
The extensive use of the USLE-based model on large basins has been reported by many researchers (Correa et al., 2016; Terranova et al., 2009; Xiao et al., 2015). Moreover, in recent years, there has been growing interest in the assessment of soil erosion (Zhuang et al., 2015), including the effects of soil erosion on ecosystem services (Guerra et al., 2014; Jiang et al., 2018; Peng et al., 2017) and biogeochemical cycles, such as the carbon cycle (Doetterl et al., 2012; Van Oost et al., 2007) at large scales, and even the global scale. However, there is substantial uncertainty in the estimation of large-scale soil erosion rates by USLE-based modeling (Borrelli et al., 2017b; Doetterl et al., 2012; Naipal et al., 2015). Although many studies have quantified P-factor values for different SPs (Panagos et al., 2015a; Renard et al., 1997; Shin, 1999; Vezina et al., 2006; Wischmeier and Smith, 1978), little information can be found in the literature about the applicability and appropriate use of P-factor (Arnhold et al., 2014), and a global reference is not available because erosion control is a local activity (Panagos et al., 2015a). Moreover, the method of quantifying the P-factor for soil erosion assessment has not been clarified. To address this issue, a thorough review of different methods of determining the P-factor is needed. Such a study should compare different methods and consider the characteristics of each method. The results of such a method comparison should be beneficial for users to help them choose an appropriate method, and it can also promote a better understanding of future needs.
This paper aimed to compare methods of determining the P-factor value for soil erosion modeling based on a survey of the literature. We selected studies that used USLE-based models and considered the P-factors, then we compared and discussed them in terms of P-factor values, P-factor quantification methods, data requirements, and study area size. We discuss the limitations of P-factor quantification and provide a better understanding of P-factors worldwide.
II Data collection and analysis
To compile P-factor information found within scientific journal articles, conference papers, and books, we reviewed the Institute for Scientific Information (ISI) Web of Science and Google Scholar databases using two keywords: USLE and RUSLE. We retrieved a total of 1516 articles published worldwide, and the number of publications has increased annually (Figure 1). At the country/territory level, studies applying the USLE/RUSLE model were conducted in 95 countries. In the productivity ranking of countries, the USA ranked first (219 studies), China ranked second (124 studies), and Italy ranked third (102 studies). However, many studies focused on the analysis of other input factors, such as the rainfall erosivity factor (Capolongo et al., 2008; Sanches Oliveira et al., 2013) and the slope length factor (Liu et al., 2011), or the theoretical basis and main principles of the model (Todisco et al., 2015), which did not provide information about the P-factor.
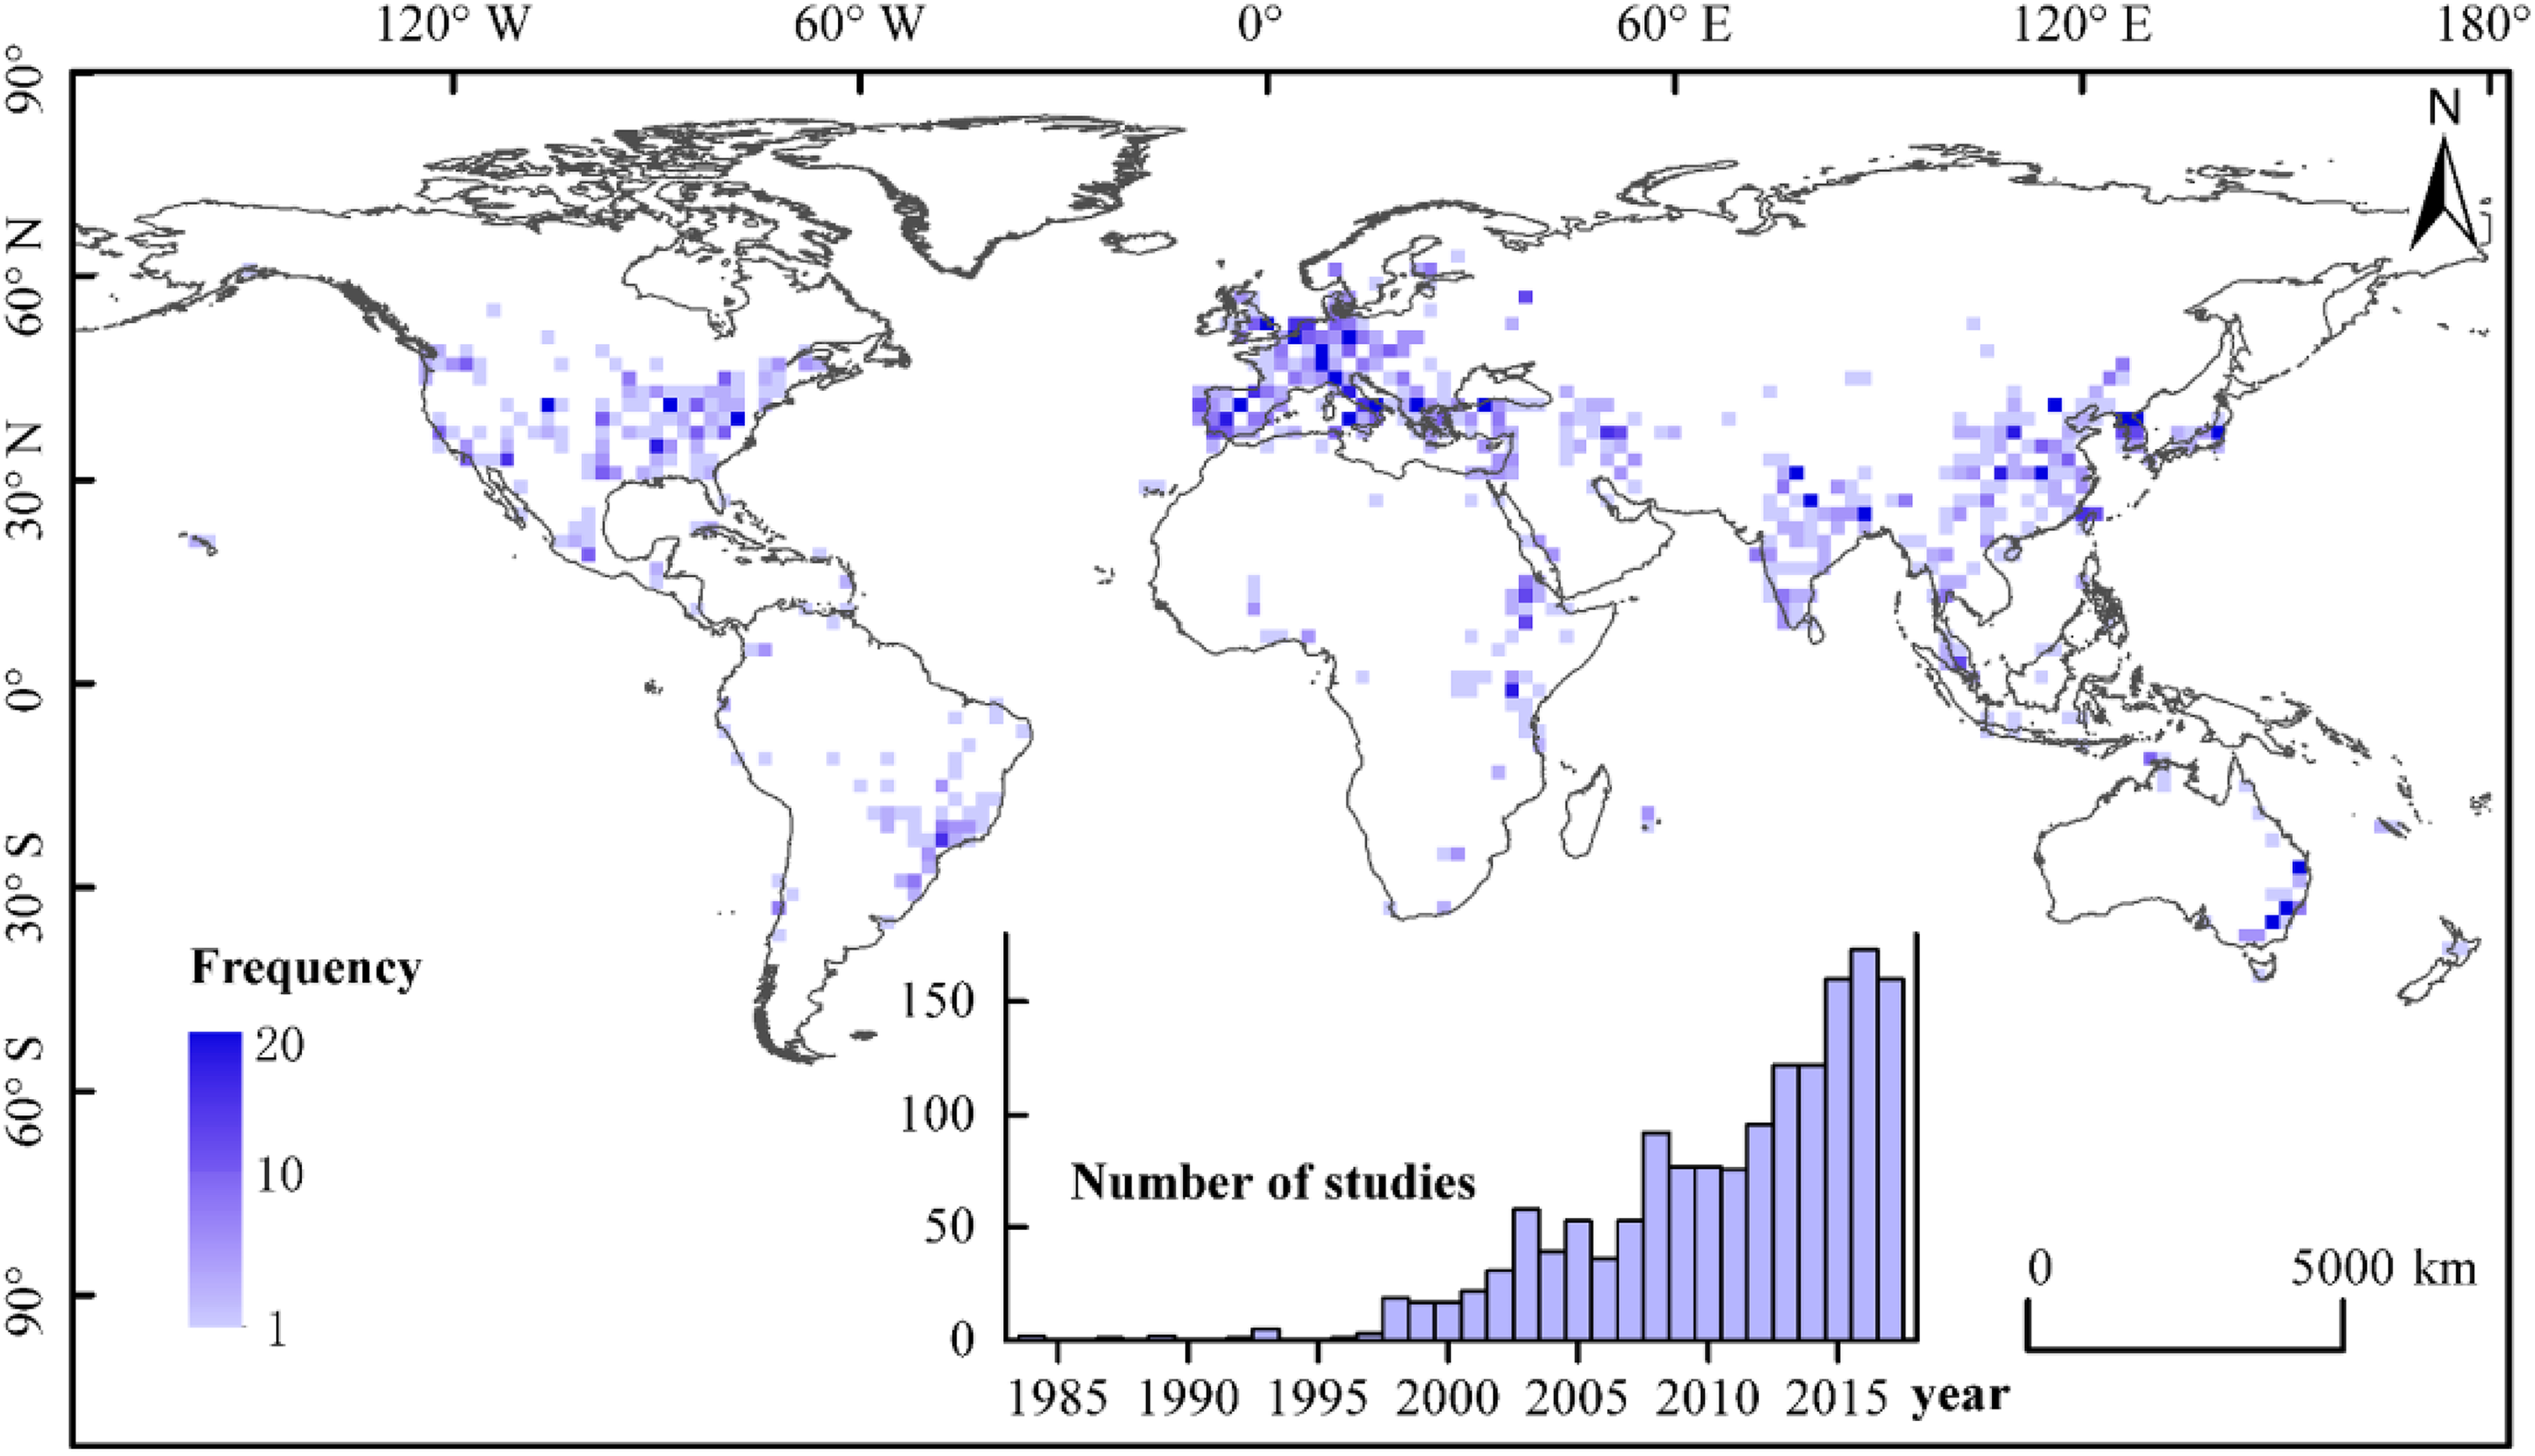
Worldwide distribution of the studies concerning USLE-based models.
The studies were organized within a database in which useful data for our analysis were registered. The data were selected in accordance with the following criteria: only data with clear sites, P-factor values, and practice descriptions were selected. If articles involved studies that focused on the same area and used the same P-factor value, only one study was selected and the others were excluded from the database. We retained 492 studies in the database (Figure 2). The USLE/RUSLE was used in eight studies to research soil erosion at the global scale, and other studies were conducted in 82 countries. The top three countries included China (82 studies), India (51 studies), and Italy (36 studies) (Figure 2).

Distribution of the studies in this database.
The following information was collected for the studies: (a) spatial location (coordinates); (b) study surface area (km2); (c) land-use type (crop type); (d) P-factor value; (e) P-factor calculation method; and (f) corresponding SPs. In the 196 studies that had information about SPs, the corresponding P-factors were qualified, and in the other 296 studies in which SPs were not applied or lacking information about SPs, the P-factor values were set to 1. The geographical distribution of the 196 studies in which SPs were applied was mapped (Figure 2; Supplemental material). In the following, we analyze the P-factors based on these 196 studies.
Figure 2 shows the spatial distribution of the sites corresponding to the 196 studies except for the global-scale studies (Ito, 2007; Pham et al., 2001; Scherer and Pfister, 2015; Yang et al., 2003) and European-scale studies (Panagos et al., 2015b). The studies in most of these countries, including China (46 studies) and India (31 studies) as well as some European countries (22 studies), were conducted under conditions of conservation agriculture, in which the proportion of cropland area under conservation agriculture was reported to the Food and Agriculture Organization of the United Nations (FAO) (Borrelli et al., 2017b).
The unique feature of the data is the variability in environmental conditions, and the methods used to calculate the input factors of the USLE-based models were also important. For instance, the size of the study areas varied by more than hundreds of orders of magnitude. Similarly, the methods used to determine P-factor values had various levels of complexity. In addition, there was variability among studies in the application of the types of SPs, which increased the difficulty of analyzing the results and general conclusions. Many authors did not provide information on the slope gradient, distribution of SPs, or even the types of SPs. In the following, we report the size of the study areas, types of SPs, and methods for P-factor value calculation, and present the results of a multivariate analysis that included all factors.
III Methods for quantifying P-factor values
Various methods for quantifying P-factors have been developed based on different research objectives and data availability. The P-factor values in most studies were obtained from previous research works and assigned to land-cover classes, and empirical values were adopted for P-factors for different land uses (Lu et al., 2013; Xu et al., 2013; Yao et al., 2016; Zeng et al., 2017). Many studies have reported various tables (Cai et al., 2000; Hurni, 1982; Wischmeier, 1975; Wischmeier and Smith, 1978; Yang, 1999) and formulas (Medeiros et al., 2016; Renard et al., 1997; Villarreal et al., 2016; Wang et al., 2016; Wener, 1981) for P-factor values for the different SPs adopted under different environmental contexts (Panagos et al., 2015a). In addition, in some studies, the P-factor was treated either as a subfactor of the cover-management factor (C-factor) or as a new combined CP-factor (Bhandari et al., 2015; Fujaco et al., 2016; Hurni, 1982; Liu et al., 2016; Ozhan et al. 2005). Furthermore, other researchers have developed proxy indicators for the P-factor (Borrelli et al., 2017b; Scherer and Pfister, 2015).
1 P-factor values for different SPs based on field experiments
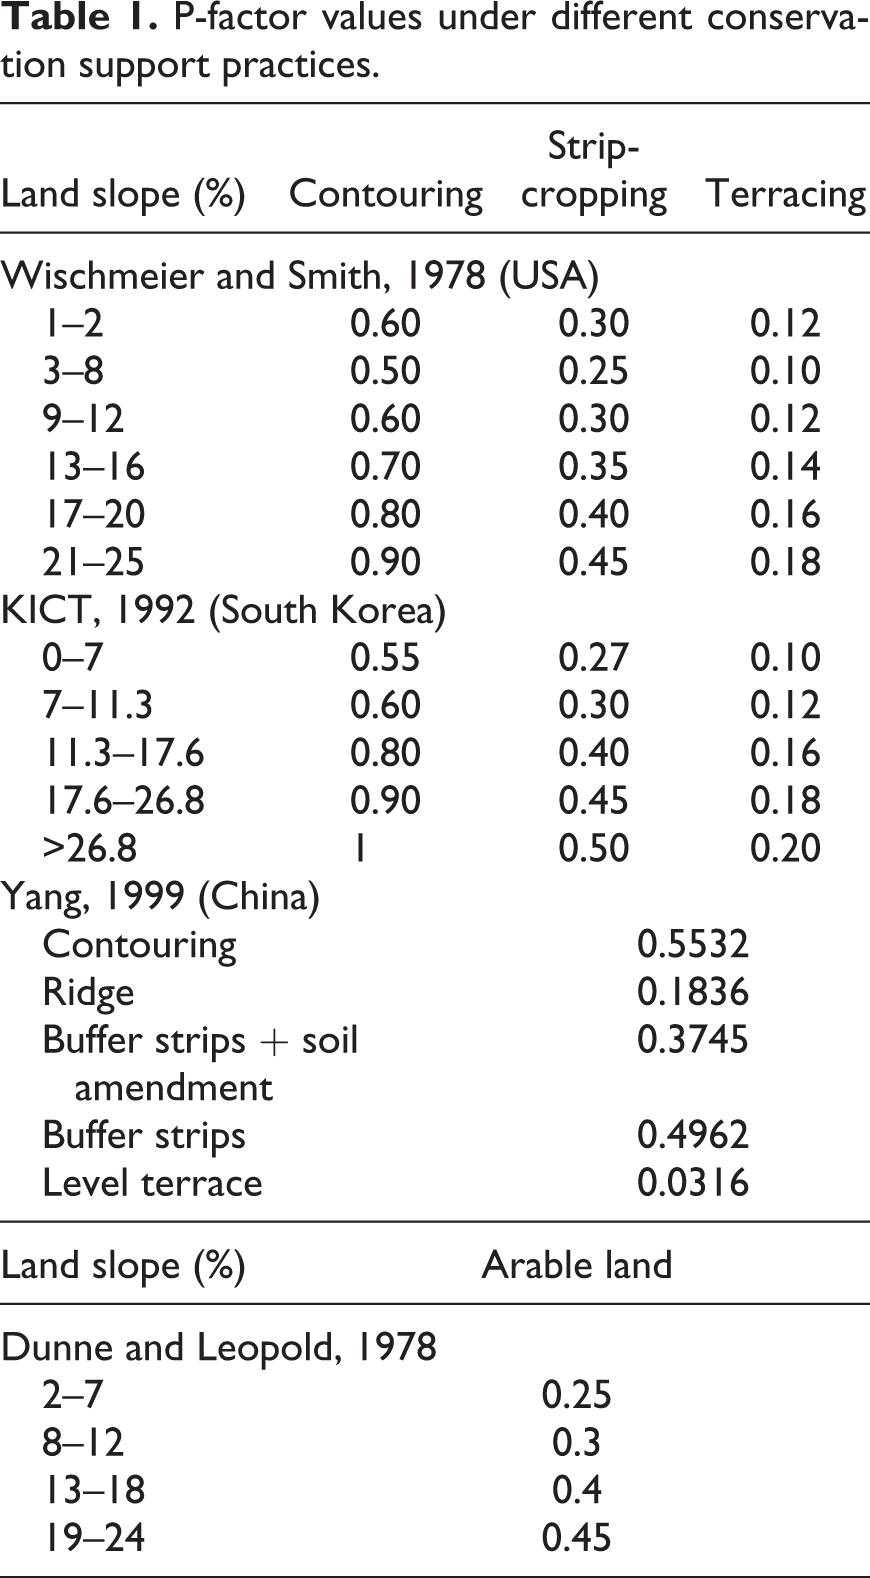
In the USLE, Wischmeier and Smith (1978) proposed P-factor values for three major SPs (contouring, strip-cropping, and terracing) in cultivated lands (Table 1), in which soil loss measurements on runoff plots in the USA were used to determine the effectiveness of conservation measures, and the results are the most widely used (Kumar et al., 2014; Plangoen et al., 2013; Yang et al., 2009). Certain studies used similar field experiments to calculate the P-factor values and developed tables that were more suitable for the local environmental conditions. The Korea Institute of Construction Technology also reported a table (Table 1) proposing P-factor values for the three major SPs based on a study in South Korea (KICT, 1992), and this table has been used in some studies for assessing soil erosion for cultivated lands under the three SPs (Jang et al., 2015; Karamage et al., 2016a, 2016b, 2016c, 2017; Lee et al., 2009). In addition, Yang (1999) provided the P-factor values for some SPs (Table 1) based on field experiments and studies in southwestern China, and these values were used in assessments of soil erosion in studies in China (Chen et al., 2017b; Xiao et al., 2015; Xu et al., 2008, 2011, 2017; Yang, 2002). Cai et al. (2000) calculated the P-factor values for terracing and contouring on croplands and orchards based on field experiments in China (Cai et al., 2000; Li and Wei, 2014; Tang et al., 2015). Similarly, other previous studies suggested the P-factor values of some SPs in Ethiopia (Hurni, 1985; Lema et al., 2016; Tamene et al., 2014) and Tanzania (Kabanza et al., 2013).
P-factor values under different conservation support practices.
2 P-factor values based on slopes
Many studies modified the P-factor values proposed by Wischmeier and Smith (1978) based on local SPs (Rawat et al., 2016). However, due to the difficulty of obtaining detailed information on SPs, some studies have calculated P-factor values based only on the slope gradient. For instance, Dunne and Leopold (1978) proposed P-factor values that were averaged for SPs and calculated based on slope ranges (Table 1).
However, the P-factor in the USLE may not be suitable for accurately describing the conservation effect because of the small size of runoff plots. In the RUSLE, the P-factor equations have been developed based on plot studies as well as watershed observations and calculations using detachment and transport theory (Renard et al., 1997); therefore, these equations have a broader applicability. In the RUSLE, many equations have been developed to calculate P-factor values for contouring, and they include combinations of strips, such as buffer and filter strips, and terracing. The effectiveness of contouring varied by ridge height and field slope steepness, the ridge height was classified into five groups. The P-factor values for contouring are calculated as follows (Renard et al., 1997):

where P 0 is the P-factor for on-grade contouring, θ is the slope angle for which a value of P 0 is desired, m is the slope angle at which contouring has its greatest effectiveness, e is the slope angle above which contouring is ineffective, and Pmb is the minimum P-value for a given ridge height with base conditions. The coefficients a and b also vary with the ridge height. The values for coefficients in equation (1) are given.
The equation used to compute P-factor values for off-grade contouring in the RUSLE is:

where P is the P-factor for off-grade contouring, P 0 is the P-factor for on-grade contouring (as computed by equation (1)), θf is the slope angle along the furrows, and θ is the average slope angle of the field (°).
In the RUSLE, the P-factor for strip-cropping considers the cropland cover-management conditions, and the P-factor for terracing considers the terrace spacing, horizontal terrace interval, and terrace grade. However, these formulas in the RUSLE are rarely applied because of the difficulty in obtaining detailed information on SPs. An alternative approach for approximating P-factor values based on empirical equations has been developed (Gao et al., 2016; Lufafa et al., 2003; Munir et al., 2000; Villarreal et al., 2016; Wang et al., 2016). For instance, the Wenner method assumes that P-factor values are linked to topographical features (Lufafa et al., 2003; Wener, 1981), and the equation is:

where S is the mean slope grade (%). In large watershed scales, land-use maps do not show differences resulting from SPs, such as terracing and contouring (Napoli et al., 2016). Therefore, using slope gradients as inputs, this method is commonly used to determine P-factor values (Clark et al., 2015; Fu et al., 2005, 2011; Khosrokhani and Pradhan, 2014; Li et al., 2017b; Mutua and Klik, 2004; Napoli et al., 2016; Pope and Odhiambo, 2014; Ricker et al., 2008; Schnitzer et al., 2013; Wang et al., 2014; Wu et al., 2011, 2016).
Equation (4) presents another methodology to determine P-factor values based on the slope angle (θ) (Medeiros et al., 2016):

3 Combination of the C-factor and P-factor
The C-factor and P-factor were combined in a single value as previously performed (Brooks et al., 1996; Wischmeier, 1975). In the modified USLE (MUSLE), the C-factor and P-factor used in the USLE have been replaced by a vegetation management (VM) factor (Wischmeier, 1975). For forests, the VM-factor is calculated based on canopy height and cover, ground cover, and bare ground with fine roots. For plantation systems, the P-factor was mostly treated either as a subfactor of C-factor (Dissmeyer and Foster, 1980) or as a new combined CP-factor (Brooks et al., 1996; Hurni, 1982). Liu et al. (2016) found that the CP-factor value was highly correlated with plant cover in rubber plantations; therefore, they selected plant cover as an indicator to present the effects of the CP-factor. The relationship between plant cover and the CP-factor was described as follows (Liu et al., 2016):

where PC = plant cover (%).
Furthermore, Andriyani et al. (2017) proposed that the C-factor and P-factor can be multiplied together to obtain the CP-factor as follows:

where CC is the crop cover subfactor, SC is the soil surface cover subfactor, SR is the soil roughness subfactor, and CM is the crop management subfactor (Andriyani et al., 2017).
4 Proxy indicators for the P-factor
Proxy indicators for the P-factor have been used in some studies because of the particular research objectives and data availability limitations. The regional population density and gross domestic product (GDP) can reflect the intensity of human activity, which is used to characterize the role of SPs in soil erosion research in the northern Loess Plateau (Liu and Liu, 2010). Scherer and Pfister (2015) used the high human development index (UNDP, 2014) and the score for pesticide regulation (Hsu et al., 2014) to reflect the role of SPs, and the USLE was used to model the spatial difference of phosphorus emissions in agriculture. Villarreal et al. (2016) refined the P-factor to express the vulnerability of soils to vehicle disturbances, and the P-factor was calculated as the difference in saturated hydrologic conductivity between disturbed and undisturbed soils, which was then scaled up to maps of vehicle disturbances digitized from aerial photography (Villarreal et al., 2016). Moreover, the Land Degradation Assessment in Drylands (LADA) project estimated P-factors using a management index related to overall crop performance and developed a global map for the parameter (Nachtergaele et al., 2010).
5 Quantification of P-factors based on an analysis of satellite imagery
P-factor values are commonly evaluated by experts via field observations or land-use maps. With the development of remote sensing (RS) and geographic information system (GIS) techniques, analysis of very high spatial resolution (VHR) satellite imagery, such as Pleiades imagery and QuickBird imagery, are also gaining attention (Karydas et al., 2009; Wang et al., 2016). Karydas et al. (2009) used an object-oriented classification method for terraces to quantify site-specific P-factors based on QuickBird imagery, and Wang et al.(2016) used the angle between the ridge direction and slope aspect to calculate the P-factor value for contouring according to the visual interpretation of the Pleiades imagery. Earth observation data obtained by VHR satellite imagery, such as QuickBird imagery, and advanced image processing techniques, such as object-oriented analysis, have provided new insights for mapping landscape features, such as terraces, and represents a basis for assessing P-factors (Karydas et al., 2009; Wang et al., 2016; Yang et al., 2009). P-factors can be derived via an object-oriented analysis of QuickBird imagery, which allows P-factors to be quantified via a thematic map instead of assigning uniform P-factor values. This method can further improve the resulting soil erosion mapping.
6 Application of the methods for P-factor quantification
The size of the study areas ranged from the plot scale (1–100 m2) to the global scale, and the area of most studies (76%) ranged from 10 km2 to 1×10⁵ km2, which is consistent with the typical size of many monitored catchments (García-Ruiz et al., 2015). Figure 3 shows the size of the studies combined with information on the year of the paper published based on the 196 studies in which SPs were applied. An increasing trend in the number of studies with P-factor values in the models has been observed, and more studies have focused on soil erosion estimates based on the USLE/RUSLE model at a large scale in recent years.
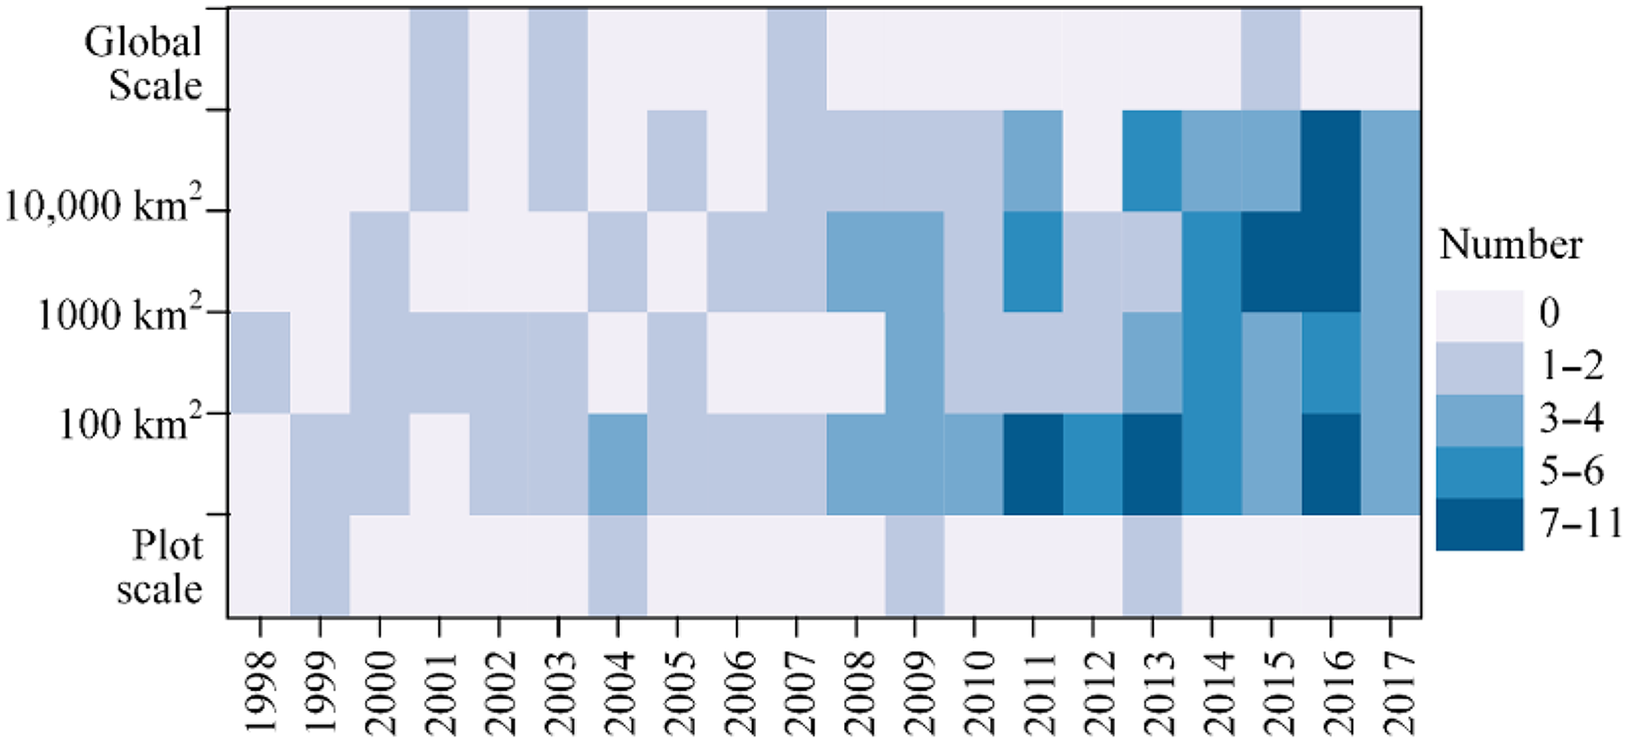
Distribution of the number of studies with different study area sizes.
The methods of calculating P-factor values were classified into six categories: (a) P-factors calculated by a combination of C-factors and P-factors (M1); (b) P-factor values calculated with slope gradients based on SPs information, such as the type of SPs (M2); (c) P-factor values calculated with slope gradients without information about SPs (M3); (d) an empirical uniform P-factor value adopted based on the SPs according to previous research works or expert knowledge (M4); (e) an empirical uniform P-factor value adopted for different land use according to previous research works or expert knowledge (M5); and (f) P-factor values calculated based on proxy indicators (M6). Figure 4(a) shows the number of studies with different methods in every year. The P-factor values in the majority of studies adopted an empirical uniform value according to previous research works (M4 and M5) and were calculated using the slope gradients of land (M2 and M3) (Figure 4(a)). A greater number of studies that used the M2 and M4 methods, calculating the P-factor values according to the condition of SPs, had a smaller study area size (<100 km2) (Figure 4(b)), suggesting that the P-factors were considered more fully at smaller-scale studies.
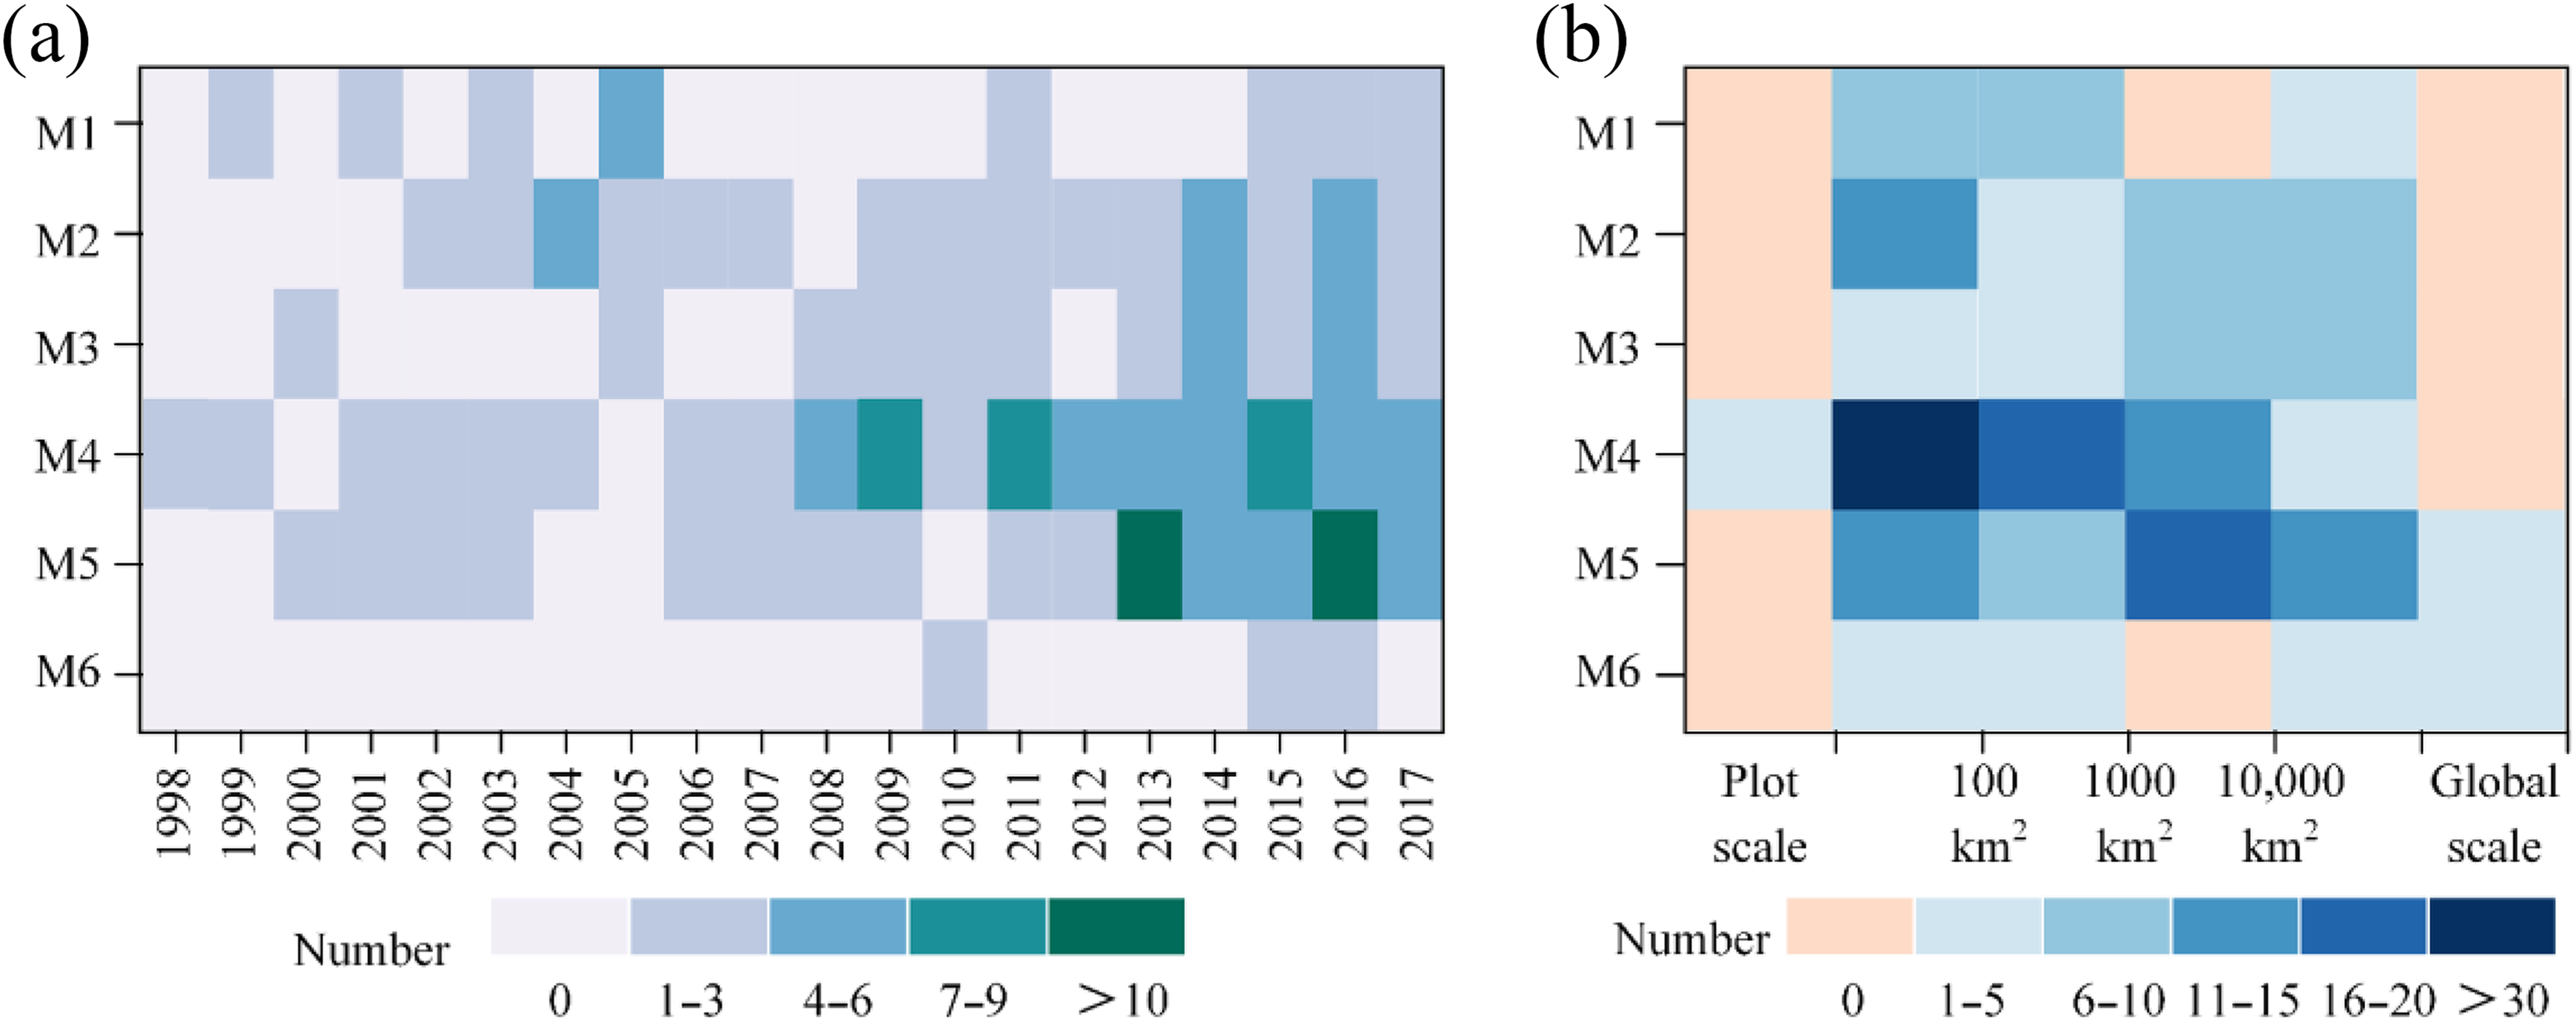
Distribution of the number of studies with (a) different P-factor-value calculation methods and (b) different study area sizes. M1-6 represent different categories of the methods of calculating P-factor values.
IV P-factor values for USLE-based soil loss modeling
The main methods for calculating the P-factor values used in this database were introduced in the previous section. Here, we analyzed the P-factor values in the database that did not include studies based on national and global scales. The P-factor values of SPs were reported in 103 case studies (Figure 5), and for the other cases, detailed information (the type and location of SPs) was lacking, and the P-factor values were mostly calculated by slope and land use. The SPs were applied mostly to arable lands, including croplands and paddy fields, and SPs were also applied for orchards and pasture in some studies. The main SPs included terracing (60 studies), contouring (59 studies), strip-cropping (24 studies), and mulching (nine studies) (Figure 5). The SPs were typically used in combination; for example, contouring almost always accompanied strip-cropping. The combination of more than one type of practice was applied in 44 studies.
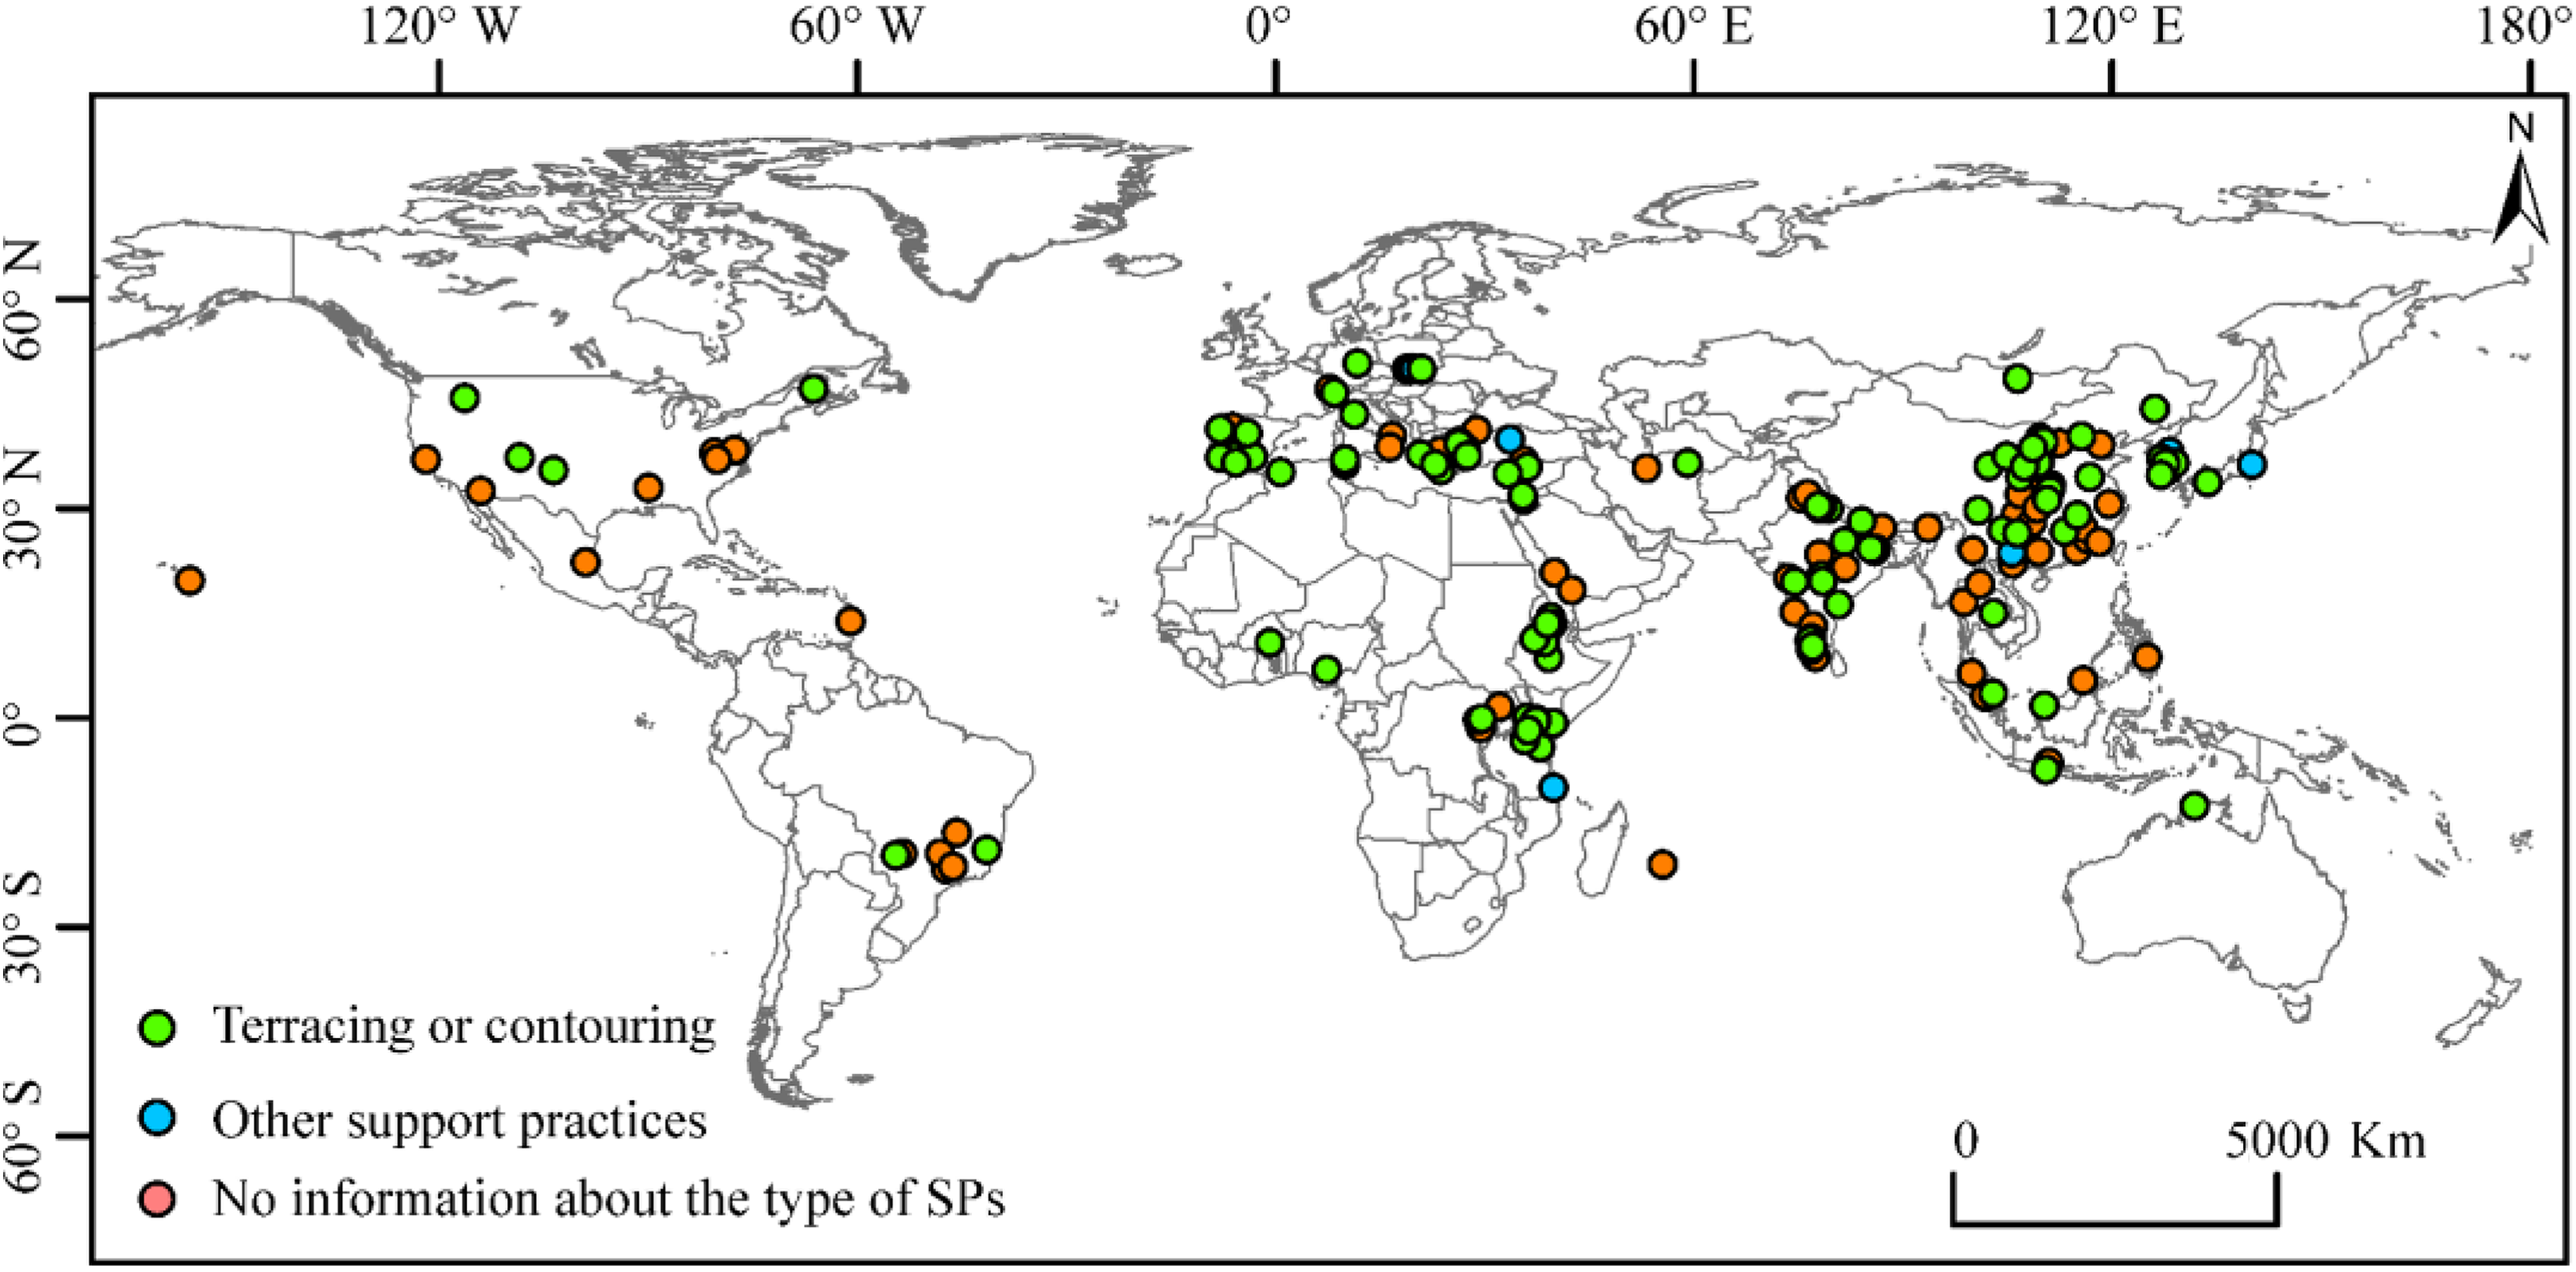
Distribution of case studies and the corresponding support practices (SPs).
The P-factor values in 67 studies adopted empirical uniform P-factor values for different land uses according to previous research works or expert knowledge (M5 method). We found that there was a high degree of variability in P-factor values because of the different land-use types (Figure 6(a)). The P-factor values were smaller for paddy fields (0.16 ± 0.15) than for orchards (0.47 ± 0.12) and croplands (0.49 ± 0.21) (Figure 6(a)). P-factor values were reported for paddy fields in 19 study areas located in China, Korea, Thailand, Malaysia, the Philippines, India, and Vietnam, which are the major rice-producing countries worldwide.
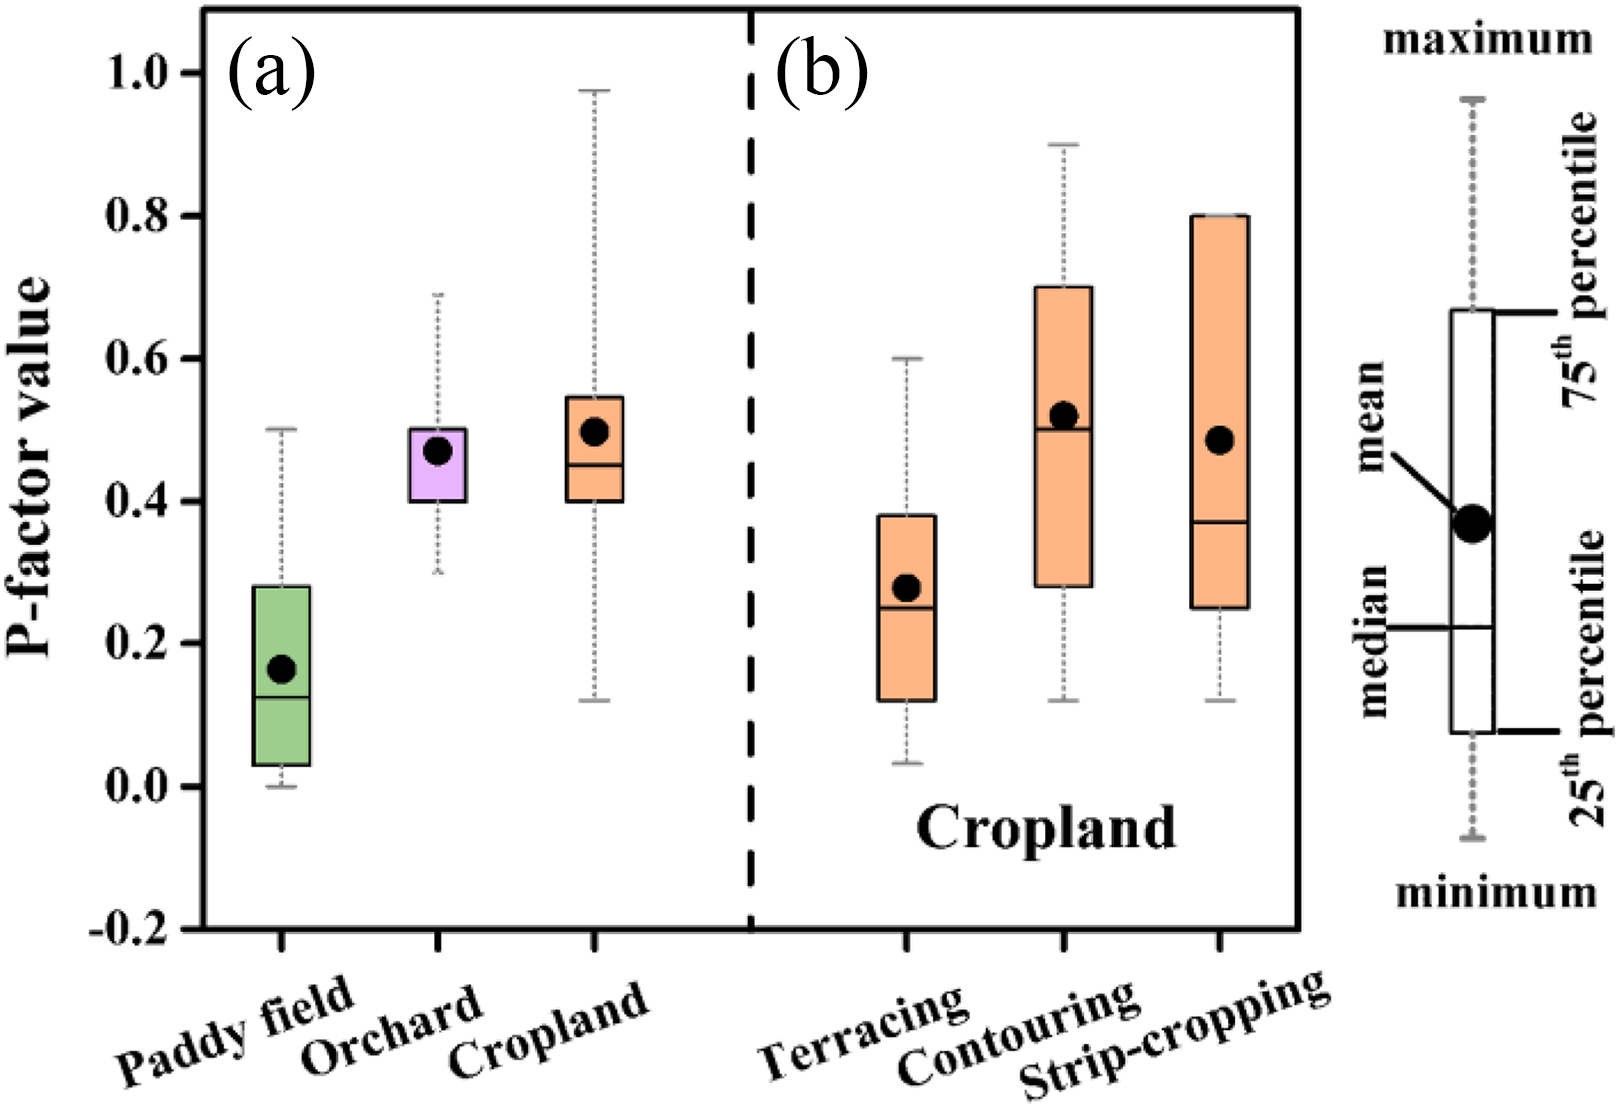
Boxplots showing the range of P-factor values: (a) P-factor values for paddy fields, orchards, and croplands according to the M5 method; and (b) P-factor values of the main support practices (SPs) for croplands according to the M4 method.
The P-factor values in 49 studies were given uniform values for croplands under different SPs (M4 method). Boxplots (Figure 6(b)) show the range of P-factor values for croplands under terracing, contouring, and strip-cropping. The mean values for strip-cropping had the widest range (mean = 0.49, standard deviation (SD) = 0.28). The smallest P-factor value was recorded from terracing (mean = 0.28, SD = 0.18), and the mean value reported for contouring was 0.52 (SD = 0.24). The results show that terracing was more effective than contouring and strip-cropping and generally agree with those of published studies (Renard et al., 1997; Wischmeier and Smith, 1978).
Furthermore, the P-factor values were calculated for terracing, contouring, and strip-cropping based on the slope gradient of croplands according to the tables that included P-factor values obtained in previous studies (M2 method), such as Wischmeier and Smith (1978) and KICT (1992) (Table 1). Figure 7(a) shows that the mean P-factor values in the 20 studies vary based on the slope gradient. However, in some studies with a large scale, the information on the location, area, and type of SPs cannot be diagnosed via a land-use map, and the P-factor values for arable lands were calculated based on the slope gradient (M3 method), such as in the table generated using the Dunne and Leopold method (Dunne and Leopold, 1978; Litschert et al., 2014) (Table 1). Figure 7(b) shows the range of P-factor values for croplands whose slope gradients vary in 17 studies that lacked information. A high degree of variability in P-factor values was observed at the same slope gradient, although the effectiveness of SPs generally decreased as the terrain gradient increased (Figure 7(a) and (b)). The slope-based approach of the Wenner method (equation (3)) was also used to calculate the P-factor values for croplands in 15 studies.

Range of P-factor values based on slope gradients: (a) P-factor values of the main support practices (SPs) for croplands according to the M2 method; and (b) P-factor values for croplands according to the M3 method.
V P-factor for USLE-based modeling at the national and global scale
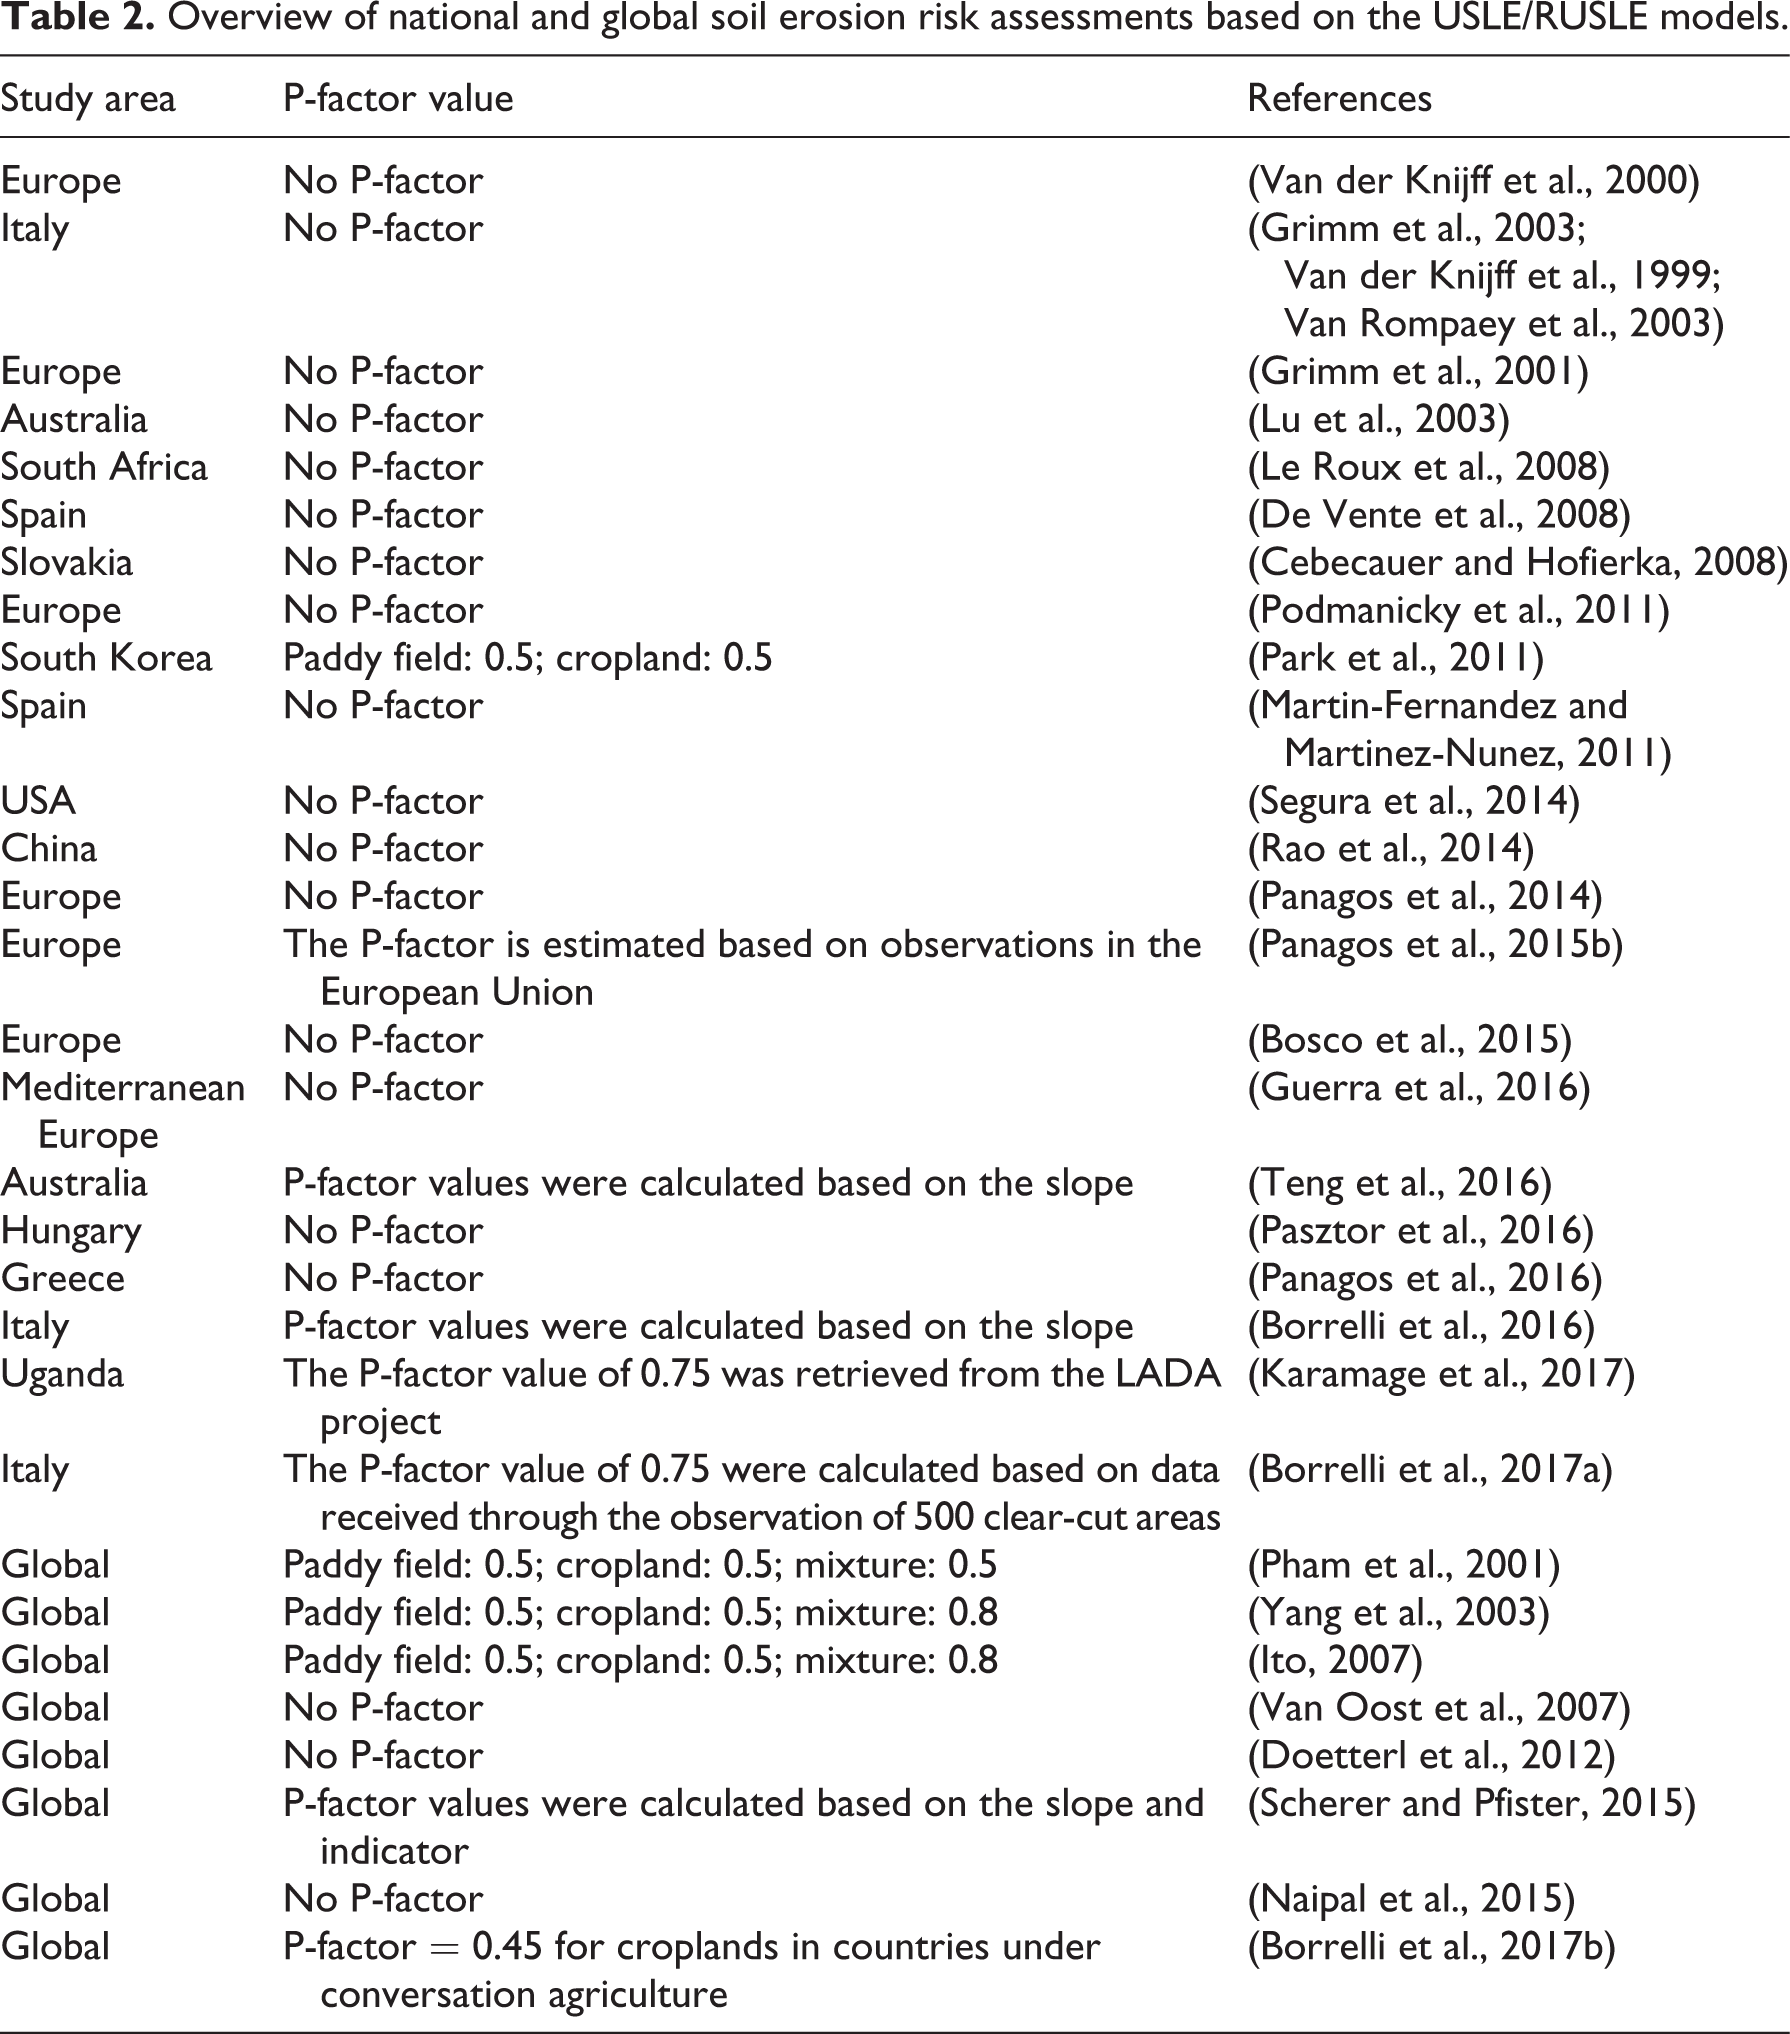
USLE-based models have been widely used for soil erosion estimates at the catchment scale and regional scale based on the aforementioned studies. In recent years, USLE-based models have been applied to assess soil erosion at the national or global scale (Table 2). To estimate global soil erosion, the USLE model was first applied on a global scale by Pham et al. (2001); in their study, a P-factor value of 0.5 was introduced for complete agricultural lands (dry crops and paddies) and mixtures of agricultural land with forest or grassland. In addition, Yang et al. (2003) and Ito (2007) considered the importance of human influence on soil erosion control, and due to the lack of details concerning SPs on a global scale, they also identified P-factor values by land-cover type, with a value of 0.5 assigned to complete arable lands and 0.8 assigned to mixtures of arable land with forest or grassland. However, Doetterl et al. (2012) showed that compared with other RUSLE factors (LS-factor, R-factor, and C-factor), the P-factor did not contribute significantly to variations in soil erosion on scales ranging from continental to global; thus, the P-factor could be ignored. In a different study, Naipal et al. (2015) did not consider the P-factor as they had insufficient or no data concerning the P-factor on a global scale. Without considering the P-factor, Borrelli et al. (2017(b)) predicted values for reference years and estimated a conservative scenario for 54 countries in which information concerning the implementation of conservation agriculture was reported to the FAO. For these areas, Borrelli et al. (2017b) assumed a 45% reduction in soil erosion as opposed to conventional tillage (P-factor value = 0.45). P-factors have been poorly considered in soil erosion estimates at the global scale.
Overview of national and global soil erosion risk assessments based on the USLE/RUSLE models.
Previous studies have shown that engineering techniques can reduce the soil loss rate by up to 86% based on a global analysis of runoff plots (Xiong et al., 2018), and Chen et al. (2017a) reported that terracing resulted in a 53.0% mean reduction in sediment in China. These results show that these SPs contributed significantly to the reduction in soil erosion of local arable land, especially in erosion-sensitive regions, such as the Mediterranean and loess regions. Conservation agriculture covers approximately 15% of global cropland (1.6 million km2), and soil erosion of cropland accounts for approximately 50% of the total predicted soil erosion (Borrelli et al., 2017b). SPs are applied mostly in areas that are susceptible to soil erosion, such as loess regions, thereby resulting in significant reductions in absolute soil loss. If the influence of SPs is ignored, the calculated soil erosion rate will be much greater than its actual value on arable lands. As such, the influence of SPs should be considered in assessments of global soil erosion. However, determining differences in SPs using a land-use map is difficult, and the location of SPs cannot easily be identified based on land-use maps for global-scale studies; hence, the P-factor is poorly considered. This problem should be resolved to improve the results of soil erosion mapping.
At the national scale, the P-factors have not been fully considered for soil erosion estimates (Table 2). However, countries in the European Union have provided new insights for P-factor quantification. Panagos et al. (2015a) modeled SPs that reduce soil erosion and presented the areas in Europe where those SPs were implemented based on more than 226,000 observations from the land use/cover area frame statistical survey (LUCAS) carried out in the European Union. The results were presented at pixel level, then the data was aggregated at the regional level according to the application of SPs (Panagos et al., 2015a). Many studies have conducted field experiments to research the effectiveness of SPs on soil loss control (Chen et al., 2017a; Xiong et al., 2018); thus, at catchment or regional level, a larger number of field observations may be collected, which can be used to build a P-factor dataset at the regional level according to the method of Panagos et al. (2015a).
VI Limitations and future improvements for the quantification of P-factors
Our literature review and analysis of P-factor values showed that ignoring P-factors introduces uncertainty, and other limitations regarding current research were also identified. First, the effects of SPs on soil erosion had not been fully considered for other land-use types. SPs were applied to arable lands in a majority of studies using USLE-based models. However, Chen et al. (2017a) performed a meta-analysis of 636 observations involving terracing in China and found that terracing was used within different land-use types, including cropland, shrubland, and forestland. Panagos et al. (2015a) evaluated more than 226,000 observations in the European Union and found that stone walls were applied in all land-use types except artificial land and water bodies, and grass margins were widely used in agricultural areas, pastures, and heterogeneous agricultural areas. Second, studies that adopted an empirical uniform P-factor value for lands introduced inaccuracy to the P-factor values, and the SPs should be located on a land-use map. Third, P-factor values calculated according to previous research works or expert knowledge were not inaccurate. The effectiveness of the different SPs was impacted by many factors; for instance, the effects of terracing were limited by the climate, soil properties, topography, and land uses (Chen et al., 2017a). Contouring was less effective for areas that experience large storms and that have high ridge heights, short slope lengths, etc., and the effectiveness of strip-cropping begins to diminish when the strips become too wide or when the slope lengths become too long (Renard et al., 1997). The empirical relationships for P-factors given by Renard et al. (1997) and Shin (1999) were based on experiments in the Midwest USA and in South Korea. However, quantifying the effects of different SPs applied to other locations based on these empirical tables and formulas does not generate accurate results.
In terms of the analysis of P-factors in the previous sections, further improvements to the methods of quantifying P-factors should concentrate on the following three aspects: building a P-factor dataset at the regional level according to the work of Panagos et al. (2015a) based on the SP field experiments’ data collection, as well as the P-factor dataset at the global scale via an integration of data from the US Department of Agriculture, the FAO, and the LUCAS of Europe; developing proxy indicators for P-factors at the large scale – for example, the high human development index and scores for pesticide regulation (Scherer and Pfister, 2015), the GDP (Borrelli et al., 2017b), and climate region can serve as proxy indicators for P-factors or can be incorporated into P-factors; and using Earth observation data from VHR satellite imagery, such as QuickBird imagery and advanced image-processing techniques, such as object-oriented analysis, to assess P-factors. In addition, higher-resolution input data correspond to increased computational needs and decreased practicability, which means there will be limitations for large-scale studies.
VII Conclusions
This study analyzed the P-factor values in USLE-based models that were applied to estimate soil erosion in 196 published articles. An increasing trend in the number of studies, with more studies focused on soil erosion estimates at large scales, has been observed in recent years. Various methods have been developed to quantify and propose P-factor values during recent years. However, the P-factor quantification methods, such as the M2 and M4 methods, which considers SPs more fully, were used in studies with relatively smaller study areas (< 100 km2). The results of our global synthesis suggested that SPs significantly contributed to reductions in the soil erosion of arable land, and the P-factor values for paddy fields, orchards, and croplands were 0.16 ± 0.15, 0.47 ± 0.12, and 0.49 ± 0.21, respectively. Therefore, those SPs and their local effectiveness should not be ignored in soil erosion modeling either at the small or large scale. In addition, it is more feasible to collect data on the effectiveness of SPs on soil loss control based on field experiments in publications or obtain the very high-resolution satellite imagery at the small scale, which can be used to calculate the P-factor value; thus, a small-scale study should try to quantify the P-factor to improve the resulted soil erosion mapping. According to these results, we make some recommendations to better quantify P-factors.
The results of this study provide useful implications for quantifying P-factors with respect to the assessment of soil erosion risks at large scales, and they can facilitate improved applications of USLE-based modeling at the regional and global scale. In addition, the results can be beneficial for model users to improve their knowledge about P-factors, and are also good for model users to choose or develop an appropriate method to calculate the P-factor value. A globally applicable USLE-based model can enable improved estimates of global soil erosion and soil organic carbon pools, including the effects of land-use changes and conservation agriculture in past, current, and future scenarios. In a scientific sense, the use of this model can aid policy decision-making with respect to sustainable soil protection.
Supplemental material
Supplementary_data - Global analysis of support practices in USLE-based soil erosion modeling
Supplementary_data for Global analysis of support practices in USLE-based soil erosion modeling by Muqi Xiong, Ranhao Sun and Liding Chen in Progress in Physical Geography: Earth and Environment
Footnotes
Declaration of conflicting interests
The author(s) declared no potential conflicts of interest with respect to the research, authorship, and/or publication of this article.
Funding
The author(s) disclosed receipt of the following financial support for the research, authorship and/or publication of this article: This work was supported by the National Key R&D Program of China (Grant Number 2017YFA0604704).

Supplemental material
Supplemental material for this article is available online.
References
Supplementary Material
Please find the following supplemental material available below.
For Open Access articles published under a Creative Commons License, all supplemental material carries the same license as the article it is associated with.
For non-Open Access articles published, all supplemental material carries a non-exclusive license, and permission requests for re-use of supplemental material or any part of supplemental material shall be sent directly to the copyright owner as specified in the copyright notice associated with the article.
