
Abstract
Wind erosion is a global environmental problem and affects the sustainable use of land soil. The current efforts in wind erosion modeling mainly focus on local scales, yet very few studies have attempted to quantify the soil losses by wind on a large scale. Here, we proposed a distributed version of the revised wind erosion equation model (DRWEQ) to assess the spatial and temporal variations of wind erosion globally. The DRWEQ model used meteorological, soil, topographic, and remote sensing data to simulate global wind erosion from 2001 to 2010. The results showed that (a) the areas of wind erosion in Africa and Asia accounted for approximately 62% of the global wind erosion area but accounted for 91% of the global total soil loss; (b) global wind erosion showed a decreasing tendency during the research period – the wind erosion with a trend of intensification occupied 40.62% of the global wind erosion area while about 59.38% of the global wind erosion area showed a weakening trend; and (c) the monthly dynamics of the wind erosion were closely correlated with the combined effects of weather factors and vegetation coverage. The soil loss rates were lower in summer and reached the peak from January to April. The method presented in this study was developed based on the tradeoff of accuracy and availability of global data, and has the potential for predicting wind erosion from regional to global scales.
I Introduction
Soil can offer a wide range of goods and services to meet human needs (Amundson et al., 2015; Anache et al., 2017). Large areas of natural vegetation have been reclaimed for farmland with the development of agriculture over thousands of years (Wimberly et al., 2017; Wang et al., 2017). Meanwhile, intensive human activities and climate change have accelerated soil erosion (Valle Junior et al., 2014a, 2014b). Soil erosion by wind (wind erosion) is an important environmental problem in arid and semiarid regions (Buschiazzo and Zobeck, 2008). Wind erosion reduces land productivity and threatens the sustainable development of agriculture. Moreover, wind erosion disrupts the carbon transport and alters the biogeochemical cycles of the world (Auerswald et al., 2009; Garcia-Ruiz et al., 2015; Teng et al., 2016). The loss of ecosystem services by wind erosion has been paid more attention in recent years (Garcia-Ruiz et al., 2017; Maetens et al., 2012; Prosdocimi et al., 2016). The Millennium Ecosystem Assessment indicated that 60% of ecosystem services worldwide are degrading, including soil conservation services (Dooley, 2005).
Wind erosion not only causes serious soil degradation (George, 2004; Sterk and Raats, 1996; Visser and Sterk, 2007) but also has negative effects on human health (Copeland et al., 2009; Lal, 1998). Fine soil particles blown into the air by wind lead to severe air pollution as well as threat to traffic safety (Du et al., 2016; Li et al., 2018). The dust storm created by wind erosion in the 1930s prompted researchers to study the mechanism of wind erosion (Cook et al., 2008). When the shear velocity of the wind exceeds a certain threshold, unstable soil particles will move and lead to the occurrence of wind erosion (Field et al., 2010). Due to wind-forced movement, fine soil particles are entrained and transported over long distances before being redeposited elsewhere. Field measurement has always been the main method for the quantification of wind erosion rates (Auerswald et al., 2009), such as the 137Cs tracing technique (Liu et al., 2007) and inserted drill rods (Guo and Ma, 2009; Zheng et al., 2010). Recent efforts by wind tunnels have been made to simulate the wind erosion under different environmental conditions (Giménez et al., 2019; Zhang et al., 2014). Such studies indicate that wind erosion is affected significantly by climate, soil, vegetation, and topography. The spatial models of wind erosion have been developed by combining these wind erosion factors. For example, some local-scale models of wind erosion have been extensively applied for predicting soil loss, including the wind erosion prediction system (WEPS) (Buschiazzo and Zobeck, 2008; Hagen, 1991), the wind erosion stochastic simulator (WESS) (Van Pelt et al., 2004), the agricultural policy/environmental eXtender (APEX) (Pi et al., 2017), the wind erosion equation (WEQ) (Woodruff and Siddoway, 1965), and the revised wind erosion equation (RWEQ) (Fryrear et al., 1994; Saleh and Fryrear, 1999).
However, the main challenge of wind erosion modelling is to upgrade the local-scale wind erosion models for large-scale modeling, even the wind erosion prediction globally. While the large-scale erosion prediction models are not as accurate as the local-scale models, they still provide basic knowledge about where and when wind erosion occurs. Several attempts have been conducted by integrating current wind erosion prediction models. The WEPS can forecast wind erosion with good applicability in farmland and grassland areas. But the data requirements are complex, including the crop growth, decomposition, weather, hydrology, and farming. Therefore, the WEPS is not applicable on a global scale. The WESS requires detailed inputs of soil texture, erodible particle diameter, soil roughness, soil moisture content, crop residue, and 10-min average wind speeds to predict wind erosion at a given field scale. Since the erodible particle diameter and 10-min average wind speeds required for the model are difficult to obtain on a global scale, the WESS is not suitable for global wind erosion evaluation. Given that APEX may face enormous challenges in both the global modeling process and data entry, it is also not applicable globally. The WEQ is commonly used to estimate wind erosion in the agricultural field while it is not suitable on a global scale. For example, the WEQ cannot predict wind erosion in areas of high rainfall or extreme drought. The RWEQ, on the other hand, can simulate annual or period wind erosion based on a single wind erosion equation that includes wind erosion factors, such as climatic erosivity, soil erodibility, vegetation cover, and landscape roughness (Fryrear et al., 1998; Saleh and Fryrear, 1999). The RWEQ is easier to upgrade from field scale to larger scale due to the available data, few input parameters, and relatively easy operation. In addition, the RWEQ can be used to compare wind erosion results in different regions because it is widely used in wind erosion assessment. Therefore, the RWEQ model has the potential for the global prediction of wind erosion under a variety of geographical conditions. Although recent studies have been conducted to quantitatively evaluate wind erosion over a large area by using the RWEQ model, several difficulties were also likely to restrict the global use of the RWEQ model. For example, the wind factor needs to be upgraded from daily scale to hourly scale. As an important part of the combined crop factor, the growing crop canopy should be identified more accurately by remotely sensed data. We also noted that the combined crop factor was usually simplified by not considering the flat residues (SLRf) and standing plant residues (SLRs) (Borrelli et al., 2017a; Zhang et al., 2019). This simplification of RWEQ was a tradeoff between model accuracy and data availability because global land cover residues cannot be estimated from the methods of remote sensing or field observation.
Here, we presented a distributed version of the revised wind erosion equation model (DRWEQ) to predict the annual wind erosion from 2001 to 2010 globally. The original version of the RWEQ is designed to estimate wind erosion based on a single event at field scales. When it is used at the global scale, the model parameters need to be “distributed” at each analytical unit (a 10×10km grid in this study). We used the distributed method and several alternative indicators to find a single set of parameters that is applicable under a wide range of environmental conditions. This is essential for the application of the RWEQ model at the global scale because the range of environmental conditions will be large and further calibration globally will not be feasible. The DRWEQ conducted the calculation of wind erosion by distributing related parameters under different geographical backgrounds, including the effects of weather, soil texture, topography, and vegetation cover. The objectives of this study are to (a) develop the DRWEQ model by parameter calibration and optimization globally, and (b) quantify the spatial and temporal variations in wind erosion from 2001 to 2010.
II Materials and methods
1 Data acquisition and processing
Meteorological data were obtained from the global surface summary of daily data of the National Centers for Environmental Information. The weather dataset included mean temperature, mean wind speed, precipitation, and snow depth data from 2001 to 2010 (ftp://ftp.ncdc.noaa.gov/pub/data/gsod/). The potential evapotranspiration data were obtained from updated high-resolution grids of monthly climatic observations from the Climatic Research Unit TS v.3.10 gridded datasets (http://crudata.uea.ac.uk/cru/data/hrg/). The weather factor (WF) was directly interpolated into spatial raster data by using the Kriging spatial interpolation method in ArcGIS software. The digital elevation model was obtained from the GMTED2010 dataset (http://topotools.cr.usgs.gov/GMTED_viewer/viewer.htm). The soil property data, including soil sand, silt, clay, and organic carbon content data, were obtained from the International Soil Reference Information Centre’s Soil Grid 250 m dataset (http://data.isric.org/geonetwork/srv/chi/catalog.search;jsessionid=A887E5B4). The satellite-based normalized difference vegetation index (NDVI) products were derived from the 8-km and 15-day composite GIMMS AVHRR NDVI3 g datasets that contain data from 2001 to 2010 (https://ecocast.arc.nasa.gov/data/pub/gimms/3g.v1/). Furthermore, we used the maximum value composites method to obtain the monthly NDVI dataset from 2001 to 2010. The fraction of the soil surface that is covered with crop canopy (CC) was calculated from the NDVI image dataset based on the dimidiate pixel model method (Ivits et al., 2013). We transferred these databases to raster layers of weather, soil, topography, and vegetation coverage at the global scale. Then, we used them to generate the weather factor, soil erodible fraction (EF), soil crust factor (SCF), soil roughness factor (K’), and combined crop factors (COG). These raster layers data were resampled into 10-km resolution.
2 Distributed parameters of RWEQ model
The RWEQ is an empirical wind erosion model used to assess the soil loss at a height of 2 m (Fryrear et al., 1998; Van Pelt et al., 2004). The rate of soil loss (SL) at a specific point (x) in the field is:
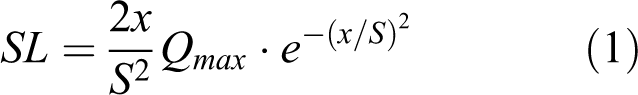
where SL is the soil loss (kg·m–2); x is the distance from non-erodible border (m); S is the critical field length (m); Qmax and S are defined by the following equations:
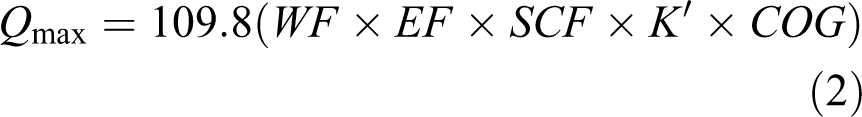
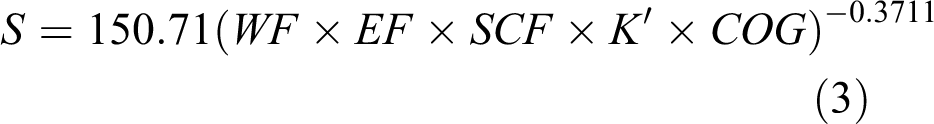
where Qmax is the maximum transport capacity (kg·m–1); WF is the weather factor (kg·m–1); EF is the soil erodible fraction (dimensionless); SCF is the soil crust factor (dimensionless); K′ is the soil roughness factor (dimensionless); COG is the combined crop factor (dimensionless) (Table 1).
Global data used in the erosion modeling.
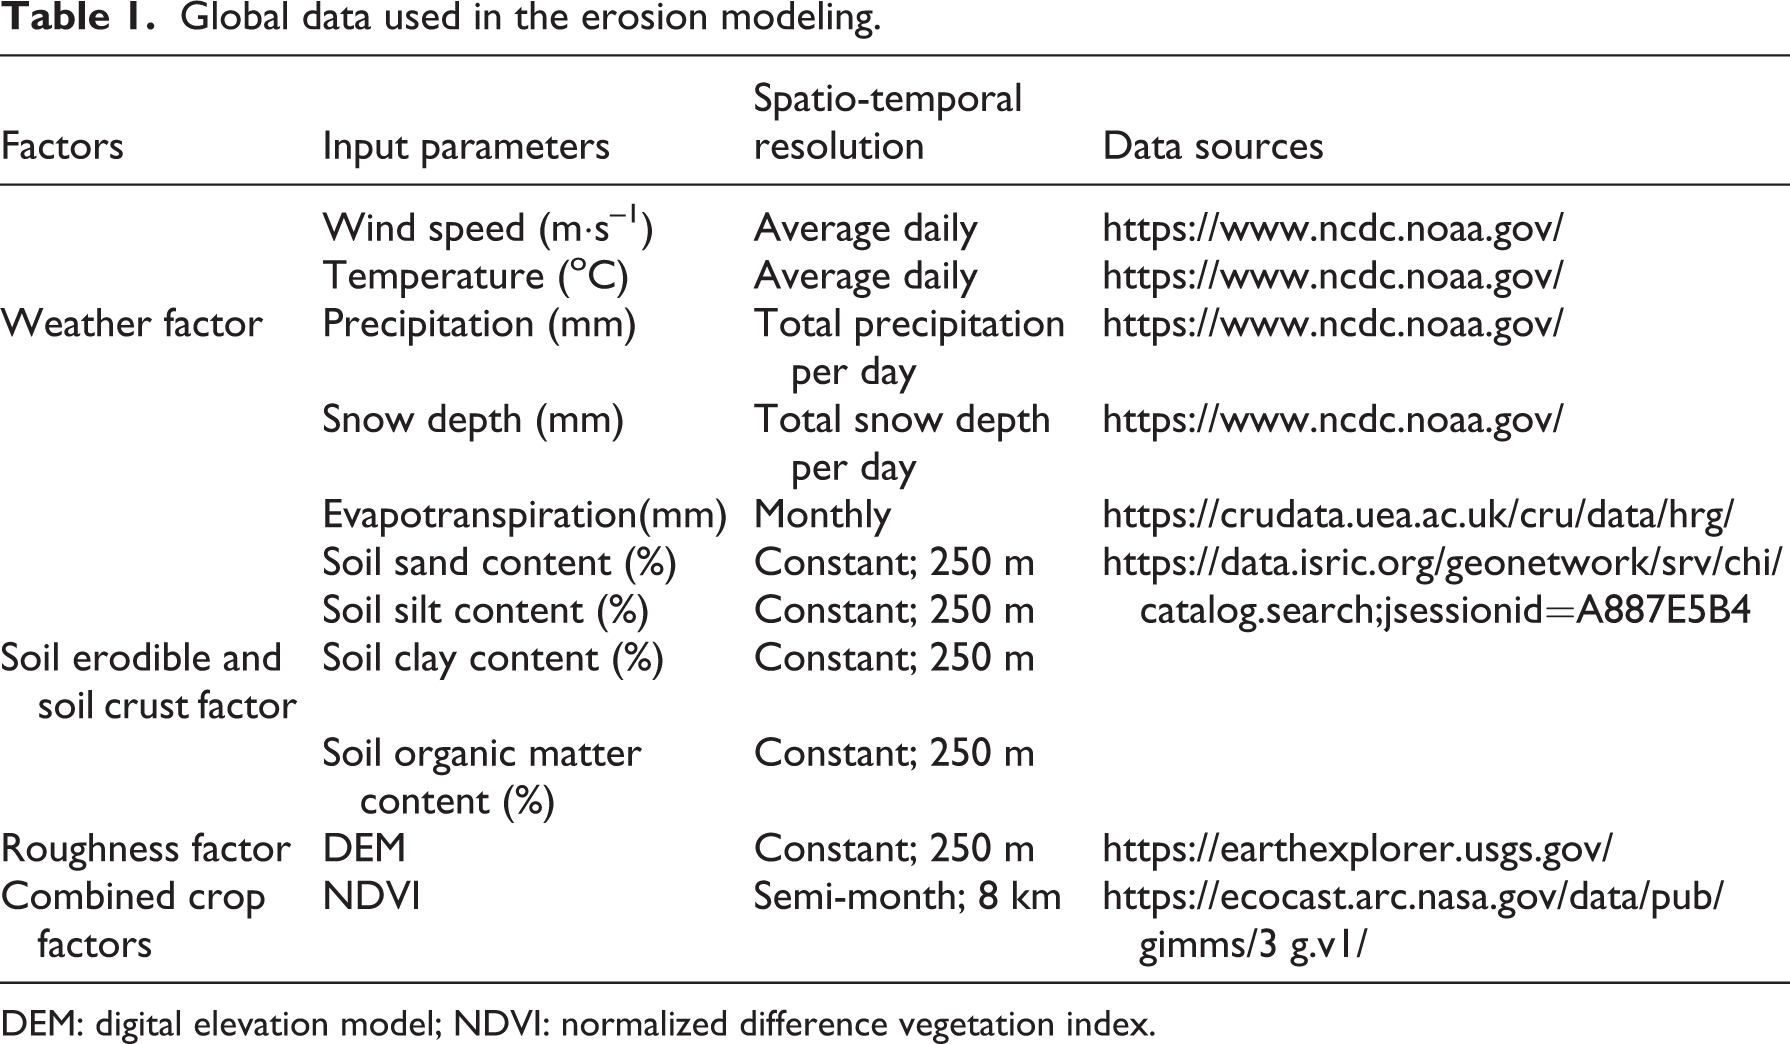
DEM: digital elevation model; NDVI: normalized difference vegetation index.
The WF can be calculated by wind speed, temperature, elevation, precipitation, evapotranspiration, and snow depth data. The wind erosion can be omitted when the wind speed is less than 5 m·s–1. The equation generally estimates wind erosion between the soil surface and a height of 2 m at a field scale (Fryrear et al., 1998).
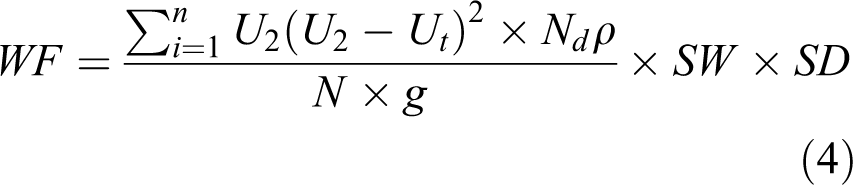
where U2 is the wind speed at 2 m (m·s–1); Ut is the threshold wind speed at 2 m (assumed 5 m·s–1); N is the number of wind speed observations (i) in a period of 1–15 days; Nd is the number of days during the observation period (normally 15 days); ρ is the air density (kg·m–3); g is the acceleration due to gravity (m·s–2); SW is the soil wetness (dimensionless); and SD is the snow cover factor. WF is the dominant controlling factor in wind erosion dynamics, mainly through its effects on wind speed, precipitation, and temperature. Among these effects, wind speed is the main climatic driving force for the wind erosion. When the WF is large, it means the wind erosion force is strong. In this study, the cosine function method was adopted to convert the daily average wind speed of global meteorological stations into hourly data.
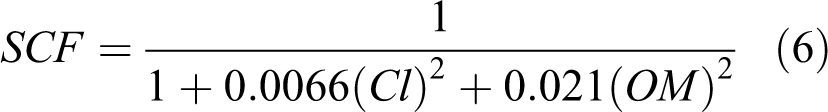
The EF and SCF can be determined from soil texture data, including the soil sand, silt, clay, and organic matter contents (Fryrear et al., 1994).
The K′ is calculated by the soil ridge roughness (Kr) and the random roughness factor (Crr) (Fryrear, 1984).

The Kr is mainly influenced by the angle between the soil ridge and the wind direction. At a global scale, we cannot obtain real data on soil roughness by using field observations and experiments. This study used terrain roughness to replace soil ridge roughness. The Crr is related to the structure and texture of the soil, particularly among analytical units with different size. The Crr in this study was set as 0 because it is difficult to quantify on a global scale. The Kr is generally determined by the Smith–Carson equation (Smith and Carson, 1977).
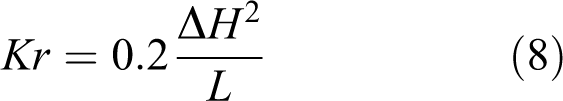
where Kr is the terrain roughness length (cm); ΔH (m) is the average height range between peaks and valleys in the area; L (m) is the average distance between peaks separated by valleys or between successive ridges (Smith and Carson, 1977).
The combined crop factors (COG = SLRf × SLRs × SLRc) reflect the weakened effects of crop canopies on wind erosion. It is very difficult to obtain the soil loss ratio coefficient for flat cover (SLRf) and plant silhouettes (SLRs) on a global scale. Consequently, the soil loss ratio for the growing crop canopy (SLRc) was used to represent the influence of the COG on wind erosion. The SLRc is determined by the following equations:

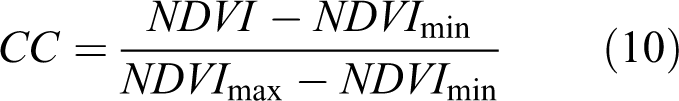
where CC (%) is the fraction of the soil surface that is covered with crop canopy. In this study, we used NDVI to quantify the vegetation coverage at the large scale. The NDVI can be obtained easily from remotely sensed images. NDVImax is the NDVI value when the cumulative probability reaches 95%; and NDVImin is the NDVI value when the cumulative probability is 5%.
The five raster factors (WF, EF, SCF, K’, and COG) of wind erosion were combined in the raster calculator modular of ArcGIS software. The wind erosion intensity was calculated based on the semi-monthly data for each raster grid across the entire period between January 2001 and December 2010. Finally, a total of 240 semi-monthly cycles of wind erosion intensity were calculated during the whole period. The Python script was used to calculate the WF, including the extraction of meteorological stations’ text data to a database (SQLite) and the creation of an index to facilitate data calculation, and to realize the calculation of WF (equation (4)) by establishing the wind_factor function.
3 Change trend detection
Unitary linear regression analysis based on pixels was used to investigate the change trend of wind erosion. (Stow et al., 2003). The slope of regression equation represents the change trend of wind erosion during different years.
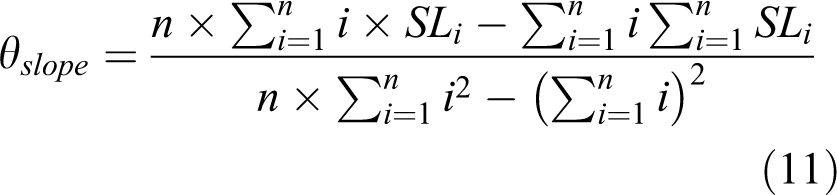
where θslope is the slope of the regression equation; n is the total number of years; SLi is the annual intensity of wind erosion in the ith year (i.e. i is 1 in 2001 and i is 10 in 2010). A negative θslope indicates that the region exhibits a decrease in wind erosion over the period, whereas a positive θslope indicates an increasing trend.
III Results
1 Global distribution of wind erosion intensity
The average intensity of global wind erosion was 6577 t·km–2·yr–1 from 2001 to 2010, with a range from 5107 to 7832 t·km–2·yr–1. During the research period, the global average wind erosion reached 583 billion tons. The spatial distribution of wind erosion varied significantly among different regions from 2001 to 2010 (Figure 1). With regard to the inter-annual variability, the highest values of wind erosion of 6916, 6928, and 7832 t·km–2·yr–1 occurred in 2002, 2008, and 2009, respectively. The model simulated lowest values of soil loss of 5534, 5107, and 5283 t·km–2·yr–1, which occurred in 2004, 2005, and 2006, respectively. In 2001–2002 and 2005–2009, the average wind erosion intensity showed an increasing trend. Among these years, the wind erosion intensity increased significantly from 2007 to 2009. In 2002–2005 and 2009–2010, the average wind erosion intensity exhibited a decreasing trend. The global average wind erosion intensity exhibited a relatively gentle fluctuation from 2003 to 2007.
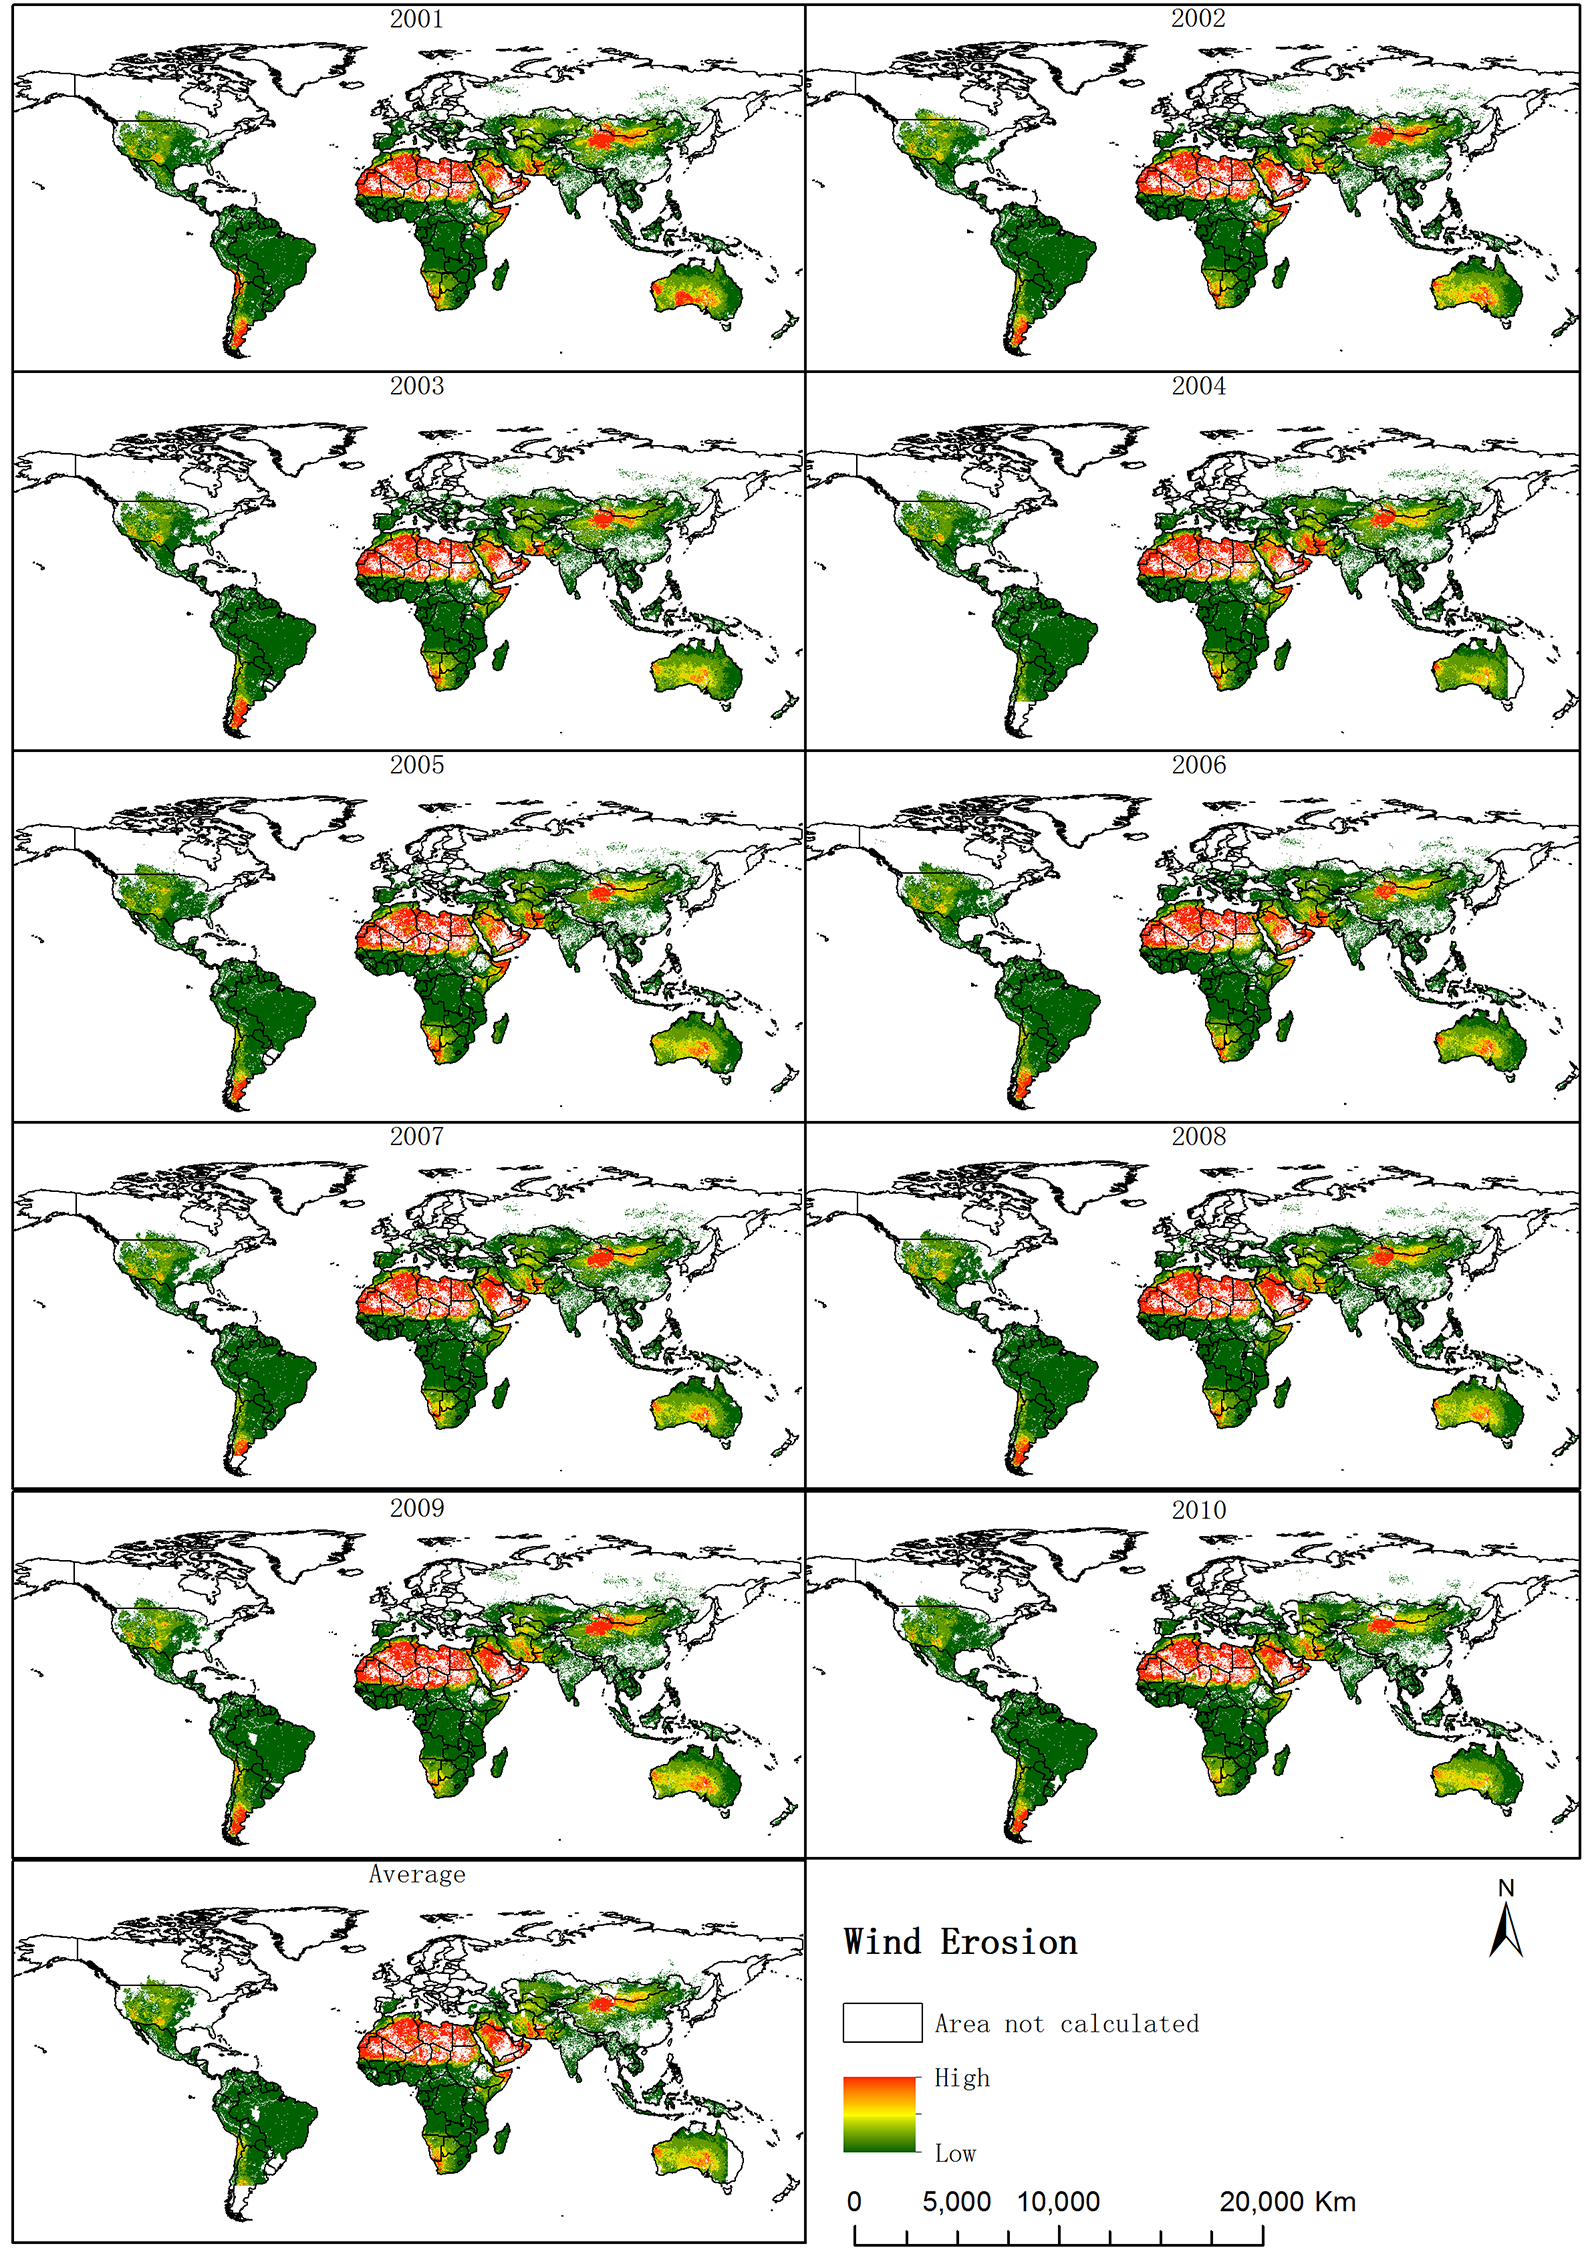
Global pattern of wind erosion from 2001 to 2010.
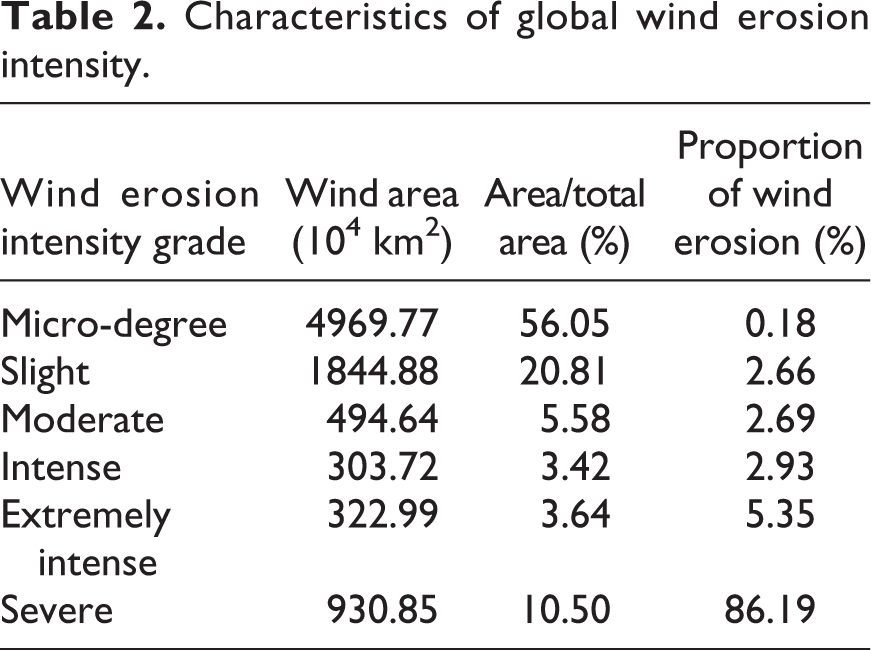
The wind erosion intensity from 2001 to 2010 was divided into six grades. They were micro-degree erosion (<200 t·km–2·yr–1), slight erosion (200–2500 t·km–2·yr–1), moderate erosion (2500–5000 t·km–2·yr–1), intense erosion (5000–8000 t·km–2·yr–1), extremely intense erosion (8000–15000 t·km–2·yr–1), and severe erosion (>15000 t·km–2·yr–1). The area that experienced wind erosion above the micro-degree was 88.67 million km2, accounting for 59.55% of the global land area (Table 2). The regions of severe wind erosion were mainly located in the Saharan desert of Africa, the Arabian Peninsula, the southeastern edge of Argentina, southwestern Namibia, southern Afghanistan, western Pakistan, and eastern Xinjiang, China (Figure 2). Severe wind erosion accounted for 86.19% of the total soil loss, but the corresponding wind erosion area only accounted for 10.84% of the global wind erosion area. The regions of intense and extremely intense erosion were concentrated in southwestern US, the transition zone between the US and Mexico, northern Chile, northwest Botswana, eastern Somalia, southeast Iran, northwest Inner Mongolia of China, and south-central Australia. Other regions of the world were experiencing wind erosion of micro, slight, and moderate degrees. Specifically, the area with degrees of micro, slight, moderate, intense, extremely intense, and severe wind erosion accounted for 56.05%, 20.81%, 5.58%, 3.43%, 3.64%, and 10.84% of the global wind erosion area, respectively.
Characteristics of global wind erosion intensity.

Levels of global wind erosion intensity in 2008.
The wind erosion area in Africa, Asia, South America, Oceania, North America, and Europe accounted for 32.93%, 28.76%, 18.89%, 9.54%, 8.76%, and 1.11% of the global wind erosion area, respectively. The average intensity of wind erosion in the above continents was 15864.66, 5369.77, 2645.22, 1728.79, 904.45, and 46.39 t·km–2·yr–1, respectively. The soil loss by wind erosion in Africa, Asia, South America, Oceania, North America, and Europe accounted for 70.34%, 20.79%, 4.4%, 3.4%, 1.07%, and 0.007% of global wind erosion, respectively (Table 3). The high-risk wind erosion areas can be identified by focusing on areas of extremely intense erosion and severe erosion. For example, the wind erosion regions of Africa and Asia were far more than the other five continents in both the erosion area and erosion intensity. The amount of wind erosion in the two continents accounted for 91.13% of the global wind erosion in the world. The wind erosion area in Africa was 1.14 times higher than that of Asia while the wind erosion amount in Africa was 3.38 times higher than that of Asia.
Comparison of wind erosion among different continents.

Note: area (104 km2); wind erosion intensity (t·km–2·yr–1); proportion (%).
2 Annual trends of global wind erosion
The slope of regression analysis quantified the increase and decrease trends of global wind erosion. The significance of the t-test represented the confidence level of the erosion trend. According to the test results, the change trends of wind erosion intensity could be divided into the following four levels: significant decrease (θslope < 0, p < 0.05), not significant decrease (θslope < 0, p ≥ 0.05), significant increase (θslope > 0, p < 0.05), and not significant increase (θslope > 0, p ≥ 0.05). The average intensity of global wind erosion showed a decreasing tendency and the average change slope was –2.42 from 2001 to 2010. The wind erosion intensity with a trend of intensification occupied 40.62% of the global wind erosion area and 4.4% of these regions showed a significant increase (p < 0.05). The wind erosion intensity in 59.38% of the global wind erosion area showed a weakening trend, among which 10.71% of the regions showed a significant decrease (p < 0.05) (Figure 3). The wind erosion regions with a significant increase were mainly located in the southwest and northern parts of the US, Chad in Africa, northern Saudi Arabia, Iraq, western Iran, and northwest parts of Australia. The wind erosion regions with a significant decrease were mainly concentrated in the easternmost corner of Brazil, the border region of Western Sahara and Mauritania, Gabon, the eastern region of Sudan, the northern region of Kenya, Yemen, the central region of Pakistan, the central region of Kazakhstan, the border between Inner Mongolia and Jilin Province of China, the southwest region of Tibet, China, the southern region of India, and the southern region of Australia.
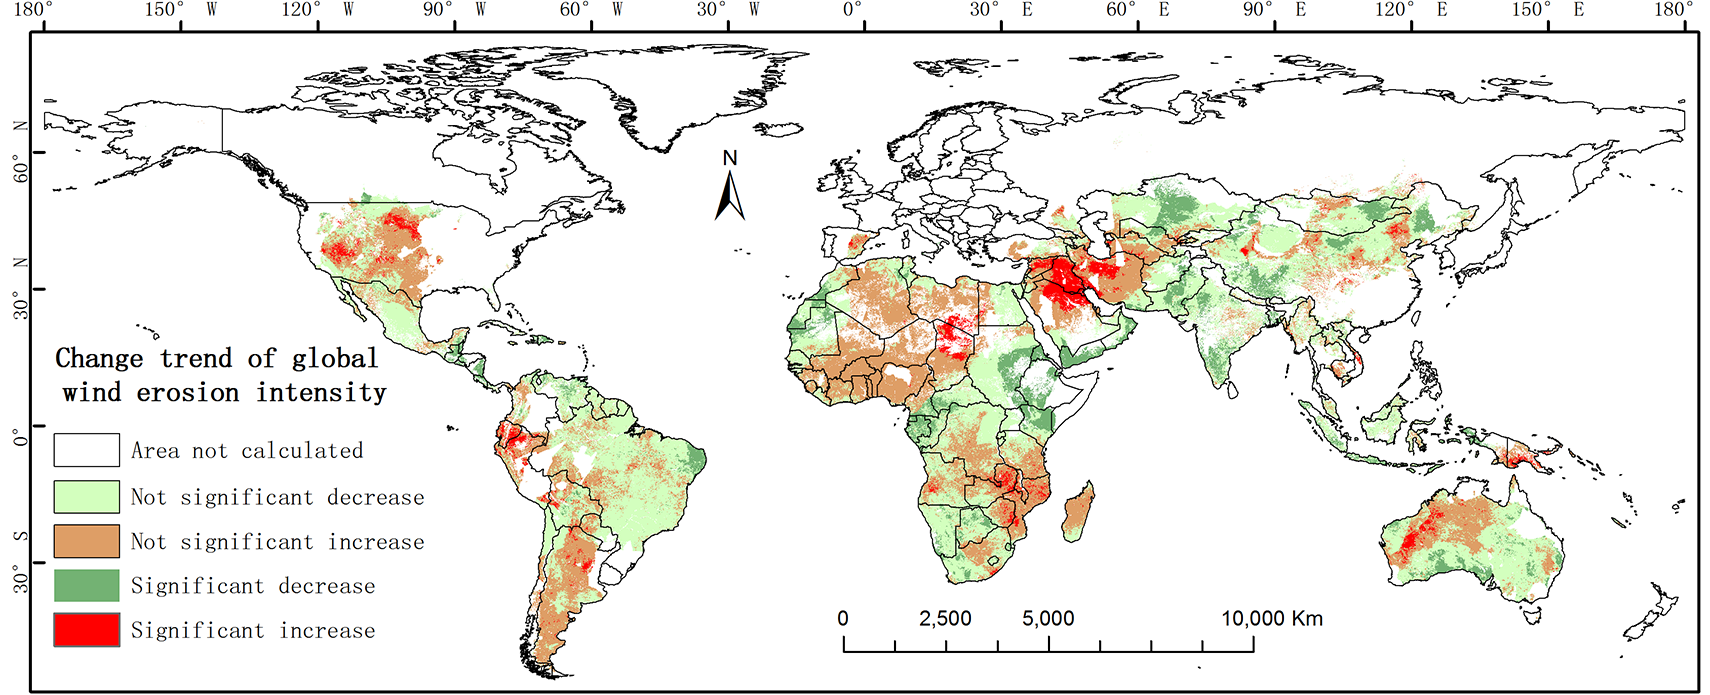
Change trend of global wind erosion intensity from 2001 to 2010.
3 Monthly variations of global wind erosion
The occurrence of wind erosion should be considered as an event rather than a long-term state, and the soil loss rates exhibited significant temporal heterogeneity within a year. It is necessary to explore the relationship between soil loss rates and their driving factors on a monthly scale, including the WF and vegetation coverage, where the EF, SCF, and K’ factors can be omitted since these factors are constant. The soil loss rates by wind erosion varied significantly in different months (Figure 4). The monthly dynamics of the soil loss rates were closely correlated with the WF changes. The high soil loss rates were mainly concentrated in spring and peaked from January to April, which coincided with the windy season. In addition, vegetation coverage can mitigate wind erosion during the period. The monthly variations of wind erosion were mainly determined by the dynamics of vegetation cover and WF. The soil loss rates peaked in spring when vegetation did not begin to appear and the wind speed reached a maximum value. In contrast, the soil loss rates were lower both in summer and winter. However, the reasons for the weak wind erosion were different in the two seasons. This study found that there was a remarkable temporal mismatch between the WF and vegetation coverage in the period of wind erosion. The decrease of WF and the increase of vegetation coverage had positive effects on reducing wind erosion in summer. Although the vegetation coverage was lower in autumn and winter, the lower wind factors had a significant effect on reducing the loss rates of wind erosion. To mitigate the soil losses caused by the temporal mismatch between WF and vegetation coverage, specific management strategies should be attempted in practices such as maintaining residues on farmlands in spring and adding cultivation windbreaks during the high wind speed seasons (Dong et al., 2001).
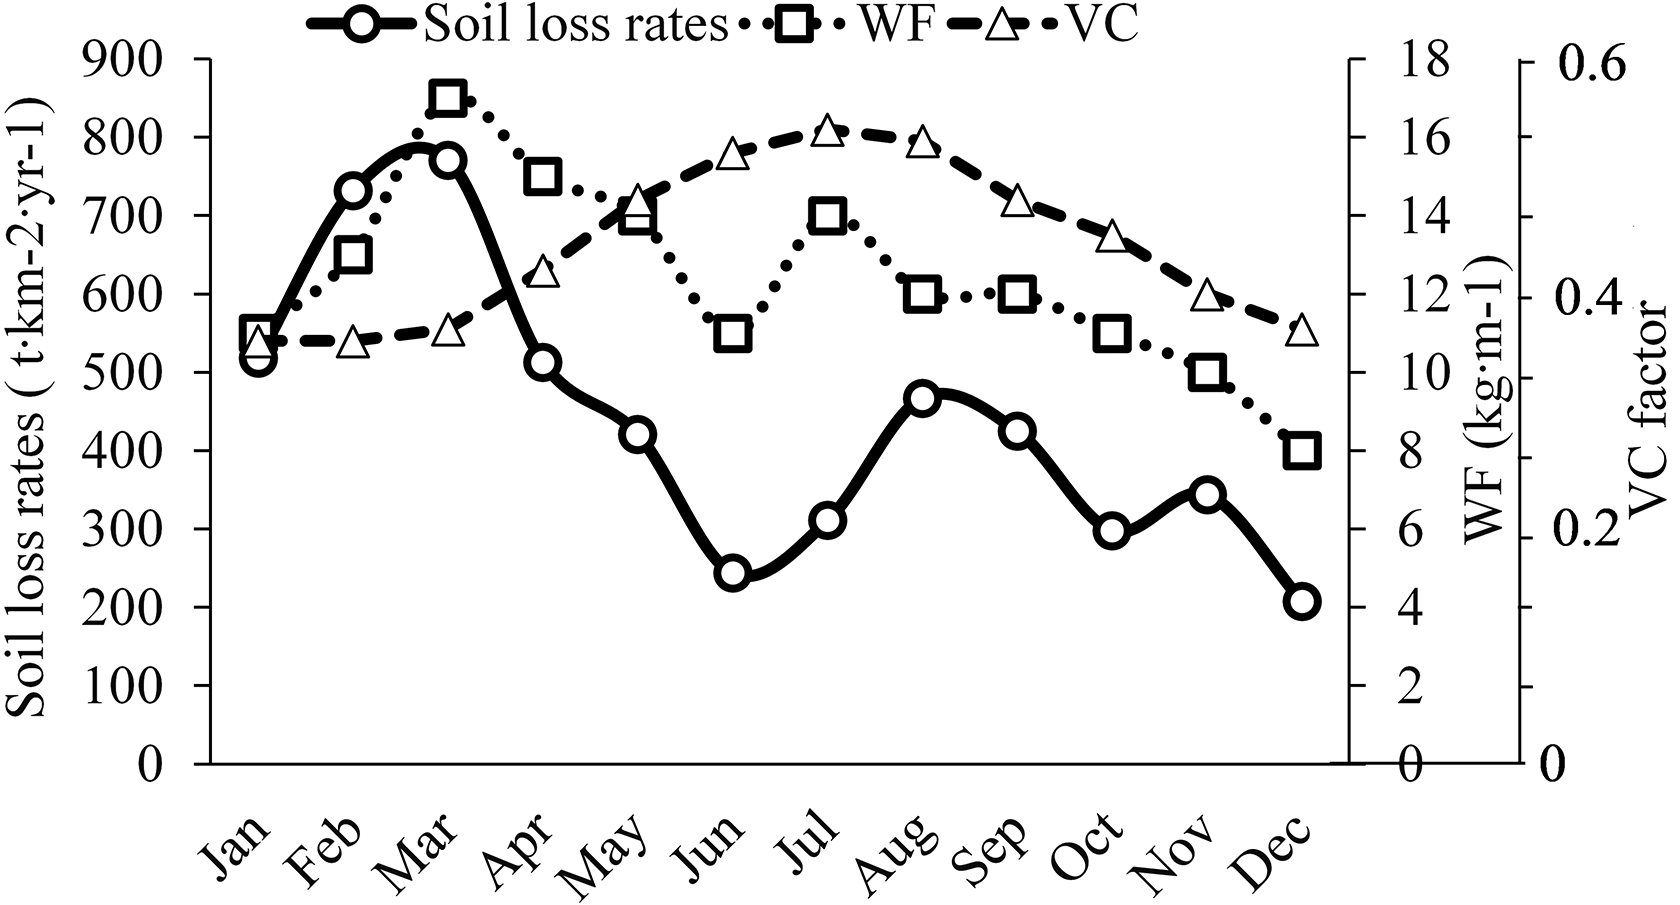
Monthly soil loss rates compared with vegetation cover values (VC) and weather factors (WF).
IV Discussion
1 The modeling tradeoff between field and large scales
Wind erosion is a serious threat to the global ecosystem and has attracted widespread attention. Global wind erosion assessment is of great significance for identifying wind erosion hot spots and defining key areas for soil conservation services. Although there are many studies of wind erosion around the world, these are mainly conducted in the field or at a local scale. In particular, the lack of large-scale wind erosion prediction models makes it difficult to obtain the temporal and spatial distribution characteristics of global wind erosion. There is also a large imbalance between the literature about wind and water erosion in terms of the number of peer-reviewed publications on large-scale soil erosion. Recent studies of water erosion models have been successfully integrated with global data; thus, the upscaling of a water erosion assessment model was available from the regional to global scale (Borrelli et al., 2017b). As for global wind erosion assessment, the combination of RWEQ and global data was a new attempt in this study. The proposed method provided a good interpretation of the temporal and spatial distribution of global wind erosion. It is an important step for closing the research gap between wind and water erosion on a large scale so that we can have a more comprehensive understanding of soil erosion. This study improved the accuracy of the RWEQ model by using distributed parameters at the global scale. The model parameters of RWEQ were calibrated by a tradeoff between the availability and the accuracy of data sources. The spatial patterns and temporal trends of global wind erosion from 2001 to 2010 were calculated and analyzed based on the distributed RWEQ model. The results provided useful information for the further evaluation of global soil conservation services and could contribute to reveal the related influence mechanisms of climate change. Figure 2 shows the large differences in wind erosion on different continents or regions. The desert regions with low average vegetation coverage have suffered the most severe wind erosion, mainly concentrated in the Saharan desert of Africa, the Arabian Peninsula, the southeastern edge of Argentina, and eastern Xinjiang, China. In the future, with the support of higher time-resolution data, the temporal and spatial distribution of wind erosion in the desert ecosystem, the grassland ecosystem, the forest ecosystem, and the farmland ecosystem can be subdivided. Figure 4 reveals the influence of climate change on the soil loss rates on a monthly scale. The decrease in wind erosion force and the increase of vegetation cover can effectively reduce wind erosion generally. Based on the unified model’s parameters and data sources, the calculation of wind erosion could be realized in different years and even in future climate scenarios. The strong data computing capability was supported by programming operations which promoted the feasibility of the global wind erosion model.
2 Model applicability and verification
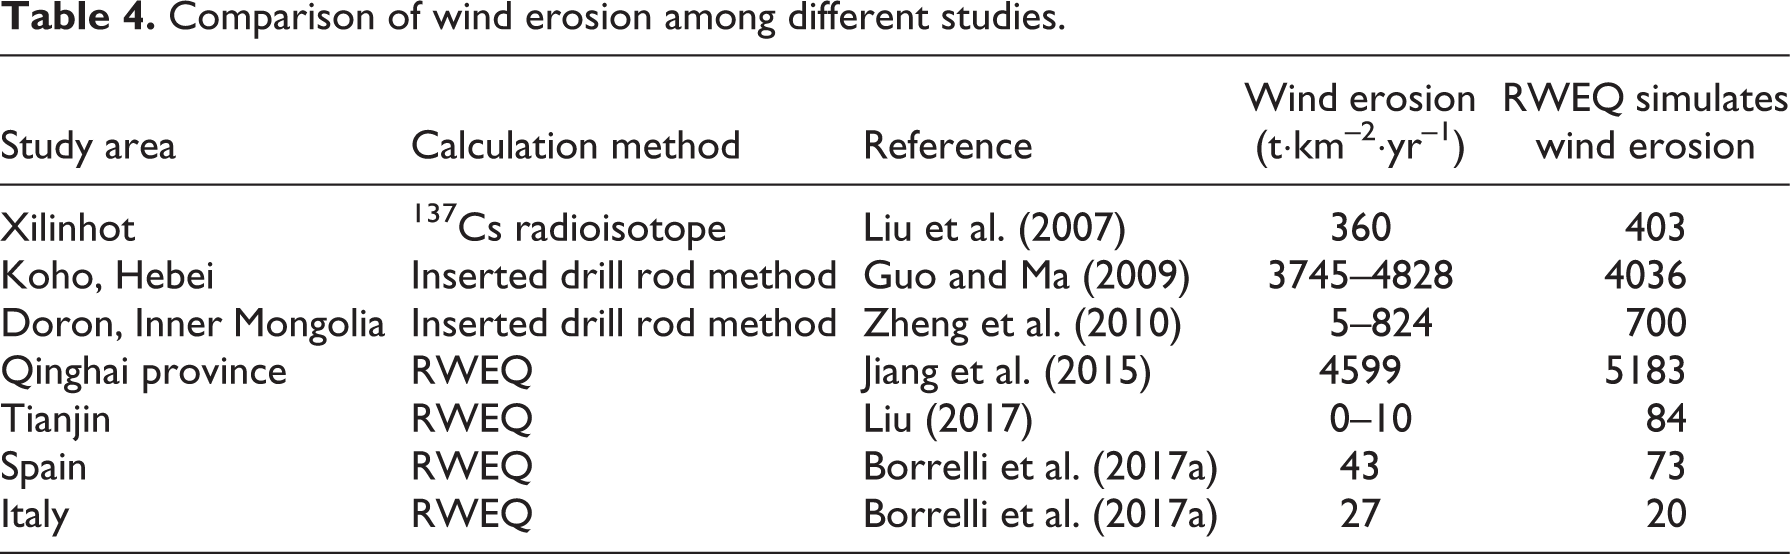
A variety of methods have been used to evaluate wind erosion, particularly for field experiments and observations, such as the common radioisotope 137Cs monitoring method, the inserted drill rod method suitable for severe wind erosion areas, the sand collection method mainly used for field surface wind erosion monitoring, indoor and outdoor soil wind tunnel experiments, the wind erosion circle method, and the profile measurement method (Feng and Wen, 2002). We compared our results with previous findings by using different methods (Table 4). Researchers used the radioisotope 137Cs as a tracer for wind erosion and reported a long-term soil loss of 360 t·km–2·yr–1 in Xilinhot, Inner Mongolia of China (Liu et al., 2007). The inserted drill rod method was adopted to measure the wind erosion intensity in Hebei and Inner Mongolia of China (Guo and Ma, 2009; Zheng et al., 2010). We also compared other studies based on the RWEQ models in Tianjin and Qinghai of China, Spain, and Italy (Borrelli et al., 2017a; Jiang et al., 2015; Liu, 2017). The simulated results of this study were generally in agreement with the wind erosion sites reported in the literature. But for some regions with slight wind erosion, our modeling results were slightly larger than previous findings in the literature, such as in Tianjin (China) and Spain (Borrelli et al., 2017a; Liu, 2017). The simulated results of wind erosion were missing in some regions because the soil of these regions was covered by snow or ice, such as in Greenland, Alaska, northern Canada, and northern Russia. In addition, if the amount of rainfall or irrigation was greater than the amount of evapotranspiration, the soil moisture factor was designated as 0 in the model. All these regions were not calculated in this study.
Comparison of wind erosion among different studies.
3 Limitations and future improvements
Several factors may influence our results and should be addressed in future studies. First, the accuracy of the RWEQ model needs to be improved by more detailed climate data. We collected the daily wind data from 5000 meteorological stations and used the cosine function method to transfer the daily data to hourly data. This process will lead to unnoticeable errors of climate data. Second, the combined crop factor of the model was calculated without considering the SLRf and SLRs parameters. Further wind erosion modeling should be improved by adding information about the soil particle contents and land administrative measures, such as surface roughness and vegetation cover. Third, wind erosion refers to the process of surface soil being destroyed and leading to creep, saltation, and suspension to other regions. In this study, our model only estimated the total transport mass between the soil surface and a height of 2 m, which represented the potential of wind erosion in the position. Further research into other physical processes would provide a more comprehensive understanding of wind erosion. Last, the analytical units were resampled into a 10-km resolution, which was relatively coarse for assessing wind erosion. With the development of remote sensing and geographic information technology, higher resolution data for using the RWEQ model will be available in the future. Anthropogenic activities should also be added in the further assessment of global wind erosion. An improved wind erosion model would provide more scientific support for the further assessment of soil conservation, carbon migration, and other ecosystem services.
V Conclusions
This study proposed a feasible spatial distributed model based on RWEQ to assess the spatial and temporal dynamics of global wind erosion from 2001 to 2010. The parameters of the model are calibrated based on the tradeoff of accuracy and availability of global data. The results showed that global wind erosion generally displayed a decreasing tendency from 2001 to 2010. The areas of slight erosion intensity occupied approximately 77% of the global wind erosion area. The areas of wind erosion in Africa and Asia accounted for approximately 62% of the global wind erosion area but accounted for 91% of the global total soil loss. The method presented in this study can serve as a scientific base for more accurate large-scale wind erosion assessments in the future.
Supplemental Material
Supplemental Material, sj-py-1-ppg-10.1177_03091333211030608 - Global assessment of wind erosion based on a spatially distributed RWEQ model
Supplemental Material, sj-py-1-ppg-10.1177_03091333211030608 for Global assessment of wind erosion based on a spatially distributed RWEQ model by Guocheng Yang, Ranhao Sun, Yongcai Jing, Muqi Xiong, Jialei Li and Liding Chen in Progress in Physical Geography: Earth and Environment
Footnotes
Declaration of conflicting interests
The authors declared no potential conflicts of interest with respect to the research, authorship, and/or publication of this article.
Funding
The authors disclosed receipt of the following financial support for the research, authorship and/or publication of this article: This work was supported by the National Key R&D Program of China (Grant Number 2017YFA0604704).
Supplemental Material
Supplemental material for this article is available online.
References
Supplementary Material
Please find the following supplemental material available below.
For Open Access articles published under a Creative Commons License, all supplemental material carries the same license as the article it is associated with.
For non-Open Access articles published, all supplemental material carries a non-exclusive license, and permission requests for re-use of supplemental material or any part of supplemental material shall be sent directly to the copyright owner as specified in the copyright notice associated with the article.