
Abstract
Among the different elements of the mountain cryosphere, ice caves still represent the lesser known part of it. Here we present a seven-year-long record of air and rock temperature in a cave of the southeastern European Alps. We demonstrate how the presence of a permanent ice deposit in the cave is not only related to the net cooling effect of the air circulation, as it is well known, but also to the occurrence of relict permafrost. Through a detailed representation of temperature patterns inside the cave, both air and rock data show how after a period of perennially subzero (cryotic) conditions in the rock, ongoing anthropogenic climate warming is responsible for permafrost degradation despite the cooling effect of the air circulation in the cave. Data support the important role of cryotic conditions in the rock in preserving a permanent ice cave deposit in the present climate, even once the possible relict permafrost inherited from the past disappears. A thickness of 29–44 m of permafrost, possibly formed during the Little Ice Age, has now almost completely disappeared. The present abrupt ice degradation observed in this cave is further exacerbated by positive feedbacks related to warmer air circulation in the cave system.
I Introduction
Recent decades have been globally characterized by increasing air temperature (IPCC, 2013). Different studies have shown that topography locally amplifies such behaviour due to snow-albedo feedbacks, decrease in snow cover, changes in vertical temperature lapse rate, changes in cloud cover and water vapor profiles (Giorgi et al., 1997; Kotlarski et al., 2015; Pepin et al., 2015). In the Greater Alpine Region (4–19°E, 43–49°N), the warming trend (1.4 K per century) has been about double the global trend over the period 1906–2005 (Brunetti et al., 2009), and in the southeastern Alps, at 2200 m above sea level (asl), temperatures have raised by about 1.8 K over the period 1851–2012 (Colucci and Guglielmin, 2015).
If mountain glaciers are considered to be sensitive indicators of climate variability (e.g. Oerlemans, 2005), and permafrost degradation in the Alps is mostly affecting the stability of rock slopes and cliffs (e.g. Beniston, 2003), the lesser known part of the cryosphere is actually represented by alpine ice caves, namely natural caves formed in bedrock (karstic massifs and lava tubes) where perennial accumulation of ice occurs (Perşoiu and Onac, 2012). Being part of ground ice, ice in caves is commonly considered a permafrost phenomenon (e.g. Colucci et al., 2017; Hausmann and Behm, 2011; Holmlund et al., 2005; Kern et al., 2011; Luetscher et al., 2005, 2013; Oliva et al., 2018), but observations on the thermal state of the rock are poorly known. Seasonal negative temperatures exceeding a depth of 20 cm are reported by Perşoiu et al. (2011) from the Scarisoara ice cave (Romania), and up to a depth of 80 cm in the Monlesi ice cave (Swiss Jura mountains) (Luetscher et al., 2008), but without demonstrating the existence of permafrost around the cave. The distribution and volume of ice in Alpine caves remain unknown, although recent studies suggest that their number could reach several thousands of units, thus representing a possible important source of freshwater storage in high-altitude karstic areas (Colucci et al., 2016b). The entrances of ice caves in the European Alps are generally higher than 1000 m asl and although they are described as permafrost phenomena, they are also reported in environments where the mean annual air temperature (MAAT) is well above 0°C (Colucci et al., 2016b; Holmlund et al., 2005; Obleitner and Spötl, 2011; Stoffel et al., 2009). The climate thresholds in the southeastern Alps for having ice caves are a mean summer air temperature <13°C and a mean winter air temperature <–2°C, while for MAAT < 2°C their number rapidly increases (Colucci et al., 2016b). A cave’s microclimate is generally described according to its thermodynamic characteristics (Luetscher and Jeannin, 2004). Caves that have only one entrance where winter cold and dense air is trapped within it are defined as static. Those exposed to density-driven air flows with warmer air flowing away from upper entrances due to its buoyancy and colder air sucked inside from the lower ones during winter (i.e. chimney effect; Balch, 1900; Thury, 1861) are defined as dynamically active. Perennial ice deposits in caves also have great palaeoenvironmental significance in preserving unique terrestrial records (Colucci et al., 2017; Kern et al., 2009; Perşoiu et al., 2017; Sancho et al., 2018) and for this reason it is important to understand the general thermal conditions for the formation, preservation and degradation of ice bodies in caves that are suffering significant mass loss worldwide (Kern and Perşoiu, 2013). This work aims to 1) describe the thermal conditions in one high-altitude karstic ice cave, taking into account air and rock seasonal regimes; 2) assess if relict permafrost occurs within the rock mass independently by microclimatic effects of air circulation; and 3) report and describe for the first time direct evidence of permafrost degradation in one high-altitude ice cave, triggering an abrupt melting acceleration of the ice deposit in the cave.
II Study area
The Leupa Ice Cave (LIC) opens at 2285 m asl on the north side of Mount Leupa (2402 m asl) located in the Canin–Kanin massif (southeastern Alps; 46°21’N, 13°26’E) (Figure 1). At the foot of the northern rock walls, between 1830 m asl and 2340 m asl, few small glaciers and ice patches still persist, representing some of the lowest evidence of present glaciation in the whole European Alps (Colucci, 2016), with a total area of 0.28 km2 in 2012 (Colucci and Žebre, 2016). Dolostones and limestones of the Norian–Rhaetian platform (Dolomia Principale and Dachstein limestone) are the prevalent lithologies, although Jurassic limestones are also present on the western and southern side of the massif. The landscape is largely characterized by glaciokarst (sensu Žebre and Stepišnik, 2015) and several ice caves are reported in the area with a median elevation of the entrances at 1871 m asl (Colucci et al., 2016b).
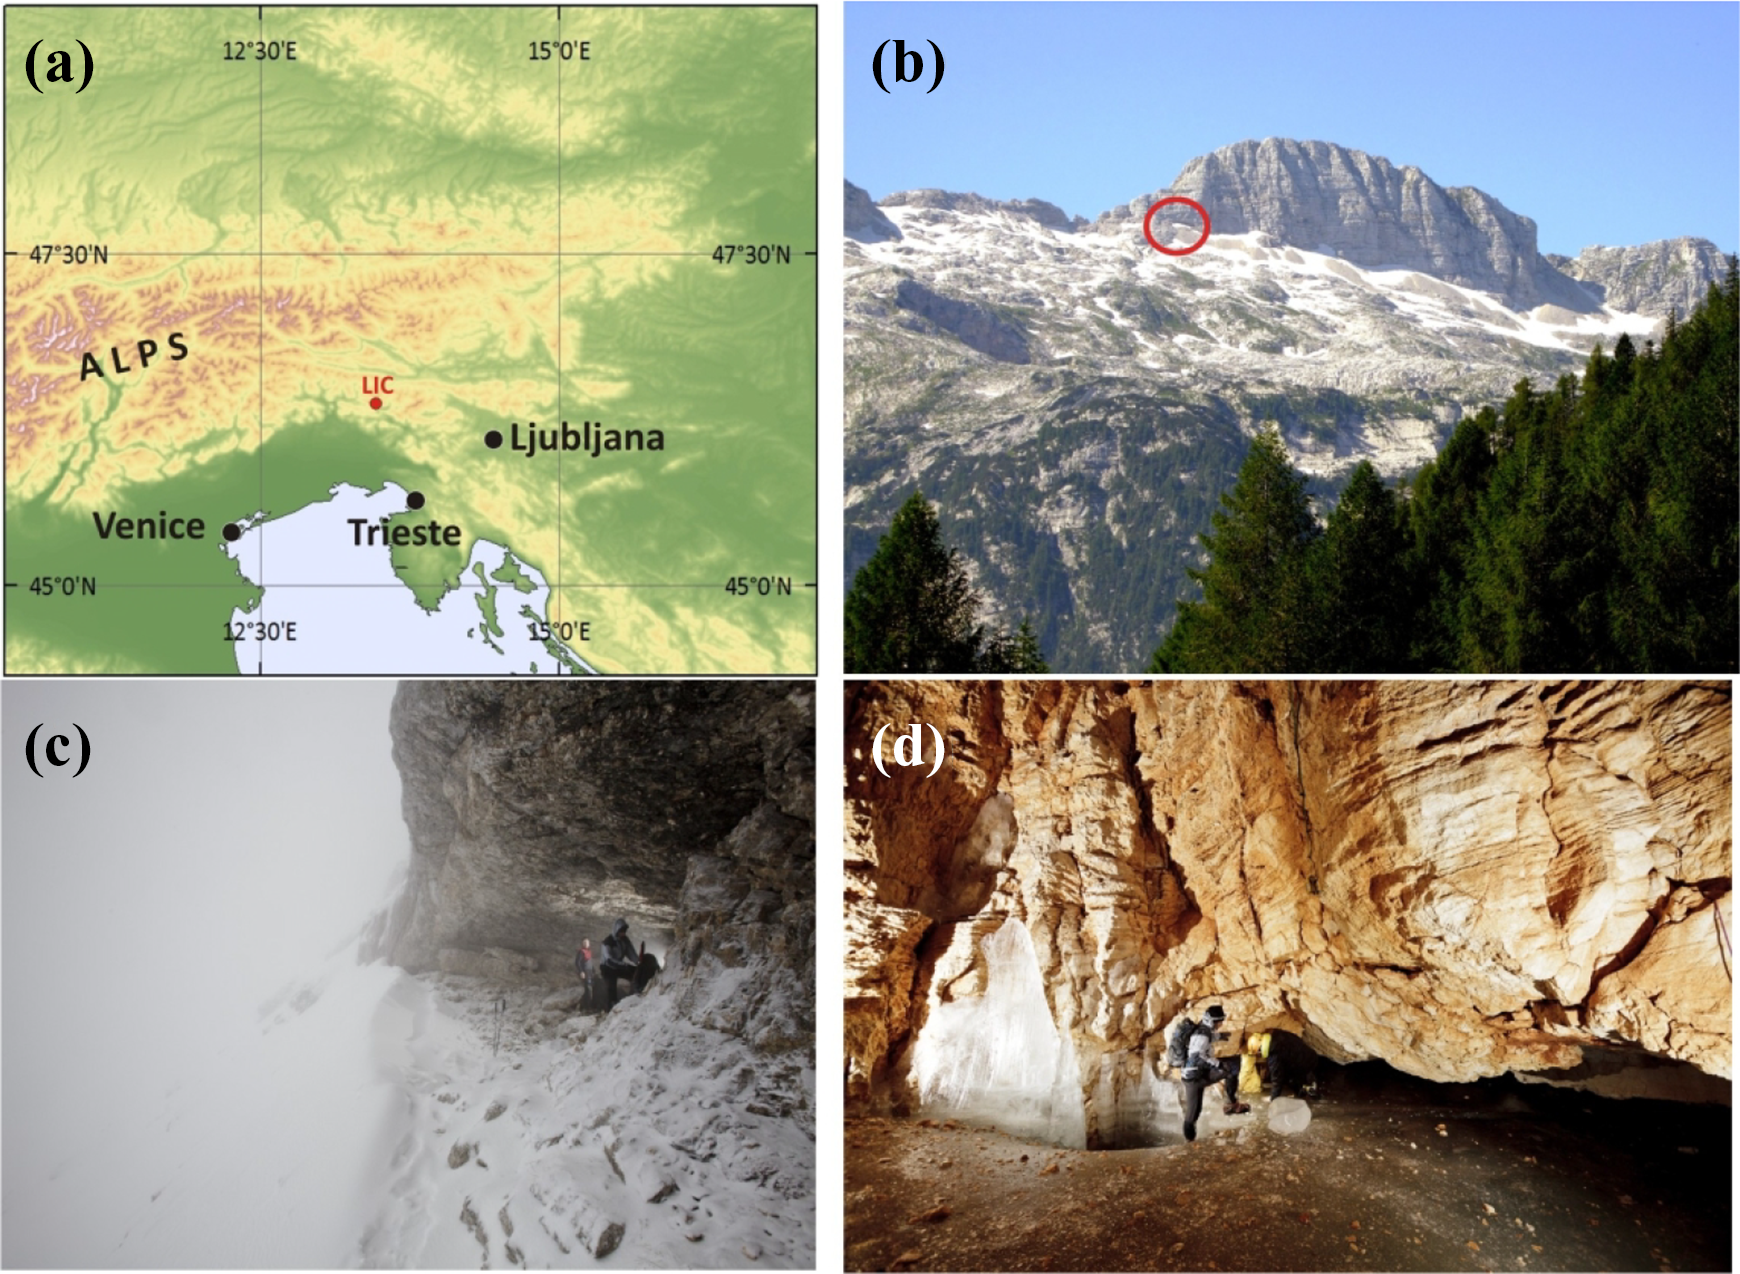
Overview of the study area and monitored ice cave. (a) Location of LIC in the southeastern European Alps. This map has been created with the software ArcMap version 10.1 and is based on digital elevation information from the Shuttle Radar Topography Mission (http://srtm.csi.cgiar.org), further edited using the CorelDRAW graphic suite, release X3 (http://www.corel.com). (b) The large entrance of the LIC located on the north face of Mount Leupa. (c) A close-up view of the entrance. (d) The main ice deposit within the LIC. Photograph (b) was taken by RR Colucci; photographs (c) and (d) were taken by F Giraldi.
The climatology of the Canin area (temperature and precipitation) for the 1981–2010 period has recently been reconstructed at 2200 m asl by Colucci and Guglielmin (2015). Mean annual precipitation is equal to 3335 mm water equivalent (WE), while MAAT is 1.1°C (σ = 0.6). The precipitation regime presents two peaks in spring and fall (maximum of 436 mm WE in October), with February being the “driest” month (134 mm WE). High precipitation influences the mean winter snow accumulation, which is 7.0 m at 1830 m asl. The warmest month is July (9.2°C) and the coldest is February (–6.0°C). At roughly the end of the Little Ice Age (LIA; 1851–1880) MAAT was equal to –0.3°C (σ = 0.8; Colucci and Guglielmin, 2015). The altitude of the mean annual 0°C isotherm is estimated at 2370 ± 90 m asl (Colucci et al., 2016a) – roughly 100 m higher than the main entrance of the LIC. The –2°C isotherm, which defines environments where frost action is dominant, is estimated at 2665 ± 90 m asl.
LIC hosts a ca. 500 m3 sub-horizontal and layered ice body, averaging ca. 3 m in thickness. The complex air flow system, characterized by three or more cave entrances at different altitudes, classifies the cave as dynamically active (Bertozzi et al., 2019). The main entrance is represented by a 13-m-wide and 4-m-high opening. Intense dripping is active next to the main chimney in the middle of the cave (Figure 2(a)) through which major rain events occasionally flood the cave and cause a surficial melting with the formation of decimetric-in-size meandering surficial melting streams (bediéres). Air inflows are also acting through debris accumulated at the base of the ice deposit, resulting in a progressive widening of a dome-shaped melting cavity underneath the ice body.
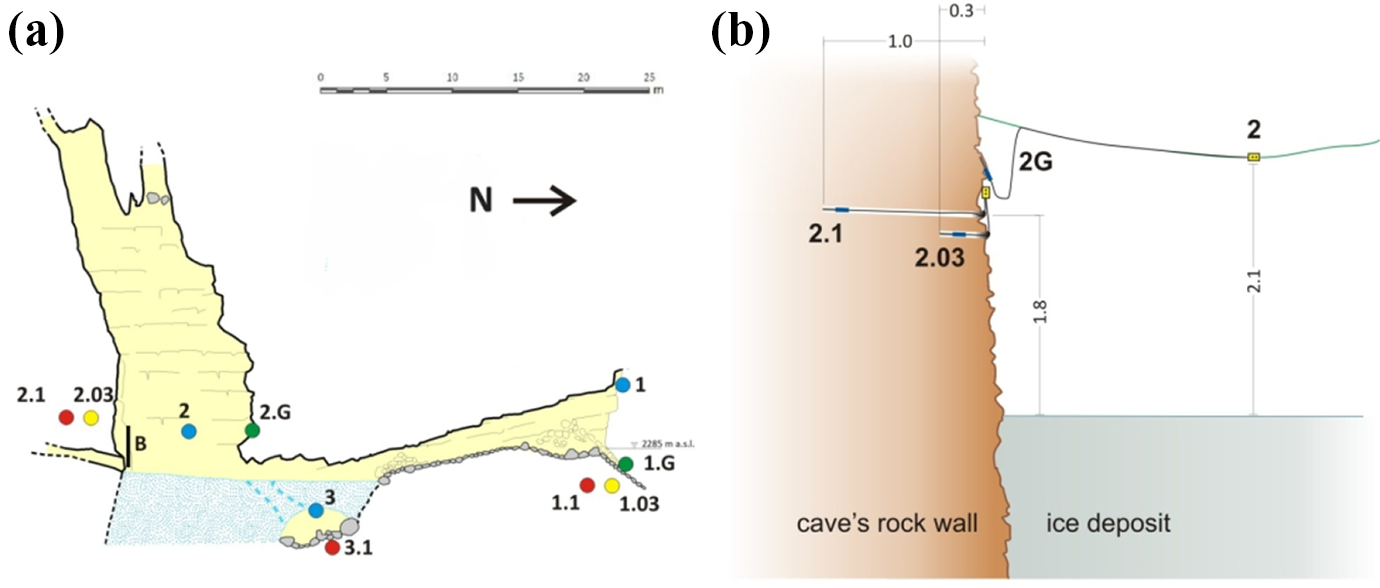
Locations of data loggers in the cave. (a) Locations of the data loggers and probes reported in different colours and named accordingly: red dots = rock temperature at a depth of 100 cm; yellow dots = rock temperature at a depth of 30 cm; green dots = rock temperature at a depth of 2 cm; blue dots = air temperature. (b) Specific details of the monitoring sites. Probes at locations 1, 1.03, 1.1 and 1G in (a) follow the same scheme, while at location 3.1 the thermistor is vertically inserted in the debris at the cave bottom. The map in (a) was created using the software ArcMap version 10.1 and is based on an original survey performed by Michele Potleca in summer 2011 using a Distance Meters Leica model A3 combining a digital compass and a clinometer. The sketch in (b) has been edited by using the CorelDRAW graphic suite, release X3 (http://www.corel.com).
The area above the cave is ice-free at present, and it was likely so even during the coldest periods of the Holocene Colucci et al. (2014). Nevertheless, the entrance of the cave is occasionally sealed by snow and avalanches during very wet winters at present climatic conditions.
III Data and methods
Air and rock temperatures in the LIC are measured in three different locations using ®Tynitag-plus-2 data loggers, equipped with a built-in sensor, and thermistor probes with an accuracy of 0.35°C and a resolution of 0.01°C. Air temperature at the entrance of the cave was measured in the upper part of the entrance (Figure 2: site 1), while rock temperatures at 100 cm, 30 cm and 2 cm (Figure 2: sites 1.G, 1.03 and 1.1) were measured a few meters apart from the entrance. At the base of the large chimney over the ice surface, rock temperatures are measured at depths of 100 cm, 30 cm and 2 cm (Figure 2: sites 2.1, 2.03 and 2.G), while air temperature is measured at about 210 cm above the ice surface (Figure 2: site 2). In the melting cavity underneath the ice body, air temperature is measured 50 cm above the debris surface and 100 cm below the ice ceiling, while temperature in the ground is measured with a probe inserted in the debris at 100 cm depth (Figure 2: sites 3 and 3.1). The nearest automatic weather station (AWS) is located ca. 2 km west from the cave entrance at 2203 m and is taken as reference for the Canin air temperature conditions in the area. Temperature is recorded at all the locations every 30 minutes, collecting the two extremes of the interval (minimum and maximum) and then averaging them.
IV Results
1 Air temperature patterns
The cave’s air temperature (plotted in 2 in Figure 3(a)) is logged since July 2011 and shows a mean value of –0.91°C (extremes –12.1°C and 2.9°C). A well-defined annual cycle with maxima between the end of August and September and minima between November and March is observed. There is a delay of about one month in the occurrence of summer maxima with respect to outside the cave, while winter minima occur almost synchronously with the cold spells affecting the area (Figure 3(a)). Summer temperature extremes in the cave are 13–17°C lower than the outside climate, while winter extremes are 6–10°C higher than the outside climate. Temperature at the entrance of the cave (‘1’ in Figures 2 and 3) was recorded only between summer 2012 and fall 2013 and closely mirrors the outside temperature changes recorded at the Canin AWS (2 km east from the entrance of Leupa at 2203 m asl; not shown in Figure 2 because it is too close to the LIC) from late spring to winter, except when windblown snow clogs the cave entrance, as in the case of winter 2012–2013, highlighted in Figure 3(a). The main differences between these two spots are related to spring and early summer due to low insolation and the north-facing LIC entrance, leading to lower temperatures.
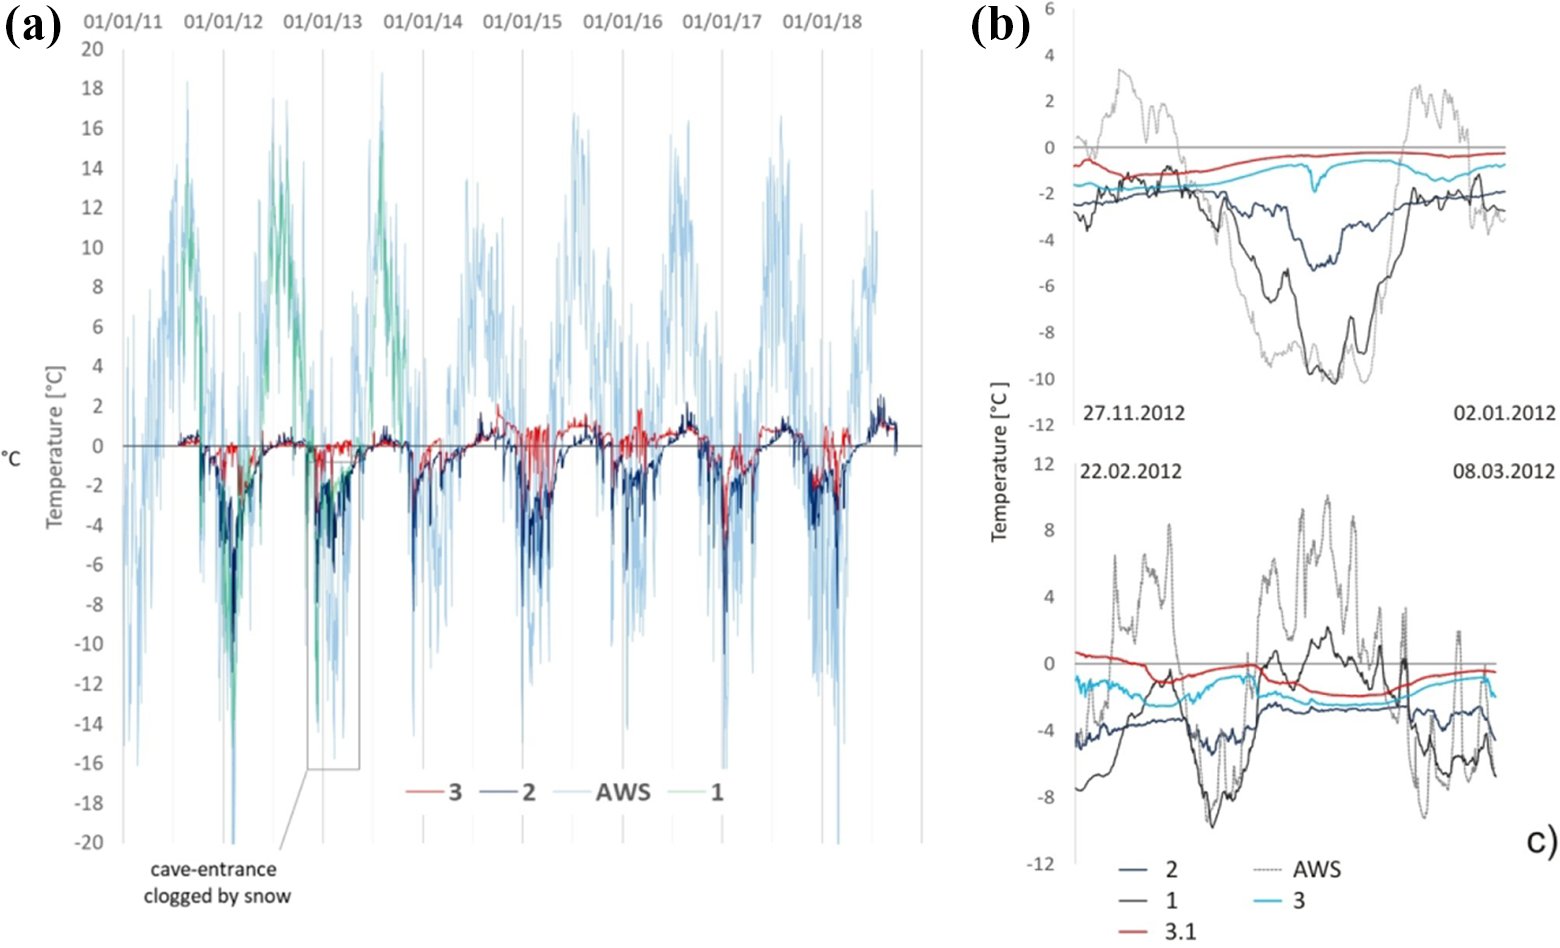
Air temperature inside and outside the cave. (a) Daily mean air temperature outside the cave at the AWS (light blue; site located 2 km east from the entrance of Leupa at 2203 m asl and not shown in (a) because it is too close to the LIC) and at the entrance of the cave (1, light green), as well as in the cave recorded above (2, dark blue) and below (3, red) the ice deposit. (b), (c) Details of winter decoupling with examples from 27 December 2011 to 2 January 2012 and from 22 February 2012 to 8 March 2012. The air temperature recorded above (2) and below (3) the ice deposit in the cave, at the entrance of the cave (1), in the debris at a depth of 100 cm below the ice deposit (3.1) as well as at the Canin AWS are also shown for comparison.
The cave’s air temperature behaviour below the ice surface at location 3 is decoupled from the air temperature above the ice surface at location 2 generally during winter but at times during spring and fall as well (Figure 3(a)). In Figure 3(b) and (c), the temperature outside AWS and at location 2 are in phase, while the inversion of the temperature trend recorded at 100 cm depth in the debris (curve 3.1 in Figure 3(b) and (c)) indicates an inflow of warmer air from the unexplored parts of the cave complex below. This is more evident in the fall 2014 (red curve, Figure 3(a)). Since then, the temperature, which was only occasionally above the 0°C threshold in the previous three years, has exceeded 2°C and drastically changed its behaviour, with temperatures below the 0°C threshold only being recorded occasionally. An apparent different behaviour is observed again during winter 2017, with much lower temperatures recorded at that location.
The air temperature in the ice cave is in agreement with what Schöner et al. (2011) observed in the Eisriesenwelt Cave (Austria), where inside air temperature falls, triggered by air pressure gradients, as soon as air temperature outside the cave drops below that inside. Several authors already identified air circulation as the most relevant mechanism for assessing cave climates and, thus, the evolution of the underground cryosphere (Bertozzi et al., 2019; Cigna, 1968; De Freitas et al., 1982; Luetscher et al., 2008; Obleitner and Spötl, 2011; Perşoiu et al., 2011). In the LIC cave, air temperature is often decoupled from outside temperatures, as in the case of winter 2013–2014 (Figure 3), suggesting that the cave entrances were likely sealed by windblown snow and avalanches.
2 Rock temperature
The amplitude of temperature oscillations of the rock generally follows pure conduction, with a progressive attenuation and delay of the heat wave with depth (Figure 4).

Rock surface temperature inside and outside, and temperature attenuation with depth. (a) Example of the attenuation and delay of the heat wave recorded while proceeding from the rock surface temperature to the deepest temperatures. This plot presents the temperatures recorded every 30 minutes between 26 October and 2 November 2012 in the LIC; after 10 hours location 2.G receives the heat wave associated with the temperature drop of air temperature inside the cave (2). After 26 hours, the heat wave reaches a depth of 30 cm in the rock (2.03), and after 90 hours it reaches a depth of 100 cm (2.1). Phases of zero curtain effect are also detectable in all the locations. (b)–(d) Rock temperature at a depth of 2 cm at locations 2.G and 1.G (IN and OUT) in three different periods of the year: (b) 28 November 2012–7 February 2013, where IN is higher than OUT, although always <0°C; (c) equilibrium phase between 7 February 2013 and 14 June 2013, where IN is lower than OUT, although always <0°C; and (d) 1 July 2013 to 1 November 2013, where OUT is largely higher than IN, but OUT >> 0°C and IN is around 0°C.
The available data for rock surface temperature (RST; measured at 2 cm in rock outside the cave at location 1.G) reflect the air temperature at the cave entrance (1) but show a different behaviour inside the cave.
This is highlighted by thermistors located inside the cave (IN) at location 2.G and outside the cave (OUT) at location 1.G (Figure 1(e)), as illustrated in Figure 4(b) to (d). The late-autumn-to-winter phase, when the entrance of the cave is totally in shade and the external temperature shows the fastest annual temperature drop, is characterized by milder values inside the cave (Figure 4(b)), although both locations record <0°C values. In contrast, the winter-to-spring phase is characterized by more constant differences but with IN higher than OUT (Figure 4(c)), whereas the summer phase is characterized by OUT >> IN and IN close to 0°C (Figure 4(d)). Between July 2011 and late-August 2014, positive temperatures at 30 cm depth at location 2.03 occurred only a few weeks per year during late summer and early autumn, reaching maxima between 0.1°C and 0.2°C (Figure 5(a)). Over the same period, at 100 cm depth (location 2.1), cryotic conditions (perennially subzero) were recorded. The active layer thickness (portion of the rock that seasonally thaws and freezes) before late August 2014 ranged between 0 and 99 cm at location 2.1, and from 335 to 474 cm at location 1.1.

Rock temperature and the permafrost degradation event. (a) Rock temperature at two depths (30 cm and 100 cm; 2.03 and 2.1) (b) The permafrost degradation event observed on 18 September 2014 (black arrow). The temperature recorded in the rock at a depth of 100 cm (2.1) shows an abrupt temperature rise of about 0.7°C, while the temperature recorded at 30 cm depth (2.03) and 2 cm depth (2.G) shows a temperature drop. The temperature at location 2.1 is decoupled from the shallowest rock temperatures, suggesting the heat wave was coming from inside the rock massif and was not driven by pure conduction from the cave environment. (c), (d) Normalized probability distribution of temperature at AWS (air temperature outside at 2200 m, blue), at location 2 (air temperature inside the cave, orange) and at location 2.1 (rock temperature 100 cm depth, black) (c) before and (d) after the thawing event. Arrows in (b) indicate the occurrence of the permafrost degradation event of 18 September 2014 and a severe rainfall event between 5 and 11 November 2014.
From the beginning of August 2014 up to 18 September 2014, the rock temperature at location 2.1 was likely affected by the thawing of a certain amount of ice content within the rock. This is testified by the ending of quite a long zero curtain period (during which, the temperature remained stable at the melting point due to the release of latent heat) (Figure 5(a) and (b)). On 18 September, the temperature increased in a few hours by about 0.6°C (Figure 5(b)); therefore, rock conditions suddenly passed from a permafrost to a non-permafrost state. Surprisingly, this sharp increase, which started at 100 cm depth, was not recorded at location 2.03 (at a depth of 30 cm) as well as at 2 cm and in the air. This event during August–September 2014 seems not to have changed the climatology of the cave, as demonstrated by the normalized probability distribution of temperature before (Figure 5(c)) and after (Figure 5(d)) the permafrost degradation event. Starting from summer 2015, a shortening of the period, during which rock temperature raise above the 0°C threshold, is observed at 100 cm depth, and the absolute maximum values recorded every subsequent year show a decreasing trend from 2014 onward (Figure 5(a): 2.1). Summer 2017 reached the lowest maximum temperature (0.39°C) and the shortest period of positive temperatures (97 days) when compared to the previous three years (0.58°C and 150 days in 2016, and 0.61°C and 165 days in 2015). Nevertheless, summer 2018 again presented higher summer temperatures after the cave was clogged for several weeks during the previous winter.
V Discussion
If we consider the linear regression between the Canin air temperature and the rock surface outside the cave at location 1.G (equation (1)), where the LIC is located, this is quite well coupled with the air temperature:

where ρ is the rock surface temperature and τ is the air temperature. At present climate, by applying a normal lapse rate of 0.0065°C·m–1, the current MAAT at the cave entrance is around 0.6°C and the mean annual RST (MARST) is around 0.7°C excluding permafrost formation in the examined area. Therefore, how is it possible to explain the occurrence of permafrost conditions in the rock walls of the LIC, its degradation documented by the thaw event of late August 2014 and its successive aggradation? One possible and relatively easy explanation is that the air circulation is responsible for the permafrost around the cave. The cold air environment formed in the cave in fact mimics in the long-term climate conditions favourable for permafrost development and conservation. Low temperatures recorded during the winter, but especially low temperatures measured in the summer, could explain the presence of permafrost around the cave environment. If this is correct, the heat wave produced by a progressive warming cave environment due to ongoing climate warming should propagate from the cave walls to the deepest thermistors. Instead, the event of 2014 indicated that a positive heat wave moved from the deepest thermistor to the surface, suggesting the absence of negative temperatures at deeper depths and, therefore, the absence of permafrost. If this is correct, another possible explanation is that cryotic conditions in the rock in this cave were inherited from the past. Reconstructing the paleo-MARST at the entrance of the cave with equation (1), and by using the MAAT from Colucci and Guglielmin (2015), we obtain a MARST equal to –0.6°C during the LIA. Therefore, from the mid-1940s onward, it was only eventually during the 1970s (Figure 6) that possible permafrost conditions occurred at the elevation of the LIC.
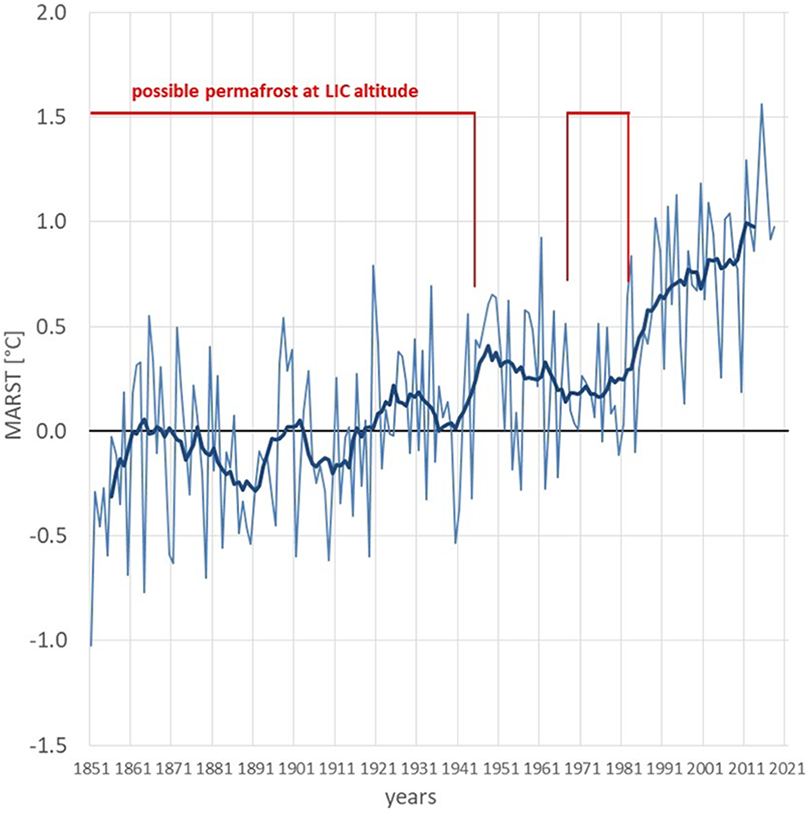
Evolution of MARST based on applying equation (1) using 1851–2012 MAAT from Colucci and Guglielmin (2015). Annual MARST (light blue) at the elevation of the LIC and the same record (in bold) filtered using an 11-year centred running mean.
Considering a thermal conductivity ranging between 2.88 and 4.4 Wm–1K–1 (Guglielmin et al., 2018; Schnepfleitner et al., 2017), a heat flow of around 0.06Wm–2 (Della Vedova et al., 1995) and equation (2) derived from the theory of heat conduction in solids (Carlsaw and Jaeger, 1959),

where Zp is the permafrost thickness, K the thermal conductivity and Qg is the heat flow, cryotic conditions from the slope should have formed a permafrost thickness of between 29 and 44 m during the LIA, allowing permafrost conditions to occur within the cave independently of the cave’s air circulation (Figure 7(a)).
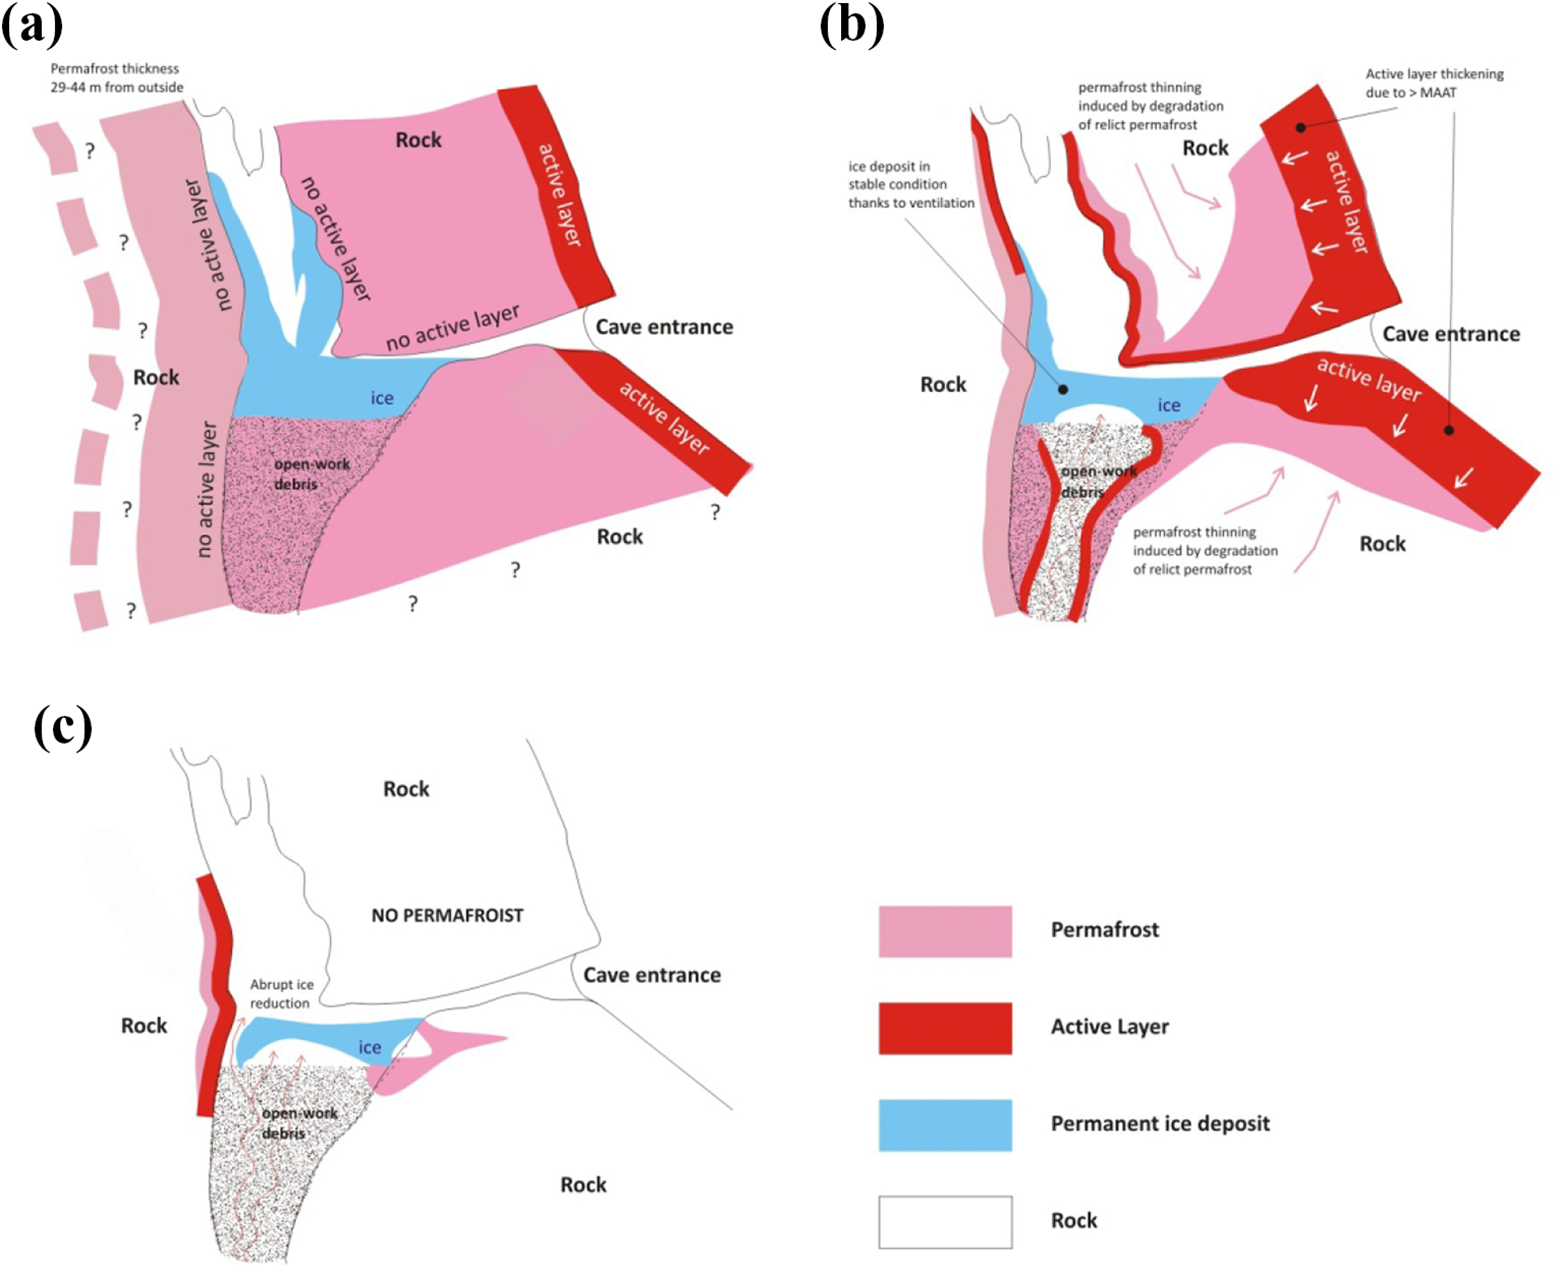
Permafrost evolution modelled in the LIC for the (a) LIA, (b) recent climate and (c) present condition when abrupt ice melting is observed.
Following the MARST pattern at the entrance of the cave, a progressive degradation with a permafrost thinning from the “base” and a thickening of the active layer from the “top” is expectable (Figure 7(b)). Thinning at the “base” can be also very slow when there is a certain amount of ice present, because of latent heat associated with the change of phase (e.g. Osterkamp and Gosink, 1991). In our case, it is reasonable to assume that this process could be started in the 1990s, and in the absence of any cooling effect related to the air circulation in the cave, permafrost should have disappeared much earlier. Therefore, the role of air circulation was responsible in keeping the rock temperature around the cave at values sufficiently low for preserving a thin permafrost layer, thus avoiding any significant effects on the melting of the ice deposit up until 2014 events.
Recent permafrost degradation is also well documented by the abrupt change that the ice body is now undergoing at the rock–ice contact. Initial observations made from summer 2010 to the 2014 event, showed ice always in contact with the rock walls, testifying to the cryotic conditions of the rock (Figure 8(a) and (b)). Since 2014, the ice has been gradually detaching from the rock and, in several parts of the cave, the ice is now 5–20 cm away from the rock (Figures 7(c) and 8(c)). This produces a further positive feedback with milder air circulating from deeper parts of this cave system (unknown) all around the ice body (Figure 7(c)). In this particular case, the cryotic conditions of the rock were, therefore, essential to the formation, preservation and aggradation of a permanent ice deposit in the cave environment, not only because ice accumulation is favoured, but also because ice in contact with a frozen rock surface prevents positive feedbacks associated with warmer air circulation. On the other hand, the first abrupt decrease in the ice surface topography, observed in fall 2014, was probably not only triggered by the heating of the rock walls, but also by a series of severe precipitation events affecting the area in early November 2014. This extreme precipitation event (ca. 800 mm rain in 10 days; Colucci et al., 2016b) took place 1.5 months after the thaw event (Figure 5(b)) and brought about the formation of a deep meandering incision (bediéres) over the ice topography.
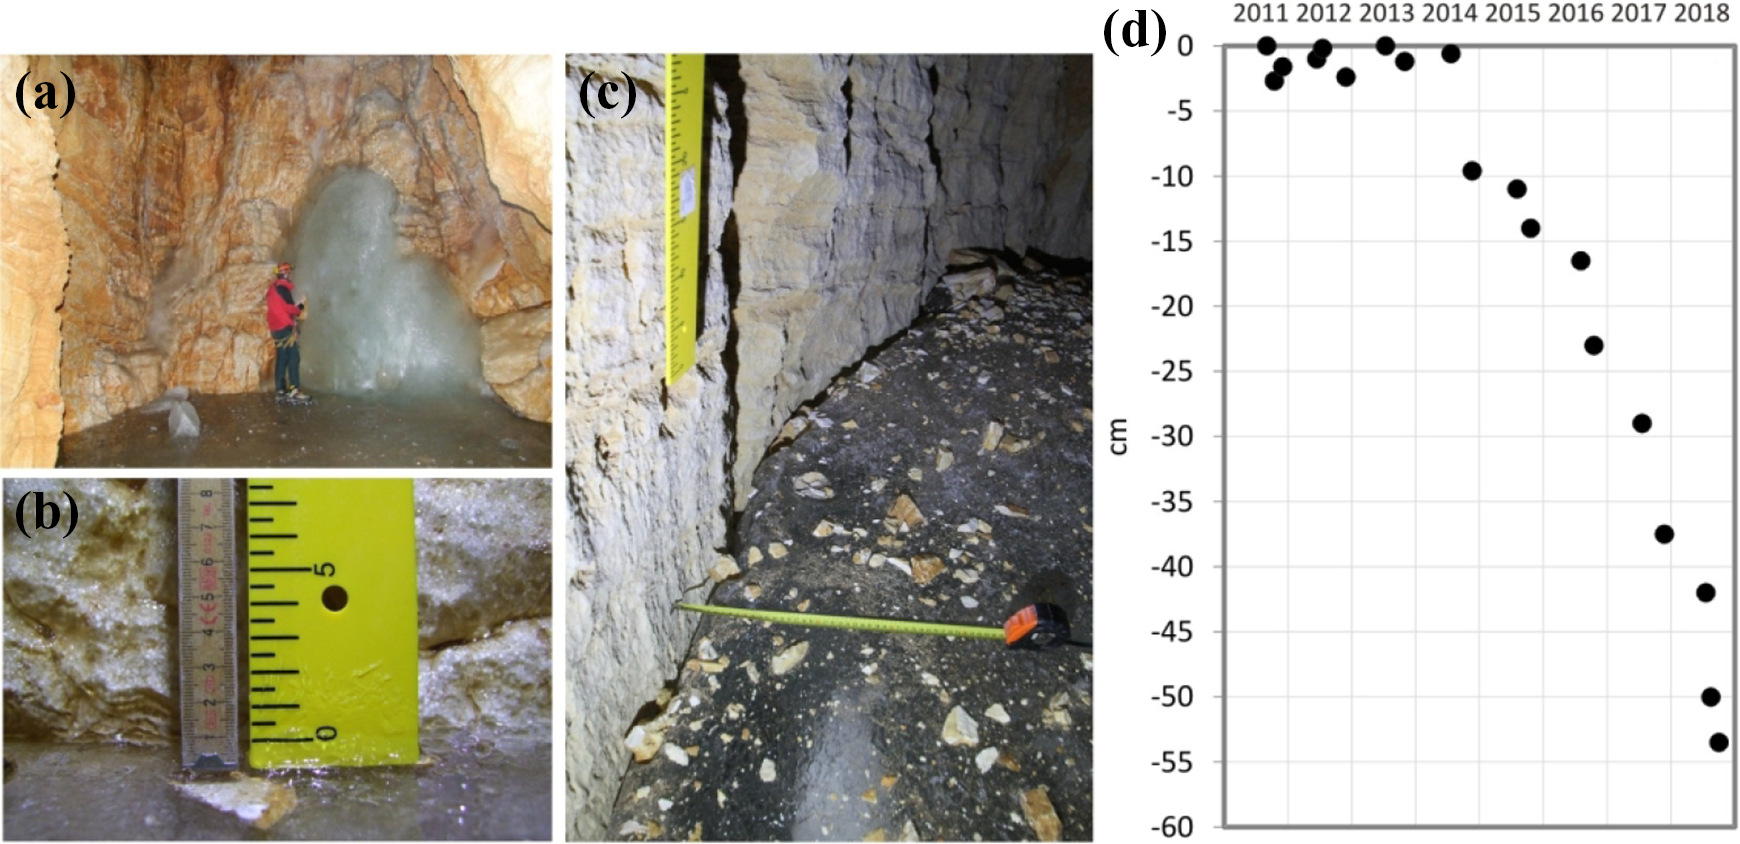
Evidence of permafrost degradation observed in the cave. (a) The main hole with the frozen waterfall as seen on 28 July 2010; the ice deposit is in direct contact with the rock wall. (b) The benchmark (‘B’ in Figure 2(a)) photographed on 12 July 2013 shows no variation in the ice surface topography during the first three years of observations. (c) The same benchmark as (b), photographed on 24 November 2017; the ice surface topography had decreased by about 37 cm since 22 July 2014, and by 8 cm by 19 July 2017. (d) 2011–2017 variations in ice surface topography, clearly highlighting the abrupt melting that began during fall 2014. Photographs were taken by RR Colucci.
VI Conclusions
A permafrost degradation induced by recent climate change has been observed in the LIC. Air circulation remains responsible for having a net cooling effect on this environment, except when the entrance is sealed by snow. In the recent past, when climatic permafrost thickness started to reduce, due to pure conduction induced by external warming, air circulation was responsible in keeping cryotic conditions “around” the cave environment, preserving the permanent ice deposit in it from abrupt melting. Therefore, relict permafrost can be solely responsible, or jointly responsible with air circulation, for ice formation and preservation within a cave. Ongoing climate change is now deeply affecting high-elevation caves in the Alps and several positive feedbacks are jointly acting in a rapid disappearance of permanent ice deposits within them, which represent important paleoclimatic archives of the Alps. For this reason, urgent scientific actions are needed to save as much information as possible, before the ice in caves completely melts.
Footnotes
Acknowledgements
This research started with the projects MONICA and MACRY, and was finally concluded within the framework of the project “C3 -Cave’s Cryosphere and Climate” thanks to the “E.Boegan” Caves Commission of the Società Alpina delle Giulie-NPO (SAG), agreement N.1035 08/02/2017 between the ISMAR-CNR and the SAG. The instrumentation was made available thanks to the Unione Meteorologica del Friuli Venezia Giulia (UMFVG-NPO) through a financial support from the Comunità Montana del Gemonese, Canal del Ferro e Valcanale. The Parco Naturale delle Prealpi Giulie is deeply acknowledged for having supported this activity.
Declaration of conflicting interests
The author(s) declared no potential conflicts of interest with respect to the research, authorship and/or publication of this article.
Funding
The author(s) received no financial support for the research, authorship and/or publication of this article.