



Abstract
The Central American Dry Corridor (CADC) is a sub-region in the isthmus that is relatively drier than the rest of the territory. Traditional delineations of the CADC’s boundaries start at the Pacific coast of southern Mexico, stretching south through Central America’s Pacific coast down to northwestern Costa Rica (Guanacaste province). Using drought indices (Standardized Precipitation Index, Modified Rainfall Anomaly Index, Palmer Drought Severity Index, Palmer Hydrological Drought Index, Palmer Drought Z-Index and the Reconnaissance Drought Index) along with a definition of aridity as the ratio of potential evapotranspiration (representing demand of water from the atmosphere) over precipitation (representing the supply of water), we proposed a CADC delineation that changes for normal, dry and wet years. The identification of areas that change their classification during extremely dry conditions is important because these areas may indicate the location of future expansion of aridity associated with climate change. In the same way, the delineation of the CADC during wet extremes allows the identification of locations that remain part of the CADC even during the wettest years and that may require special attention from the authorities.
I Introduction
Central America is an isthmus that connects North America with South America (Vargas, 1997), located between 77° and 92°W and 7° and 18°N (Figure 1). Within Central America, there is a drier sub-region referred to as the “Central American Dry Corridor” (CADC) or, in Spanish, “Corredor Seco Centroamericano” or “Corredor de la Sequía”. The term was first used in 2002, when the World Food Program (WFP) brought public attention to the food crisis that is regularly experienced in the CADC (WFP, 2002). Previously, in 2001, a severe drought was observed over Central America, which was not associated with an El Niño year (Ramírez and Brenes, 2001).

Spatial distribution of the meteorological stations used. The dry-core stations represent those stations with an annual climatic water demand that is, on average, greater than the supply.
The CADC geographical area presents a higher probability of drought compared to other sub-regions due to the influence of several climate drivers such as El Niño-Southern Oscillation (ENSO) and/or the Caribbean Low-Level Jet (CLLJ) (Amador, 1998, 2008; for more details, see Hidalgo et al., 2019). In addition, due to socially related reasons (e.g. poverty and the dependence on subsistence agriculture), most of CADC’s inhabitants suffer from a particularly high vulnerability to extreme hydroclimatic events. Millions of households in Central America directly depend on agriculture, specifically on basic grains crops, and, therefore, extreme hydrometeorological events (including severe and sustained droughts) associated with climate variability and change have triggered significant impacts in the isthmus (Chen et al., 2016; Granados et al., 2017). The combination of physical environmental hazards and social conditions causes significant impacts on livelihoods, agricultural production and human health (for a review of agricultural impacts, see Calvo-Solano et al., 2018).
Despite that several delimitations of the CADC have been proposed in different studies, nowadays there is no consensus regarding the geographical boundaries of the CADC. The extension of the dry conditions in this part of Central America is a dynamic phenomenon that changes every year. The objective of this article is to propose a dynamic delimitation based on the analysis of drought and aridity indices for the CADC.
One previous delineation of the areas prone to dry conditions was made by the International Center for Tropical Agriculture (CIAT et al., 1999), which elaborated a Climate Risk Index for droughts and floods. The index was used to identify areas prone to floods and recurrent droughts. It was found that 27% of Central America is prone to flooding, that 33% is susceptible to drought and 40% is prone to both events. In supplementary Figure S1a, a map of the delimitation of the CADC according to CIAT et al. (1999) based on their Climate Risk Index for drought events is presented.
Ramírez (1999) proposed potential areas of drought based on historical reports of the impacts of severe droughts in Central American countries except Belize (supplementary Figure S1b). The sources consulted were newspapers, reports from the Ministries of Agriculture or from other sectors such as hydropower production agencies. The impacts from the reports were spatially located, then an envelope line was drawn around the zones that presented some kind of impact. The zone within the surrounding line was classified as an area prone to drought.
The Food and Agriculture Organization of the United Nations (Van der Zee Arias et al., 2012, 2013) presented a delimitation for the CADC based on geographical, climatic, natural resources, socioeconomic and institutional aspects (supplementary Figure S2a). This information was combined, and the result was an approximated CADC delimitation for Guatemala, Honduras, El Salvador and Nicaragua (Van der Zee Arias et al., 2012). In supplementary Figure S2b, the different levels of drought intensity are shown. The rest of the countries in Central America were not part of the study and, therefore, the extension of the CADC for those countries was not included.
Hidalgo et al. (2013, 2017) projected increases of aridity in Central America at the middle and the end of the century, caused by moderate reductions in precipitation and warmer climate. Identifying which regions are the first to suffer the expansion of high aridity is important for the stakeholders for climate change preparedness. Our results could support the identification of such territories and help in defining regions in the isthmus that remain dry even during the wettest years, as these are the most arid regions that require special attention of the authorities.
1 Theoretical background
The CADC is a region with drier climatological conditions and drought proneness with respect to the rest of Central America. Different studies have suggested the reasons behind this contrast and most of the research done identified the presence of a mountain range (with west–east direction) and the prevalence of easterly winds as the reasons why the Pacific slope of Central America is drier than the Caribbean slope (Bonilla, 2014; Hidalgo et al., 2019; Taylor and Alfaro, 2005; Van der Zee Arias et al., 2013). This mountain range has the capacity to affect the distribution of the precipitation in all the region. However, the mechanism is not a simple “rain-shadow” effect, but the result of the convergence of trade winds in the Caribbean coast of Central America and subsidence in the Pacific Coast due to the lifting of air (Hidalgo et al., 2015).
It should be noted that in Central America there is a wide variety of phenomena that can modify the precipitation throughout the year – for example, ENSO (Amador et al., 2006, 2016a, 2016b; Calvo-Solano et al., 2018; Hidalgo et al., 2017; Hidalgo-León et al., 2015), the Intertropical Convergence Zone (Quirós-Badilla and Hidalgo-León, 2016), the CLLJ (Amador, 1998, 2008; Hidalgo et al., 2015, 2017), different oceanic processes in the Atlantic such as the Atlantic Multidecadal Oscillation and the variability in the Tropical North Atlantic (Enfield and Alfaro, 1999; Enfield et al., 2001; Maldonado et al., 2013) and atmospheric patterns such as the North Atlantic Subtropical High (Amador et al., 2006; Taylor and Alfaro, 2005).
Dai (2011) defines drought as a recurrent extreme climate event over land. It is characterized by below-normal precipitation over a period, and its length could be of several months, years or even a few decades. Chen et al. (2016) recognized it as one of the most frequent and costly disasters in Central America, with significant effects on societies and ecosystems. Therefore, considering all the dimensions of drought, is of great importance to analyze its characteristics in Central America, specifically in the CADC. Negative precipitation anomalies can produce a sustained meteorological, agricultural, hydrological or socioeconomic drought (Mishra and Singh, 2010). Typical time scales of these droughts are 1–2, 6, 12 and more than 12 months, respectively (WMO, 2012). This work focuses on scales of six and 12 months – for example, agricultural and hydrological droughts. Agricultural drought will be used here as a period with dry soils as a consequence of below-average precipitation, intense but less frequent rain events or above-normal evaporation, leading to reduced plant growth and reduced crop production (Dai, 2011). Agricultural drought would be key in our research results regarding the prevalence of drought in the CADC. Hydrological drought is also considered and will be defined as a period of inadequate and insufficient surface and subsurface water resources for use in a water management system.
II Data and methods
1 Data
For the dynamic definition of the CADC, a daily precipitation (P) and temperature (T) database covering the period 1970–1999 was obtained from the Center for Geophysical Research (CIGEFI, in Spanish) of the University of Costa Rica. This database consists of 199 meteorological stations across Central America (dots in Figure 1) originally obtained from National Meteorological and Hydrological Services of the region. Also, these stations were used for the calculation of the Palmer indices (Palmer Drought Severity Index (PDSI), Palmer Hydrological Drought Index (PHDI) and Palmer Drought Z-Index – see their descriptions in the following section). It should be noted that we selected the 1970–1999 period based on the availability of P and T data used to compute the drought and aridity indices, and results may change if a different period is used.
Available water-holding capacity (AWC) data, needed for the calculation of Palmer drought indices, were obtained from the Global Soil Texture and Derived Water-Holding Capacities dataset by Webb et al. (2000), available at 1o × 1o spatial resolution. These data were used in the PDSI computation in Dai et al. (2004). The AWC data were interpolated to the station’s locations using MATLAB’s “natural” interpolation method, which is based on Delaunay triangulation of the data (Barber et al., 1996; Delaunay, 1934).
2 Methodology
To analyze the drought likelihood within the CADC, we divided the methodology into two parts: in the first approach, the methodology proposed by Ponce et al. (2000) was used to take into consideration aridity. Ponce’s method calculates a ratio between average annual mean Potential Evapotranspiration (PET) and average annual mean P, considering it as an aridity index (φ):

In this study, PET was calculated using the Thornthwaite method (Thornthwaite, 1948). The PET, P and T data were aggregated to annual averages in all the weather stations, and the data were introduced in the licensed software ArcMap 10.4 for further processing. This allowed to produce an initial identification of the driest stations by classifying them as “dry-core” stations (red dots in Figure 1). A station was considered dry-core if its φ was equal or greater than one; in other words, if its annual climatic water demand was, on average, greater than the supply.
To identify the extreme years (dry and wet), the Standardized Precipitation Index (SPI) (McKee et al., 1993) for accumulations of six and 12 months for all stations considered dry-core were averaged into a single time series for each of the two selected accumulations. A single value of the SPI-12 was selected for each year corresponding to the December month, as this index would integrate the conditions that occurred throughout the previous year. Following this procedure, the driest years corresponded to 1972, 1976 and 1977, and the wettest to 1988, 1996 and 1998. Composites of φ for these extreme years were produced, as well as using all the years in the analysis period (1970–1999). The composites were constructed by averaging the corresponding mosaic of maps for the years mentioned previously. The same procedure was performed using the single value for October SPI-6 time series (for comparison with the SPI-12 results), considering, in this case, the months from May to October, which correspond to the rainy season on the Central American Pacific slope (Taylor and Alfaro, 2005). The results of using SPI-12 and SPI-6 were comparable and did not significantly change the results. Also note that in the case of SPI the values were not averaged.
Once the φ indices for extreme and climatological conditions were obtained, they were reclassified using the intervals proposed by Ponce et al. (2000), as shown in Table 1. With the interpolated data reclassified, the distribution of φ into different climate categories, during dry and wet extreme events, as well as the climatology can be obtained.
Values of PET/P (φ) and their classification by Ponce et al. (2000).

The second part of the analysis was focused on identifying areas with the highest incidence of droughts in the region in order to take into consideration the drought variability at time scales of a year and longer. To do this, different drought indices were chosen according to two requirements: first, they should require few variables in their calculation, as Central America is a data-scarce region where indices with more elaborate methodologies (like those that use Penman–Monteith Evapotranspiration methodology, for example) cannot be applied. Second, the indices must be applicable in Central America, as there are indices made for specific regions like the Drought Area Index developed for India (Bhalme and Mooley, 1980) or the Reclamation Drought Index created for the US (Weghorst, 1996). An extensive description of drought indices can be found in WMO and GWP (2016). In the end, we chose the SPI, the modified Rainfall Anomaly Index (mRAI), the PDSI, the PHDI, the Palmer Drought Z-Index and the Reconnaissance Drought Index (RDI). A brief explanation of each of the selected indices is given in the following sections.
2.1 SPI
The SPI (WMO, 2012) was designed to index precipitation variations at multiple time scales with the purpose of evaluating drought effects in the availability of water resources (Granados et al., 2017). Mishra and Singh (2010) explain that for any location, the SPI is calculated based on a long-term precipitation record, using a gamma distribution that is transformed to a normal distribution to fit the record and produce an index. Therefore, the mean SPI for the desired location and period over which the index is calculated is zero. Its strength is that it can be calculated for several time scales; therefore, SPI is useful to monitor short-term water supplies (e.g. precipitation, soil moisture) and it monitors long-term anomalies in water supply, which can be used to infer anomalies in water resources like groundwater. Note that this relationship is region-specific and depends on prevailing catchment and geological conditions. Its weakness consists in the fact that it requires a lengthy precipitation record and the true nature of the probability distribution may be different than the probability distribution used for calculating the index. The SPI is measured in units of standard deviation and, therefore, it is related to probabilities and return periods.
2.2 mRAI
The Rainfall Anomaly Index (RAI) uses the average precipitation over weekly, monthly or annual time periods to estimate the relative drought severity. It is used to characterize mainly meteorological drought. In order to accomplish this, the relative drought is ranked with respect to the 10 most severe drought events in the long-term record, based on its magnitude (Zargar et al., 2011). The mRAI is a common alternative to the SPI (Hänsel et al., 2016). It requires as inputs the monthly precipitation sum of a specific month during an observed period (Pi), the median monthly value during a validation period (

As an advantage, the mRAI can also be calculated based on timescales similar to the SPI and it is an alternative for assessing future extreme precipitation conditions and trends in a temperate climate zone (Chen et al., 2016; Hänsel et al., 2016). As a limitation, mRAI tends to underestimate the real drought risk, but it can be supported with other indices such as the Palmer Index (Hänsel et al., 2016). It is important to note that, in water balance studies, the mRAI is an effective, robust and computationally less demanding alternative than other drought indices (Hänsel et al., 2016).
2.3 PDSI
The PDSI (Palmer, 1965) is one of the most widely used drought indices. It requires monthly temperature and precipitation data and soil characteristics (e.g. water-holding capacity). It is important to take into consideration that the PDSI is based on a primitive two-layer bucket-type balance model, which serves for estimating the departures of moisture from normal conditions. Dai (2011) explains that the strength of the PDSI is that it considers both water supply (as precipitation) and demand (as potential evaporation); its weakness is that the PDSI does not work properly over mountainous and snow-covered areas, which is not a relevant problem in Central America. Vicente-Serrano et al. (2012) state that [o]ne of the main problems of the Palmer indices is that the parameters necessary to calculate them were determined empirically and mainly tested in the United States, which restricts its use in other regions (see Akinremi et al., 1996) and limits the geographical comparisons based on the PDSI (Guttman et al., 1992; Heim, 2002). This problem was solved by the development of the self-calibrated Palmer indices (Wells et al., 2004), which are spatially comparable and report extreme wet and dry events at frequencies expected for rare conditions.
The index that we used was not calibrated. A recent study by Hidalgo et al. (2019) found that the uncalibrated and self-calibrated PDSI in the CADC showed similar results. The PDSI scale is fixed at nine to 12 months (Rhee et al., 2010).
2.4 PHDI
The PHDI is an index used for long-term hydrologic moisture conditions analysis (Heim, 2002). Dai (2011) explains that it is used to describe hydrological drought, using the same Palmer model for the PDSI but with a more stringent criterion for the end of the drought or wet spell. Like the PDSI, the PHDI has the strength of using a water balance model to account for the effect of both P and T. It is important to consider that there is a time lag between the end of the drought-inducing meteorological conditions and the time in which the environment gets fully recovered from a drought.
2.5 Palmer Drought Z-Index
The Palmer Drought Z-Index is used to describe agricultural drought. It is an index of the moisture anomaly for the current month in the Palmer model (Dai, 2011; Zargar et al., 2011). The Z-Index is characterized by a rapid response to current precipitation deficit, but it does not take into account previous conditions. It analyzes precipitation and temperature in a water balance model as input, and it is used as for monitoring short-term droughts (Heim, 2002; Zargar et al., 2011).
2.6 RDI
The RDI is used to measure meteorological drought. Zargar et al. (2011) explain that RDI achieves a balance between P and PET, as P alone (e.g. water supply) does not consider the moisture deficit (e.g. water demand). Therefore, PET is a key variable to understand drought severity. RDI is calculated using the aggregated deficit between the evaporative demand of the atmosphere and precipitation, and has the advantage that it is flexible for a variety of time periods. It associates better than other indices with hydrological and agricultural drought and it is easy and simple to calculate using monthly precipitation and PET (Zargar et al., 2011).
For the analysis of the indices, we employed the following procedure. First, the monthly indices were calculated for all the meteorological stations of the database, then we obtained an annual mean value for all the indices, except for the SPI-6, which uses the October value, representing the rainy season in Central America (Taylor and Alfaro, 2005), and the SPI-12, which uses the value for December, representing annual scales. The idea of using annual values for the indices is to compare these results with the annual aridity values proposed by Ponce et al. (2000).
These annual data of all the different indices were interpolated using the “Topo to Raster” method in ArcGIS for every year of the analysis period. A threshold of –0.5 was selected as the value of the indices that defines the establishment of a drought (e.g. slightly, moderate or severe dry conditions). We selected this threshold as the value that defines the limit between dry conditions in the SPI and mRAI (Hänsel et al., 2016) or an incipient dry spell in the PDSI, PHDI and Z-Index (Alley, 1984) from normal or wet conditions. For the RDI, the same threshold was used due to its similarity with the SPI (Tsakiris and Vangelis, 2005).
The threshold defines Boolean-type maps, with grid points classified into dry (marked with the number one) or normal-wet (marked with the number zero) conditions. Then, a grid-point-by-grid-point sum of the numbers for all years of a particular index (and, in certain cases, summing also for all indices) were computed. Places with high values of this summation correspond to the areas in which the drought condition is more frequent.
For the dynamic delimitation, we combined each of the maps for aridity conditions (extremely dry, normal and extremely wet) and the areas with 60% or more recurrence of drought from the grid-point-by-grind-point sum of Boolean-type maps of all the indices (and years). Therefore, three different delimitations were generated, one for each condition. To consider the effect of the aridity in the combined map, the aridity maps were also reclassified in Boolean-type maps, assigning 1 to sub-humid and semiarid regions, and 0 to humid, hyper-humid and super-humid regions. The same procedure was used for the drought indices, assigning 1 to those areas with 60% or more drought recurrence, and 0 to the remaining areas. With the Boolean-type maps of aridity and drought recurrence, a multiplication was computed, identifying the areas in which there is an overlap of both variables. The idea is that the aridity would give us a measure of the mean state during dry, normal and wet conditions, and the analysis of the drought indices would provide an indication of the frequency (proneness) of drought events.
III Results
To verify the drier conditions of the CADC and the effect of climate variability, the percentage of stations during each year falling into any of the categories of Table 1 was calculated and is shown in Figure 2. Two subfigures were prepared, one for the CADC dry-core stations (Figure 2(a)) and other for all the stations that are not in the dry-core (Figure 2(b)).
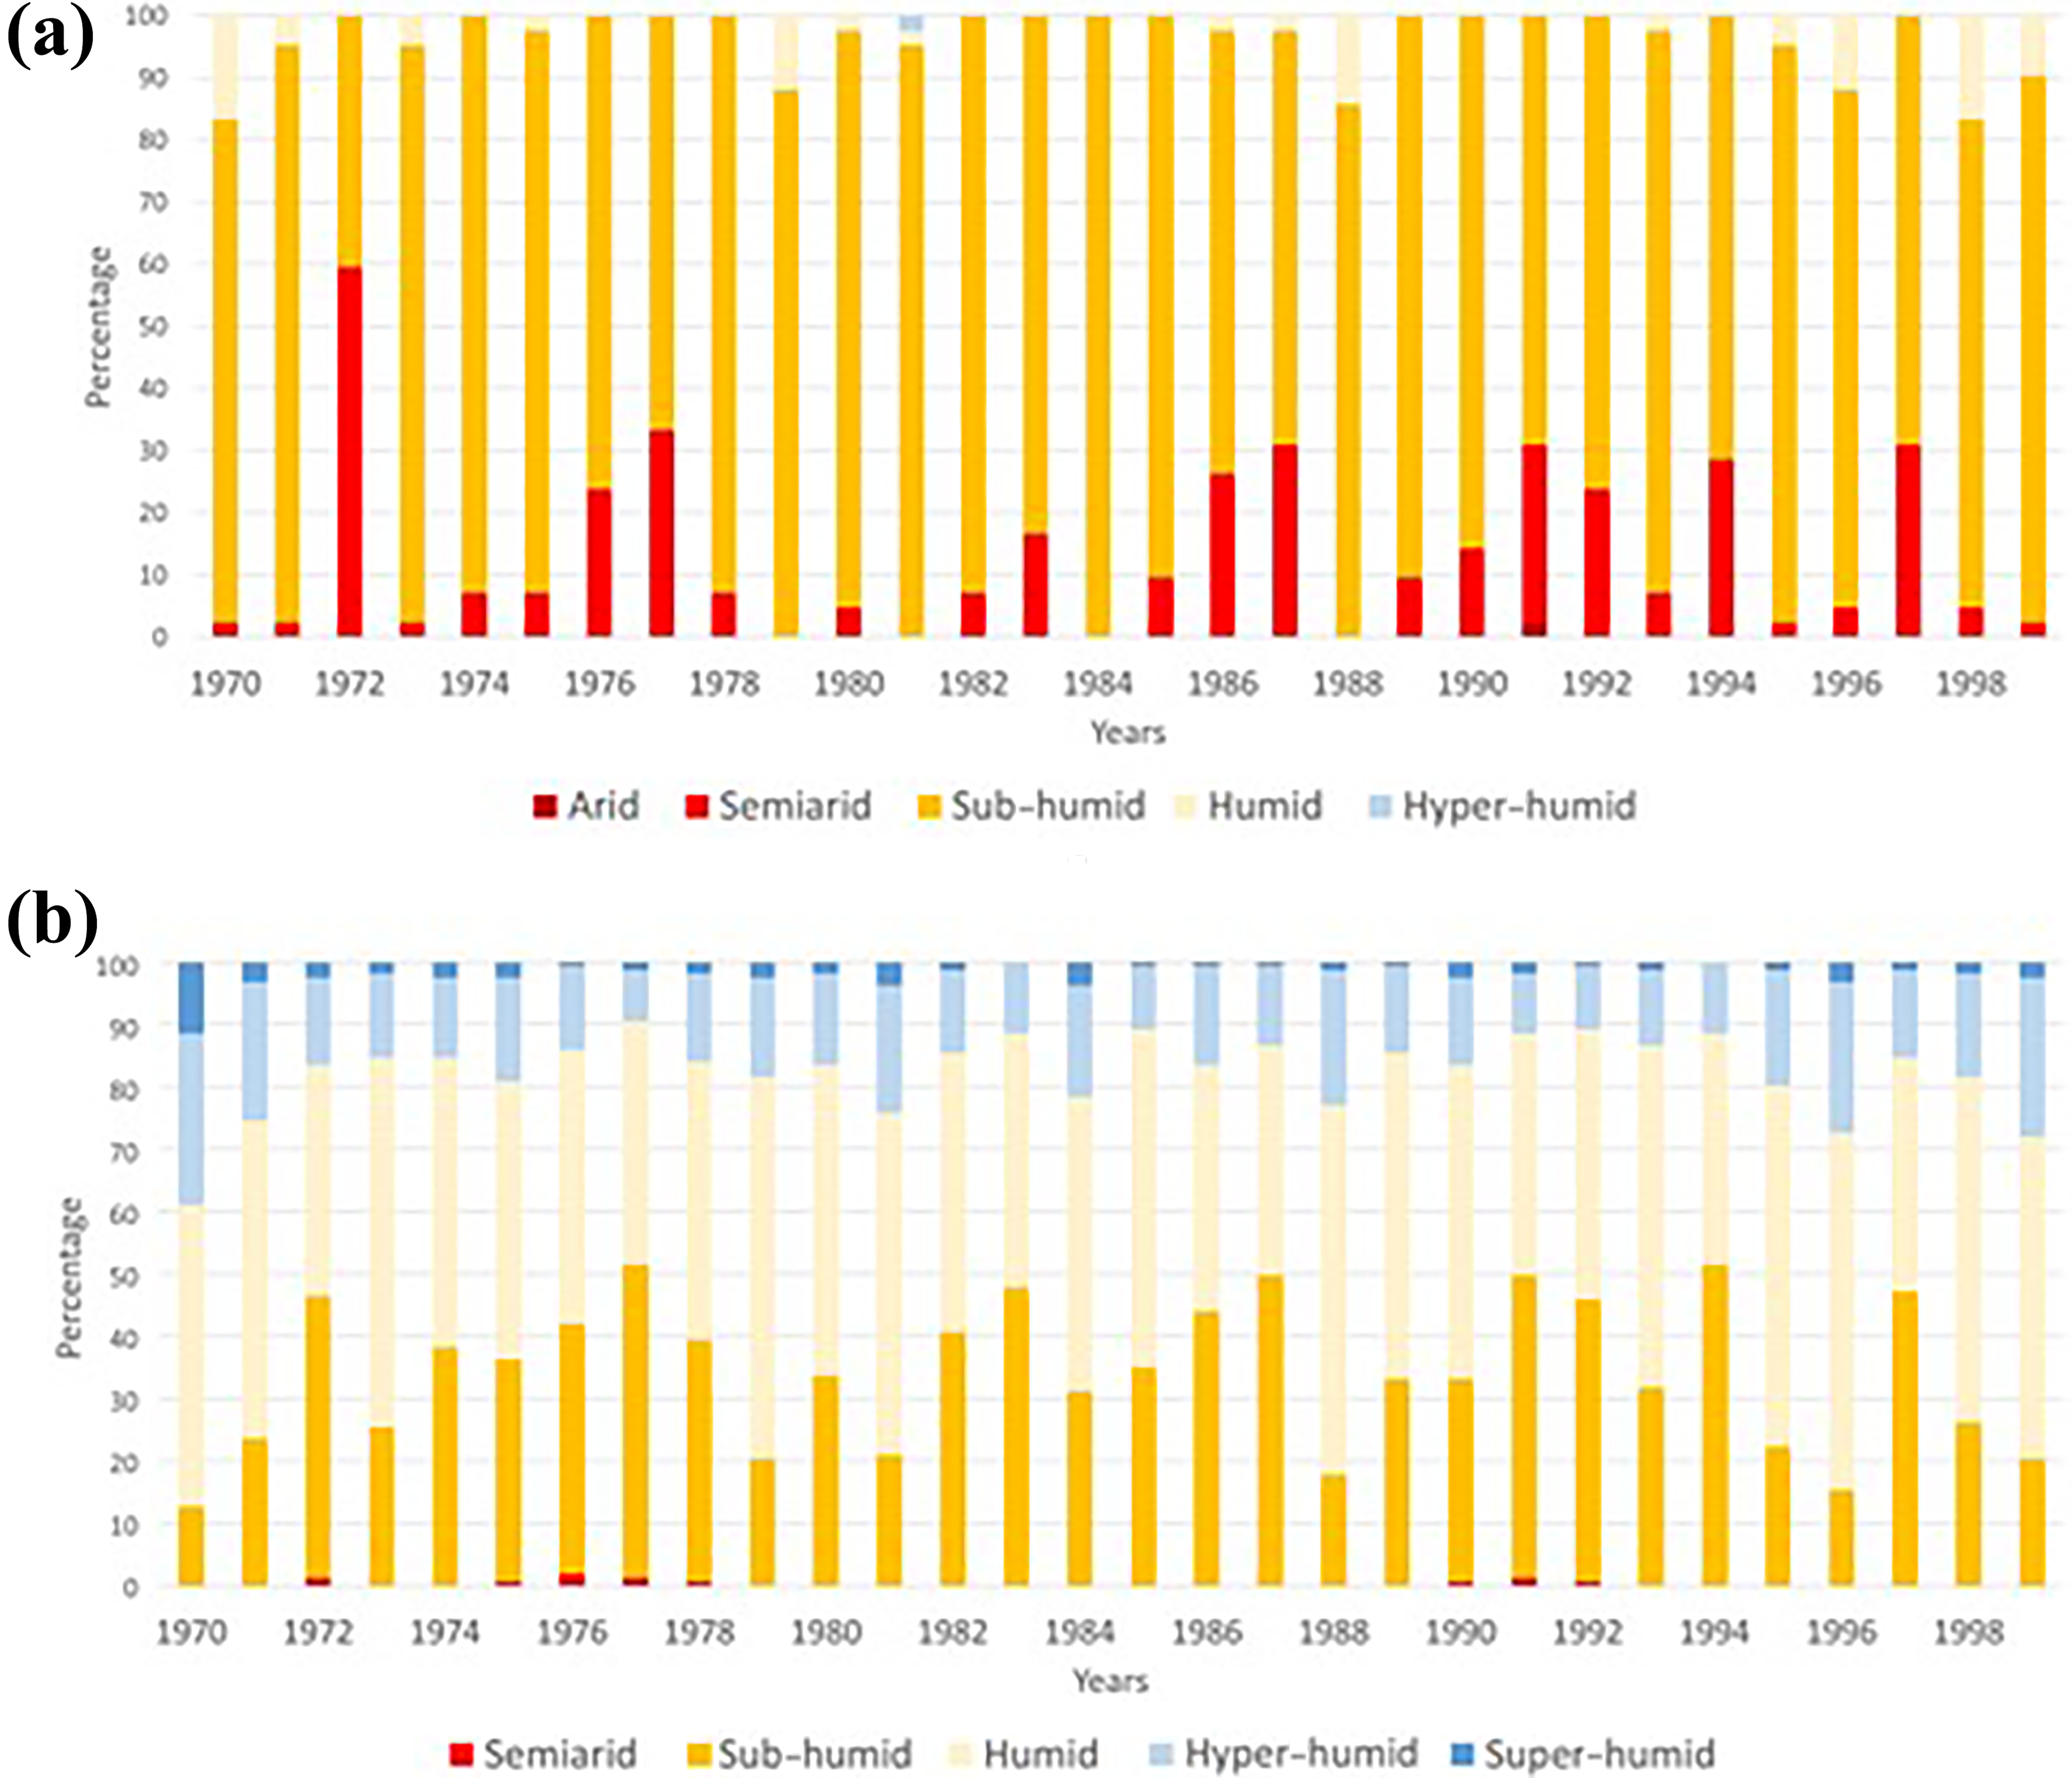
Percentage of meteorological stations during 1970–1999 that showed any of the aridity conditions in Table 1 for (a) the CADC dry-core stations and (b) stations not in the dry-core of Central America according to the aridity index elaborated by Ponce et al. (2000).
In Figure 2, it is evident that the number of stations indicating sub-humid and semiarid conditions over the years are much higher in the CADC dry-core stations than in the rest of Central America. Also, there is no station with super-humid conditions in the CADC dry-core. This effectively illustrates the drier conditions that prevail in the CADC. Additionally, in some years the amount of stations indicating sub-humid and semiarid conditions are triggered by warm ENSO or El Niño events; examples of this can be seen in the years 1972, 1977 and 1987. Conversely, cold ENSO events (La Niña) are associated with increases in the number of stations reporting humid conditions in the CADC, like in 1970 and 1988. In the non-dry-core stations, this latter condition is related to the increase of stations with hyper-humid and super-humid conditions.
1 Aridity spatial distribution change during extreme events and normal conditions
The classification of the meteorological stations using the index of Ponce et. al. (2000) for normal, dry and wet years can be defined spatially (Figure 3). During extremely dry events (Fig. 3(b)), a significant amount of areas that are normally classified as humid are now classified as sub-humid, including almost all the territory of Nicaragua, Honduras, Guatemala, El Salvador, the northwestern sector of Costa Rica and Panama’s Dry Arch (“Arco Seco”, in Spanish). Also, some spots of semiarid conditions appear, specifically in the western part of Nicaragua and in its southern border with Costa Rica. Even during the extremely dry years, there are areas with humid conditions in the Caribbean and the remaining parts of Costa Rica. Regarding the extremely wet events (Figure 3(a)), the areas classified as hyper-humid and humid conditions increased compared to normal years, especially in the Caribbean side of Central America. Also, in the southeastern part of Costa Rica, there is a small spot of hyper-humid conditions. There is also a humid spot in Nicaragua’s northwestern territory. The average aridity map (Figure 3(b)) presents a sub-humid condition in northwestern side of Costa Rica, Panama’s Dry Arch, southwestern part of Nicaragua, the middle part of Honduras and almost all the territory of El Salvador and Guatemala. These areas resemble previous delineations of the CADC (see Supplementary Material) and represent areas that are extremely vulnerable to P anomalies. They are prone to droughts, which could also result in an extraordinary long midsummer drought (Magaña et al., 1999; Maldonado et al., 2016), few rain events during the rainy season (May–October; Taylor and Alfaro, 2005) or an early finish of the rainy season (Bonilla, 2014; Enfield and Alfaro, 1999).

Mean aridity during: (a) extreme wet events (1988, 1996, 1998); (b) extreme dry events (1972, 1976, 1977); and (c) average conditions for the entire analysis period (1970–1999).
2 Drought index analysis
Although Figure 3 gives an approximate picture of the mean and spatial variations of the CADC’s limits from the point of view of aridity, a more precise (dynamic) delineation of the sub-region should consider the fact that, year after year, the extension of the dry area changes (as it is implicit in Figure 2). Taking into consideration the occurrence of droughts, we performed the analysis using the drought indices individually, as explained previously. The Boolean maps of the drought indices, mentioned in the Methodology, are shown in Figure 4 as a relative percentage of incidence of drought. It was found that the same characteristic that appears in the aridity analysis (the Pacific slope being more frequently drier than the Caribbean one) is also present in this analysis. However, the indices show different sensitivities in their skill for contrasting the frequency of drought in both slopes. High drought frequencies were usually found in western Nicaragua, northwestern Costa Rica, Panama’s Dry Arch, southern Honduras, as well as much of the El Salvador and Guatemala territories. In these areas, it was calculated that there is a 60% recurrence of droughts. This is especially visible in the SPI-12, SPI-6 and mRAI – indices that clearly define the Pacific slope as the area with more recurrence of drought, in tune with what is known about the core regions of the CADC. The RDI also detects this peak in the drought recurrence in the Pacific slope. However, this index located a drought-prone area in the center of Costa Rica, which seems too large compared to the traditional boundaries of the CADC that report such a zone restricted to Costa Rica’s Central Valley (similar to the extension in SPI-6). The RDI also shows a drought zone in northern Nicaragua, also identified using the SPI-12. According to Taylor and Alfaro (2005), locations in Central America on the Caribbean slope present a rain peak during the boreal winter, associated with the arrival of cold outbreaks in the Caribbean (Zárate-Hernández, 2013). Therefore, those regions could present low SPI-12 values during the poor-cold-outbreaks season over the Caribbean Sea. Using SPI-6, we could not identify those areas because the period considered was May–October, which excludes the boreal winter.

Frequency of drought for different indices in Central America for the period 1970–1999.
The Palmer drought indices (PDSI, PHDI) seem to have lower sensitivity to spatial contrasts in drought recurrence in Central America when these indices are compared with the SPI-12, SPI-6, RDI and mRAI. However, a slight decrease in recurrence of drought in eastern Nicaragua can be observed, with values ranging between 40% and 50%. This difference between the Palmer indices and the SPI-12, SPI-6, RDI and mRAI, could be related to the lower year-to-year variability of the Palmer indices or to the local standardization. The case of the Palmer Z-index is different from the other Palmer indices because it seems to identify certain zones on the Pacific slope with a high recurrence of droughts, much like the SPI; these areas are the Costa Rica’s northwest territory, Panama’s Dry Arch and western Nicaragua.
The response of the different indices is related to their nature. While SPI, mRAI and RDI are meteorological drought indices, PDSI highlights soil moisture deficits and PHDI is more a hydrological indicator. These types of indicators describe different processes that are related to different impacts. It should, therefore, not be surprising that results between these indicators spatially vary.
The Boolean maps of all the drought indices presented in Figure 4 were used to generate the Figure 5, which contains the grid-point-by-grid-point sum of the numbers for all years of a particular index in Figure 4. It can be seen in Figure 5 that the areas of greatest recurrence of drought will always be on the Pacific slope, despite the influence of the PSDI and PHDI indices that tend to spread the drought conditions all over Central America. This map represents a good picture of the dynamics of drought occurrence in Central America and indicates the areas that are more or less arid and frequently exposed to droughts.

Overlapping of the seven drought indices shown in Figure 4 and their percentage of recurrence.
3 Dynamical delimitation of the dry corridor
A new delimitation proposed for the CADC is shown in Figure 6; this is the result of multiplying the Boolean-type maps in each phase from Figure 3 and the map of the areas with more drought recurrence from Figure 5.

Proposed delimitation of the CADC during years with (a) extreme dry conditions, (b) extreme wet conditions and (c) normal conditions.
The average conditions of this proposal (Figure 6(c)) include the entire province of Guanacaste in Costa Rica and the Dry Arch of Panama, two regions that are sometimes omitted in previous delimitations (Van der Zee Arias et al., 2012, 2013). The area considered part of the CADC under normal conditions (Figure 6(c)) over El Salvador is also reduced compared to previous delimitations; however, there are other places that show an increase in the area classified as CADC, such as northern Honduras. During extremely dry conditions (Figure 6(a)), the CADC is expanded in a few places, mostly in Costa Rica, Honduras and Panama, while during wet conditions the changes are more evident (Figure 6(b)), and the CADC is confined to the absolute driest places.
The main advantage of this delimitation is the establishment of the CADC as an area that is always in continuous change and varies according to the conditions that develop in a specific moment. The CADC area has an expansion during years under extremely dry conditions and reductions during wet conditions; however, there are always areas that will be considered part of the CADC, even during wet conditions. Examples of this include four main regions: Panama’s Dry Arch, the northwest territory of Costa Rica, western Nicaragua and the northwest border of Nicaragua with Honduras, and the south of Guatemala.
IV Conclusions
The analysis of different indices used in this investigation shows that not every index can identify the area of the CADC; in this case, the SPI-6, SPI-12, RDI and mRAI give better results compared to the Palmer indices (PDSI, PHDI and Z-Index).
The spatial drought patterns defining the extension of the CADC changes significantly from year to year. However, it is evident that some parts of Central America are frequently exposed to moderate and severe droughts. The identification of areas that change their classification from sub-humid to semiarid during extremely dry conditions is important because they may be indicating the location of future expansion of increased aridity associated with climate change (Hidalgo et al., 2013, 2017). In the same way, the delineation of the CADC during wet extremes allows the identification of locations that remain part of the CADC even during the wettest years and that may require special attention from the authorities.
The CADC inhabitants must have constant support from their respective governments, due to the high risk of drought in the region associated with the exposure to hazards associated with climate variability and climate change, along with social, economic and productive vulnerability factors (Calvo-Solano et al., 2018). Note that the reproduction of socioeconomic impacts requires knowledge of the exposure and vulnerability in different economic sectors.
It would be important to evaluate in the future the different drought indices and their capacity to reproduce socioeconomic impacts associated with droughts, which will lead to a better understanding of the relationship between droughts and their impacts in the CADC.
Supplemental material
Supplementary_Material_(1) - Dynamical delimitation of the Central American Dry Corridor (CADC) using drought indices and aridity values
Supplementary_Material_(1) for Dynamical delimitation of the Central American Dry Corridor (CADC) using drought indices and aridity values by Luis Eduardo Quesada-Hernández, Oscar David Calvo-Solano, Hugo G Hidalgo, Paula M Pérez-Briceño and Eric J Alfaro in Progress in Physical Geography: Earth and Environment
Footnotes
Declaration of conflicting interests
The author(s) declared no potential conflicts of interest with respect to the research, authorship, and/or publication of this article.
Funding
The author(s) disclosed receipt of the following financial support for the research, authorship, and/or publication of this article: This work was supported by the University of Costa Rica (Grants V.I. 805-B7-286 (UCREA), B6-143 and B7-507 (CONICIT-MICITT), B8-766 (REDES), B9-454 (GRUPOS), B0-810, A4-906 (PESCTMA) and 808-B5-298).

Supplemental material
Supplemental material for this article is available online.
References
Supplementary Material
Please find the following supplemental material available below.
For Open Access articles published under a Creative Commons License, all supplemental material carries the same license as the article it is associated with.
For non-Open Access articles published, all supplemental material carries a non-exclusive license, and permission requests for re-use of supplemental material or any part of supplemental material shall be sent directly to the copyright owner as specified in the copyright notice associated with the article.
