
Abstract
Given its singular importance for water resources in the southwestern USA, the Upper Colorado River Basin (UCRB) is remarkable for the paucity of its conventional hydrological record of extreme flooding. Short-term record-based flood frequency analyses lead to very great aleatory uncertainties about infrequent extreme flood events and their climate-driven causal associations. This study uses paleoflood hydrology to examine a small portion of the underutilized, but very extensive natural record of Holocene extreme floods in the UCRB. We perform a meta-analysis of 82 extreme paleofloods from 18 slack water deposit sites in the UCRB to show linkages between Holocene climate patterns and extreme floods. The analysis demonstrates several clusters of extreme flood activity: 8040–7960, 4400–4300, 3600–3460, 2900–2740, 2390–1980, 1810–720, and 600–0 years BP. The extreme paleofloods were found to occur during both dry and wet periods in the paleoclimate record. When compared with independent paleoclimatic records across the Rocky Mountains and the southwestern USA, the observed temporal clustering pattern of UCRB extreme paleofloods shows associations with periods of abruptly intensified North Pacific-derived storms connected with enhanced variability of El Niño. This approach demonstrates the value of creating paleohydrological databases and comparing them with hydro-climatic proxies in order to identify natural patterns and to discover possible linkages to fundamental processes such as changes in climate.
I Introduction
Floods are among the most destructive natural hazards causing widespread loss of life, serious damage to infrastructure, and economic deprivation. Stream gauge and meteorological station networks established in many countries during the past century provide extensive systematic information about floods, as well as their meteorological and climatological contexts. The classical extreme flood estimations made in hydrological engineering commonly utilize several decades of stream gauge observations to estimate flood magnitudes and their associated exceedance probabilities or return periods (e.g. flood frequency analysis (FFA)). However, because of their short record lengths, systematic hydrological records largely consist of frequent small magnitude flood events. This leads to very great aleatory uncertainties about infrequent extreme flood events and their climate-driven causal associations. Moreover, FFA requires, as a necessary assumption for statistically valid inferences, that they be restricted to stochastic hydrological processes with independent identically distributed random variables (Kisiel, 1969). The problem with this assumption is not merely that it is nearly always violated in FFA; the bigger problem is that its imposition actually ensures that, beyond the actual flood events themselves, FFA can add no new scientific information, apart from the abstract expediencies needed to achieve an engineering design decision (Klemeš, 1987, 1989).
Another defect with FFA, from a scientific point of view, is the common tendency of conventional statistical flood estimation to relegate the most extreme flood events to “outlier” status, thereby minimizing their consideration. This produces a lack of knowledge or ignorance of potentially known facts, that is, an epistemic uncertainty (Baker, 2017). In extreme cases, this epistemic uncertainty will lead to what Taleb (2007) has termed a “Black Swan” event, which is an extreme occurrence deemed to be sufficiently improbable that it tends to be unexpected, with the consequence that it will lead to immense disasters for society. Recent incidents of very high-profile “Black Swan” events have led Taleb (2007) to make a blanket criticism of probabilistic risk assessment as a productive means for decision-making in high-risk situations, that is, in situations in which there are real possibilities for extreme disasters. The irony here is that a methodology used for expediency in coming to design decisions can, in rare cases, lead to consequences that invalidate the utility of those decisions.
Paleoflood hydrology (PFH), by combining stratigraphic geology, geomorphology, geochronology, hydraulic modeling, and flood hydrology, aims to discover and understand the very real extreme floods that have occurred on the planet (Baker, 1982; Baker, 2008; Kochel and Baker, 1982). PFH employs an investigative methodology to discover extreme flood events that have occurred in the past, thereby demonstrating what flooding is possible in the future. This can provide a kind of epistemic certainty: what has already happened can, indeed, happen again.
Natural PFH evidence of past extreme hydrological events can also be linked to the Earth’s climate variability over long timescales (Baker 1987; Benito et al., 2015; Ely 1997; Harden et al., 2010; Knox, 2000; Toonen et al., 2017; Wilhelm et al., 2018; Wohl et al., 1994). The extensive global application of PFH is now making regional and global paleohydrological reconstructions and syntheses available for many rivers worldwide (Baker, 2006, 2013). A major advance for relating these data to climate is the meta-analysis developed by Macklin and Lewin (2003). This involves a systematic probability-based analysis of geochronologically dated fluvial units (Jones et al., 2015a), and it provides for a synthesis of the growing spatial coverage and increasing chronological precision of fluvial archives for reconstructing past river responses to environmental changes (Benito et al., 2015; Macklin et al., 2006). Meta-analysis has now been employed in regional analyses of extreme flood events and fluvial change or stability in river systems in many different parts of the world, including Northern Europe (Macklin and Lewin, 2003; Toonen et al., 2017), the Mediterranean region (Benito et al., 2015; Macklin et al., 2006; Rossato et al., 2015), North Africa (Macklin et al., 2015), the southwestern and central USA (Harden et al., 2010; Harden et al., 2015), and the northeastern Tibet Plateau (Stauch, 2016).
Given the considerable climatic uncertainty for water resources in the Upper Colorado River Basin (UCRB), much attention is being focused on supply-side options to increase water availability, robustness, and resilience; however, the demand side has received considerably less attention. Increasing water storage in reservoirs is being considered a feasible strategy for practical dam operations (Eugene et al., 2016). However, this strategy, involving the filling of reservoirs during wet periods, will necessarily reduce the flood control function of those reservoirs and, thereby, increase flood risks for downstream areas. This problem will be especially acute for the most extreme floods, which pose risks to the safety of the dams themselves. Based on natural evidence of extreme flood records, long-term flood frequency has been linked to climate variability, which can provide new insights for a comprehensive understanding of extreme hydrological events (Wilhelm et al., 2018).
In this study, we apply the meta-analysis method to retrieve the extreme flood history of the UCRB. We then compare the retrieved flood history with long-term climate variable proxies during the Holocene. The results advance the scientific understanding of extreme flood events and their linkages with climatic changes in the UCRB.
II Study area
The Colorado River lies within the intermontane plateaus of the western USA and is the most important water resource of the seven states (parts of Colorado, New Mexico, Wyoming, Utah, Nevada, and California, and nearly all of Arizona) in the southwestern USA (U.S. Bureau of Reclamation, 2012). The UCRB, the area of the Colorado River Basin (CRB) upstream of the Lees Ferry U. S. Geological Survey (USGS) stream gauge, encompasses 289,600 km2, accounting for 45% of the total CRB drainage area while providing up to about 90% of the streamflow of the entire basin (U. S. Geological Survey, 2004). This is mainly due to about 70% of the Colorado River streamflow coming from snowmelt in the highest 14% of the UCRB (Christensen et al., 2004; National Research Council, 2007).
Regional- to local-scale hydro-climatic variability in the UCRB is controlled at multiple scales by physiographic, oceanic, and atmospheric factors, each operating at different spatial and temporal scales (Hirschboeck et al., 2000; Mock, 1996). Large-scale atmospheric circulation governs the precipitation pattern of the UCRB. Concretely, cool season precipitation that originates from the Pacific airstream dominates in the northern sections of the basin and the rainfall coming from the warm season monsoon in the southern sections (McCabe, 1996; McGinnis, 2000). North Pacific air masses bring most of the winter precipitation in the UCRB, entering as mid-latitude cyclones, and these account for the majority of precipitation in the region. Summer convective storms draw their moisture from the North American monsoon (NAM) (Adams and Comrie, 1997; Seastrand et al., 2015), but these storms tend to only produce floods in the smaller tributaries. A more recently recognized mechanism for generating anomalously high precipitation in the western USA is the “atmospheric river.” During the winter months, this phenomenon can move streams of highly concentrated water vapor from the North Pacific into the western USA through a variety of pathways (e.g. Dettinger et al., 2011; Ralph et al., 2006). Two main trajectories have been identified for the large precipitation event incursions into the UCRB: one involves flow from the southwest, drawing the Pacific moisture into the southern section of the UCRB; the other follows flow from the west, advecting Pacific moisture into the northern section of the UCRB (Alexander et al., 2015; Kirk and Schmidlin, 2018).
Given the singular importance of the UCRB as a critical water resource in the southwestern USA it is surprising to find that the conventionally characterized flood history of the UCRB is remarkably poor and short. Interestingly, the poor conventional record of flooding poses a particular problem because of the basin’s complex hydro-climatology (Cline, 2010; Hirschboeck, 1987; Mock, 1996; Keen, 1996; Sheppard, et al., 2002). Prevailing conditions of severe drought, alarmingly intense flood events, and rapidly growing water demand with climatic warming have been posing immense challenges for both water resource and flood risk management in the southwestern USA (Field et al., 2012; National Research Council, 2007).
The USGS gauging station (no. 09380000) at Lees Ferry in Arizona, serves as the dividing point between the upper and lower basins of the Colorado River (Figure 1). Established in 1921, this gauge has accumulated one of the most extensive streamflow records in the USA The average annual discharges at the gauge were 470.4 m3 s-1 during the period 1922–1962 and 374.4 m3 s-1 after the 1963 closure of the Glen Canyon Dam created Lake Powell. The annual maximum flood series ranges from a low peak of 716.4 m3 s-1 in 1934, to a high of 6230 m3 s-1 in 1921, with an average annual maximum of 2342.6 m3 s-1 before 1962 (Figure 2). The maximum pre-gauge historical flood at Lees Ferry occurred on 7 July 1884, with an estimated peak discharge of 8500 m3 s-1 (LaRue, 1925: 14). This number was estimated by extrapolating the Lees Ferry rating curve from its highest stage/discharge measurement of 3400 m3 s-1 to the presumed stage reached by the 1884 flood. That stage height was inferred four decades after the flood event, and it relied on the memory of a local resident, who recalled rescuing his cat from the branch of an apple tree at which level the cat had escaped the peak flow of the 1884 flood (LaRue, 1925). This 1884 “cat-in-the-tree” estimate is exemplary of the state of scientific understanding for the most extreme Colorado River flooding prior to the advent of PFH estimates that began in the 1990s (O’Connor et al., 1994).

Map showing the location of sample sites including the 14C- and OSL-dated paleoflood slack water deposits dataset in the Upper Colorado River Basin. Locations of δ18O records of Yellow, Bison, and San Luis lakes, and Pink Panther Cave are also labeled.

Annual maximum peak discharges in the Colorado River at the U.S. Geological Survey gauging station near Lees Ferry in Arizona 1884–2015.
III Paleoflood chronology and meta-analysis
The importance of PFH investigations for understanding extreme floods in the UCRB is exemplified by two recent studies conducted on the Upper Colorado River (Greenbaum et al., 2014; Liu et al., 2019). Greenbaum et al. (2014) report that paleoflood stratigraphy revealed 44 extreme floods that had occurred during the last 2000 years, several of which lie near the maximum flood envelope curve for the southwestern USA (Enzel et al., 1993), and two of which exceeded the probable maximum flood (Kenney, 2004) for the Upper Colorado River near Moab in Utah. At least 14 extreme floods (larger than the maximum gauged record) have occurred on the Lower Green River during the past 700 years, the magnitude of the largest being twice that of the maximum gauged record (Liu et al., 2019). These two studies reveal the natural occurrence of extreme floods that are significantly larger than those of the recent historical record, such that they posed a substantial risk to major infrastructure.
This study moves beyond the use of paleofloods in FFA in order to explore possible linkages between climate patterns and rare extreme floods in the UCRB. We rely on the currently available paleoflood data for the UCRB in a meta-analysis that will be described below. Because there is an immense untapped wealth of potential paleoflood sites in the UCRB, the current study is limited to the current state of hydrologically analyzed paleoflood sites, but aims more at demonstrating the potential for this kind of analysis than providing a definitive data-rich compendium.
First, we collected a total of 106 dated samples, including 68 radiocarbon (14C) and 38 optically stimulated luminescence (OSL) ages, providing quantitative age estimates of paleoflood slack water deposits (SWDs) (online supplemental table). These data come from three main-stem Colorado River reaches, the first near Moab, the second in Cataract Canyon in Utah and the third near Lees Ferry in Arizona, and from four basins in downstream sections of major Upper Colorado River tributaries: Green, Delores, Escalante, and Paria rivers (Figure 1). The Green River is the primary tributary of the Upper Colorado River. It is 1170 km long with a drainage area of 124,600 km2 and it contributes nearly half of the total annual flow to the Colorado River. The Delores River is 388 km long with a drainage area of 11,860 km2. This relatively small tributary empties nearly 10% of the Colorado’s annual flow upstream of Moab. The Escalante River drains an area of 4580 km2 in south-central Utah and joins the Colorado at Lake Powell. The Paria River is 153 km long with a drainage area of 3700 km2 at the southern end of the UCRB. It joins the Colorado River at Lees Ferry. A previous fluvial paleohydrological dataset study for the entire southwestern USA (Harden et al., 2010) included only a small portion of the UCRB data from the present study and considered data from a broad range of fluvial unit types from basins of various scales in the states of Arizona, Utah, New Mexico, Nevada, and Texas. The paleoflood dataset presented here is an initial collection of extreme flood evidence for the last 10,000 years in the UCRB.
Second, a comprehensive selection procedure was applied to all flood data collected in order to produce a natural-evidenced extreme floods database (Table 1). The updated flood database includes 82 dated samples (55 radiocarbon and 27 OSL ages), in which each data point represents an individual extreme flood interpreted from sedimentological evidence and hydraulic analysis. These are ages of SWDs and paleostage indicators representing flood events that took place in river channels confined by stable bedrock. We then examined stratigraphic correlations, deposit elevations, ages, and magnitudes in detail at all sites to avoid collecting a flood event indicated by multiple paleoflood deposits in a short reach and, therefore, each selected sample was considered as representing a single flood event. The last selection step filtered out small floods from all events. We selected all samples larger than 100-year flood, the maximum gauged peak or stage (depending on data availability), to represent extreme floods in this study. Excluded ages are listed in the supplemental table with reasons.
Paleoflood ages used in calculating cumulative probability distribution function curves for all four reaches in the Upper Colorado River Basin. More details about all collected flood sediments are included in the supplemental table.

Finally, we used the selected flood deposit ages to produce a cumulative probability distribution function (CPDF) plot. An age calibration was first performed on the dataset using the program OxCal (version 4.3, Bronk Ramsey, 2009). The individual probability distribution of each calibrated radiocarbon age was then summed, producing a CPDF plot. Next, this CPDF curve was normalized by dividing each date by the highest value in the curve. Then, various flooding episodes were identified in the CPDF curve by noting intervals in which the relative probability exceeds the mean probability (Harden et al., 2010; Macklin et al., 2010). The flood frequency (periods) of each studied reach was also plotted at each 100-year bin (Macklin et al., 2010).
IV Paleoflood episodes and their implications for extreme flood–climate links
By combining the paleoflood data with independent paleoclimatic records of mean precipitation and temperature conditions over the same periods as the flooding, it is possible to examine the relationship between floods and climate change over long timescales (Baker, 1987; Benito et al., 2015; Ely, 1997; Knox, 1993, 2000; Macklin et al., 2010; Wilhelm et al., 2018). Climatic variations over the past 10,000 years have played a significant role in generating temporal and spatial patterns of flooding episodes, and the growing paleoflood datasets from diverse hydrologic and climatic systems around the world indicate that region-wide flooding episodes exist over centennial to millennial timescales (Benito et al., 2015; Knox, 1993; Ely, 1997; Ely et al., 1993; Harden et al., 2015; Huang et al., 2013; Liu et al., 2014; Wilhelm et al., 2018). The clustering of extreme floods in the UCRB also suggests that climate dynamics have a major influence on the temporal distribution of flood episodes. Large flood-generating storms in the UCRB are mainly controlled by the southward displacement of the Pacific airstream, including North Pacific frontal storms, Pacific tropical cyclones, warm winter storms, and the NAM (Hirschboeck et al., 2000; McCabe, 1996; McGinnis, 2000; Mock, 1996; Webb and Betancourt, 1992).
A number of climate proxy records from the southwestern USA document paleoclimate conditions over the past 10,000 years (Asmerom et al., 2007, 2010; Betancourt et al., 2001; Kennett and Ingram, 1995; Metcalfe et al., 2015 and its references; Polyak and Asmerom, 2005; Thompson and Anderson, 2000; Wagner et al., 2010). δ18O records from three lakes at high elevations in the northwestern and southern Colorado Rocky Mountains (Yellow, Bison, and San Luis lakes) provide short- and long-term precipitation variations (Anderson, 2011, 2012; Yuan et al., 2013). Long-term (since 12.3 ka BP) total precipitation variations are provided by a complete high-resolution δ18O series from the analysis of a speleothem in Pink Panther Cave in the Guadalupe Mountains in New Mexico (Asmerom et al., 2007). In addition, the El Niño frequency from Ecuador and the Galapagos Islands in the eastern equatorial region is important for highlighting the variability of the El Niño Southern Oscillation (ENSO) during the Holocene (Conroy et al., 2008; Moy et al., 2002).
The resulting CPDF curve (Figure 3(a) and (b)) suggests the extreme floods cluster around certain decades and centuries during the past 10,000 years. Seven flood episodes are identified at 8040–7960, 4400–4300, 3600–3460, 2900–2740, 2390–1980, 1810–720, and 600–0 years BP. Several peaks occur around 7960, 3500, 2780, 2050, 1420, 1280, and 150 a BP. Below average probabilities are evident in the Early to Middle Holocene except for a few short and weak flood episodes at around 8000, 4500, 3500, and 2800 a BP. Most flood units are clustered in the Late Holocene (after ∼2400 a BP), indicating that it was a period of more frequent extreme flooding. The earliest flood episode (8040–7960 a BP) is characterized by four large floods on the Delores River (Figure 3(e)). Two weak and short flood episodes (4400–4300 and 3600–3460 a BP) are seen at Lees Ferry and on the Paria, Escalante and Delores rivers. The 2900–2740 a BP flood episode includes two extreme floods on the Delores River (Figure 3(e)). The following two flood episodes (2390–1980 and 1810–720 a BP) include 40% (33/82) of all available ages prevailing in all studied reaches except for the Lower Green River. The latest episode (600–0 a BP) prevails in all studied reaches except for the Delores River (Figure 3).
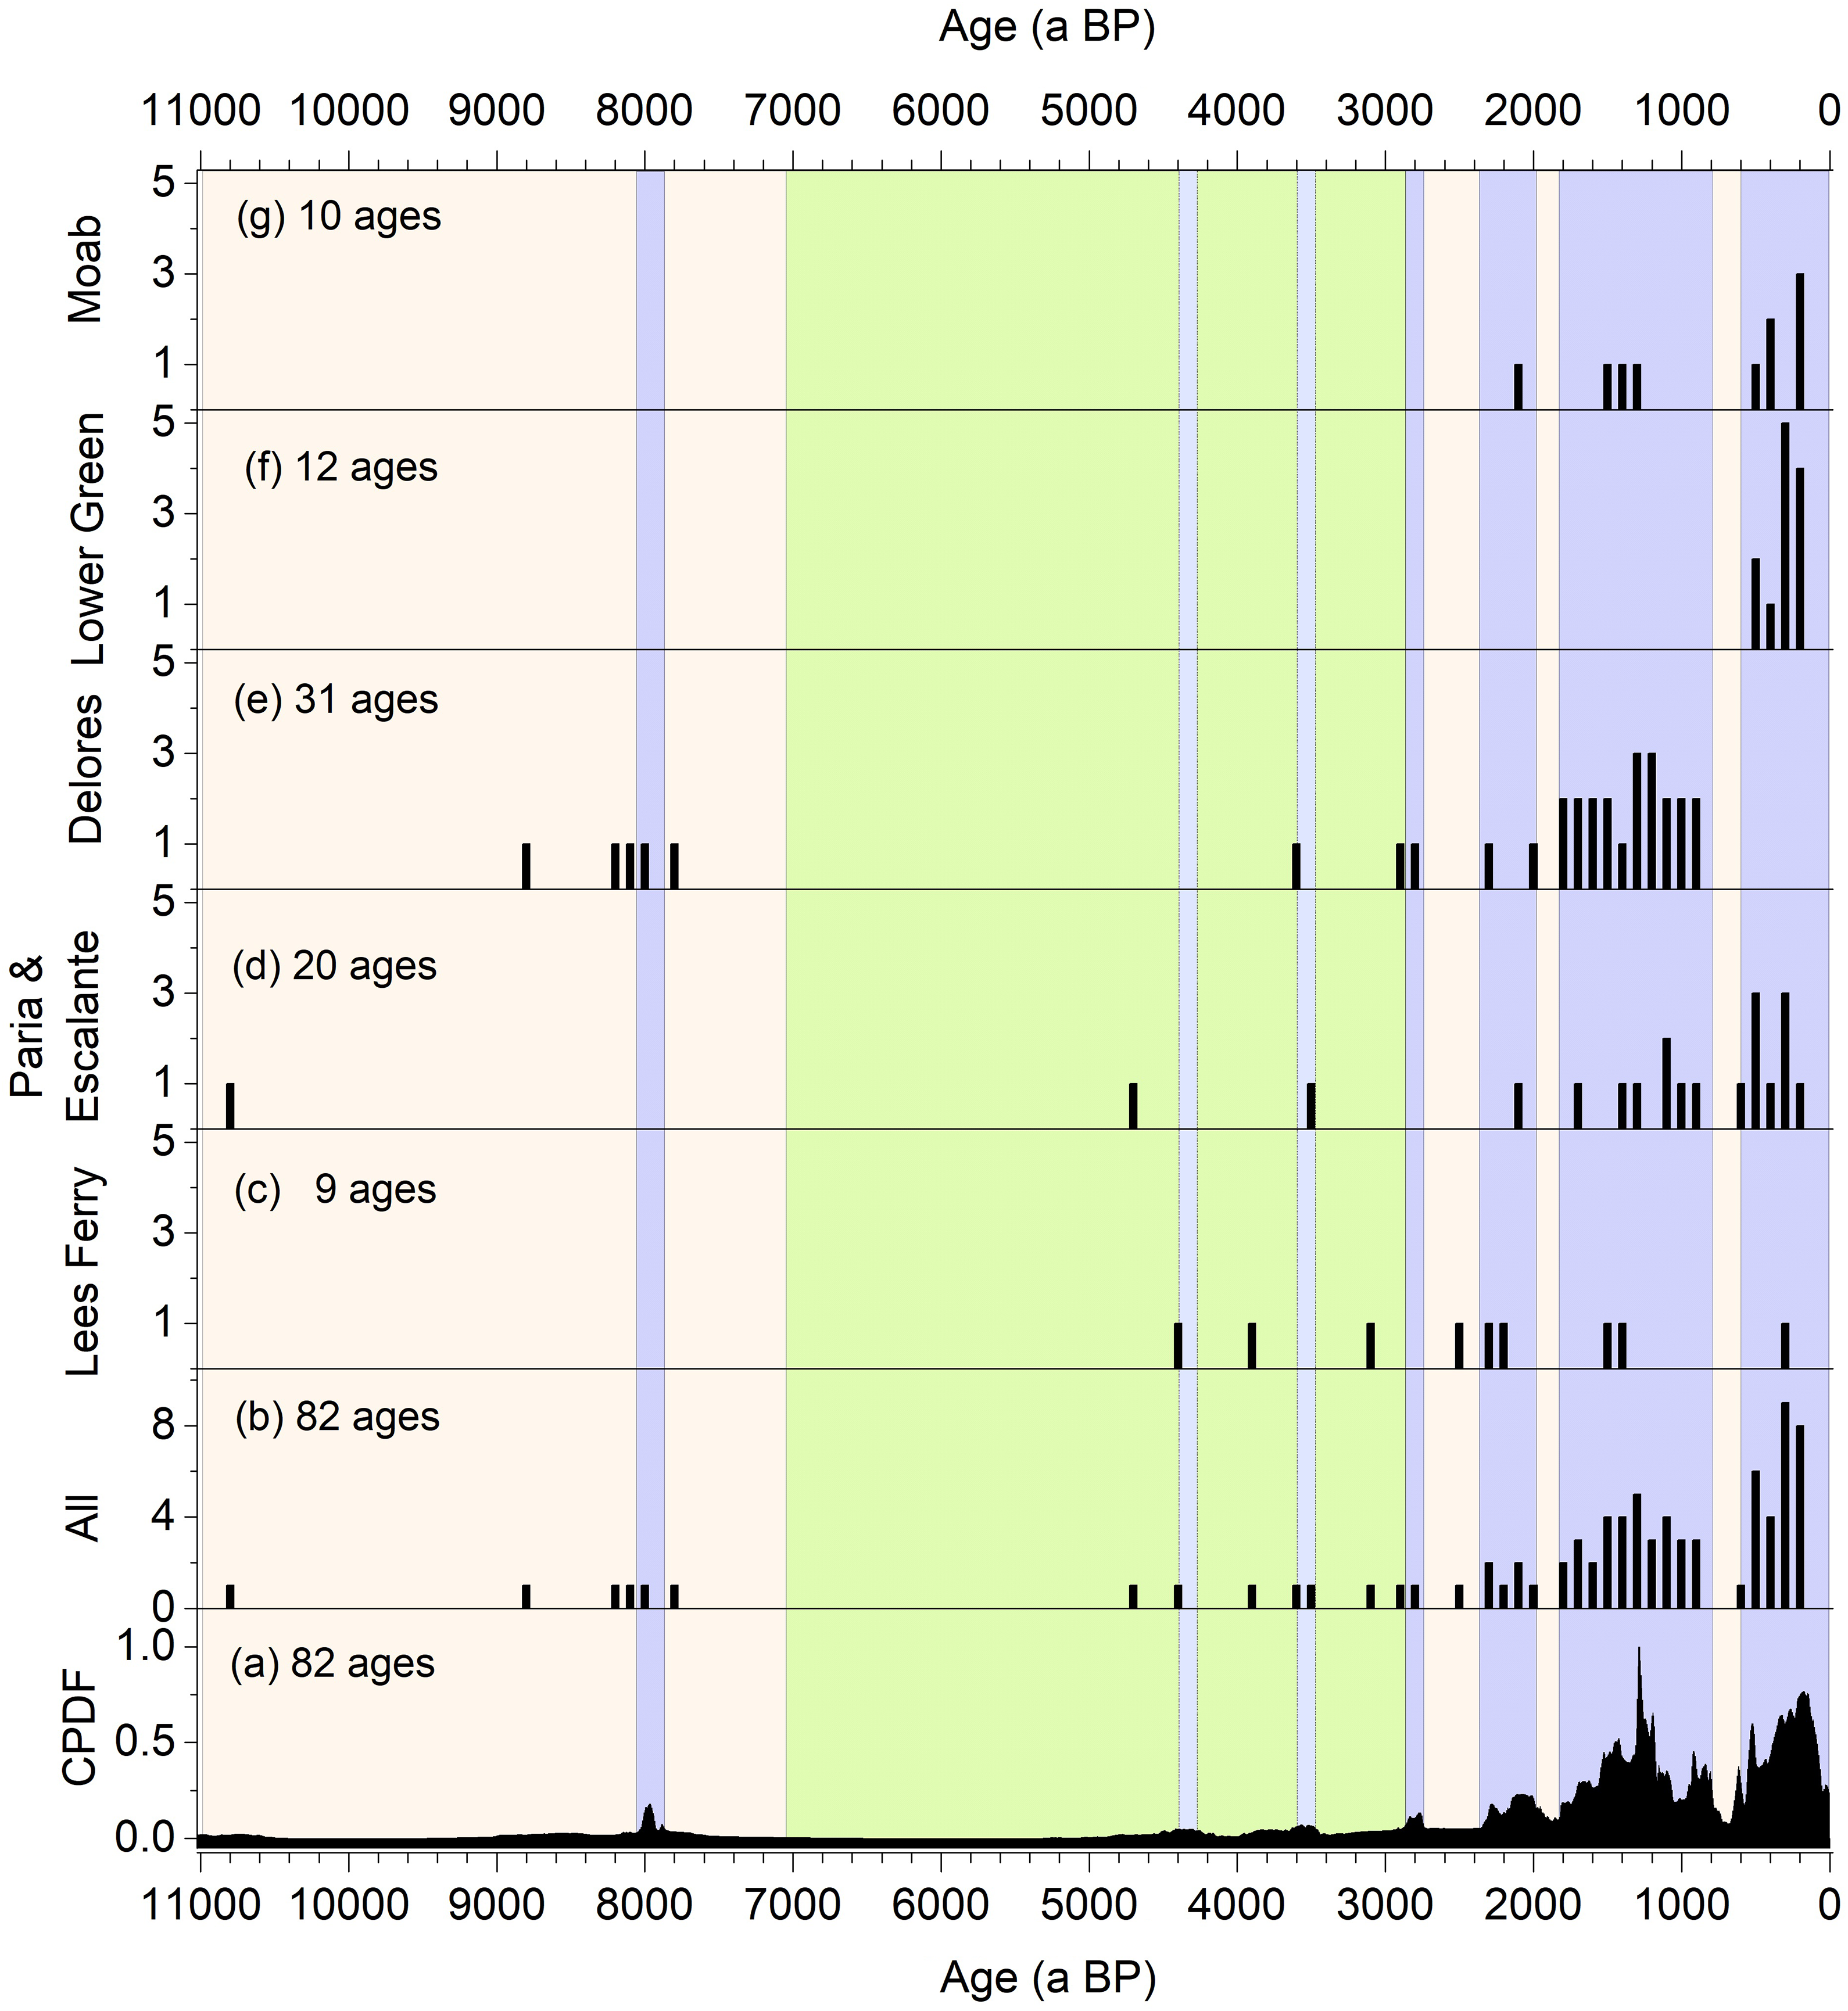
Comparison of (a) the cumulative probability distribution function from the Upper Colorado River Basin with the flood frequency column plots based on (b) all selected flood ages, (c) 9 ages at Lees Ferry, Colorado River, (d) 20 ages on the Paria and Escalante Rivers, (e) 31 ages on the Delores River, (f) 12 ages on the Lower Green River, and (g) 10 ages at Moab, near the Colorado River. Light pink shading (10500–6700 a BP and after 2800 a BP) indicates overall dry periods, green shading (6700–2800 a BP) indicates a relatively stable wet period, and blue shading (8040–7960, 4400–4300, 3600–3460, 2900–2740, 2390–1980, 1810–720, and 600–0 years BP) indicates seven flood episodes. CPDF: cumulative probability distribution function; PDB: Peedee belemnite. For interpretation of the references to colours in this figure legend, refer to the online version of this article.
Figure 4 shows the CPDF flood curves for both the UCRB (a) and for bedrock reaches of rivers and streams from throughout the Lower Colorado River Basin (LCRB) and its vicinity (b). These are compared with the δ18O records ((c), (d),(e), and (f)) mentioned above, and to the ENSO variability index (g). All studies exhibit high δ18O, indicating the arid conditions with rainfall-dominated precipitation during the Early to Middle Holocene (10500–6700 a BP) (Figure 4, light pink shading; Anderson, 2012; Asmerom et al., 2007; Yuan et al., 2013). The long-term decreasing trend of δ18O values indicates a gradual decrease in the monsoon-dominated precipitation regime (Friedman et al., 1988; Yuan et al., 2013). However, the negative excursion in a δ18O stalagmite record around 8000 yrs BP indicates a winter Pacific-derived precipitation increase (Figure 4(f)), which indicates a relatively brief wet interval during prevailing dry conditions (Asmerom et al., 2007). This corresponds to the flood clustering around 8000 yrs BP observed in both the UCRB (Figure 4(a)) and the bedrock reaches in the southwestern USA (Figure 4(b)) (Harden et al., 2010). This suggests the extreme flood clustering was likely induced by abnormally increased frequent Pacific-derived storms. These storms can include winter North Pacific frontal storms or late summer and fall storms associated with Pacific tropical cyclones over the Four Corners area in conjunction with a mid-latitude low-pressure trough.
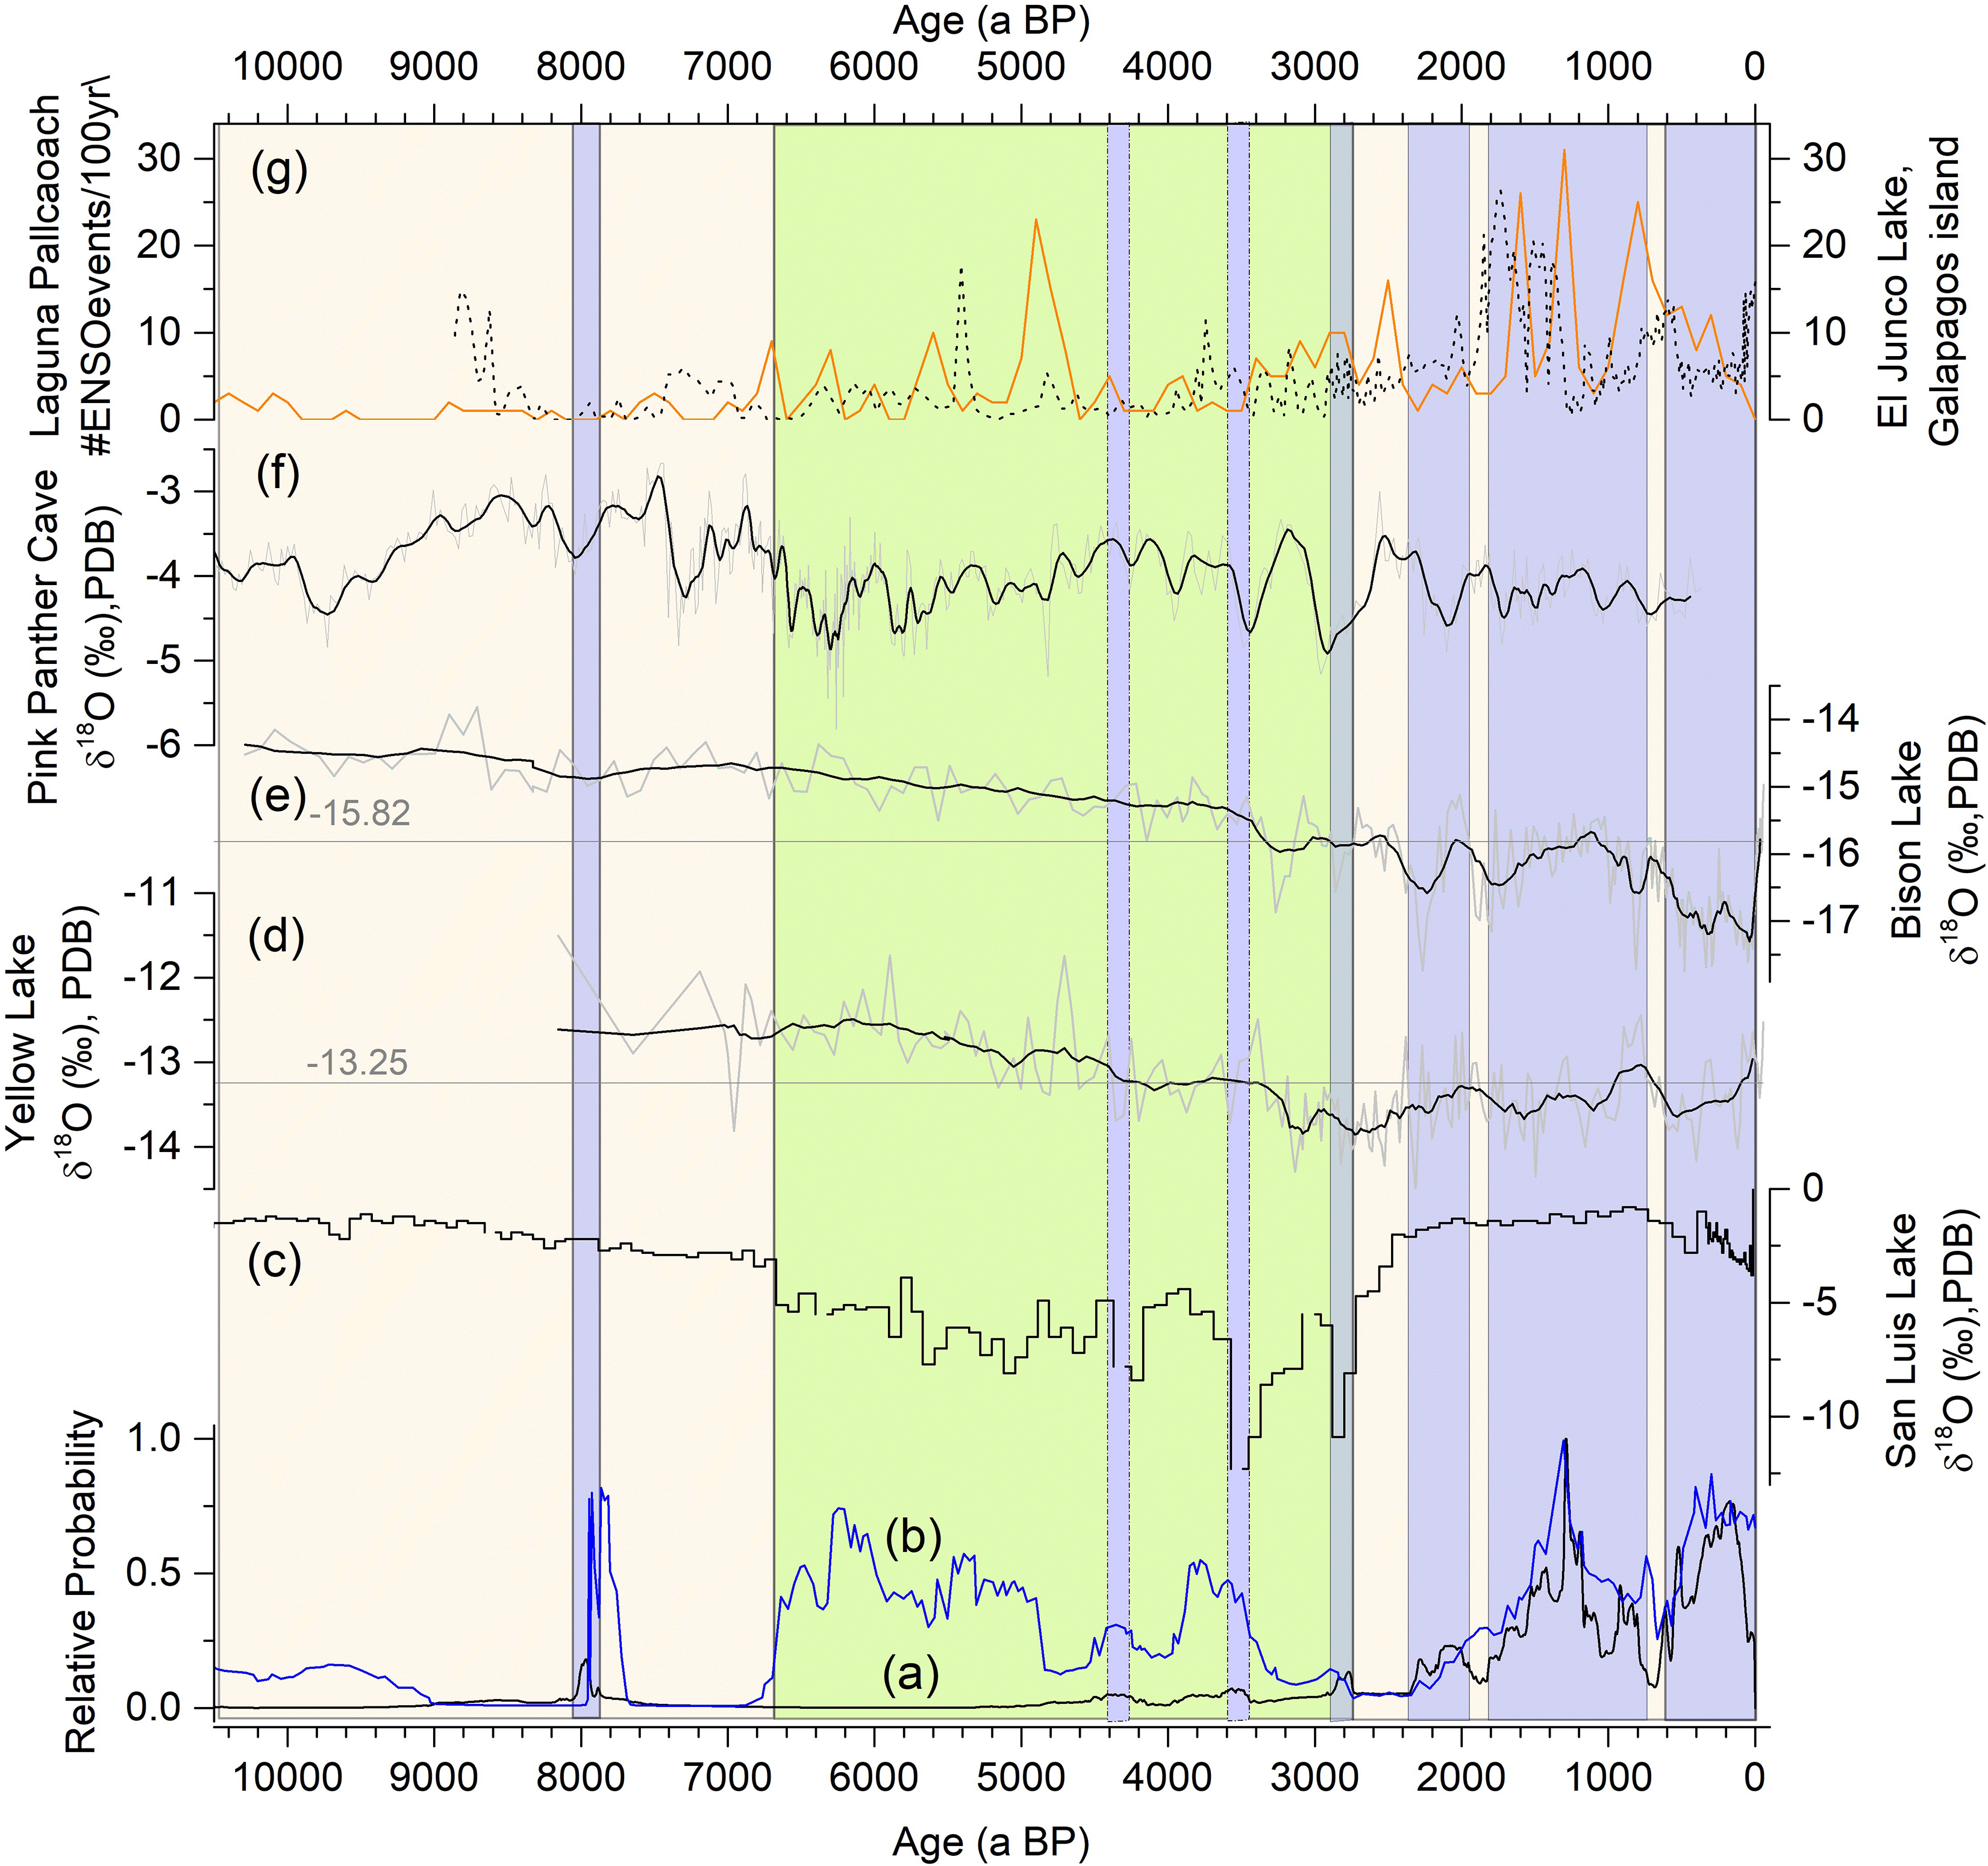
Comparison of the cumulative probability distribution function from (a) the Upper Colorado River Basin and (b) the bedrock reaches in the southwestern USA (Harden et al., 2010), with climate records from (c) δ18O of San Luis Lake (Yuan et al., 2013), (d) and (e) δ18O of Yellow and Bison lakes (Anderson, 2011, 2012), (f) δ18O of a speleothem from Pink Panther Cave (Asmerom et al., 2007), and (g) ENSO frequency reconstructions from El Junco Lake (dashed line, Conroy et al., 2008) and Lake Palcacocha (orange line, Moy et al., 2002). Light pink shading (10500–6700 a BP and after 2800 a BP) indicates overall dry periods, green shading (6700–2800 a BP) indicates a relatively stable wet period, and blue shading (8040–7960, 4400–4300, 3600–3460, 2900–2740, 2390–1980, 1810–720, and 600–0 years BP) indicates seven flood episodes. ENSO: El Niño Southern Oscillation; PDB:
The relatively low and decreasing trends of δ18O from the three lakes records (Figures 4(c), (d), and (e)) between 6700 and ∼2800 yrs BP suggest stable wet condition with a corresponding winter-dominant precipitation regime (Figure 4, green shading; Anderson, 2011 and 2012; Yuan et al., 2013). This climate pattern is interpreted as a southward shift in the strengthening Pacific airstreams (e.g. the Polar jet stream (PJS)) (Metcalfe et al., 2015 and its references). A low-to-zero probability of extreme floods characterizes this overall wet climate period for the UCRB with the exception of relatively weak and short flood probability episodes at approximately 4400, 3500, and 2800 yrs BP. In contrast, this wet period coincided with two flood probability episodes, both of a relatively long duration, for the bedrock systems in the LCRB and its vicinity (Ely, 1997; Ely et al., 1993; Harden et al., 2010). A possible reason for this contrast pattern in flood episodes might be that the winter-dominant precipitation originating from the PJS fell and was stored as snowpack in the colder UCRB. It was less likely to experience rapid melting to generate high-magnitude flood peaks in spring. Therefore, it seems unlikely that the relatively lower summer precipitation expected during the winter-dominant precipitation regime would produce very large summer flow peaks. In contrast, the overall wet climate with a winter-dominant precipitation regime originating from the PJS led to a flood-prone context in the entire southwestern USA in its warmer southern areas. A good analogy would be the extreme winter floods in Arizona in 1993 that were caused by both antecedent conditions (i.e. reputedly, rain on snow) and an abnormally high total precipitation depth.
The three weak flood episodes around 4400, 3500 and 2800 yrs BP in the UCRB and a short flood episode between 4500–3300 yrs BP in the bedrock systems of the southwestern USA generally correspond to three pronounced negative excursions of δ18O in the San Luis Lake (Figure 4(c)) and two in the Pink Panther Cave (Figure 4(f)). The period 4000–3000 a BP saw widespread pluvial events (a “Neopluvial”) in the greater southwest, which corresponds well with a cooling of the North Pacific and an abrupt southward displacement of the PJS (Yuan et al., 2013). This period is also consistent with the shift in the NAM, which originates predominantly from the Pacific Ocean (Jones et al., 2015b) and an increase in frequency and strength of the ENSO (more frequent occurrences of El Niño) beginning around 4000 years ago (Conroy et al., 2008; Donders et al., 2008).
After ∼2800 a BP, a gradual northward shift of the PJS, indicated by the San Luis Lake δ18O variability (Figure 4(c), (d), and( e)), led to a considerable reduction in winter precipitation in southern Colorado and the Four Corners area, which includes the southern section of the UCRB (Yuan et al., 2013). This low winter precipitation and these dry conditions persisted until the Medieval Climate Anomaly (MCA) 1150–700 yrs BP). By contrast, the amount of snowfall as a fraction of total precipitation increased in the northern UCRB until ∼2300 yrs BP (Anderson, 2011 and 2012). Although the variability of the ENSO increased sharply between 2700–2400 yrs BP (Figure 4 (g)), there was a low probability of extreme flood episodes in this period for the entire CRB and its vicinity (Ely, 1997; Ely et al., 1993; Harden et al., 2010). This implies that North Pacific-derived precipitation was more likely to be the dominant factor in relation to extreme floods in the southwestern USA.
After ∼2300 a BP, δ18O variability in San Luis, Bison, and Yellow lakes (Figure 4(d), (e), and f) suggests overall dry conditions with comparatively high summer/winter precipitation for the UCRB (Anderson, 2011 and 2012; Yuan et al., 2013). During this period, tree-ring records also provide evidence for decadal–centennial scale megadrought conditions across the southwestern USA during the MCA (Cook et al., 2004; Routson et al., 2011; Stahle et al., 2012). Negative excursions in lower overall δ18O values represent an abrupt decade-to-century increase in winter precipitation as a fraction of total precipitation (Anderson, 2011, 2012). This coincides with the increasing dominance of the ENSO (Conroy et al., 2008; Moy et al., 2002), which seems to have brought a return to slightly wetter conditions in some locations in the northern margin of the NAM region (Barron and Anderson, 2011; Metcalfe et al., 2015). This climate regime could well have triggered more rain-on-snow events during the spring snowmelt season, which would have increased the likelihood of large floods. The timing of this change coincides with the UCRB’s most dominant flood probability episodes (2390–1980 and 1810–720 yrs BP), and also with the flood probability record for the bedrock systems of the LCRB and its vicinity (Ely, 1997; Ely et al., 1993; Harden et al., 2010).
After 600 yrs BP, the δ18O values in the records pertaining to the three lakes (Figures 4(c), (d), and (e)) indicate the prevalence of more arid conditions with slightly more winter precipitation during the Little Ice Age (LIA) (∼350–200 yrs BP) in the Rocky Mountains (Anderson, 2011 and 2012; Yuan et al., 2013). This is consistent with the extreme flood episode in the bedrock systems in the LCRB and its vicinity (Harden et al., 2010) and with the prominent peaks of high-magnitude floods for river and streams in Arizona and southern Utah over the last 500 years (Ely, 1997; Ely et al., 1993). This is also the period during which flood deposits are more likely to have been preserved in many sites in the UCRB given that their analyses contribute nearly a quarter of total geochronology used to construct the CPDF curve.
The UCRB flood episodes at around 8000, 3500, 2800, 2390–1980, 1810–720, and after 600 yrs BP are consistent with flood probability records in the LCRB and its vicinity, and all of these correspond to punctuated North Pacific-derived winter precipitation during both overall wet and dry climate periods. In contrast, the timing of stable dry periods (10,500–6700 yrs BP) and persistent wet periods (6700–2700 yrs BP) corresponds to relatively few extreme floods for the UCRB. Increased frequency of El Niño events seems to have played a subordinate role in relation to large UCRB floods, given some concurrences (1810–720 a BP) are seen after about 2300 yrs BP. Of course, this relationship is based on the relatively small number of currently identified SWD units, indicating the need for a great deal more paleoflood hydrological research in the UCRB. The evidence suggests that the temporal clustering pattern of extreme paleofloods in the UCRB is a consequence of abruptly intensified North Pacific-derived storms associated with enhanced variability of the ENSO.
V Discussion
We have identified extreme flood temporal patterns and their likely climatic controls for the UCRB by estimating extreme flood events during the Holocene and comparing our findings with proxies of long-term climatic change. The results reflect the realities of the naturally occurring range of possibilities for flood magnitudes in the UCRB, rather than the conventional approach of extrapolating by FFA to project large magnitudes from samples of small-scale flood events. As a result, the natural extreme flood history and its temporal clustering pattern advance scientific understanding of extreme floods and their climatological context for the UCRB.
Our results are limited to the current state of hydrologically analyzed paleoflood data. This may induce potential issues such as more ages skewing to the past 2300 years and older floods skewing to small magnitudes, partially because older deposits seem to have more chance of being eliminated by erosion and obscured by deposition. However, the process of flood sedimentation, the sedimentary environment and its context, and its preservation can be very different and, therefore, the number of flood deposits varies greatly in different locations, such as flood records during the last 500 years being found in many sites except for the Delores River Basin (Figure 3). It is hard to determine quantitively the completeness of the natural record for such a long period as the entire Holocene. Nevertheless, the results indicate both the great potential for meta-analysis of real extreme floods and the potential for using the immense untapped wealth of the many paleoflood sites that occur in the UCRB and other places around the world. With more on-site paleoflood investigations in the future, a more robust natural-evidenced extreme floods database can be built up and, therefore, provide updated opportunities to investigate the insights into extreme floods behavior this would offer.
Naturally well-preserved paleoflood records, historical–archival flood information, and instrumentally measured datasets all supply essential information that can be relied upon for statistical analysis and for deepening understanding of extreme floods behavior. A periodically updated compilation of historical and paleoflood records collected by the PAGES Floods Working Group embraces the published past flood records in Europe, North America, Asia, and other places in the southern hemisphere (Wilhelm et al., 2018).
Except for Spain, the United Kingdom (Kjeldsen et al., 2014), China (Luo, 2006; SL44-2006), and the USA (England et al., 2018), where a review of natural and historical sources is legally required or suggested, few other countries legally require paleoflood and/or historical flood investigation to be undertaken prior to the implementation of infrastructural measures for flood control and other water resource projects. Hopefully, the recent advances in the science of paleoflood hydrology will encourage more nations to follow these leads.
VI Conclusions
Unlike the LCRB, where the compilation of information pertaining to extreme paleofloods is well developed (Ely, 1997; Ely et al., 1993) and updated (Harden et al., 2010), and despite an abundance of sites containing detailed paleoflood evidence, very few paleoflood hydrological analyses have been done for vast areas of the UCRB—a critical water resource region because of its extensive winter snowpack. This study is an early step in developing a UCRB chronology and probability record of extreme paleoflood incidences. Nevertheless, the existing record highlights evidence of naturally occurring floods that are much larger than those previously measured and documented for the basin. The results are a truer understanding of the naturally occurring range of possibilities for flood magnitudes and a greater understanding of the actual flood hazard in terms of what can be expected in the current period of rapidly changing climate: what has already happened can, indeed, happen again.
Based on extensive paleoflood investigations and geochronological analyses, we used meta-analysis to investigate the history of the Holocene extreme floods in the UCRB. The flood clusters for the UCRB indicate that periods of frequent extreme flooding occurred during the age ranges of 8040–7960, 4400–4300, 3600–3460, 2900–2740, 2390–1980, 1810–720, and 600–0 a BP. The temporal clustering pattern of extreme paleofloods in the UCRB likely results from abruptly intensified North Pacific-derived storms associated with the enhanced variability of El Niño, and this occurs regardless of the prevailing climate period being dry or wet.
This first meta-analysis of Holocene 14C- and OSL-dated SWD units from across the entire UCRB demonstrates that CPDFs enable an objective definition of flood activity periods. This approach also demonstrates the value of creating paleohydrological databases and comparing them with hydro-climatic proxies in order to identify natural patterns and discover possible linkages to fundamental processes such as changes in climate. Further site-based studies of paleoflood history throughout the UCRB and other drainage basins should be encouraged so that additional data can be applied to improve our understanding of how floods in different regions respond to climate variability.
Supplemental material
Liu_Supplementary_1_gpm - Holocene extreme paleofloods and their climatological context, Upper Colorado River Basin, USA
Liu_Supplementary_1_gpm for Holocene extreme paleofloods and their climatological context, Upper Colorado River Basin, USA by Tao Liu, Lin Ji, Victor R Baker, Tessa M Harden and Michael L Cline in Progress in Physical Geography: Earth and Environment
Footnotes
Declaration of conflicting interests
The author(s) declared no potential conflicts of interest with respect to the research, authorship, and/or publication of this article.
Funding
The author(s) disclosed receipt of the following financial support for the research, authorship, and/or publication of this article: This research was supported by the U.S. Bureau of Reclamation Assistance Agreement no. R16AC00021 and the China Scholarship Council (no. 201506870015). Some of the paleoflood data utilized in this study involved field collection with participation by Jeanne Godaire, Noam Greenbaum, Jill Onken, and John Weisheit; as well as OSL laboratory analyses in collaboration with Tammy Rittenour and Noaomi Porat.
Supplemental material
Supplemental material for this article is available online.
References
Supplementary Material
Please find the following supplemental material available below.
For Open Access articles published under a Creative Commons License, all supplemental material carries the same license as the article it is associated with.
For non-Open Access articles published, all supplemental material carries a non-exclusive license, and permission requests for re-use of supplemental material or any part of supplemental material shall be sent directly to the copyright owner as specified in the copyright notice associated with the article.