
Abstract
Knowledge of the location, area and extent of rubber plantations is a prerequisite for assessing their ecological and environmental impacts. Mainland Southeast Asia (MSEA) and Yunnan province (MSEA&YN) in China are globally important rubber-planting regions. Rubber cultivation in areas at moderate and low altitudes (<1000 m) within these regions has expanded rapidly in recent years. However, datasets of maps generated at a fine spatial resolution are still unavailable for MSEA&YN. Because of this, three relevant and important questions remain unanswered: what are the northernmost boundary for rubber production in these regions, what is the highest altitude at which rubber is produced, and how are the plantations distributed in (cross-) border regions? An approach of the phenology- and Landsat-based re-normalized vegetation index (RNVI), originally developed for Xishuangbanna in southern China, is used in this study to verify the feasibility of mapping mature rubber plantations in MSEA&YN using the Landsat 8 Operational Land Imager data products acquired from January to April, 2013 to 2018. Characteristics of the vertical and horizontal distributions of mature rubber plantations in MSEA&YN, as well as national differences especially in the (cross-) borders, were examined using the generated map. The results showed that the RNVI method, although tailored to the northern edge of the tropics, is useful for detecting mature rubber plantations in MSEA&YN. The latest map of mature rubber plantations indicated that they occupied a total area of 7.69 × 10⁶ ha, accounting for 3.32% of the study area. Spatial analyses showed three typical features of the distribution: new plantations at higher (over 1000 m) and lower (below 200 m) elevations, more cultivation in the borderlands (over a half within 60 km buffers), and their northward movement (as far as 25°N). The results of this study have important implications for phenological methods verification in the tropics, and provide valuable information on mature rubber plantations in MSEA&YN.
Keywords
Ⅰ Introduction
Around 40 to 50 developing countries in the tropics have established rubber tree (Hevea brasiliensis) plantations since the end of the Second World War, particularly in South/Southeast Asia, South America, and Central Africa (Ahrends et al., 2015; Fox et al., 2014a). The Food and Agriculture Organization (FAO) of the United Nations has reported that over the last two decades, yet nearly 97% of the world’s natural rubber latex supply has originated from Southeast Asia (SEA) (FAO, 2010; Li and Fox, 2012). In particular, FAO statistics in 2017 showed that rubber yields and area harvested in mainland SEA (MSEA) accounted for about 65% and 53% in SEA, respectively. With the strengthening of regional geopolinomical cooperation between MSEA nations and neighbouring countries (e.g. China) (Li et al., 2018), rubber plantations in MSEA have undergone extensive, rapid, and trans-national expansion since the 2000s (Baird, 2010; Liu et al., 2013; Tang et al., 2019; Xiao et al., 2019a). Against this backdrop, land reclaimed for rubber plantations in MSEA may double or triple by 2050 (Fox et al., 2014b; Grogan et al., 2019; Ziegler et al., 2009). Some research has shown that the increase in rubber plantations in MSEA has come at the cost of tropical evergreen forests and traditional swidden agriculture (Fox and Vogler, 2005; Li and Feng, 2016; Li et al., 2018; Qiu, 2009; Zeng et al., 2018a).
With increasing rubber plantations, the “rubber controversy” has become an important issue in tropical agricultural expansion and forest retreat (Qiu, 2009; Tan et al., 2011; Zeng et al., 2018b). One fashionable perspective is that rubber plantations greatly enhance the income of local farmers and government revenue (Mann, 2009). However, they also have significant ecological and environmental impacts on hydrological processes (Qiu, 2010), soil quality (Liu et al., 2018), carbon sequestration (Li et al., 2008), and biological diversity (Li et al., 2007). Large-scale (e.g., MSEA as an emerging rubber-producing region) information on the spatial distribution of rubber plantations remains elusive (Dong et al., 2012, 2013). Given the availability of historical Landsat imagery (Loveland and Dwyer, 2012; Woodcock et al., 2008) and related advanced data products (e.g., Analysis Ready Data) (Zhu et al., 2019), the application of Landsat images (e.g., Operational Land Imager (OLI)) for tracking land cover and land use changes becomes more feasible (Grogan et al., 2019; Melaas et al., 2013; Wang et al., 2018), including the mapping of rubber plantations (Chen et al., 2018; Xiao et al., 2019b).
To date, Landsat vegetation indices (VIs) and their combinations, such as the Normalized Difference Vegetation Index (NDVI) (Robinson et al., 2017; Tucker et al., 1986), Normalized Difference Vegetation Index (NDMI) (Grogan et al., 2015; Vogelmann and Rock, 1988), Land Surface Water Index (Wang et al., 2018; Xiao et al., 2004), Enhanced Vegetation Index (Dong et al., 2016; Huete, 1988), and Normalized Burn Ratio (NBR) (Frazier et al., 2018; García and Caselles, 1991; Li et al., 2015), have been used to detect and map rubber plantations. The relevant studies have focused on small-scale, regional mapping of rubber plantations in traditional planting regions like Indonesia and Malaysia (Razak and Shariff, 2018; Trisasongko, 2017) as well as emerging rubber-growing areas such as Xishuangbanna (Fan et al., 2015; Kou et al., 2015; Sun et al., 2017; Xiao et al., 2019c), Hainan Island (Chen et al., 2018; Dong et al., 2013) in southern China, northeast Thailand (Li and Fox, 2011), and the borders of China, Myanmar, and Laos (Liu et al., 2013, 2016), the Cambodia–Vietnam border (Ye et al., 2018), and the China–Laos border (Chen et al., 2018; Tang et al., 2019; Xiao et al., 2020a). However, few studies have been concerned with developing robust algorithms over larger areas, such as the entire MSEA (Chen et al., 2016). A Mahalanobis typicality approach that integrated Moderate Resolution Imaging Spectroradiometer (MODIS) products and national statistical information was used to generate the first 250-m map of rubber plantations in MSEA (Li and Fox, 2012). However, the mixed-pixel issue of coarse MODIS data (250 m) caused misclassification for mapping household-owned rubber plots at a regional scale (Nomura and Mitchard, 2018). Therefore, large-scale (e.g., MSEA) and sound algorithms for mapping rubber plantations and delineating the latest patterns of their spatial expansion were needed.
We recently proposed a modified phenology-based normalization method, called the re-normalized vegetation index (RNVI), based on the Landsat-derived NDMI and NBR to generate maps for annual mature rubber gardens in Xishuangbanna, southern China, to the north of MSEA (Xiao et al., 2019c). Landsat-derived NDMI and NBR have been shown sufficient sensitivity to detect phenological changes in rubber plantations (Dong et al., 2013; Kou et al., 2015; Xiao et al., 2019a; Ye et al., 2018). The Landsat-based RNVI emphasizes phenological variations in the NBR, reflecting surface moisture and vegetation survival (Li et al., 2015), and the NDMI, reflecting land surface moisture content (Xiao et al., 2004) of rubber plantations during seasonal dry periods (Dong et al., 2013; Fan et al., 2015). More importantly, compared with the ratioing method of individual band (e.g., near-infrared (NIR)), the (re)normalization of bands or VIs considerably reduces errors caused by surface anisotropy, saturation, and topographical variations (Gutman, 1991; Huete et al., 1997). Phenology-based approaches have also shown promise for reducing the demand for data to monitor rubber plantations (Li et al., 2015; Xiao et al., 2019a; Zhai et al., 2018). In the RNVI approach, only two target images of the defoliating phase and the other when new leaves emerge were needed to satisfy the data requirement. Thus, a phenology-based normalization approach may be applicable to a large-scale region (Dong et al., 2013; Fan et al., 2015; Xiao et al., 2019d). To the best of our knowledge, no previous study has applied Landsat data to delineate information on rubber plantations in MSEA and Yunnan province (MSEA&YN).
By using Landsat-8 OLI data products including the spectral reflectance, VIs, and cloud coverage in the dry season, we aimed to (a) assess the potential and applicability of the multi-normalization method (the RNVI) for detecting spectral signals of rubber across MSEA&YN, and generate the latest 30-m map of mature rubber plantations, and (b) examine the spatial pattern and geographical characteristics of the region, especially the trends of expansion in the latitudinal, vertical, and horizontal directions (or the “3 directions (3Ds)”) at the regional and national levels. If the RNVI method is feasible in MSEA&YN, it could address the three unanswered questions related to the establishment and expansion of rubber plantations in the 3Ds: (a) what are the northernmost boundary for rubber production in these regions, (b) what is the highest altitude at which rubber is produced, and (c) how are the plantations distributed in (cross-) border regions? The spatial information on the rubber plantations provided here could support the use of the available databases to assess the economic, ecological, and environmental effects of rubber plantations.
Ⅱ Study area and materials
2.1 Study area
MSEA&YN (Figure 1) has a total area of 231.91×10⁶ km2. MSEA is a geographically important part of Zomia and the SEA Massif (Michaud, 2010), and includes Cambodia, Laos, Myanmar, Thailand, and Vietnam (Grogan et al., 2019). The elevation of MSEA&YN declines sharply from northwestern Yunnan, over 6000 m, to sea level based on the second version of the Advanced Spaceborne Thermal Emission and Reflection Radiometer (ASTER) Global Digital Elevation Model (GDEM) (Tachikawa et al., 2011).
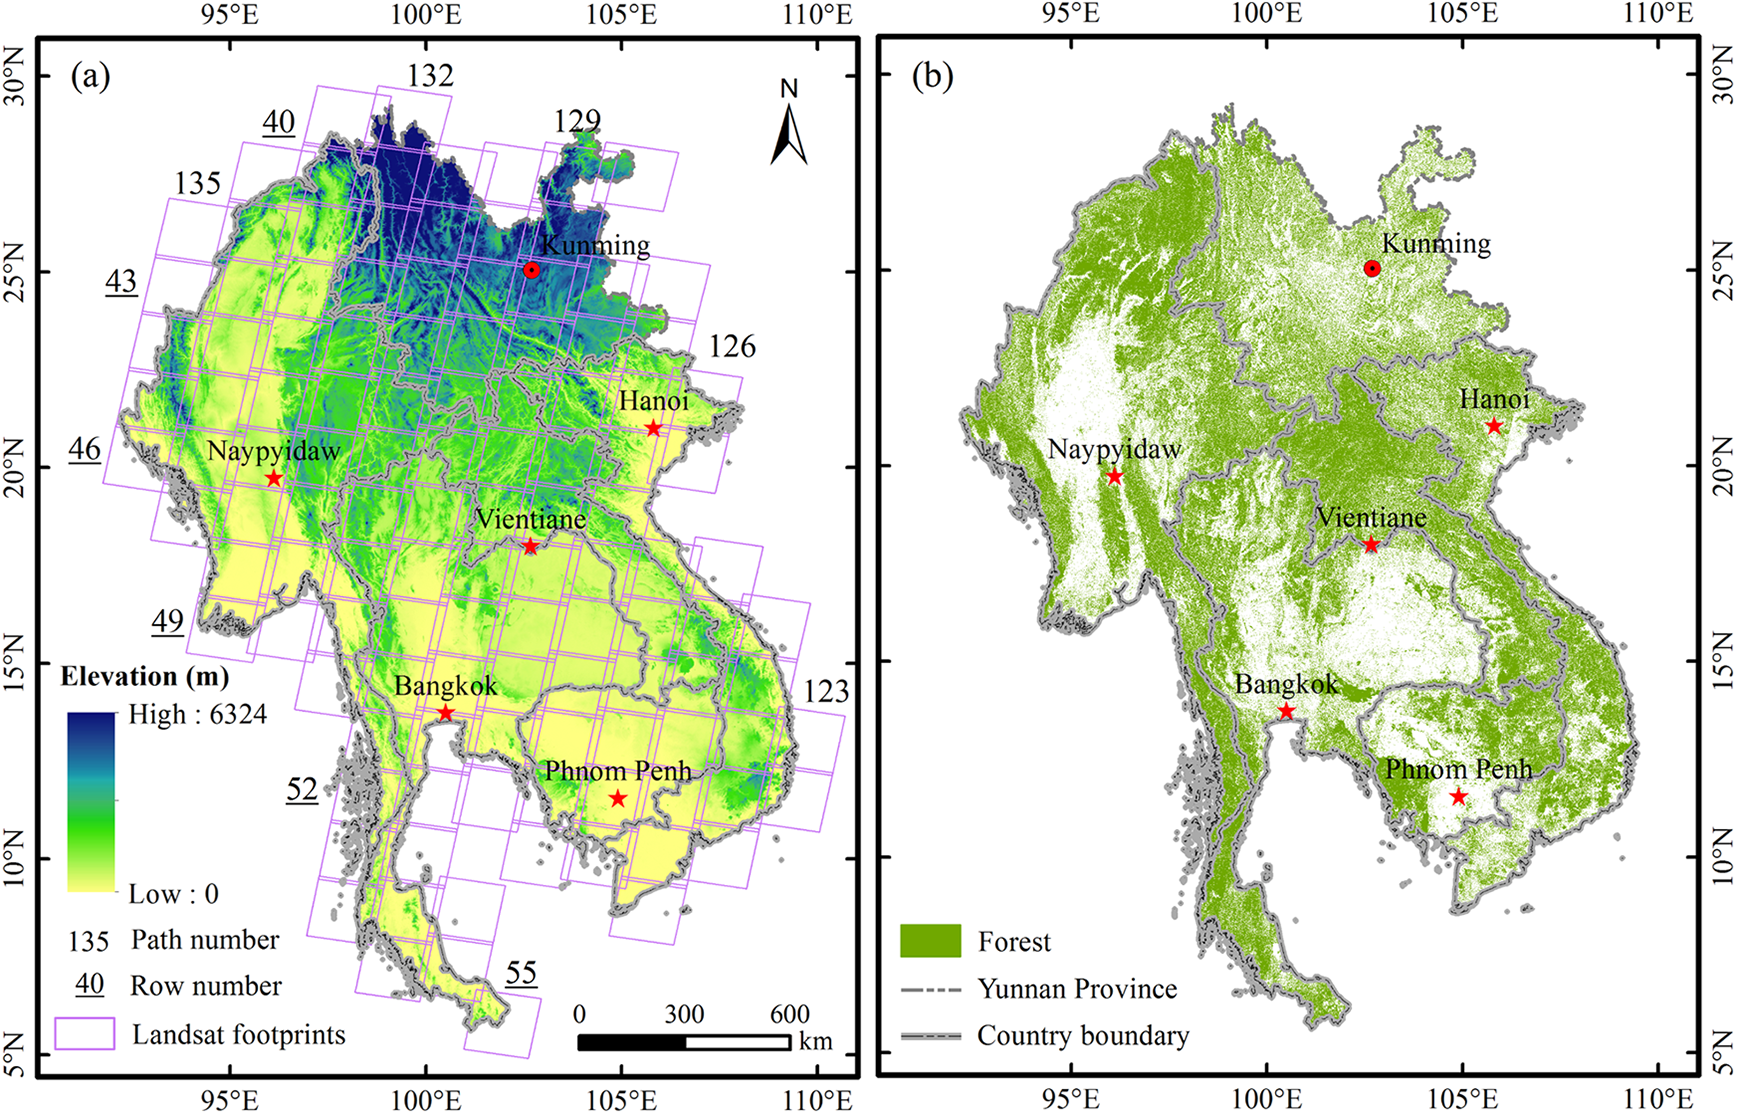
(a) Maps of the study area and the GDEM-based topography showing the 122 Landsat-8 OLI footprints (Path/Row) over MSEA and Yunnan Province of China (MSEA&YN). (b) The 2017 30-m map of land cover (overall accuracy of 72.35% (Gong et al., 2019; Li et al., 2017)) and the forest thematic information in MSEA&YN were derived from the Global Land-cover products provided by the National Science & Technology Infrastructure (NSTI) of China.
MSEA and southern Yunnan have a tropical monsoon climate characterized by notable seasonality, high temperature, and little precipitation, with dry spells of different durations (Chuan, 2005). With a typical summer monsoon climate, northern Yunnan has a diversity of climatic zones, ranging from tropical to alpine (Zomer et al., 2015). Two seasons occur owing to seasonal shifts of the northeast and southwest monsoon: the dry season (November to April) and the rainy season (May to October) (Chuan, 2005). The main feature of the half-year dry season is low-level cloud cover (CC) owing to infrequent rainfall (less than 20 mm per month). The climate conditions contribute not only to the establishment and growth of rubber trees, but also greatly facilitate the acquisition of minimal-CC and CC-free observations, that is, less than or equal to 30% for sensors of Landsat family (e.g., OLI) (Li et al., 2018; Xiao et al., 2018). Typically, natural forests in MSEA&YN comprise evergreen mountainous and lowland forests as well as secondary fragmented evergreen forests (Corlett, 2005; Stibig et al., 2007; Tang, 2010). The latest Landsat-based (30 m, 2017) global landcover products provided by the National Earth System Science Data Sharing Infrastructure, of the National Science and Technology Infrastructure (NSTI) of China (http://www.geodata.cn), shows that the forested area was 130.19 × 10⁶ ha (or 56.14% of the total area), where the non-forested parts includes croplands, waterbodies, and impervious surfaces. The NSTI-based forest map was applied to mask out non-forest land use types (e.g., paddy rice in the seedling and transplanting phases) and reduce spectral noise from vegetation-recovered (e.g., swidden agriculture or fallows) (Li and Feng, 2016; Li et al., 2018) and/or soil-exposed backgrounds.
Compared with native evergreen forests, adventive rubber trees have noticeable deciduousness features, with their leaves shedding over two to four weeks from mid-January or early February to late February or early March (Mann, 2009). Usually, rubber plantations in MSEA can be divided into young and mature, according to the 5- to 7-year period of rubber tapping to collect latex (Xiao et al., 2019b; Yi et al., 2014a). The rubber garden, as a non-indigenous land use category, is characterized by its periodical deciduousness and smallholder systems (Manivong and Cramb, 2008; Nomura and Mitchard, 2018). For a given location in the study area, mature rubber plantations temporally display varied phenological landscapes as their leaves turned red and/or yellow, defoliate, and re-emerge as the canopy recovers, particularly in the senescencing and re-greening periods. Rubber trees are well adapted to periods (i.e., months) of drought-induced stress through deciduousness in the dry season (Ye et al., 2018). Given global continuous demand for rubber latex, rubber plantations have undergone extensive expansion (Zeng et al., 2018b). According to the FAO, the area of rubber plantations increased by 3.58 × 10⁶ ha (about sixfold) from 1961 to 2018 in Cambodia, Myanmar, Thailand, and Vietnam.
2.2 Landsat-8 OLI data and imagery preprocessing
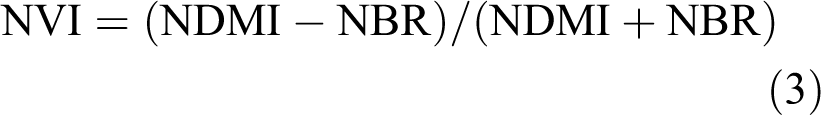
To generate the 30-m map of the rubber plantations, Landsat-8 OLI standard high-level surface reflectance products for the study area during 2013–2018 were downloaded from the U.S. Geological Survey Earth Resources Observation and Science (EROS) Center Science Processing Architecture (ESPA) (https://espa.cr.usgs.gov/). EROS ESPA offers high-quality data products, such as the surface reflectance of multi-spectral bands, pixel quality assurance (PQA), and seven commonly used spectral VIs (e.g., NDMI and NBR) (U.S. Geological Survey, 2018). Geometric, radiometric, atmospheric, and precision corrections were carried out for these data products. The Landsat Ecosystem Disturbance Adaptive Processing System was applied to retrieve surface reflectance data (Masek et al., 2006). Two VIs—the NDMI and NBR—were used to detect rubber plantations (pixels). All pixels of the CC and cloud shadows were masked out using PQA data. The VIs were calculated with the following equations:


where ρNIR, ρSWIR1, and ρSWIR2 refer to the surface reflectance values of the OLI NIR (band 5), SWIR 1 (band 6) and SWIR 2 (band 7).
A total of 122 Landsat footprints (path/row (P/R), Figure 1) were required to cover the study area based on the second Worldwide References System (WRS-2) (http://landsat.usgs.gov/tools_wrs-2_shapefile.php). Given that the RNVI approach highlights inverse changes in the vegetation–moisture indices between the defoliation and foliation phases, 244 scenes (or two images for each footprint), typically taken between January and April with CC values less than or equal to 30%, were carefully selected to extract the rubber pixels during critical temporal windows in the dry season. OLI images in May (early stage of the rainy season and the post-foliation phase) were also used as alternative data sources. We thus collected 19 scenes (or 7.79%) in January, 103 (or 42.22%) in February, 70 (or 28.69%) in March, 49 (or 20.08%) in April, and only three (or 1.22%) in May. Because the RNVI method highlights the defoliation process, more than 87.70% of the 122 scenes in January and February were acquired between mid-January and mid-February during the peak of the defoliation season. A total of 9, 63, 54, 46, 50, and 22 scenes were obtained in 2013, 2014, 2015, 2016, 2017, and 2018, respectively. In addition, over 90% of the target scenes had CC values less than or equal to 10%. However, the remaining 14 scenes, including eight and six with CC values in the ranges of 10%–20% and 20%–30%, respectively, were located mainly in the northern part of Vietnam, particularly those bordering Laos containing non-traditional cultivated rubber plantation regions. Thus, the spatio-temporal characteristics of OLI images indicated that the introduction of our proposed RNVI approach to the study area provided a reliable database for mapping rubber plantations. Finally, a consistent strategy for detecting the maximum distribution of the rubber pixels was used in overlapping parts of adjacent Landsat P/Rs (Guindon, 1997; Olthof et al., 2005), for example, P/R 130/45 and 129/45.
2.3 Yearly collection of ground truth data
A total of seven field trips in MSEA&YN were undertaken to collect geo-referenced landscape photos to determine land cover and land use types in 2013–2016 and 2018–2020 (Figure 2). Our sampling strategies focused on the defoliation and foliation of rubber plantations (see Figure 2) as well as swidden agriculture. With global position system (GPS) cameras (e.g. Nikon P900 and Casio EX-H20G) and hand-held GPS receivers (e.g. Trimble Juno 3B), over 85,000 geo-tagged landscape photos along the survey routes were gathered in MSEA&YN in February and March of 2013, northeastern Laos in November 2014, the border regions of Yunnan, Laos, and Myanmar in February 2015, entire Laos and north of Savannakhet Province in November 2016 and January 2019, the border regions of Guangxi, Yunnan, Vietnam, and Laos in January and February 2018, and the north of Ho Chi Minh City, Vietnam, in January 2020. These field photos documented detailed geographical information (e.g., coordinates and altitude) related to land cover and land use types, such as natural forests as well as annual (e.g., cassava) and perennial (e.g., banana) crops.
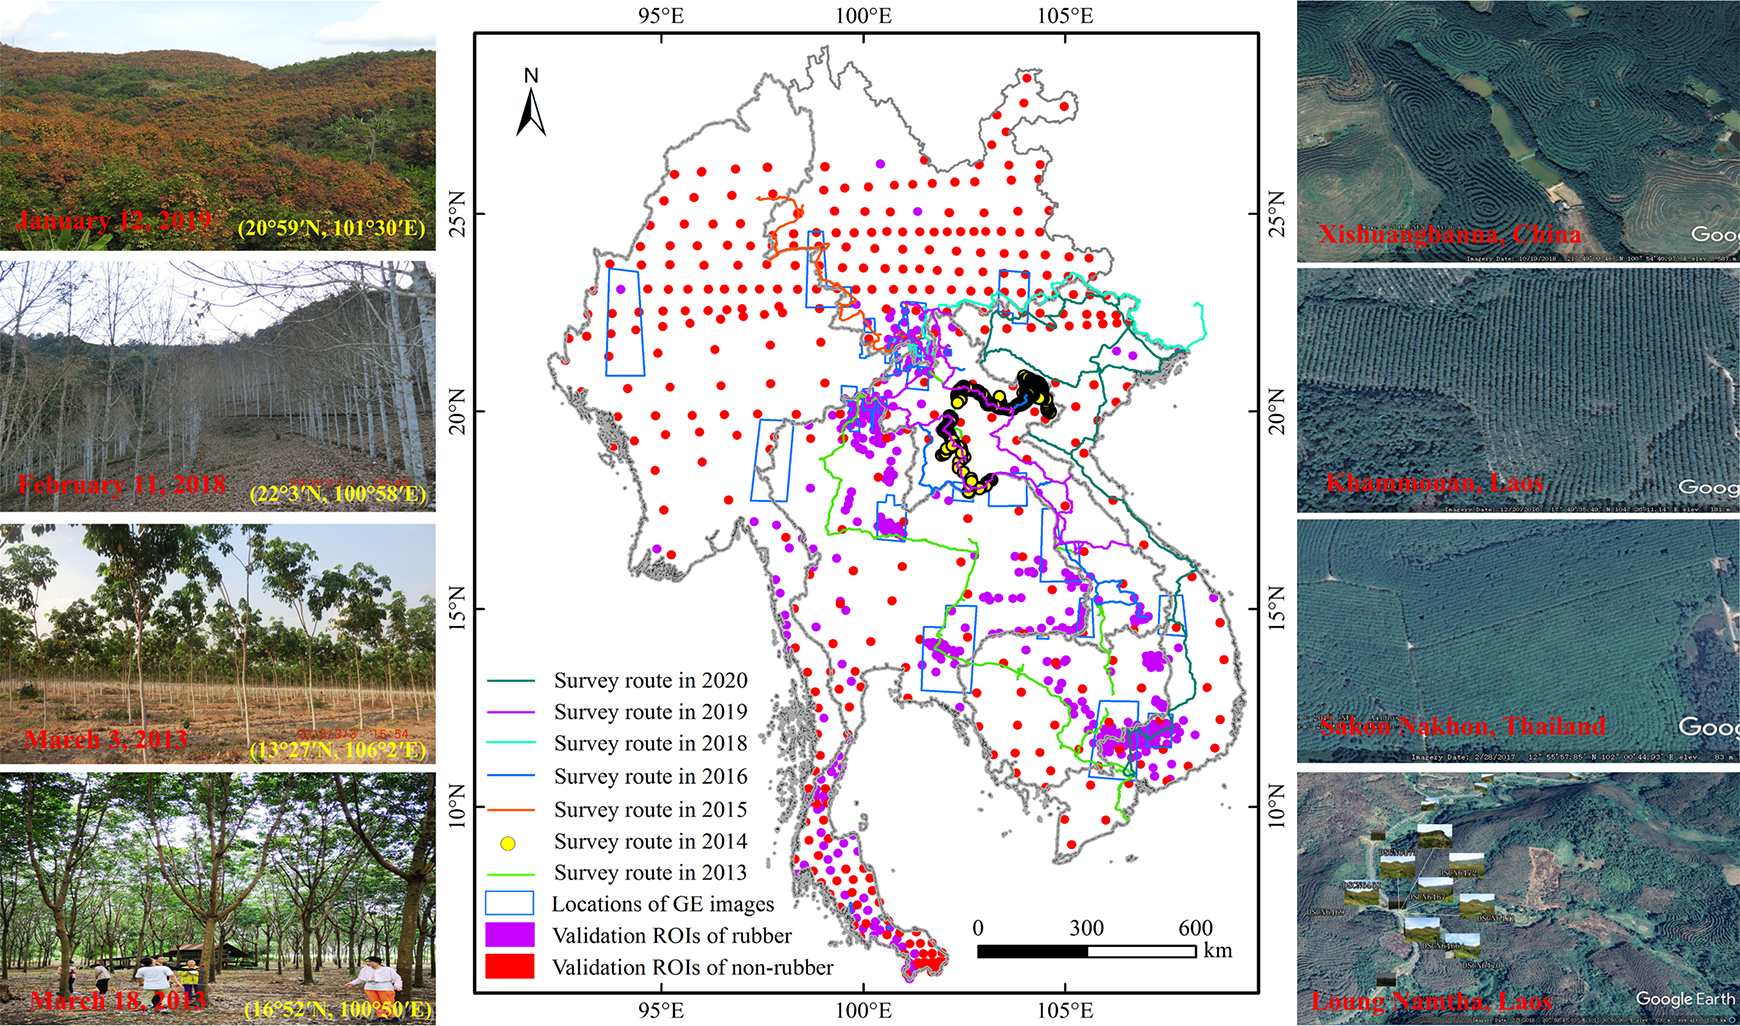
Spatial distributions of regions of interest (ROIs) of rubber plantations (purple polygons) and non-rubber areas (red polygons) used for validating analysis from high spatial resolution images provided by GE (blue polygons), Sentinel-2 A/B, and huge amounts of geo-tagged photos displaying the fieldworks during the dry periods in 2013-2016 and 2018-2020. Four geo-referenced photos (left column) and their related GE images (e.g., right column) of rubber plantations were selected to illustrate the different development phases and textural features (ring or parallel shape) of rubber plantations.
The geo-tagged photos were processed consistently into Google Earth’s (GE) keyhole markup language files using Picasa software (V 3.9) and then converted into points of interest in vector (shapefile) format. Manual cross-comparisons of the differences between the observations from the images (e.g., Landsat) and in-situ land cover and land use types were carried out via a GPS receiver (HOLUX M-215+) in ArcGIS. This provides prior knowledge about imaging features of land cover types in MSEA&YN, and helps gather massive amounts of landscape photos to select samples for algorithmic testing and validation of the results. Furthermore, rubber trees of the study area universally undergo defoliation to foliation, as we noted in the course of field surveys and household interviews, especially the mature ones.
2.4 Detecting mature rubber plantations in MSEA&YN
In our previous study, rubber plantations were detected using the phenology-based RNVI method along with Landsat OLI data for Xishuangbanna in China, to the north of MSEA (Xiao et al., 2019c). The RNVI, or the normalization of NDMI and NBR, fully combining the advantages of the vegetation-moisture indices to detect defoliation-foliation signals of deciduous rubber plantations. Setting-up the RNVI involved two key steps: (a) calculating the Landsat-based normalized VI (NVI) using NDMI and NBR during the defoliation and foliation phases, respectively, and (b) re-normalizing the NVIs (i.e., RNVI). The first involved computing the RNVIs with two images in the two periods: defoliation and foliation. The NVI values for the rubber plantations showed distinguishable characteristics (i.e., inverse changes) within the two temporal windows from defoliation to foliation. The target pixels with negative values (i.e., RNVI < 0) were then considered to be rubber plantations between the critical temporal windows. A forest mask was also used to eliminate the effects of non-forest (e.g., fallow fields) on the final results of rubber plantation detection (Figure 3). For more information about the RNVI method, the interested reader can refer to our previous study (Xiao et al., 2019c):
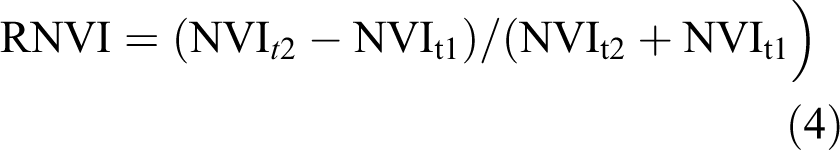
where t1 and t2 represent the dates of acquisition of Landsat OLI scenes, and

The flowchart for mapping rubber plantations with the RNVI method in the study.
Previous studies have shown distinctive defoliation and foliation phases for rubber plantations in southern China and MSEA (Chen et al., 2016; Li et al., 2015; Priyadarshan, 2017; Trisasongko, 2017). Our fieldwork in the dry season also validated this phenological phenomenon. In particular, mature rubber gardens usually had longer defoliating periods and exhibited more extensive defoliation phenomena (Kou et al., 2018). Thus, considering the similar deciduous features of defoliation and foliation of rubber plantations during the seasonal dry period, we used the RNVI approach to generate updated rubber plots for the study area through an intersection with the mask map of the forested areas. These data computations were batch-processed in the Python programming language. Finally, using the map of the mature rubber plantations, features of the 3Ds (i.e., latitudinal, vertical, and horizontal distributions) of Yunnan province in China and the five MSEA countries were analyzed using statistical and buffer analyses.
2.5 Validating mature rubber plantations
Assessing the accuracy of the map of mature rubber plantations using Landsat imagery over a large-scale region (e.g., MSEA&YN) in the tropics remains a challenging task because the rubber plots are generally household-based and randomly distributed (Nomura and Mitchard, 2018). More importantly, the region featured by mountains, local ethnic armies, and landmines in montane MSEA, which restricts access because of the poor road networks. Despite this, we validated the generated maps based on images from GE and Sentinel-2 A/B acquired at a finer spatial resolution as well as geo-referenced photos obtained through fieldwork (see Figure 2). The reference information was applied to the regions of interest (ROIs) as ground truth data.
Three mandatory rules for the selection of the sample plots for validation were observed in this study. First, the size of each ROI that comprises a homogeneous and prominent patch of rubber plantations and other land categories needed to be larger than nine ha (or 30 pixels) or 25 ha (or 150 pixels), respectively. Second, any two pieces of land adjacent to rubber plantations had to be separated by more than 0.8 km, and areas adjacent to non-rubber land types (e.g., natural forests) had to be separated by more than 1.2 km. Third, all the ROIs used for validation needed to be free of CC contamination. We therefore linked the OLI-derived map of rubber plantations with GE imagery (blue polygons in Figure 2), and selected 427 ROIs (27,617 pixels) for rubber plantations (purple polygons in Figure 2) and 371 ROIs (86,590 pixels) for non-rubber land types (red polygons in Figure 2) to assess the accuracy of the map through a confusion matrix (Table 1). GE imagery has distinct textural characteristics (parallel- or ring-shape, such as in the right panel of Figure 2) for the identification of rubber plantations in MSEA&YN. The Landsat-derived 30-m map of mature rubber plantations was validated through the confusion matrix based on the 798 ROIs (114,207 pixels). The results of classification were encouraging, with an overall classification accuracy of 94.14% and a kappa coefficient of 0.84. This reflects the applicability and stability of Landsat-derived RNVI for detecting rubber plantations at a large scale. Note that the estimates applied only to mature rubber plantations; young rubber plantations were not taken into consideration.
Accuracy assessment of the OLI-derived map of mature rubber plantations in the study.

Overall accuracy: 94.14%; kappa coefficient: 0.84.
Ⅲ Results
3.1 OLI-based 30-m composite map of mature rubber plantations
Figure 4 shows the 30-m map of mature rubber plantations in MSEA&YM generated from the Landsat OLI imagery. The total area occupied by mature rubber plantations was about 7.69 × 10⁶ ha in 2018, accounting for 3.32% of the study area. Note, however, that the total area would have been much larger if young rubber plantations had been considered. Mature rubber plantations within the study area were characterized by an overall scattered but locally concentrated spatial pattern, mainly in southern and northeastern Thailand, eastern Myanmar, the southern borders of Yunnan province, northwest and central highlands of Vietnam, and northern Laos (Figure 4).
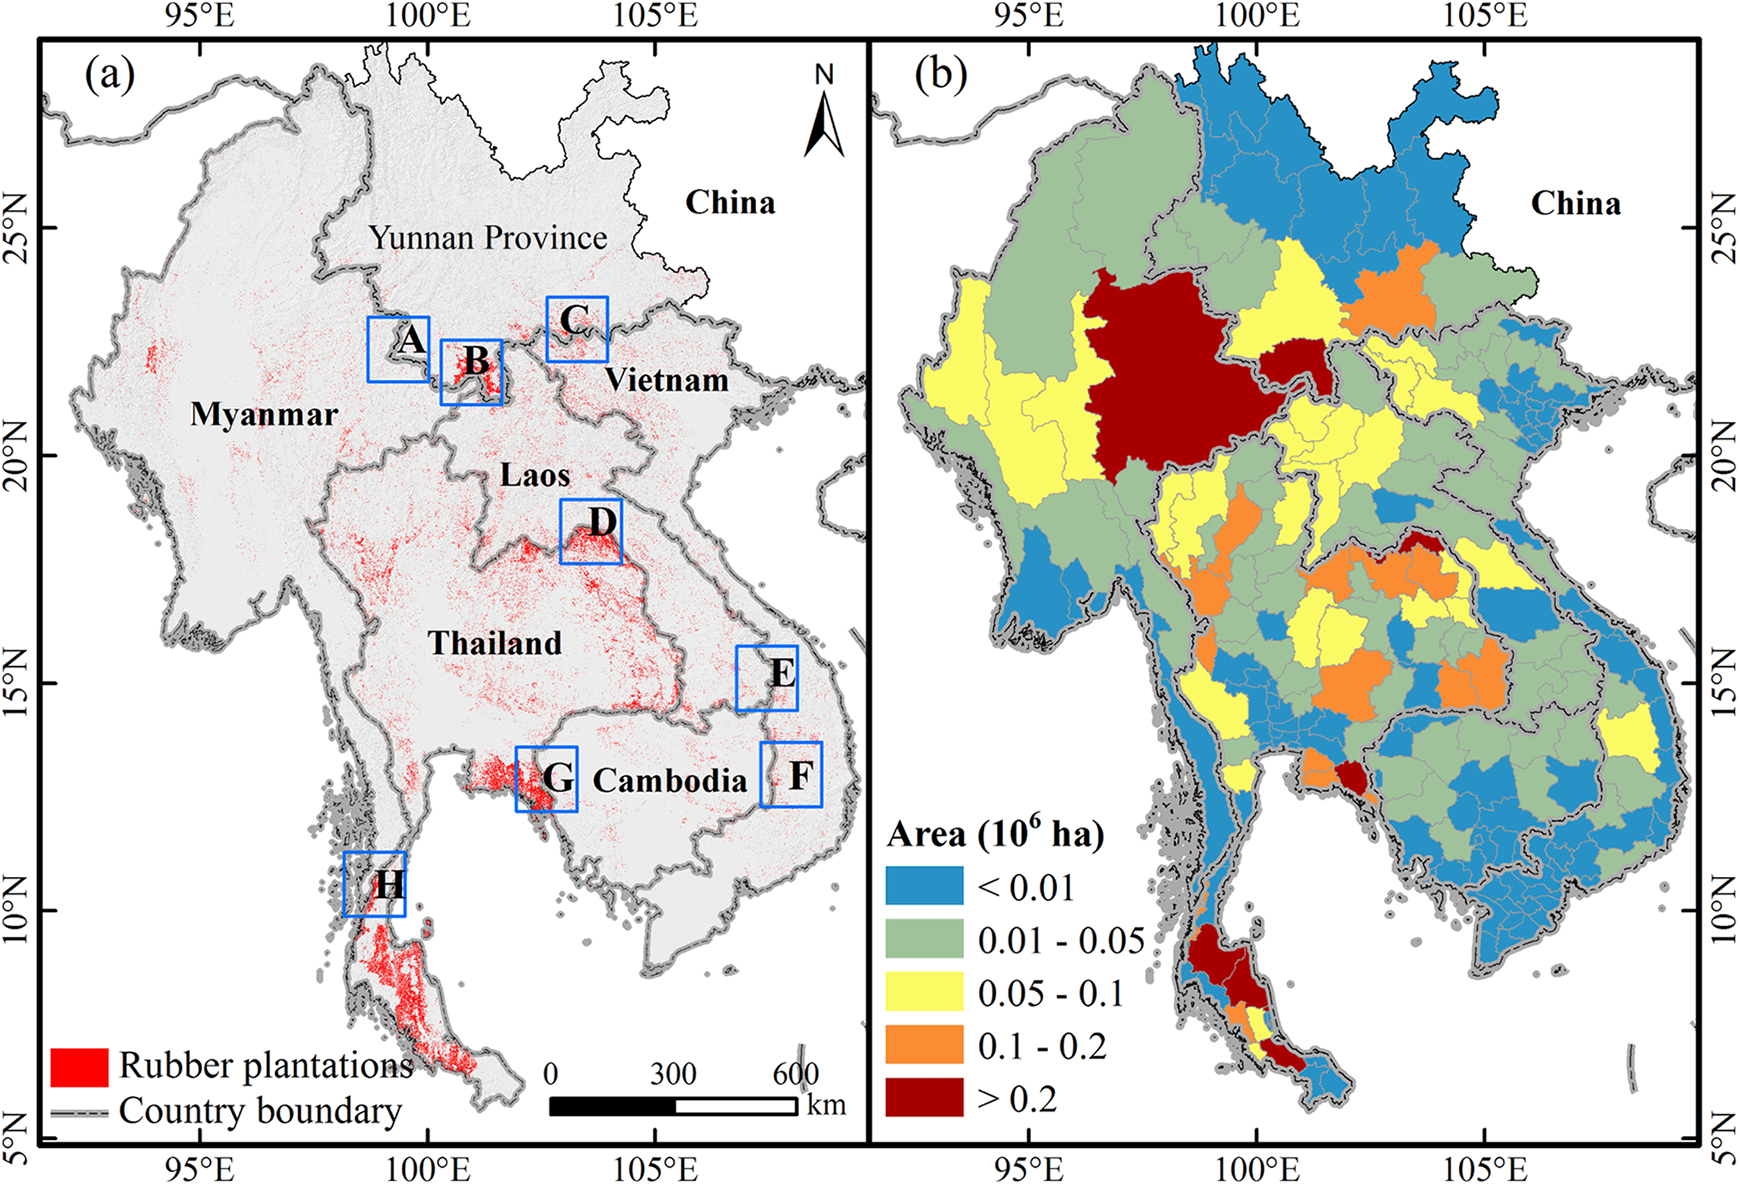
The latest map of mature rubber plantations in MSEA&YN at the (a) pixel and (b) provincial/municipal level. The subsets (blue boxes A, B, C, D, E, F, G and H) for rubber plantations (shown in Figure 6) show the (cross-) border characteristics.
3.2 National and regional differences in distribution, extent, and area of mature rubber plantations
At national and regional scales (Figure 4), Thailand (especially the southern and northeastern parts) had the largest ratio (60.47%) of total rubber plantations, with an area of 4.65 × 10⁶ ha, followed by Vietnam (especially the southwestern part) with 9.62% (0.74 × 10⁶ ha), Yunnan province (particularly Xishuangbanna) with 9.36% (0.72 × 10⁶ ha), Laos (especially the northern part) with 9.10% (0.70 × 10⁶ ha), Myanmar (particularly Shan and Chin) with 8.85% (0.68 × 10⁶ ha), and Cambodia (especially the south–central part) with 2.60% (0.20 × 10⁶ ha). Significant spatial differences in the planted areas were observed in MSEA&YN. Given that the five MSEA countries have 14 to 78 units (i.e., provinces, states, or municipalities), regardless of area of provincial-level units, the 10 most productive provincial units for rubber plantations in MSEA&YN were selected to clearly show sub-national patterns. The area ratios of the rubber plantations for these administrative units ranged from 55.88% to 83.18%. It can be inferred, with some caution, that there was a concentrated distribution of rubber plantations in Yunnan, and across Laos, as an emerging area for rubber plantations, compared with the relatively scattered pattern in traditional planting regions such as Thailand.
3.2.1 Mature rubber plantations in Yunnan province
Rubber plantations were mainly found in southern border, such as Xishuangbanna, Honghe, Pu’er, Wenshan, Lincang, and Dehong, with a total area of up to 96.16% in this province. In particular, Xishuangbanna (61.83%), Honghe (19.17%), and Pu’er (8.13%), which are located in the borderlands contiguous to Myanmar, Laos and Vietnam, respectively, had the three highest ratios of the total area of rubber plantations. By contrast, Lincang and Dehong had the most northerly distribution of mature rubber plantations in this province. Given that this is an emerging planting region, the northern planting boundary for rubber plantations surpassed the previous northernmost position at 22°N (Li and Fox, 2012) to about 25°N. These were located in Yingjiang County of Dehong Prefecture and Yun County of Lincang City, Yunnan province, respectively, based on our latest 30-m Landsat map. The northward movement of rubber plantations was in line with the description in People’s Daily (issue 3288) in 1982 (“the northward-shifting (18°–24°N) rubber trees successfully grown in China”) and the Local Chronicles in Yunnan province (“and firmly overturning this international predominant viewpoint that rubber cultivation wasn’t suitable in the north of 24°N,” and excerpts from “The Earliest Rubber Plantations in China” published by the Yunnan Archives in 2009).
3.2.2 Mature rubber plantations in MSEA
In the five countries, the top ten provinces with the largest areas of rubber plantations in Cambodia, in order, were Kracheh, Kampong Cham, Siemreab, Stong Treng, Pouthisat, Rotanokiri, Preah Vihear, Kampong Spoe, Batdambang, and Mondol Kiri, accounting for 84.77% in this country. Of these provinces, Kracheh in southeastern Cambodia, and Siemreab and Stong Treng in northern Cambodia had areas of 15.61%, 13.52%, and 10.21% of the total area of mature rubber plantations, respectively. In Laos, the top ten provinces with the largest areas of rubber plantations, in order, were Luang Namtha, Luang Prabang, Oudomxay, Xaignabouli, Bokeo, Vientiane, Khammouan, Phongsaly, Bolikhamxai, and Attapu, making up 80.14% of the total national share. Of these provinces, six—Luang Namtha, Luang Prabang, Oudomxay, Xaignabouli, Bokeo, and Phongsaly—are in northern Laos; Vientiane, Bolikhamxai, and Khammouan are in central Laos; and Attapu is in southern Laos. In Myanmar, the top ten provinces or states with the largest areas for rubber plantations, in order, were Shan, Chin, Mandalay, Magway, Sagaing, Kachin, Bago, Kayah, Kayin, and Rakhine. The total area of rubber plantations in these regions accounted for 97.91% of that in the country. Of the provinces, Shan in northeastern Myanmar had the largest proportion of rubber plantations, about 43.24% (0.29 × 10⁶ ha). Therefore, rubber plantations were primarily distributed in the vast upland regions of northern Myanmar, where opium poppy farming had prevailed in the past. In Thailand, the top ten provinces with the largest areas of rubber plantations, in order, were Surat Thani, Nakhon Si Thammarat, Nong Khai, Chanthaburi, Songkhla, Trang, Ubon Ratchathani, Rayong, Trat, and Udon Thani. The total area of rubber plantations in these areas accounted for more than 51.80% of those in the country. Of the provinces, the seven in southern Thailand accounted for 75.19%, with the other three provinces in eastern (i.e., Ubon Ratchathani) and northeastern Thailand (i.e., Udon Thani and Nong Khai) accounting for 24.81%. Of these, Surat Thani had the maximum area of rubber plantations, about 0.47 × 10⁶ ha (10.14%). In Vietnam, the top ten provinces with the largest areas of rubber plantations, in sequence, were Gia Lai, Binh Phuoc, Tay Ninh, Binh Duong, Dak Lak, Dong Nai, Kon Tun, Lam Dong, Dak Nong, and Quang Tri from southern and central Vietnam, with a total ratio for the country of 75.96%. Therefore, rubber plantations were primarily concentrated in South–Central Vietnam. Among them, Gia Lai in Southern Vietnam had the maximum area of rubber plantations of about 12.58%.
3.3 Vertical distribution of mature rubber plantations
Based on the map of rubber plantations and 30-m ASTER GDEM data, the relationship between the locations of the plantations and elevation gradients was analyzed (Figure 5). These results provide a scientific basis and guidance for decision-making regarding the planning of new rubber plantations, assessing the suitability of land, and the ecological and environmental impacts of the plantations.
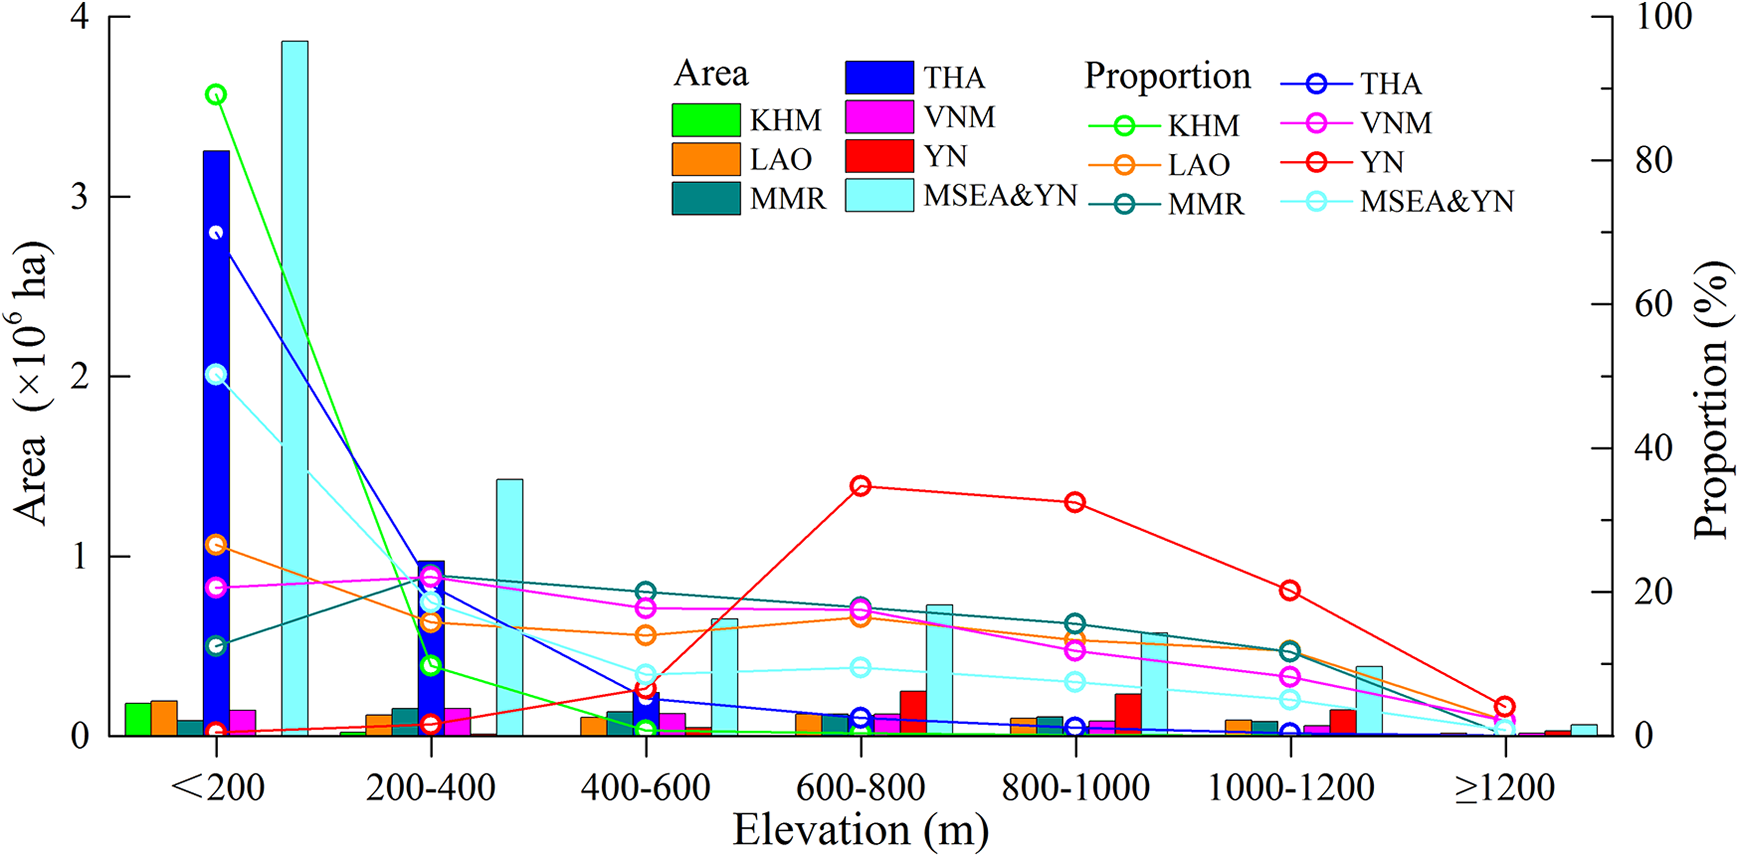
National and regional differences in area and proportion of rubber plantations at the pixel level in different elevation gradients in MSEA countries (KHM: Cambodia; LAO: Laos; MMR: Myanmar; THA: Thailand; VNM: Vietnam) and Yunnan Province (YN), China.
The results showed that the main range of elevation in the study area was 100–1200 m (Figure 5), and more than 90% of the plantations were concentrated below 1000 m, with only 0.80% above 1200 m (i.e., the upper elevation limit). Specifically, about 94.18% (5.99 × 10⁶ ha) of the rubber gardens were distributed at elevations below 1000 m, particularly below 400 m (68.77%, 3.70 × 10⁶ ha). However, the distribution of the plantations varied greatly at regional and national levels. Specifically, the plantations had a mean elevation of 344.50 m (±323 m SD) in MSEA&YN, 120.73 m (±74 m SD) in Cambodia, 547.43 m (±350 m SD) in Laos, 575.85 m (±310 m SD) in Myanmar, 183.33 m (±170 m SD) in Thailand, 520.71 m (±329 m SD) in Vietnam, and 850.69 m (±209 m SD) in Yunnan province, respectively, showing an ascending trend from low to high latitudes.
As shown in Figure 5, compared with five countries of MSEA, Yunnan province had rubber plantations at higher elevations (over 600 m). The plantations were mainly established in the range from 600 to 1200 m, accounting for 87.41% (0.63 × 10⁶ ha) of the total area. In the five countries, about 96.10% of rubber plantations were concentrated below 1000 m. Specifically, the largest ratio of rubber plantations, up to 89.18% (0.18 × 10⁶ ha), were at elevations below 200 m in Cambodia. In the case of Laos, they were primarily limited to elevations below 1000 m, accounting for 86.09% (0.60 × 10⁶ ha) of the totality. Similar patterns of plantation distribution in terms of elevation were noted in Myanmar, where 88.19% of them, over an area of 0.59 × 10⁶ ha, were concentrated at elevations below 1000 m, albeit with a wider range of elevation relative to that in Cambodia. In Thailand, the rubber plantations were mainly distributed in areas with elevations below 400 m, with a ratio close to 91% (4.23 × 10⁶ ha). This was similar to the optimal structure of rubber plantation elevation in the study area. In Vietnam, plantations ranging from 200 to 400 m had the largest ratio (22.04%), and nearly 90% (0.66 × 10⁶ ha) were at elevations below 1000 m. Despite the increasing global demand and the periodic “boom and bust” cycles in the rubber market (Grogan et al., 2019), there remained enough space for rubber planting in five countries of MSEA within the appropriate range of elevation (e.g., below 1000 m), especially in Cambodia, Laos, and Myanmar.
3.4 Border-prone distribution characteristics of mature rubber plantations
The distribution characteristics of mature rubber plantations in the (cross-) border regions, such as the China–Laos and Thailand–Laos borders, are presented in Figure 6. This area was approximately 3.53 × 10⁶ ha, and accounted for more than 54.01% of mature rubber plots in a 60-km buffer area (i.e., the (cross-)border regions) during the period 2013–2018. In the cross-border areas of MSEA&YN, however, the distribution of rubber plantations varied substantially due to differences in socioeconomic conditions ranging from local to national scale. This was distinct in the spatial differences in mature rubber plantations within the border regions of China and Laos, China and Vietnam, China and Myanmar, Vietnam and Laos, Myanmar and Laos, Thailand and Laos, Thailand and Myanmar, Thailand and Cambodia, Vietnam and Cambodia, and Cambodia and Laos, respectively (Figure 6).

National and regional differences in area and proportion of rubber plantations at the pixel level in different border regions in MSEA countries (KHM: Cambodia; LAO: Laos; MMR: Myanmar; THA: Thailand; VNM: Vietnam) and Yunnan Province (YN), China.
The maximum area of mature rubber plantations was detected along the Thailand–Laos border, up to 1.31 × 10⁶ ha, and accounted for 8.41% of the buffer area and one-fifth of all mature rubber plantations in this border area (Figure 6). However, the area with the maximum planting density was along the China–Laos border region, with a buffer area of more than 14.16%, and covering an area of 0.51 × 10⁶ ha. With respect to the remaining eight border areas, the buffer areas in decreasing order were along the Thailand–Cambodia, China–Vietnam, China–Myanmar, Vietnam–Laos, Thailand–Myanmar, Cambodia–Laos, Myanmar–Laos, and Vietnam–Cambodia borders, accounting for 9.06% (0.63 × 10⁶ ha), 5.70% (0.31 × 10⁶ ha), 3.55% (0.50 × 10⁶ ha), 3.08% (0.49 × 10⁶ ha), 3.05% (0.51 × 10⁶ ha), 2.54% (0.10 × 10⁶ ha), 2.52% (0.05 × 10⁶ ha) and 1.82% (0.17 × 10⁶ ha), respectively.
IV Discussion
So far, rubber gardens have dramatically expanded into northern tropical areas and even subtropical zones of MSEA&YN (Ziegler et al., 2009). Even though this is a globally important region, basic geographical information on rubber plantations is insufficient. In our previous study, a modified phenology-based algorithm (i.e., RNVI) was developed for Xishuangbanna in southern China (Xiao et al., 2019c), and showed good monitoring performance. In this updated study, the RNVI method was expanded by using the available Landsat-8 OLI data to extract and map mature rubber plantations. The latset map of rubber plantations for the study area at a resolution of 30 m was generated. This could make important contributions to our understanding of the spatial distribution of rubber plantations as well as the accompanying biophysical and socioeconomic effects.
4.1 Primary findings on regional rubber mapping
The results of this study showed three typical features of the distribution of rubber plantations: movement toward higher and lower elevations, a tendency for cultivation in border areas, and northward movement of plantations. The results of the 3Ds analyses clearly reflected the spatial characteristics of mature rubber plantations as a whole. Substantial economic benefits (Manivong and Cramb, 2008) and close international cooperation (e.g., the opium replacement policy) among China, MSEA nations, and other developed countries (Tian et al., 2011) have driven greater cultivation. Moreover, 30-m Landsat data could be used to effectively detect patches of mature rubber plantations and newly established plantations at higher elevations in northern mountainous regions (Nomura and Mitchard, 2018). Normally, such small plots (e.g., two or three ha) are undetectable by coarser sensors like MODIS owing to the mixed-pixel problem (Senf et al., 2013).
As geopolinomical cooperation mechanisms have continually enhanced regional economic development since the 1990s, MSEA has undergone extensive and rapid changes in land cover and land use, including the expansion of rubber plantations in the borderlands (Tang et al., 2019; Xiao et al., 2019c; Zeng et al., 2018a). Not coincidentally, the resultant cross-border distributions of rubber plantations found in this study were similar to those reported by Li and Fox (2012) in a MODIS study of the region. Since the 2000s, more entrepreneurs from China, Thailand, and Vietnam have invested in rubber plantations in Laos and Cambodia. Therefore, the border regions in the study area, especially in Laos (e.g., Thailand–Laos and China–Laos borders) have become preferred planting areas, and have spearheaded the development initiatives for cross-border rubber plantations (Liu et al., 2013).
4.2 Temporal span of phenological stages of rubber plantations
The defoliation–foliation signals of rubber trees are crucial parameters for mapping rubber plantations using phenology-based algorithms. Although the phenological features of rubber plantations, that is, defoliation and foliation, during the dry season are well known to the scientific community (Dong et al., 2013; Fan et al., 2015; Mann, 2009), both the duration and extent of defoliation and detailed dates for defoliating and foliating are not sufficiently specific for imagery interpretation. In particular, the development of robust and universal algorithms remains an inadequately researched topic. Phenological methods have been subjected to challenges because of inconsistencies in the phenological stages of rubber plantations in different regions of the tropics (Fan et al., 2015), such as MSEA&YN that spans 20 latitudes.
In general, differences in local climate, elevation, age, variety, and rubber plantation management can lead to certain variations in the phenological stages of the plantations (Kou et al., 2015; Priyadarshan, 2017). Thus, temporal inconsistencies in the defoliation and foliation periods of the plantations in various regions should be considered when using phenology-based algorithms. In this study, only one scene in the defoliation stage and another in the well-foliated stage were selected after comparing phenological events. This approach may represent a practical option to significantly reduce uncertainties due to the unavailability of data. A systematic study on in-situ differences in the phenology of rubber trees with meteorological data (e.g., air temperature) could contribute to accurately mapping rubber plantations in the future (Zhai et al., 2019).
4.3 Thirty percent or less CC for Landsat OLI for mapping rubber plantations
The availability of high-quality remotely sensed optical data, such as Landsat images, is essential for land use mapping (Qin et al., 2015). However, issues related to CC and the contamination of the images by cloud shadows persist for optical satellite data (e.g., Landsat), especially in the (sub-)tropics (Li et al., 2016). The half-year dry season with minimal precipitation in MSEA and southern China facilitates the acquisition of cloud-free imagery in our study (Li et al., 2018). The results thus relied heavily on Landsat OLI data.
We used the available Landsat images (2013-2018) with 30% CC or less to map rubber plantations. Over 90% of the selected scenes (230) were less than or equal to 10% of CC. The remaining 10%, mainly located in mountainous regions of northern Vietnam, where these areas were not suited to the cultivation of rubber plantations. However, 57.01% of the images used were partially contaminated by a small amount of CC (including cloud shadows, i.e., less than 1%). The total area of CC was less than 4.01% in the 122 scenes in MSEA&YN. Although PQA data were applied for data preprocessing, undetected pixels contaminated by CC and cloud shadows might have contributed to the omission of certain rubber plantations.
4.4 Use of 6 years’ Landsat images to generate the latest map of mature rubber plantations
Given the dependence on phenology-based algorithms, data availability and consistency are major concerns in mapping rubber plantations (Fan et al., 2015; Xiao et al., 2020a). Because of the unfixed phenological stage of the plantations, contamination by clouds and other limitations of data, it may not be possible to accurately map mature rubber plantations at a large-scale using satellite images over one or two years.
To overcome that, the mapping of mature rubber plantations was undertaken using multiyear Landsat OLI imagery over a six-year period (2013–2018, over 87.30% of them in 2014–2017) in this study, without considering interannual variations in the plantations. It helps to reduce uncertainties due to data availability. Moreover, the requisite period of five to seven years for rubber tapping to obtain latex contributes to the derivation of our map, with the images acquired over six years (Yi et al., 2014b). However, this composite treatment may lead to a failure to accurately monitor the plantations over a large area. In future work, we will introduce Sentinel-2A/B (2016–) (Drusch et al., 2012; Xiao et al., 2020b) to consider annual changes in rubber plantations in MSEA to tackle any new cycles of rubber boom and bust, which began in 2012 (Grogan et al., 2019).
4.5 Implications and future work
As an extended study in the tropics, this work has demonstrated the applicability of the Landsat- and phenology-based RNVI approach for detecting rubber plantations in MSEA&YN. This development is not only a comprehensive and timely response to the appeal by international initiatives for improvements in the mapping of rubber plantations, such as “Reducing Emissions from Deforestation and Forest Degradation in Developing Countries” (Miles and Kapos, 2008), but also provides a necessary database for impact studies of rubber plantations. We think that the large-scale analysis of mature rubber plantations will enhance related research, including eco-environmental effects, plantation management, and human wellbeing.
With the continually increasing demand for rubber, a trans-boundary increase in rubber gardens in cross-border areas between MSEA and China is seen as inevitable in the foreseeable future. Thus, in a geopolinomic context, there has been a need to monitor and compare patterns of changes in rubber plantations in MSEA since the 1990s, including young plantations. However, it is challenging to use Landsat images (30 m) to delineate young plantations owing to their similar spectral features (Kou et al., 2015; Xiao et al., 2019c) and the complex system of interplanting. Furthermore, the dynamics of rubber plantations in each country may also be examined by considering government policies and other factors.
Ⅴ Conclusion
We generated an up-to-date map, at a resolution of 30 m, of mature rubber plantations in MSEA&YN. The RNVI method proved to be viable for the detection and mapping of rubber plantations in the study area, with an overall classification accuracy of up to 94.14% and a kappa coefficient of 0.84. The resultant map of mature rubber plantations provides updated details on their distribution, extent, and elevation. The estimated total area of mature rubber plantations was about 7.69 × 10⁶ ha, or 3.23% of the study area, and showed three typical characteristics: a trend of cultivation in high-altitude (over 1000 m) and low-altitude (below 200 m) areas, more cultivation in borderlands (over 50.48% within 60-km buffers), and northward movement (as far as 25°N). Our finer resolution (30 m) rubber dataset provides potential guidance for supporting decision-making regarding the planning of new rubber plantations, assessing their ecological and environmental impacts, and agroforestry management. Therefore, the Landsat-derived VIs normalization (including the RNVI) method might also be applied to detect other industrial tree plantations (e.g., teak). However, the application of this phenology-based method may be limited in regions where the phenological differences are changeable, especially in traditional tropical rubber-growing regions such as Malaysia and Indonesia, where different metrics will be needed.
Footnotes
Acknowledgements
The authors thank the U.S. Geological Survey Landsat Science Team (https://landsat.usgs.gov/landsat-science-teams) for their support in technical input and National Earth System Science Data Sharing Infrastructure, National Science and Technology Infrastructure of China (![]() ) for sharing forest data. Special thanks go to Professor Hongliang Fang from the Institute of Geographic Sciences and Natural Resources Research, Chinese Academy of Science for his guidance on manuscript revision.
) for sharing forest data. Special thanks go to Professor Hongliang Fang from the Institute of Geographic Sciences and Natural Resources Research, Chinese Academy of Science for his guidance on manuscript revision.
Declaration of conflicting interests
The authors declared no potential conflicts of interest with respect to the research, authorship, and/or publication of this article.
Funding
The authors disclosed receipt of the following financial support for the research, authorship, and/or publication of this article: This article was supported in part by the National Natural Science Foundation of China (Grant nos. 42001226 and 41971242), the China Postdoctoral Science Foundation (Grant no. 2019M660777), the Strategic Priority Research Program of Chinese Academy of Sciences (Grant no. XDA20010203), the BINGWEI Excellent Young Talents of Institute of Geographic Sciences and Natural Resources Research, Chinese Academy of Sciences (Grant no. 2018RC201), and the Youth Innovation Promotion Association of the Chinese Academy of Sciences (Grant no. 2020055).