
Abstract
Soil wind erosion is a global problem that leads to increasingly serious regional land degradation, where the need for windbreak and sand fixation services (WSFS) is substantial. Inner Mongolia plays an important role in global semiarid and arid areas and the severe land degradation resulting from soil wind erosion warrants an urgent solution. However, the mechanism of influence of various driving factors on windbreak and sand fixation services is still not fully studied. In this paper, the revised wind erosion equation (RWEQ) model was used to synthesize the monthly spatiotemporal dynamics of soil wind erosion modulus (SWEM) and WSFS in Inner Mongolia from January 2000 to February 2020 from a semi-monthly scale. The influencing factors of WSFS were examined from both natural and anthropogenic aspects. Results show that over the past 20 years, the average SWEM in Inner Mongolia was 118.06 t ha−1 yr−1, the areas with severe wind erosion were mainly concentrated in the desert areas in the southwest of Inner Mongolia, and the forests in the northeast suffered less soil wind erosion. Meanwhile, the average WSFS was 181.11 × 10⁸ t yr−1, with the high-value areas mainly located in major deserts, sandy land, and the area bordering Mongolia in the north and the low-value areas mainly located in the densely forested northeast and the Gobi Desert in the northwest. Both SWEM and WSFS showed a clear downward trend and a certain periodicity over the past 20 years. WSFS showed two peaks a year (April and October). Among the natural factors, precipitation and NDVI showed a significant correlation with WSFS and were identified as the main driving factors of WSFS, whereas temperature had no significant correlation. Among the anthropogenic factors, farming and animal husbandry intensity and GDP showed a positive correlation with WSFS, whereas population showed a negative correlation. These four types of factors were identified as socio-economic factors that drive WSFS. Meanwhile, WSFS did not show any significant correlation with the administrative area. Land use change contributed to a large proportion of WSFS change, thereby suggesting that the intensity of human activities is another central driver of WSFS.
Keywords
I Introduction
Soil is a valuable resource upon which human well-being depends to a large extent (Amundson et al., 2015; Banwart, 2011). However, soil problems, particularly land degradation, seriously affect agricultural production, natural habitats, and environmental changes by not only influencing soil quality but also by reducing crop yields, hence leading to food security problems, direct economic losses, inter-regional conflicts, and civilization decline (Amundson et al., 2015; Borrelli te al., 2020). Soil erosion is an important process of physical geography in which soil and its parent material are destroyed, denuded, transported, and deposited under the action of external forces (Peng et al., 2020); accordingly, soil erosion has been identified as one of the most important factors of soil degradation. In semiarid and arid regions, wind plays the most important role in soil erosion by causing topsoil loss and triggering land degradation. During this process, soil nutrients are lost, the agricultural productivity of dryland systems is reduced, and even the health of residents is affected. By contrast, windbreak and sand fixation services (WSFS) refers to the ability of vegetation in ecosystems to prevent and fix sandstorms by limiting wind and sand transport caused by wind erosion (Roels et al., 2001). Therefore, WSFS is a critical regulating ecosystem service.
Quantitative studies of soil wind erosion were initially based on modern fluid dynamics and carried out through a large number of field observations and wind tunnel simulations (Cai et al., 2021). With the increasing maturity of geographic information technology and the emergence of remote sensing data processing platforms such as Google Earth Engine, large-scale Earth observations have become possible, thereby promoting the evolution of methods for simulating soil separation, migration, or loss due to wind and for the dynamic monitoring of soil wind erosion and WSFS (Charbonneau and Dohner, 2021; Wang et al., 2020; Zhang et al., 2021). Models have proven effective in predicting soil wind erosion and loss and in facilitating the development of land management measures for controlling or mitigating erosion (Jarrah et al., 2020; Pi et al., 2017; Wagner, 2013). The earliest wind erosion model was the Wind erosion equation (WEQ) model introduced in the 1960’s, which estimated the annual wind erosion amount based on climate, soil, and vegetation cover (Woodruff and Siddoway, 1965) Since then, a series of wind erosion models were developed, such as the Bocharov wind erosion model (BWEM), Texas erosion analysis model (TEAM), wind erosion analysis model (WEAM), revised wind erosion equation (RWEQ), and the APEX model of the Texas A&M University (Fryrear et al., 1998; Gregory, 1988; Shao et al., 1996; Wang et al., 2012). Various models have also been used in simulating soil wind erosion, with the RWEQ model being one of the most commonly used models (Chi et al., 2019; Li et al., 2020). Many scholars have confirmed the accuracy and applicability of the RWEQ model in simulating soil wind erosion on different terrains, such as plains, valleys, farmland, and grasslands (Fryrear et al., 2000). Zobeck et al. (2000) combined the Geographic Information System (GIS) with the modified wind erosion equation (RWEQ) and proved the rationality of the latter. Many studies have also investigated WSFS. Some scholars took the WSFS in the base period as their benchmark and regarded climate change as an influencing factor to understand the impact of this service on the local area under different future climate scenarios (Correa et al., 2016; Garbrecht et al., 2015; Kidron et al., 2017; Serpa et al., 2015). While the wind speed generator in the RWEQ model has regional applicability (Guo et al., 2010), the revised wind erosion equation can objectively predict soil wind erosion as proven by Gong Guoli and Chi Wenfeng (Chi, 2015; Gong, 2014; Liu et al., 2021). Other studies have explored the temporospatial characteristics of soil wind erosion. For instance, Zhang Hanbing simulated the temporospatial pattern of wind erosion in Horqin Sandy Land and evaluated the effect of returning farmland to grass on wind erosion via scenario simulation (Zhang et al., 2019); Jie Xu combined the concept of ecosystem service flow with spatial heterogeneity and calculated the ecosystem service payment of WSFS in Yanchi County (Xu et al., 2019). Xin L. et al. took Xilingol League, Inner Mongolia as their study area, used the RWEQ model to simulate soil wind erosion, and spatially visualized the WSFS flow (Lyu et al., 2021).
Several studies have been made by Chinese scholars. For example, in northern China, the coupling effects of temperature, precipitation, and wind speed were the main climatic drivers of sand fixation function, and grassland degradation was the main driver of land use (Li and Xu, 2019). WSFS would decline with the increasing grazing levels in typical grassland in Inner Mongolia (Li et al., 2021). Cui et al. (2021) further found that land use shifts (farmland expansion, the Grain for the Green Project, urbanization, and so on) reduced more windbreak and sand fixation services than climate change in China’s forest-steppe ecotone. In previous studies, the search for the driving factors of WSFS tended to be insufficiently comprehensive. On the one hand, very few studies have been able to point out a clear driving relationship (positive or negative) among natural factors on WSFS. On the other hand, social factors such as policies and economic levels considerably influence the natural environment, but few studies have addressed the mechanisms of socio-economic factors on the windbreak and sand fixation services. Therefore, this study will improve the shortcomings of previous studies and explore the drivers of WSFS in terms of natural, socio-economic, and land-use changes, which aims to explore the profound driving mechanism of WSFS more thoroughly.
Drylands, which mainly include deserts and grasslands in arid areas, cover approximately 41% of the global surface area and play a crucial role in global sustainable development (Reynolds et al., 2007; Zou et al., 2021). Located on the northern frontier of China, the Inner Mongolia Autonomous Region is sensitive to climate change and is one of the typical arid and semiarid regions in the world. The increase in temperature and decrease in precipitation in the region over the past few decades have led to degradation of vegetation, which in turn has exacerbated local ecological problems, especially the land degradation caused by soil wind erosion (Lu et al., 2019; Kang et al., 2021), which has resulted in massive economic losses. Since the 1950’s, the Chinese government has carried out vigorous desertification control work for various land restoration projects (Cheng et al., 2018). Although their sand control projects achieved certain ecological results, sandstorms remained frequent, and the resulting ecological problems continued to have a profound effect on people’s production and life. Therefore, there is an urgent need for windbreak and sand fixation services in this area.
This study utilizes geographic information and remote sensing platforms and tools, such as Google Earth Engine, to (1) measure the spatiotemporal dynamic characteristics of soil wind erosion modulus (SWEM) and WSFS in the study area; (2) to analyze the main driving forces of WSFS from both natural and man-made aspects; and (3) to provide scientific theoretical guidance for the formulation of sand control policies and plans and the implementation of sand fixation projects.
II Material and methods
2.1 Study area
The Inner Mongolia Autonomous Region (37°24’–53°23’N, 97°12’–126°04’E) is located in the arid and semiarid regions of northern China (Figure 1) and is considered the largest and most complete ecological functional area in the north, where forests, grasslands, wetlands, deserts, and other ecosystems serve as important ecological security barriers (Batunacun et al., 2019; Yao et al., 2015). Inner Mongolia extends diagonally from northeast to southwest, covers a total area of 118.3 km2, and borders Russia and Mongolia in the north. The region has a predominantly temperate continental climate often accompanied by windy weather in spring. The landscape is dominated by plateaus, most of which are above 1000 m in elevation, and the annual precipitation ranges between 100 mm and 500 mm. Inner Mongolia is surrounded by vast prairies to the north (mainly the Hulunbeier and Xilinguole grasslands), Daxinganling (the largest virgin forest in China) to the east, and sandy land and deserts to the west. Three major plains can be found in the area, namely, the Northeast Plain, the West Liaohe Plain, and the Hetao Plain. Inner Mongolia is one of the provinces with the most concentrated and serious desertification in China. The region has a total of four deserts (i.e., Badain Jaran, Tengger, Ulanbuhe, and Kubuqi) and four sandy lands (i.e., Maowusu, Hunshandake, Horqin, and Hulunbeier). These two land types account for 914 million mu and 612 million mu of the entire province, respectively, and 23.3% and 23.7% of the national total. Study area. (a) Location in China; (b) spatial distribution of each league or city; (c) land use type; and (d) elevation of Inner Mongolia.
2.2 Material and process
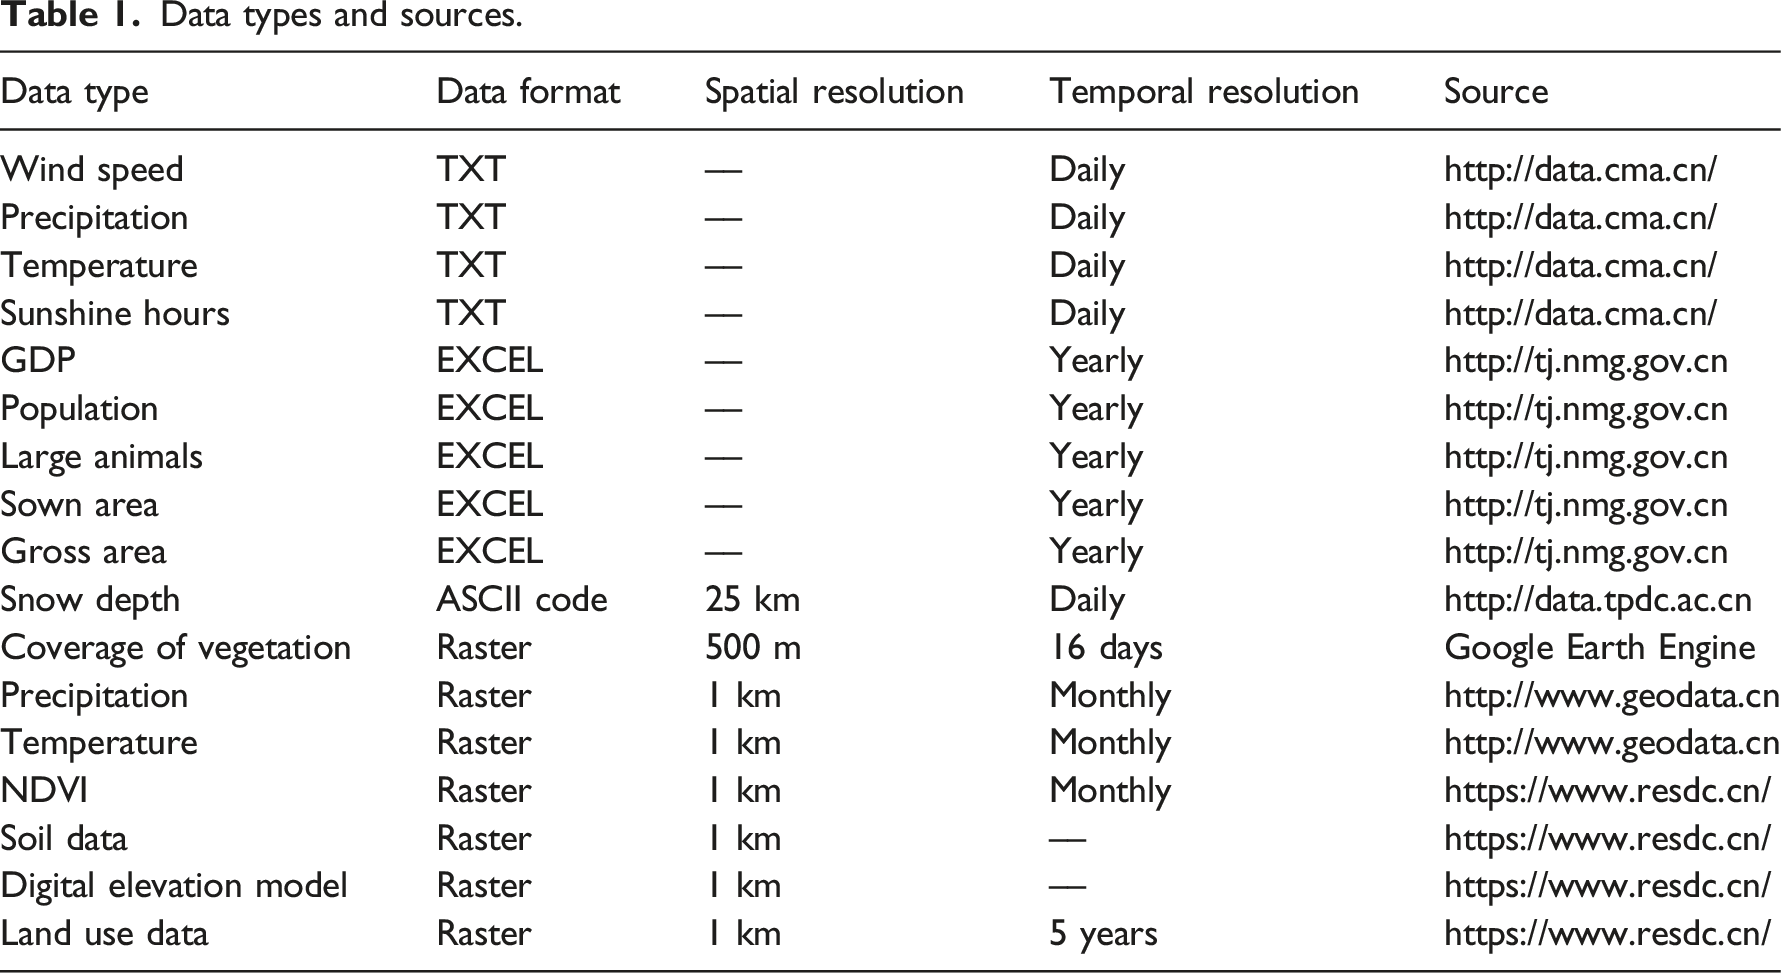
The revised soil wind erosion equations cover a wide range of contents and sources, including meteorological, remote sensing, land use, and statistical data. First, meteorological data are needed to calculate the wind and climate factors. The meteorological data used in this study, including daily average and maximum wind speed, daily average temperature, daily precipitation, and sunshine hours, were collected from the China Meteorological Science Data Service Center (http://data.cma.cn/). Second, remote sensing data are necessary for calculating the vegetation cover and snow depth factors. Vegetation coverage data were derived from the NDVI layer in the MOD13A1 V6 on Google Earth Engine by using the pixel dichotomy method with a temporal resolution of 16 days and a spatial resolution of 500 m. Meanwhile, daily snow depth data were obtained from the National Tibetan Plateau/Third Pole Environment Data Center (http://data.tpdc.ac.cn), stored as ASCII files, and transformed into raster data by using ArcGIS 10.8 with a spatial resolution of 25 km. The vegetation cover factor was also calculated from land use data, which were obtained from the Resource and Environmental Science and Data Center (https://www.resdc.cn/) by selecting 7 periods of images from 2000 to 2020 with a spatial resolution of 1 km.
Data types and sources.
2.3 Study method
2.3.1 Simulation of SWEM and WSFS
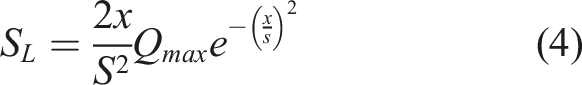
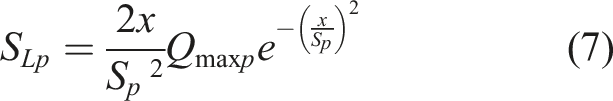
The revised wind erosion equation was used to simulate SWEM and WSFS. The RWEQ model is widely used for characterizing the degree of soil wind erosion variation at the field-scale. Meanwhile, given that WSFS is affected by both potential and actual wind erosion, this service was calculated using the following equations (see Supplementary A. for more details):


2.3.2 Change trend analysis
The least squares method was used to calculate the linear slope of each variable to indicate their change trends over the past 20 years. The following equation was used: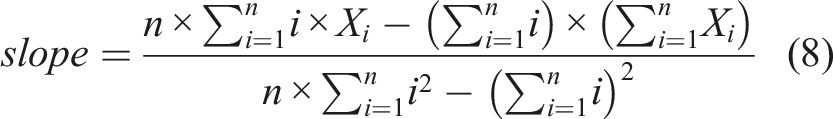
2.3.3 Driving force analysis
In this study, two approaches were used to explore the driving mechanisms of WSFS, linear regression was used to examine the natural driving elements and geographically weighted regression was used to explore the humanistic driving factors. It is still unclear the heterogeneous regularity of the WSFS driving mechanism by the socio-human characteristics in different administrative units due to policies, whereas geographically weighted regression provides a good way to reflect such spatial heterogeneity, so this method was used to explore the humanistic driving elements; As for the natural factors, considering the natural pattern as a whole was conducive to revealing the universal driving mechanism behind it. As for the natural factors, considering the natural pattern as a whole was conducive to revealing the universal driving mechanism behind it. Consequently, two approaches were applied in this paper to explore the driving factors.
Linear regression Pearson correlation coefficients were used to identify the correlation coefficients between WSFS and natural drivers (i.e., temperature, precipitation, and NDVI). The following equation was used:
Geographically weighted regressions (GWR) were used to identify the correlations between WSFS and socio-economic drivers (i.e., administrative district land area, number of year-end resident population, GDP, year-end number of large livestock, and crop sown area). The following equation was used:
III Results
3.1 Temporospatial dynamics of SWEM and WSFS
3.1.1 Annual dynamic of SWEM
From 2000 to 2019, the SWEM in Inner Mongolia ranged from 86.86 t ha−1 yr−1 to 155.72 t ha−1 yr−1 (Figure 2(d)), with an average SWEM of 118.06 t ha−1 yr−1. The largest SWEM was recorded in 2001, whereas the smallest was recorded in 2012. According to the “Standards for classification and gradation of soil erosion” promulgated by the Ministry of Water Resources of the People’s Republic of China, soil erosion types can be divided into six categories. Among these categories, tolerable (<2 t ha−1 yr−1) and slight (2–25 t ha−1 yr−1) occupied the largest area (39.62% and 20.15% of the study area, respectively) and had the lowest degree of erosion. From a spatial perspective (Figure 2(a) and (b)), these two categories were mainly concentrated in the northeastern and southern regions of Inner Mongolia, where the land use types mainly included forest land and grassland. The most severe level of wind erosion is destructive (>150 t ha−1 yr−1), which occupied 19.88% of Inner Mongolia and was mainly distributed in its southwestern and central parts where concentrations of deserts and sandy land are high. The other grades of wind erosion accounted for a comparatively small proportion of the study area. Specifically, moderate (25 t ha−1 yr−1–50 t ha−1 yr−1), severe (50 t ha−1 yr−1–80 t ha−1 yr−1), and very severe (80 t ha−1 yr−1–150 t ha−1 yr−1) only accounted for 6.06%, 5.96%, and 8.33% of the total area, respectively. As shown in the trend analysis results (Figure 2(c) and (d)), SWEM demonstrated a gradual downward trend from 2000 to 2019. Spatially, those areas with reduced levels of wind erosion (slope < 0) accounted for 63.61% of the total area and were spread in the eastern, southern, and southwestern parts of Inner Mongolia. Around 36.39% of the area reported an increased wind erosion (slope>0), especially in the northern and northwestern parts of Inner Mongolia and the western part of northeastern Inner Mongolia, but about 29% of these areas reported an insignificant increase in SWEM (0<slope<2). Spatial distribution and variation trends of SWEM. Spatial distribution of (a) average SWEM; (b) the intensity of average SWEM; (c) the change slope of SWEM; and (d) the time change trend of annual SWEM. The light blue background represents the 99.9% confidence interval.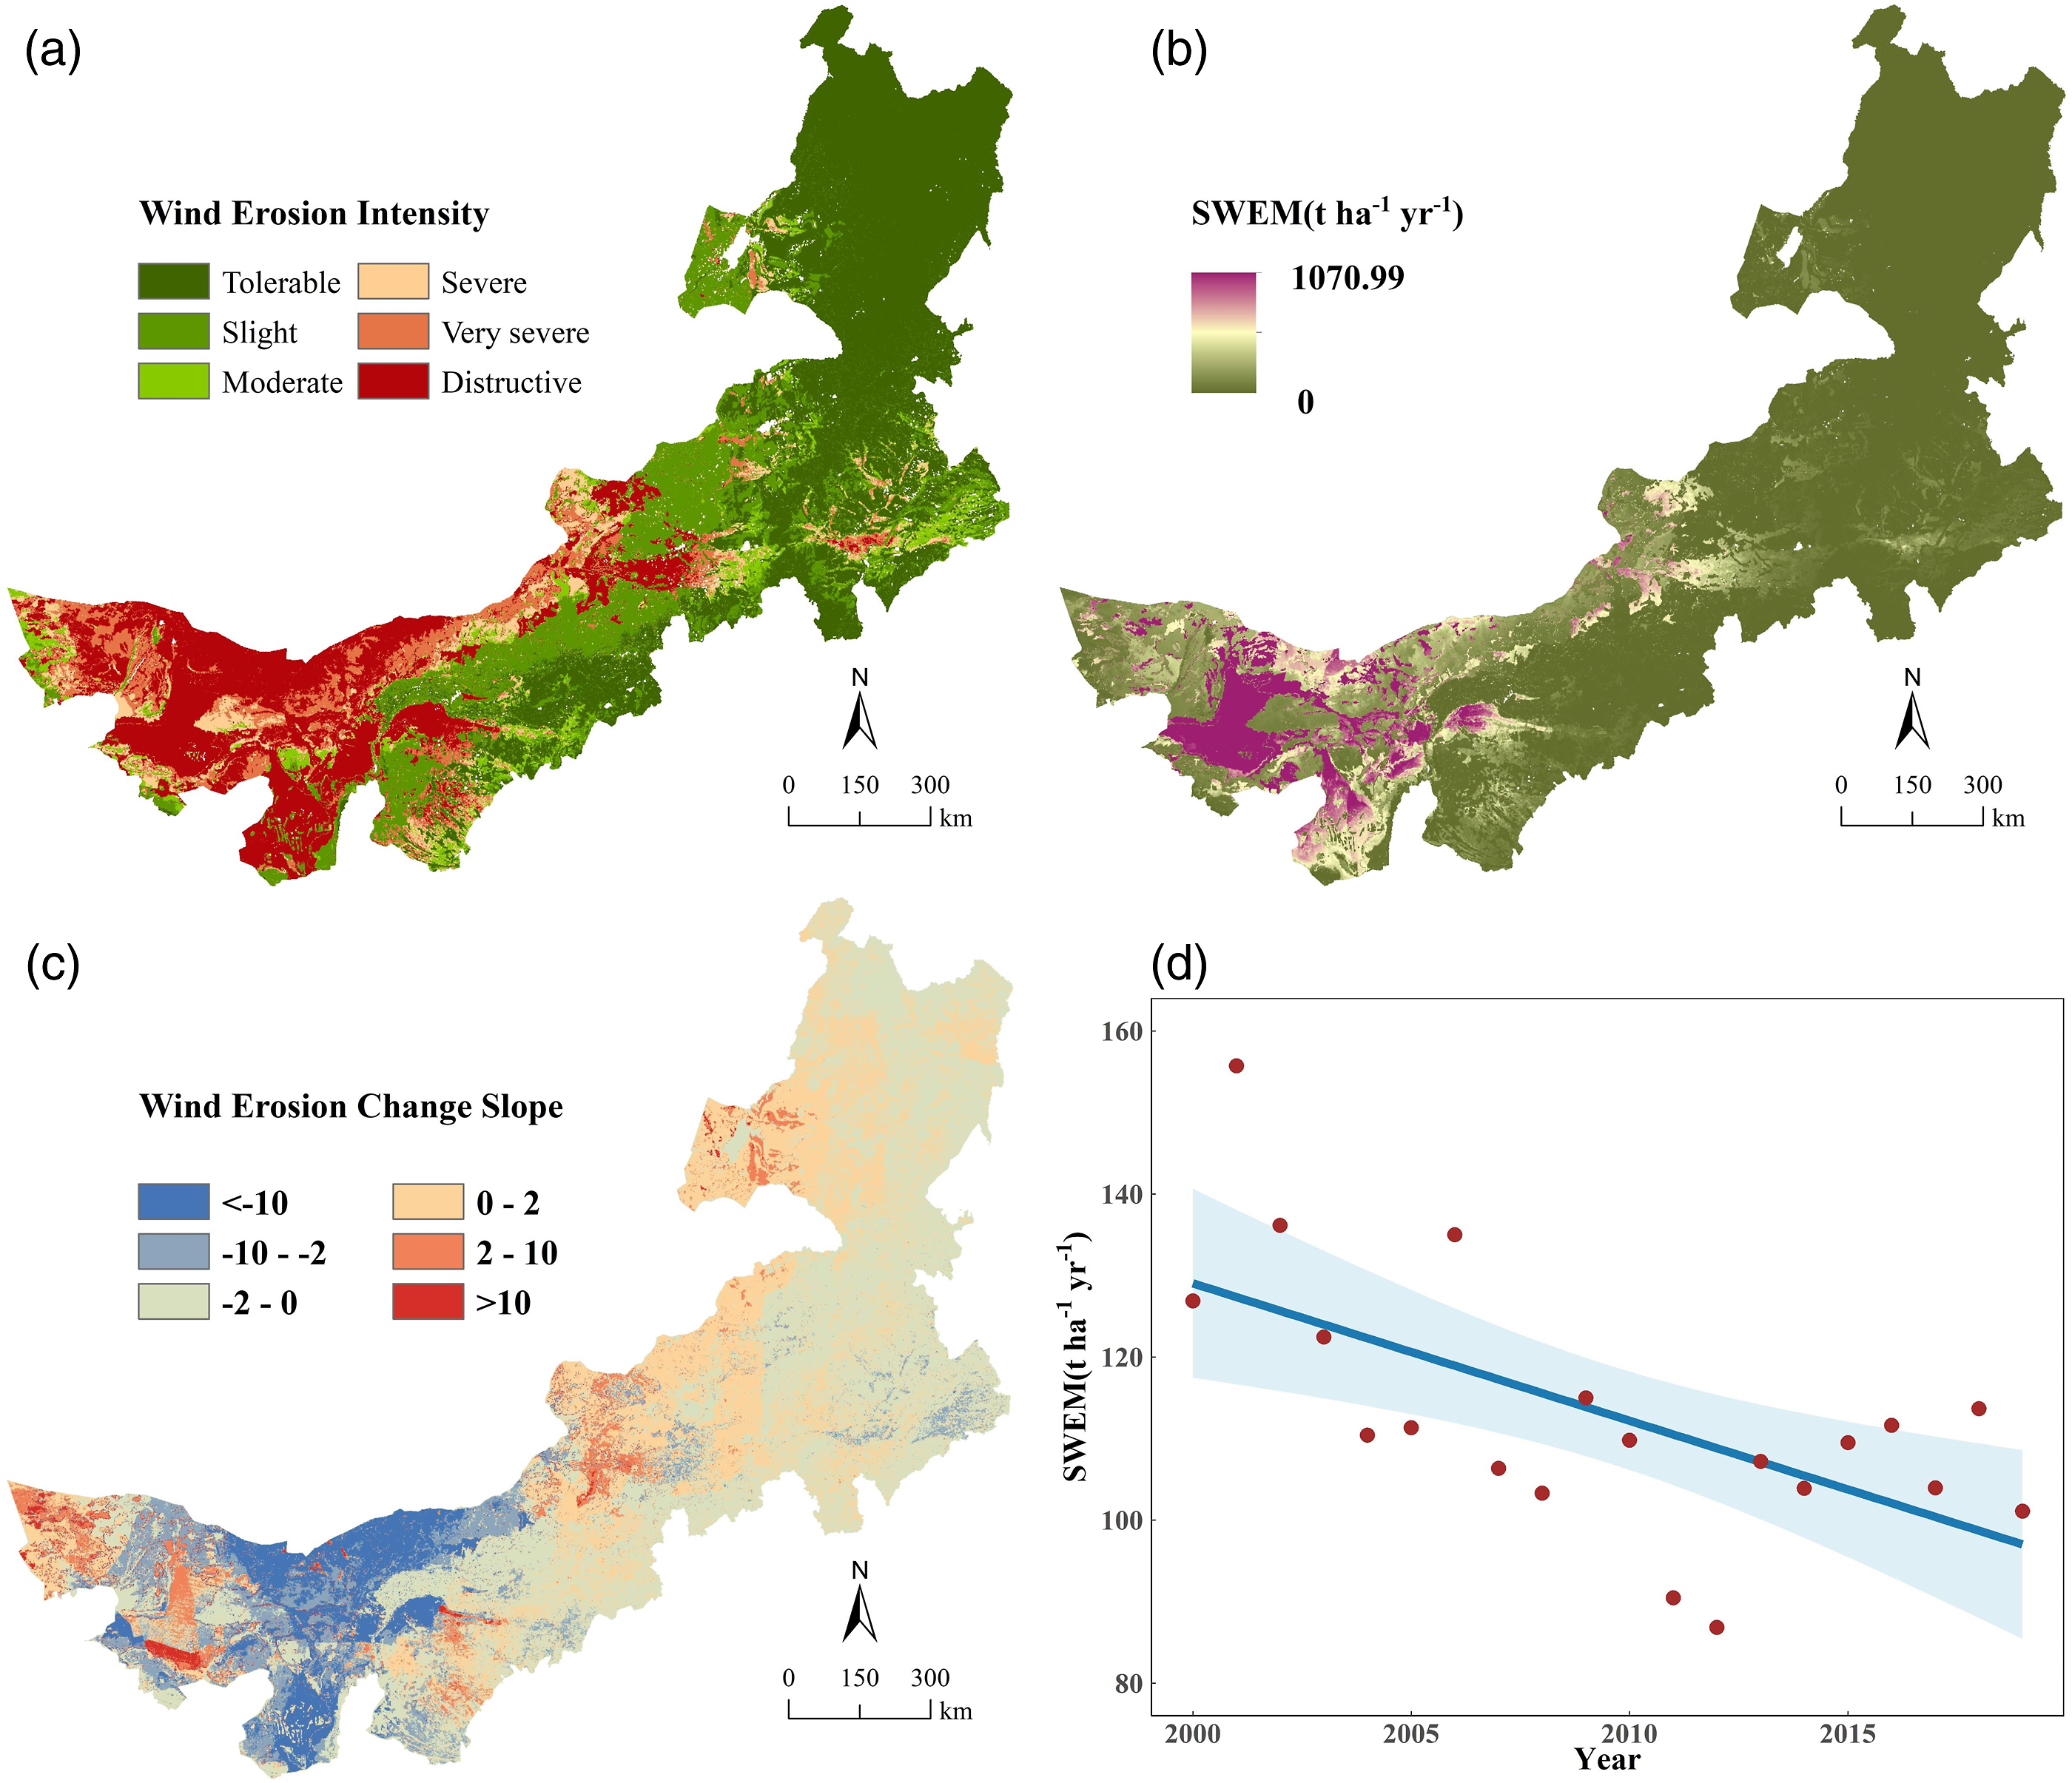
3.1.2 Annual dynamic of WSFS
The WSFS in Inner Mongolia ranged from 153.31 × 10⁸ t yr−1 to 243.53 × 10⁸ t yr−1 (Figure 3(d)), with the highest and lowest values reported in 2004 and 2017, respectively, with an average of 181.11 × 10⁸ t yr−1. Spatially (Figure 3(a) and (b)), those areas with high WSFS were concentrated in major deserts and sandy areas, such as the Kerqin and Hunsandak sands in central Inner Mongolia, the Batangilin Desert in the west, and the area bordering Mongolia in the north, whereas those areas with low WSFS were concentrated in the densely forested northeast and the Gobi Desert in the northwest. As shown in the trend analysis results (Figure 3(e) and (d)), WSFS demonstrated a downward trend as a whole, and those locations reporting a reduction in WSFS accounted for 70.85% of Inner Mongolia and were mainly distributed in the northern, central, and northeastern parts of the province. The decrease reported in the north was the most obvious, whereas those locations reporting an increase only accounted for less than 30% of the study area and were mainly distributed in the south and northeast parts of the province. Spatial distribution and variation trends of WSFS. Spatial distribution of (a) average WSFS; (b) the intensity of average WSFS; (c) the change slope of (c) WSFS; and the time change trend of (d) annual WSFS. The light blue background represents the 99.9% confidence interval.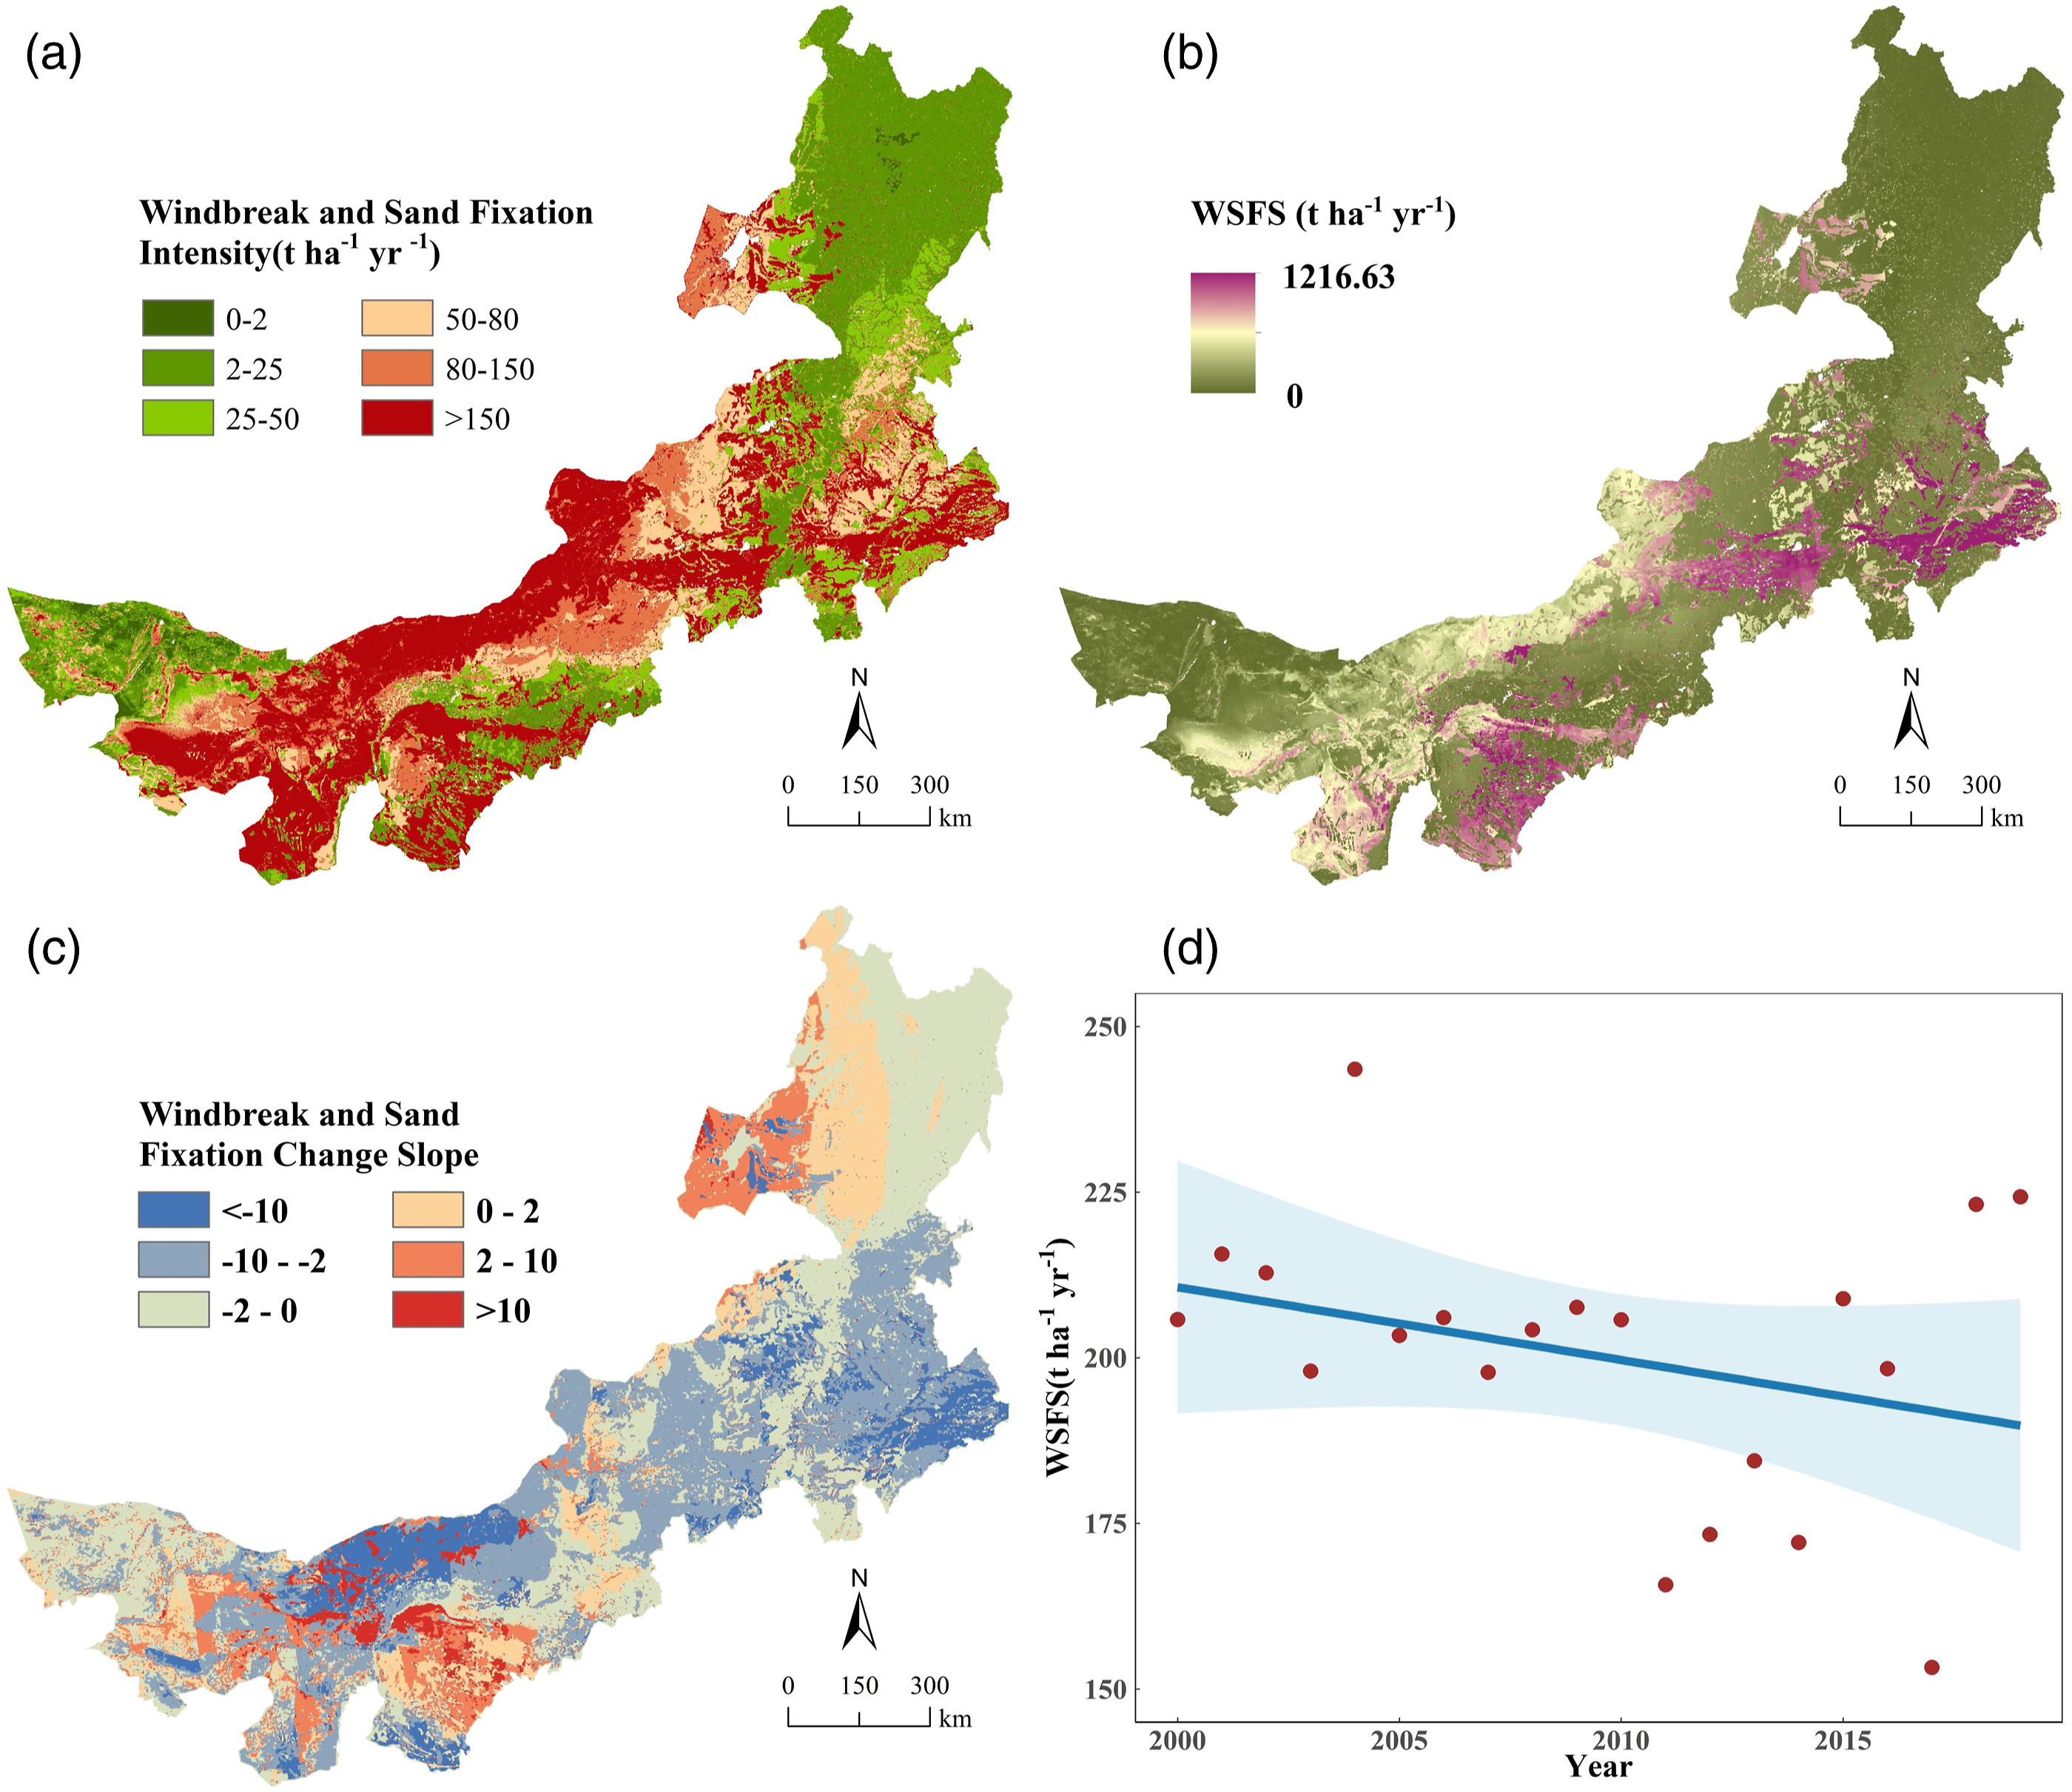
3.1.3 Monthly dynamics of WSFS
Figure 4 presents the monthly SWEM and WSFS values from 2000 to 2019 and their monthly averages. SWEM increased from February, reached the highest severity in April–May before decreasing, and showed only slight changes after September. The largest mean SWEM of 17.48 × 10⁸ t month−1 was reported in May. Monthly values of WSFS from 2000 to 2019. The bold horizontal lines indicate the monthly average value, whereas the dots on each horizontal line from left to right represent the value for each year in that specific month.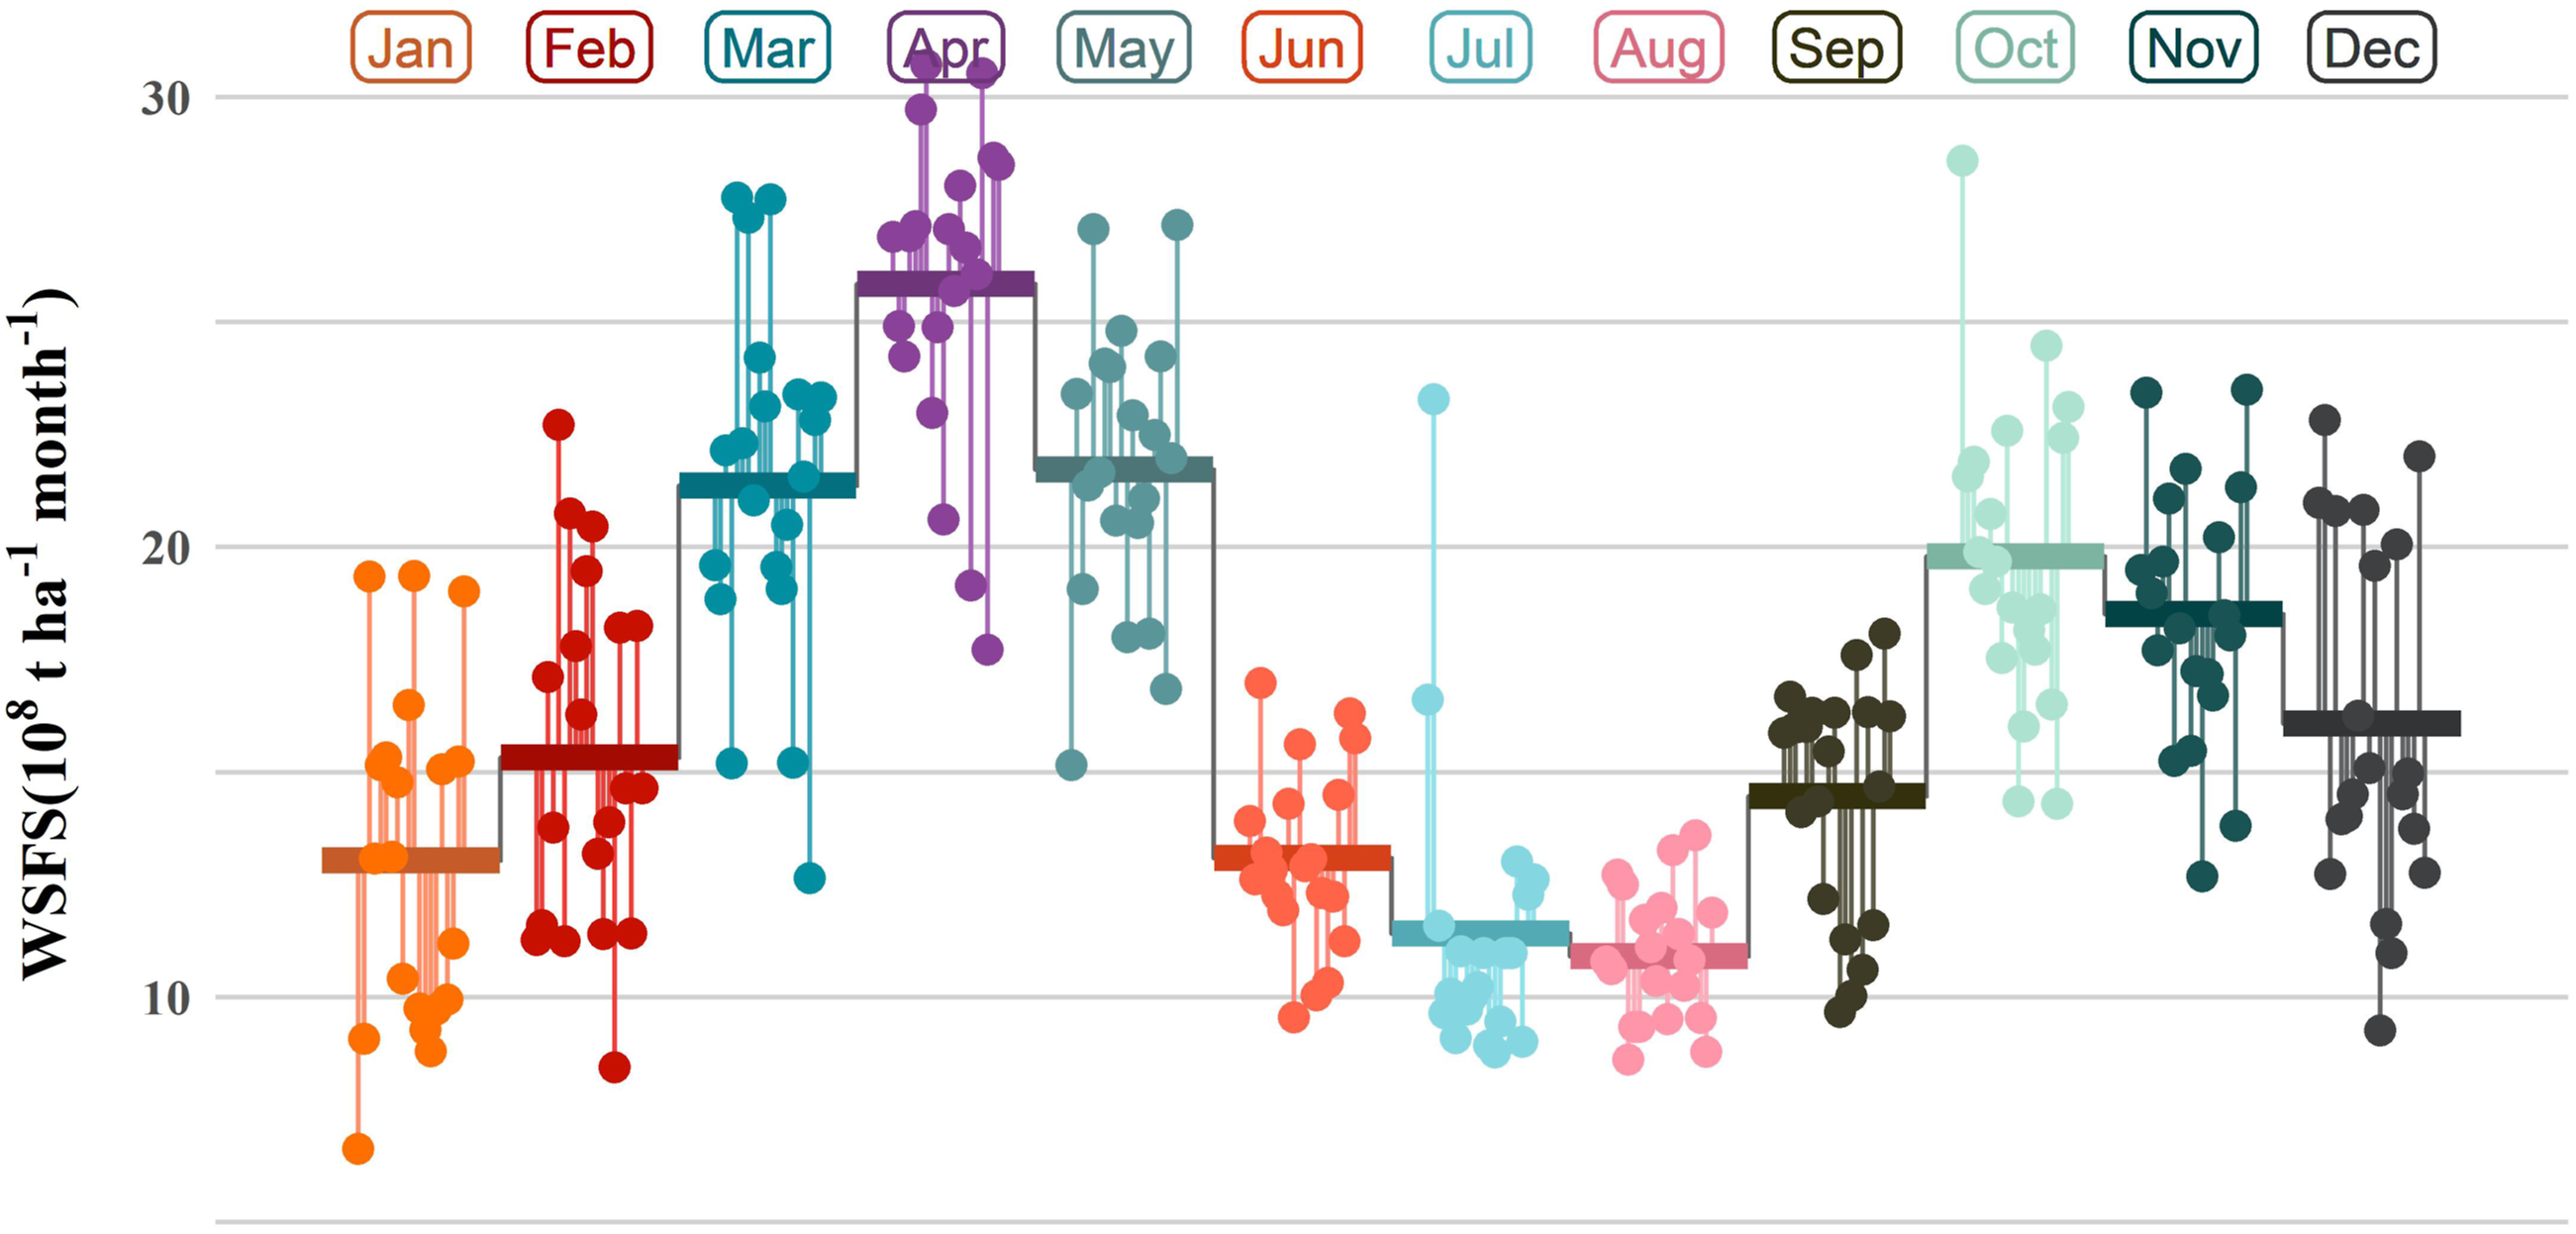
WSFS often peaked twice in the same year (April and October). The average WSFS in April was 26 × 108 t month−1, which was greater than 19.89 × 10⁸ t month−1 in October.
Since SWEM and WSFS demonstrated different levels on monthly scales, both also showed certain seasonally cyclical regularity, and more details of the seasonal dynamics were provided in Supplementary B.
3.2 Analysis of driving factors
The intensity of soil wind erosion is often affected by both natural (climate and vegetation coverage) and human-driven (with economic, social, and human activity attributes) factors. Precipitation, temperature, and NDVI were selected as natural driving factors, whereas the man-made factors considered both socio-economic (i.e., administrative area, population, intensity of farming and animal husbandry, and GDP) and human activity factors (land use change).
3.2.1 Analysis of natural driving factors
The monthly precipitation, temperature, and NDVI in Inner Mongolia from January 2000 to February 2020 showed obvious spatial differentiation characteristics (Figure 5(a)–(c)). More precipitation was in the east, less precipitation in the west, while the temperature was generally high in the south and low in the north, and NDVI decreased from northeast to southwest. Spatial characteristics of the natural driving elements and driving analysis. The spatial distribution of average (a) precipitation, (b) temperature, and (c) NDVI from 2000 to 2019, and the linear regression results of WSFS with (d) precipitation, (e) temperature, and (f) NDVI.
These three variables were treated as the natural influencing factors of WSFS, and their influences on WSFS were analyzed via univariate linear regression to determine the natural driving factors. Temperature (R 2 = 0.02, p-value < 0.05) showed the lowest significance, whereas precipitation (R 2 = 0.19, p-value < 0.01) and NDVI (R 2 = 0.17, p-value < 0.01) showed strong negative effects on WSFS. Therefore, among these three natural elements, WSFS showed no significant relationship with temperature but had a significant negative correlation with both precipitation and NDVI.
3.2.2 Analysis of human-driven factors
Human factors mainly come from two aspects, land use type change and economic policy intervention. On the one hand, changes in land use type come from two sources, namely, the transformation of natural landscapes for human use and changing the management of human-dominated lands (Foley et al., 2005). In either case, human activities drive changes in land use type, and land use type in turn intuitively reflects the process of human activities. On the other hand, a close relationship can be observed among social factors, such as economic policies and regional environment (Farber et al., 2002; von Seht, 1999). Inner Mongolia has the highest concentration of desertification among all provinces in China, and social factors, such as economy and population, greatly vary across alliances. Therefore, social and economic factors can exert different effects on WSFS from one alliance to another. Moreover, Inner Mongolia has complex agricultural and animal husbandry conditions because agricultural, pastoral, and agro-pastoral areas are all available in the same province (Gao and Liu, 2021). Therefore, when exploring the effect of WSFS, the intensity of agricultural and animal husbandry operations should be considered. This study then measured the anthropogenic drivers of WSFS in terms of changes in land use type and socio-economic differences.
Given the availability of data, this study utilizes two land use data (2000 and 2018) within the study period to conduct a study of land use change on WSFS driving force identification.
Area of each land use type and their WSFS in Inner Mongolia in 2000 and 2018.
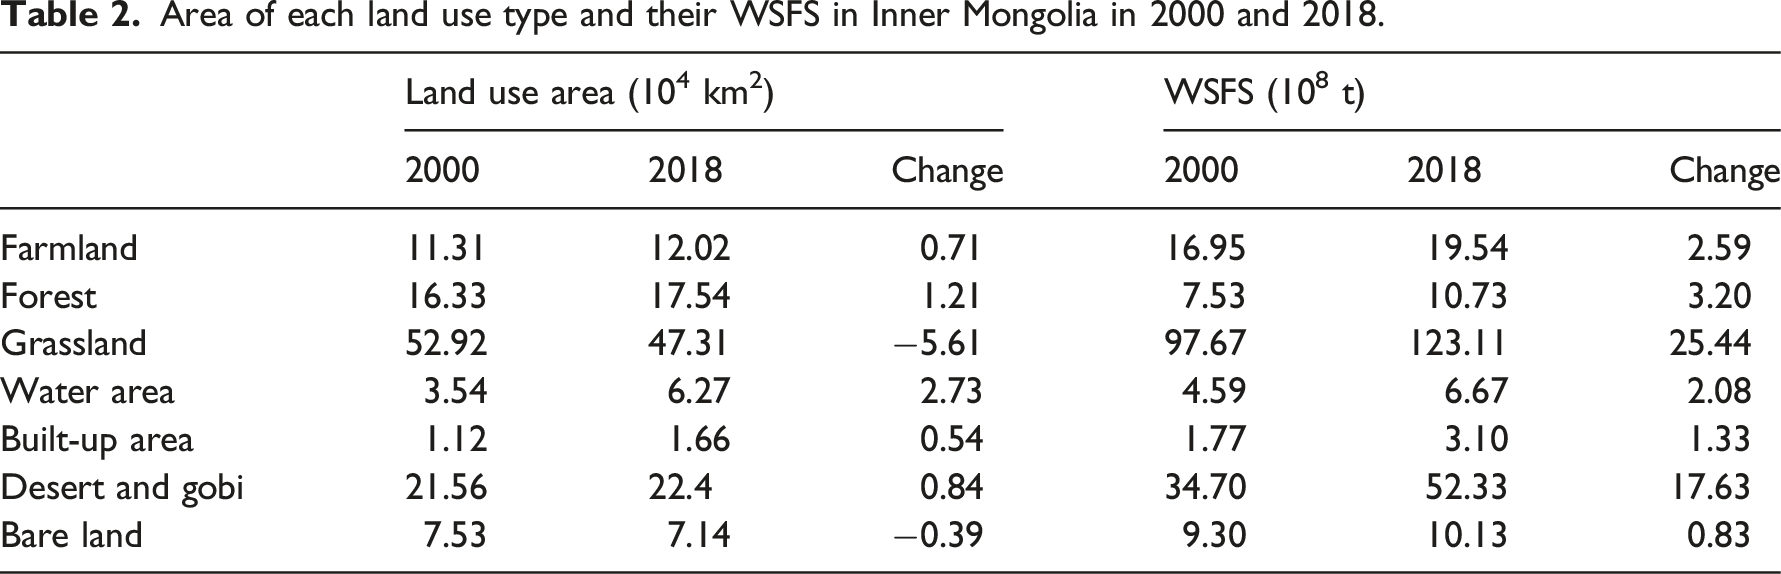
WSFS change caused by land use type change was studied in this paper and the variation volume on any transformation circumstances (Table S.C. 1). Changes in WSFS caused by land-use type transformation were 12.81 × 10⁸ t and accounted for about 24% of the total variation, which showed that human activities had a profound influence on windbreak and fixation services changes.
As for the economic and social factors, data on the gross area of administrative districts (10,000 km2), year-end number of population (10,000 persons), and GDP (100 million yuan) of each league or city in 2019 were collected, and the intensity of farming and animal husbandry operations was computed by using the year-end number of large livestock (10,000 heads) and the total sown area of crops (1000 ha). Geographically weighted regression was applied to explore the relationship between each variable and WSFS.
In terms of socio-economics (Figure 6), first, the relationship between administrative district area and WSFS showed a weak negative correlation, indicating that not the larger the administrative district area is in Inner Mongolia, the more WSFS were available. Second, the population showed a negative correlation with WSFS. Third, the number of large livestock, farmland area, and GDP showed positive correlations with WSFS. Specifically, the intensity of farming and animal husbandry and the economic level was positively correlated with WSFS. Therefore, population, GDP, and intensity of farming and animal husbandry are important socio-economic drivers of WSFS. Spatial characteristics of human-driven elements. (a) Standard residuals of geographically weighted regression, and the regression results of WSFS with (b) gross area, (c) population, (d) GDP, (e) number of large animals, and (f) sown area. The blue color indicates a positive relationship, whereas the orange color indicates a negative relationship.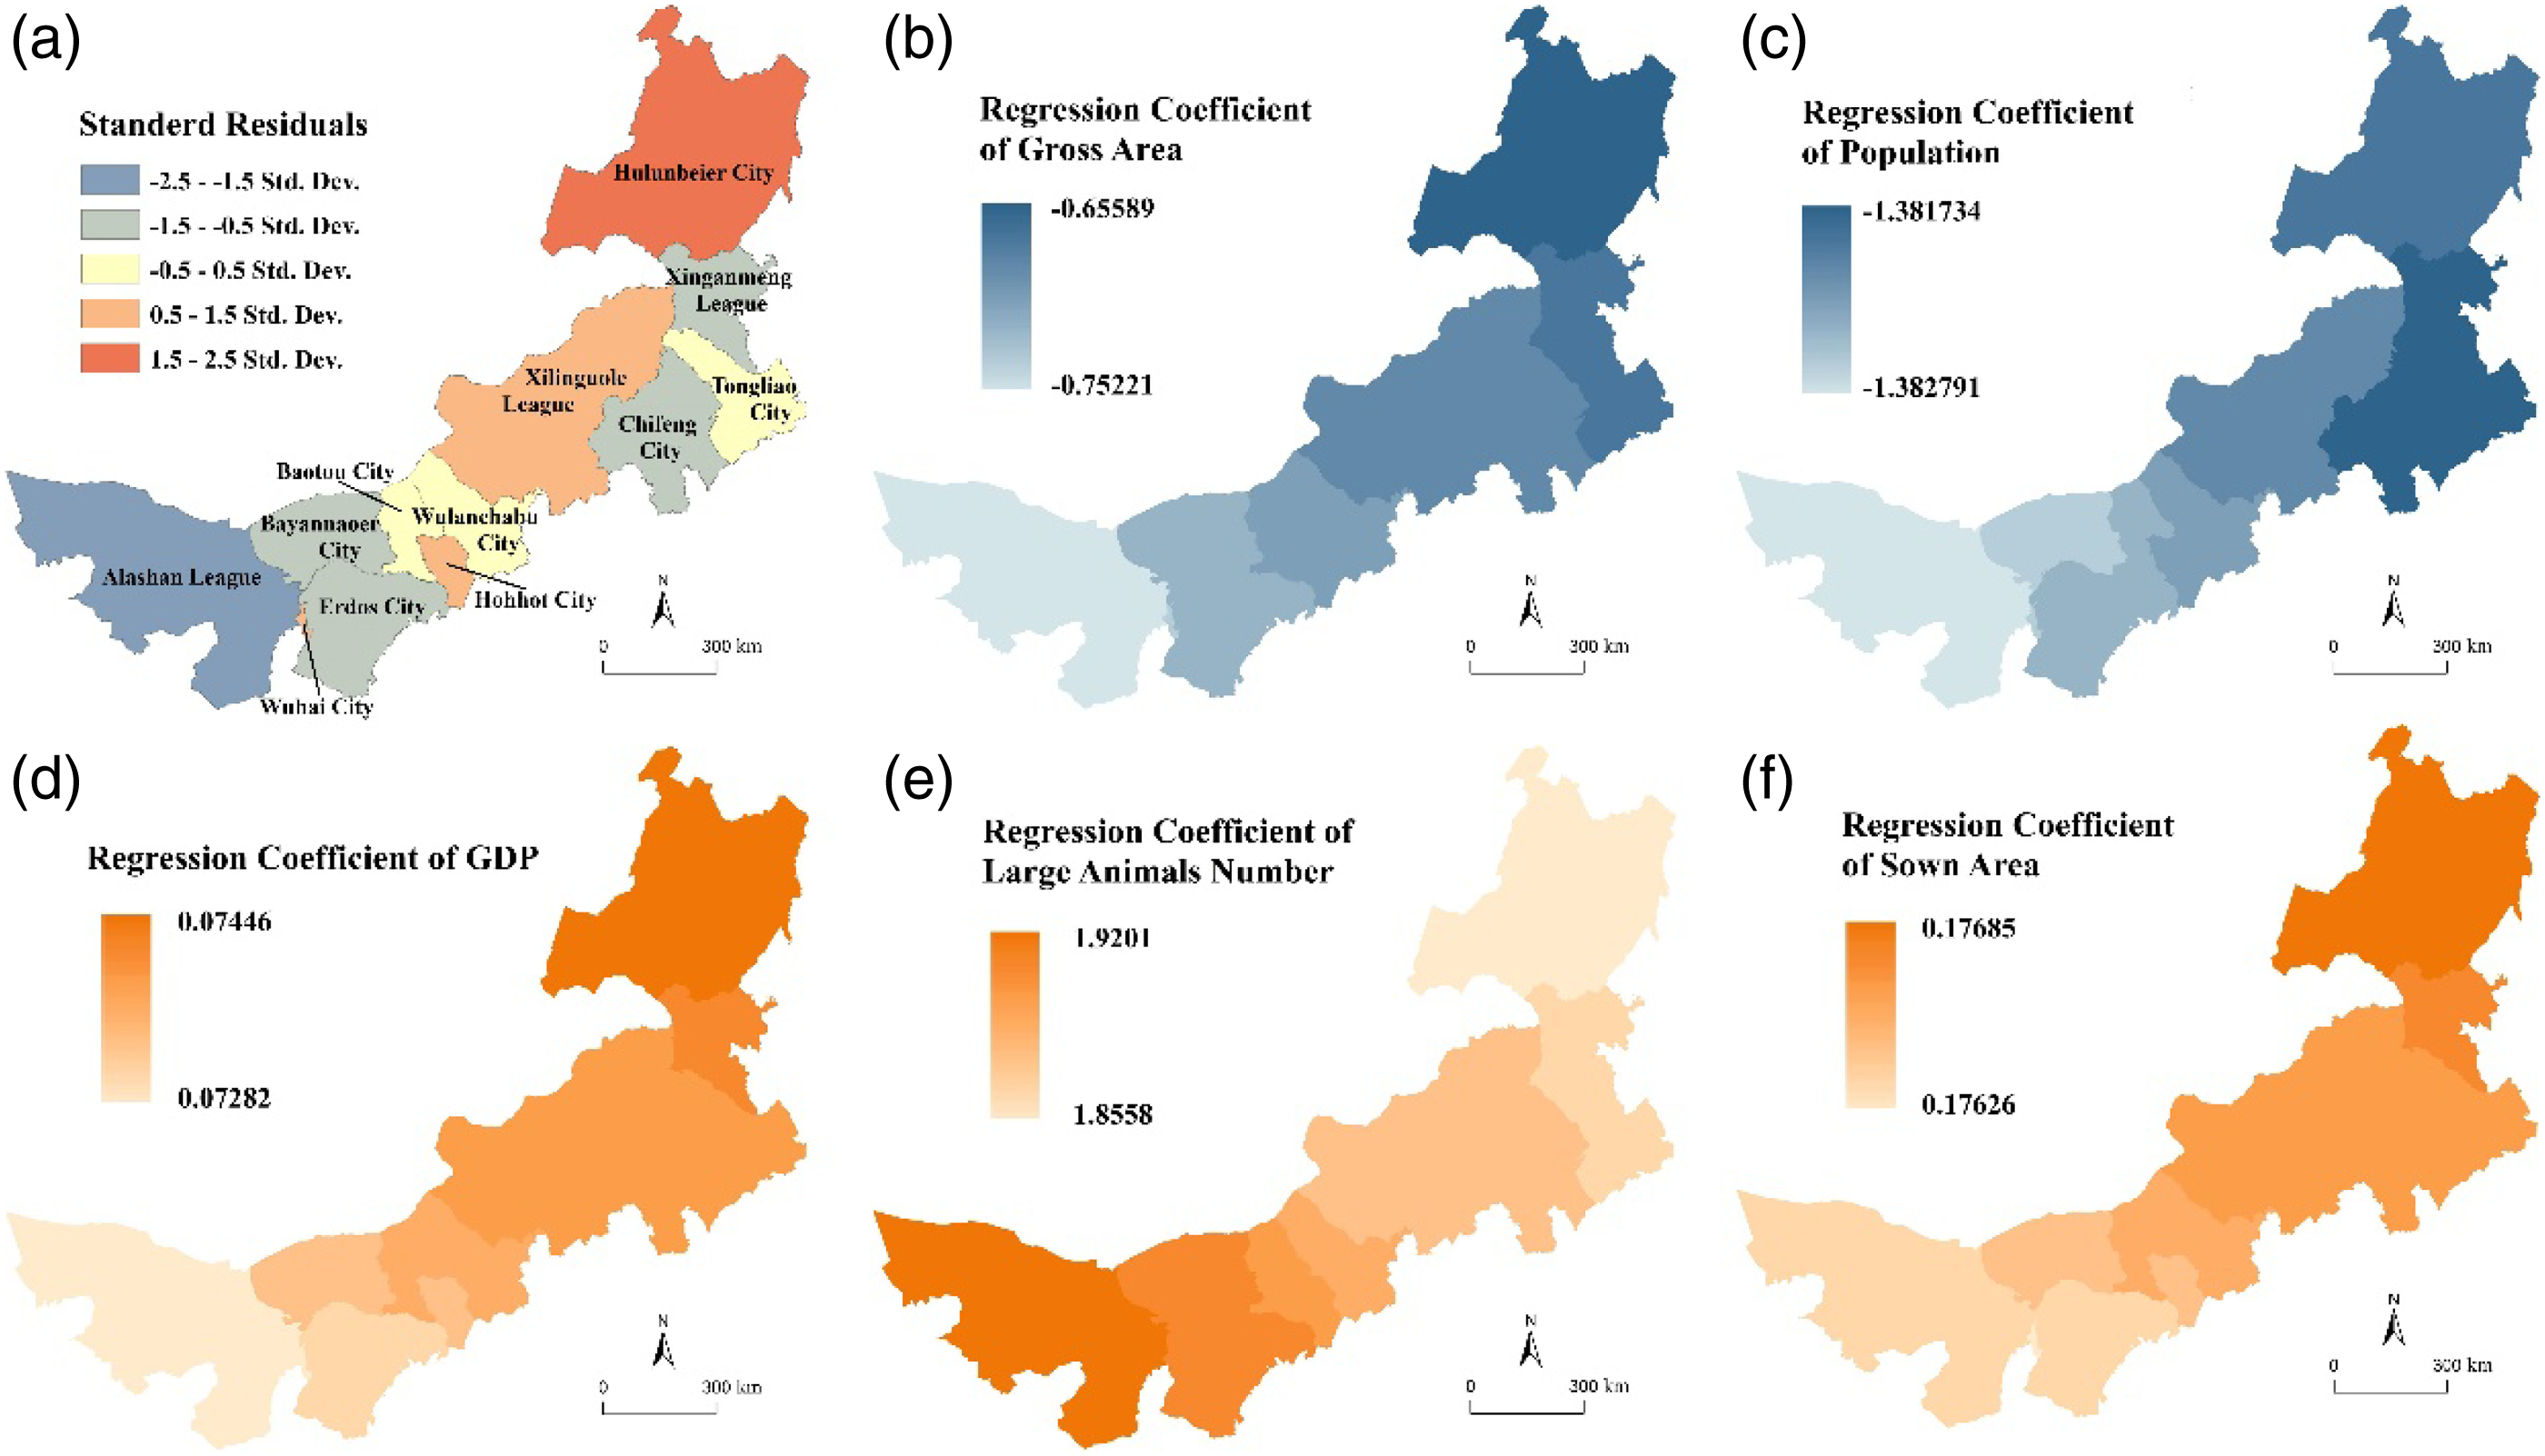
In sum, the natural driving factors of WSFS include NDVI and precipitation, whereas its anthropogenic driving factors include the intensity of human activity, agricultural and animal husbandry operation intensity, population, and economic level.
IV Discussion
4.1 Verification of modeling results
To verify the accuracy of the RWEQ model, given the lack of actual observational data on large-scale soil erosion, the number of days of gale (where the maximum daily wind speed exceeds 17.2 m/s), and soil wind erosion often showed a strong correlation (Lin et al., 2021). SWEM was validated by univariate linear regression with days of gale. Results in Figure 7 show a significantly positive correlation between SWEM and number of days with strong winds (R
2
= .76, p-value < .01), thereby indicating that the simulation results of the RWEQ model are reliable. The regression result between SWEM and gale days. The light blue background represents the 99.9% confidence interval.
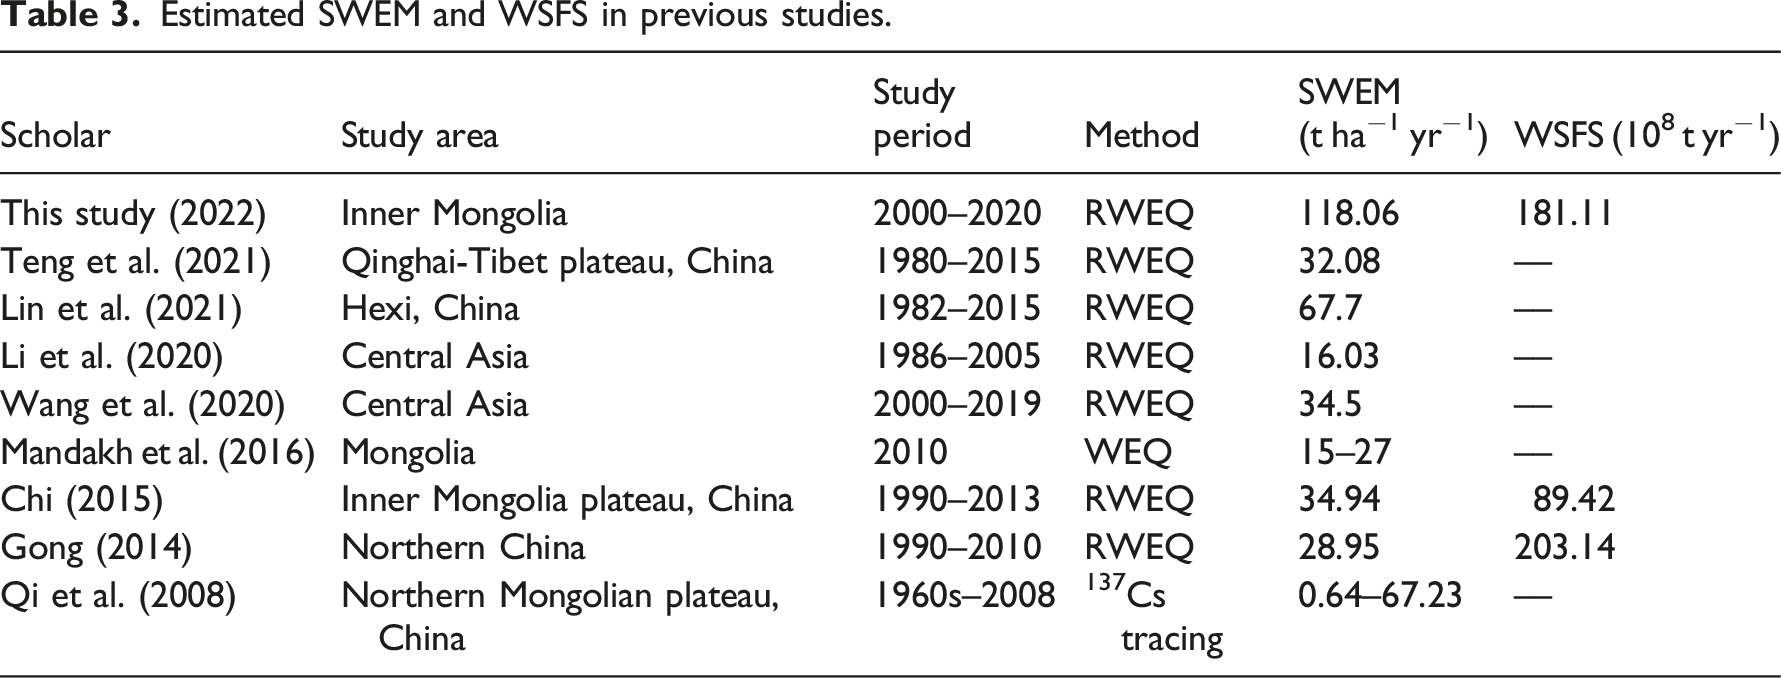
Estimated SWEM and WSFS in previous studies.
4.2 Suggestions for windbreak and sand fixation policies
Statistics of sand and dust weather.
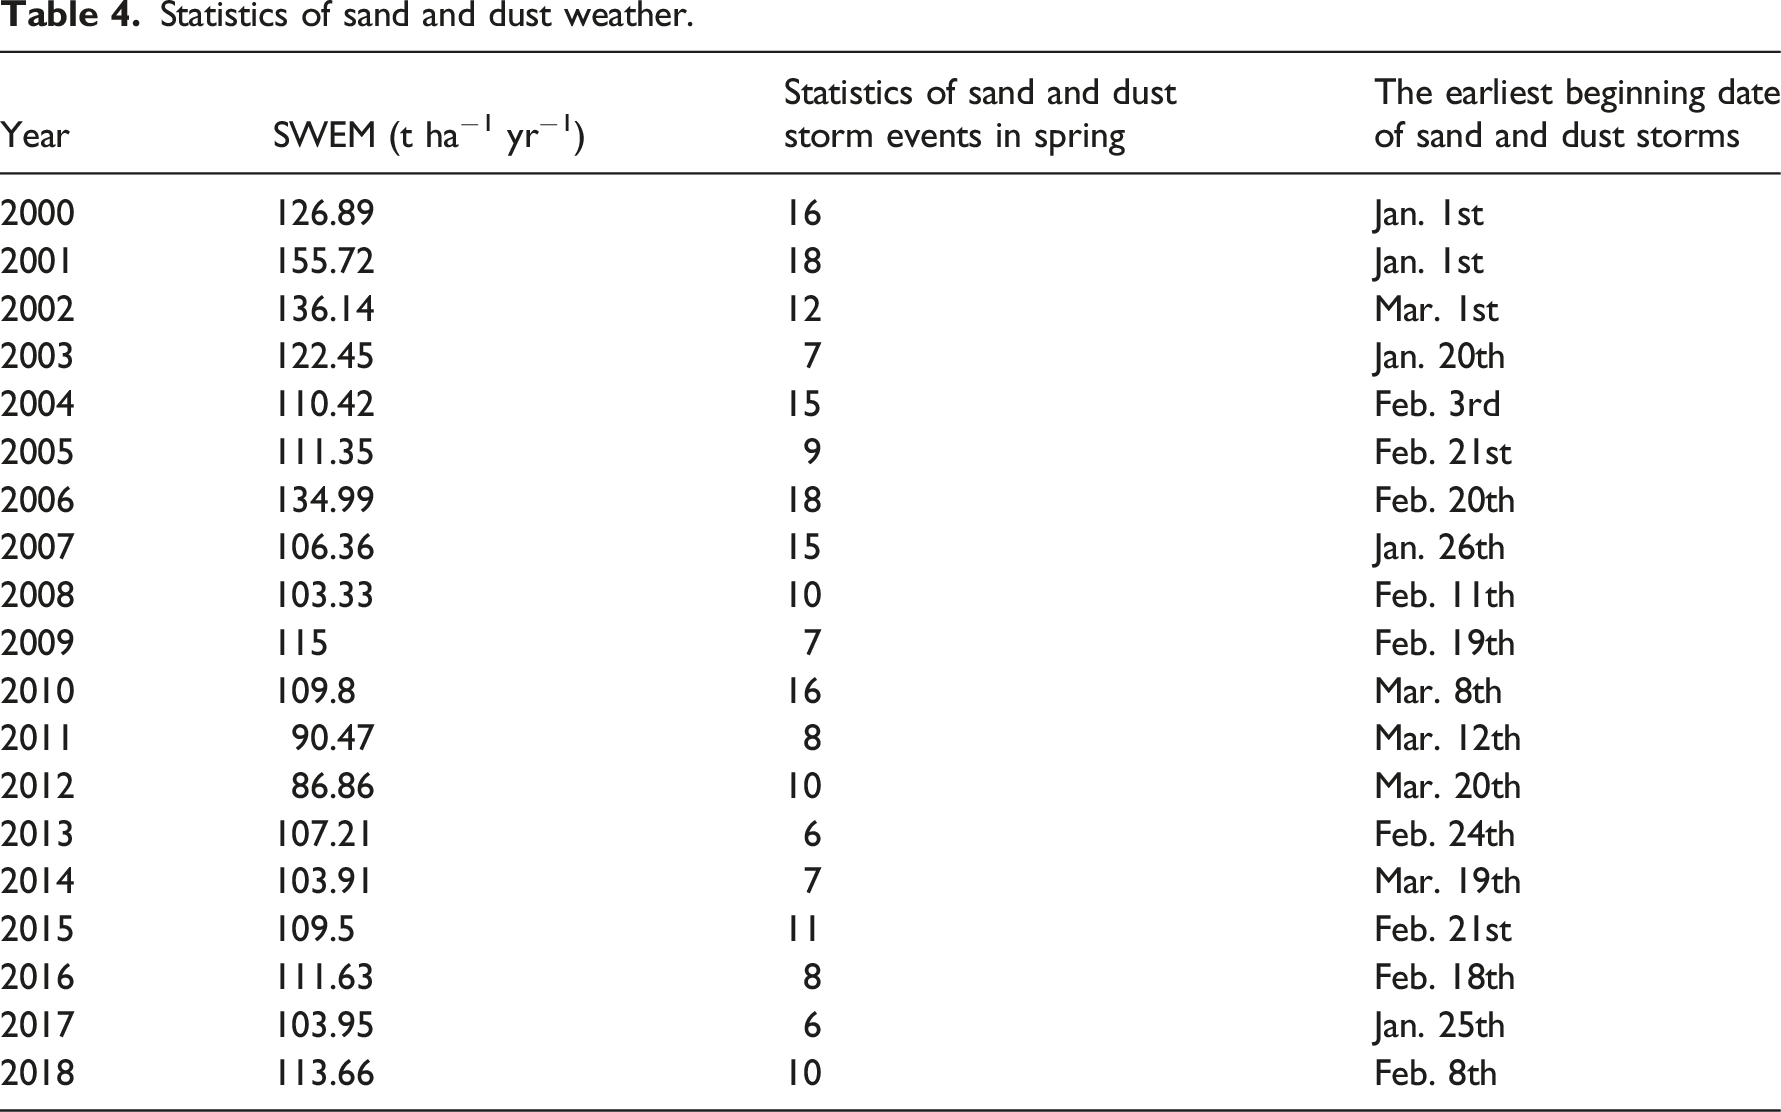
Over the past 20 years, the NDVI in Inner Mongolia showed an obvious upward trend (Figure 8(a)), indicating that its vegetation coverage showed improvements in recent years. Given the significant negative correlation between vegetation cover and the number of dust weather occurrences (Figure 8(b)), NDVI is an important natural driver of WSFS due to improved vegetation cover, which blocks raging winds, reduces wind speed, and decreases dust weather events. Therefore, improving vegetation cover is an important nature-based solution to attenuate soil wind erosion. Change trend of NDVI and its correlation with dust weather. (a) Temporal dynamic trend and (b) regression result of NDVI with sand and dust storm events in Inner Mongolia from 2000 to 2019. The light blue background represents the 99.9% confidence interval.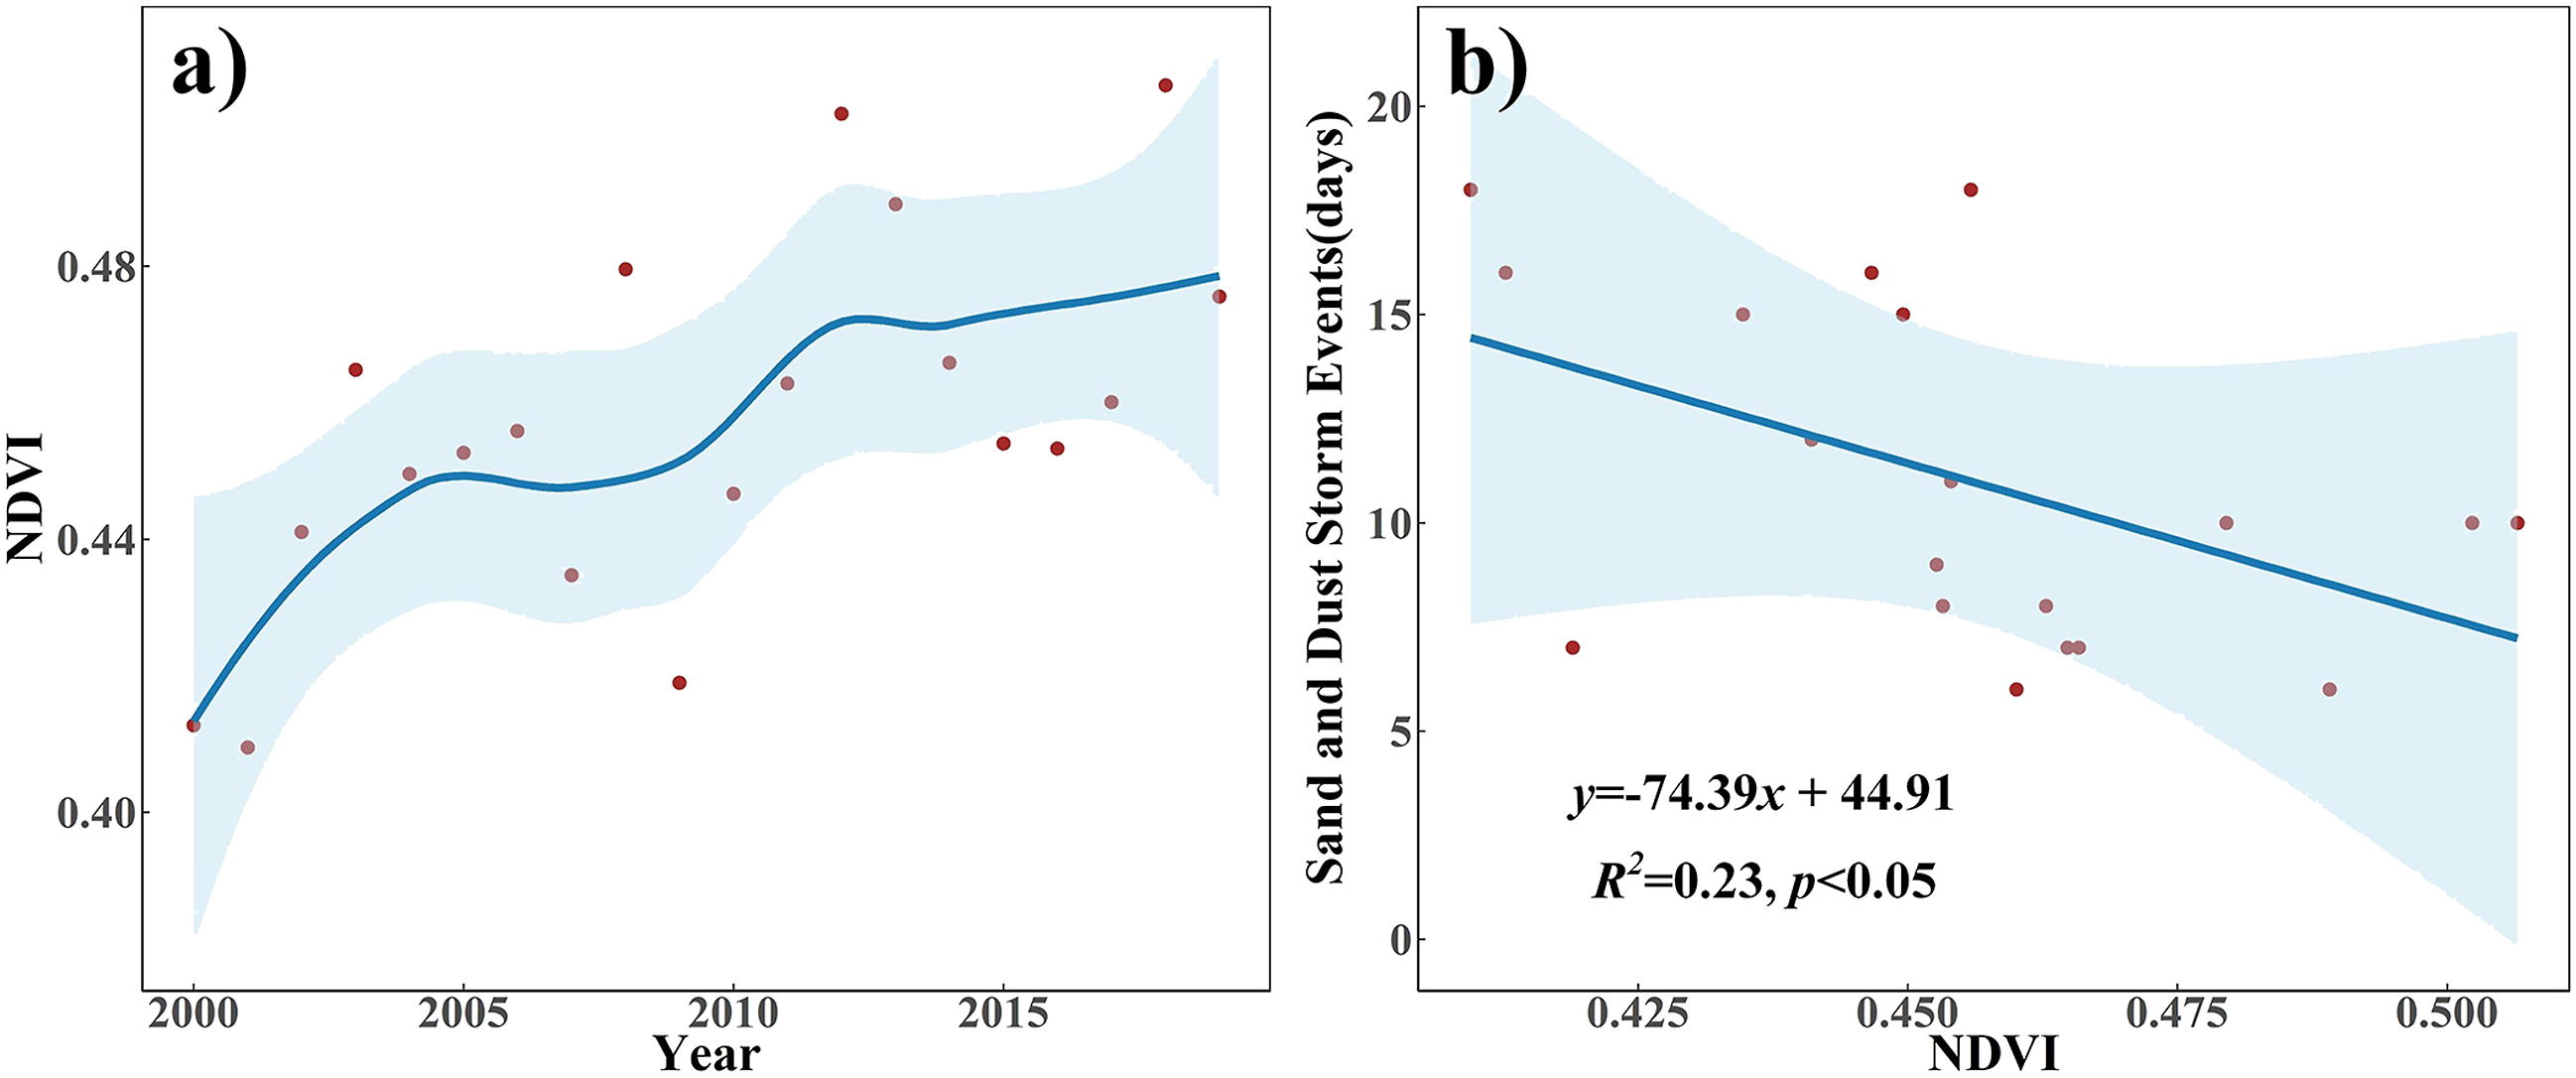
Among the socio-economic driving factors, the administrative area cannot dominate the WSFS. For example, while the Alxa League has the largest area (27.02 × 10⁴ km2), its average WSFS was the smallest (0.28 × 10⁸ t yr−1). Meanwhile, the second largest city of Hulunbeier (25.3 × 10⁴ km2) had the largest average WSFS (55.36 × 10⁸ t yr −1). Therefore, the WSFS in the administrative area should be determined according to the land cover and meteorological elements within the jurisdiction. In addition, the WSFS tends to be smaller in densely populated areas, which may be due to the urban expansion in recent years where the underlying surface has been changed (He et al., 2017). In the process of urban expansion, conflicts often arise between human needs and the rational land resource management and utilization, so that high-quality land use types (such as farmland, forest, and grassland) for windbreak and sand fixation are prone to conversion to the built-up area. However, construction land does not experience soil wind erosion or sand fixation. Therefore, a denser population correspond to less WSFS. Economic development can also indirectly help the sand control strategy (such as fallow, crop rotation, rest grazing, and the rational selection and breeding), because only when the government has certain economic strength can it formulate more scientific, precise, and efficient agricultural and livestock production policies, and can better solve and deal with the contradiction between production, life, and ecology. These policies protect plant growth and promote lush pastures and crop growth, which in turn increase WSFS.
The capacity of WSFS improved further in spite of the reduction of grassland area, indicating that the windbreak and sand fixation projects in Inner Mongolia have achieved certain results in the process. Within the last 20 years, the improvement of the total WSFS under the effect of land use change relied mainly on the transformation of low vegetation cover to higher ones, and there were large areas of deserts converted to grasslands under human action to achieve the effect of sand control and sand management projects. However, during this period, more grassland continued to degrade and transformed into the desert and other land use types, thus intensifying soil wind erosion conditions. Hence, when implementing wind and sand control engineering, not only the areas with severe desertification should be taken seriously, but also the grassland with degradation trend should be paid due attention to prevent further deterioration of low-cover grassland.
Therefore, rational land use control and territorial spatial planning can be targeted to prevent soil wind erosion, and accelerating economic development can improve soil wind erosion either directly or indirectly.
4.3 Limitations and prospects
The spatiotemporal simulation of large-scale wind erosion has always been a difficult point in wind erosion research, and a unified framework for measuring WSFS is yet to be developed. Based on the improved RWEQ model, this study simulates the soil wind erosion in the whole of Inner Mongolia over the past 20 years and quantifies the temporal and spatial changes in SWEM and WSFS. However, the model used in this study is a semi-empirical and semi-process model based on a field-scale design. Given the lack of field observation data, the uncertainty in the original data has not been effectively resolved. The parameter setting (local wind speed measurement and comprehensive vegetation) also requires further improvement based on the background characteristics of the study area. In future research, local sampling data must be used to complete the model correction work and to further improve the accuracy of the model. In addition, while the spatiotemporal dynamics of SWEM and WSFS in Inner Mongolia were predicted in this paper, their application and practice need to be further explored. For example, the synergistic or trade-off relationship between WSFS and other ecosystem services in different areas can be explored to provide theoretical support for the detailed formulation of sand control policies. The changes in the local SWEM and WSFS should also be studied in detail, and the landscape planning of urban and rural green spaces should be coupled with human health and well-being to support the sustainable development of arid areas.
Ⅴ Conclusions
The RWEQ model was used in this study with half-month as the research scale. The monthly, seasonal, and yearly SWEM and WSFS data of Inner Mongolia were synthesized from January 2000 to February 2020, and the temporal and spatial distribution characteristics of these two were discussed. The driving force of WSFS was then explored and analyzed from both natural and man-made aspects. The following key conclusions were derived: (1) The extent of soil wind erosion was high in the southwest and low in the northeast, while WSFS showed a high spatial distribution in the northern, central, and southern parts of the province and a low spatial distribution in its northeastern and northwestern parts. WSFS often peaks twice in a year in April and October. (2) Among the three natural factors, no significant correlation was observed between temperature and WSFS, whereas both precipitation and NDVI showed a significant correlation with WSFS, hence making them the main natural driving factors of WSFS. (3) Among the five socio-economic factors, WSFS had no significant correlation with the administrative area but was negatively correlated with population. Meanwhile, a positive correlation was observed between WSFS with GDP, the intensity of farming, and animal husbandry (number of large livestock at the end of the year and total sown area of crops). These four were then identified as the socio-economic driving forces of WSFS. Changes in WSFS caused by land use type transformation accounted for about 24% of the total variation, which indicated that human activity intensity was an important driving factor. To sum up, population, GDP, the intensity of farming and husbandry, and human activities were important driving factors of WSFS.
Supplemental Material
Supplemental Material—Identification of driving forces for windbreak and sand fixation services in semiarid and arid areas: A case of Inner Mongolia, China
Supplemental Material for Identification of driving forces for windbreak and sand fixation services in semiarid and arid areas: A case of Inner Mongolia, China by Lihan Cui, Zhen Shen, Yuexin Liu, Chaoyue Yu, Qingling Lu, Zhonghao Zhang and Yang Gao in Progress in Physical Geography: Earth and Environment
Footnotes
Declaration of conflicting interests
The author(s) declared no potential conflicts of interest with respect to the research, authorship, and/or publication of this article.
Funding
The author(s) disclosed receipt of the following financial support for the research, authorship, and/or publication of this article: This work was supported by the National Natural Science Foundation of China (Grant number 42071284) and the Natural Science Foundation of Shanghai (Grant number 22ZR1446200).
Supplemental material
Supplemental material for this article is available online.
References
Supplementary Material
Please find the following supplemental material available below.
For Open Access articles published under a Creative Commons License, all supplemental material carries the same license as the article it is associated with.
For non-Open Access articles published, all supplemental material carries a non-exclusive license, and permission requests for re-use of supplemental material or any part of supplemental material shall be sent directly to the copyright owner as specified in the copyright notice associated with the article.