



Abstract
Northern high-alpine regions are currently experiencing rapid warming, which often results in the degradation of sub-surface permafrost and the upslope advancement of vegetation. The present study combines remotely sensed MODIS Land Surface Temperatures (LSTs) and the Normalised Difference Vegetation Index (NDVI) with observed air temperatures to model the thermal and vegetational dynamics in NE Jotunheimen (Norway) for the period 1957–2019. An altitudinal transect on the north-facing slope of Galdhøpiggen was used for ground truthing. Results indicate a substantial warming trend since the late 1950s, accompanied by increased NDVI. The spatial and temporal patterns of observed change were not uniform. Winter surface temperatures increased most rapidly, by 2.4–2.8°C at mid- and low altitudes (600–1500 m a.s.l.). The highest increases in NDVI (by ∼0.1) were detected during the growing season (April–September) and over the mid-range altitudes (1050–1500 m a.s.l.), that is, above the tree line on Galdhøpiggen. We attribute this to increased shrubification at these altitudes. Our results confirm that the surface temperatures near the previously estimated lower altitudinal limit of permafrost (∼1450 m a.s.l.) have continued to increase during the past decade, likely facilitating further permafrost degradation. Finally, we demonstrate that mapping remotely sensed mean growing season LSTs below 0°C can be used to identify areas suitable for continuous sub-surface permafrost, and mean June–September LSTs above 7°C can detect areas suitable for tree (Betula pubescens) growth in NE Jotunheimen.
Keywords
I Introduction
Alpine tundra biomes are highly vulnerable to climatic changes, as increasing air temperatures drive the degradation of sub-surface permafrost and lead to associated shifts in aboveground vegetation patterns. The sensitivity of high mountain areas is rightly receiving attention because their warming rate is currently thought to outpace the global warming rate, in some cases by as much as 50% (Hock et al., 2019). Recent increases in ground temperature in mountain permafrost regions across the globe have been established at nearly 0.2°C per decade (Biskaborn et al., 2019), whilst the rate at which tree lines shift upslope could be in the order of metres per year (Cazzolla Gatti et al., 2019). This response is observed in both trees and shrubs, as the conditions for growth become more favourable at higher altitudes (Dial et al., 2007; Hallinger et al., 2010; Myers-Smith et al., 2011). Such substantial changes in vegetation patterns across alpine tundra ecosystems can have wider ecological consequences. Increased vegetation cover at higher altitudes is likely to result in reduced surface albedo, which in turn intensifies surface heating of alpine areas through increased absorption of solar radiation (Chapin et al., 2005; Pearson et al., 2013). Furthermore, increased vegetation cover is expected to alter local and regional carbon cycles, potentially creating a positive feedback to climate warming (Cahoon et al., 2012; Frost et al., 2019; Post et al., 2009).
Significant increases in air-, ground- and ground surface temperatures have also been recorded over the past decades in the mountainous Jotunheimen region in Southern Norway (Etzelmüller et al., 2020; Farbrot et al., 2011). In-situ geophysical and thermal monitoring methods have been used extensively to document and reconstruct the present and past states of mountain permafrost in parts of Jotunheimen (e.g., Gisnås et al., 2017; Hauck et al., 2004; Isaksen et al., 2007, 2011; Ødegård et al., 1996), and models suggest that the extent of permafrost will continue to decrease (Hipp et al., 2012). In addition, detailed field-based vegetation surveys have been conducted across bioclimatic gradients to study patterns of succession (Matthews et al., 2018; Robbins and Matthews, 2010, 2014), and evidence indicates the upslope advancement of the tree line and the establishment of shrubs (Salix herbacea) as high as 1950 m a.s.l. on Galdhøpiggen, the highest peak in Jotunheimen, over the past four decades (Hallang et al., 2020).
Jotunheimen offers an excellent opportunity to further investigate the distribution of mountain permafrost and vegetation patterns, and to better understand how alpine tundra biomes respond to climatic changes (Etzelmüller et al., 2020; Myers-Smith et al., 2020). Here, we build on aforementioned local field studies (e.g., Hallang et al., 2020; Hipp et al., 2012; Matthews et al., 2018) and employ remote sensing techniques with the main objective to temporally and spatially up-scale such observations and measurements and acquire easily accessible and useful data on a regional scale. Field-based studies have already established a high correlation between air-, ground surface- and ground temperatures at Juvvasshøe on Galdhøpiggen (Isaksen et al., 2003), which can be applied for remote sensing approaches to determine the distribution of permafrost over the wider region (Winkler et al., 2021).Whilst detailed, in-situ methods for recording and monitoring alpine ground (surface) temperatures and vegetation dynamics remain indispensable, they are obviously labour-intensive, logistically complicated due to reduced access to remote sites and potentially expensive (Hachem et al., 2009), which led us to the use of satellite imagery.
Satellite remote sensing provides an inexpensive, easily accessed alternative to map and monitor vegetational trends and surface temperatures over large spatial and temporal scales. Here, we use the satellite-derived MODIS Land Surface Temperatures (LST) and the Normalised Difference Vegetation Index (NDVI) values as indicators of ground thermal conditions and ‘greenness’ (i.e., vegetation cover) across ascending altitudes in Jotunheimen.
Satellite-derived NDVI has previously been successfully used in detecting the increased cover and stature of shrubs in the Arctic tundra (Silapaswan et al., 2001), high-latitude tree line composition (Olthof and Pouliot, 2010) and alpine tree line dynamics (Brown, 2013; Franke et al., 2019; Luo and Dai, 2013; Mathisen et al., 2014; Zhang et al., 2009). Following this lead, we use the mean growing season (April–September) NDVI as an indicator of the altitudinal tree line in our study area.
Although there is currently no universal remote-sensing method to accurately assess the presence of sub-surface permafrost or its thermal state (Obu et al., 2019), it is known that permafrost is controlled by both ground- and surface temperatures (Muster et al., 2015), and LSTs have increasingly been used in permafrost modelling (Langer et al., 2010; Westermann et al., 2011, 2012). MODIS LSTs provide a high accuracy in permafrost tundra landscapes (Wan et al., 2004; Westermann et al., 2011) with a slight cold bias (i.e., underestimation of temperature) of −1.1°C reported by Muster et al. (2015). To eliminate this cold bias that is often stronger in the winter (Muster et al., 2015), we explored the applicability of growing season LSTs to delineating permafrost distribution in Jotunheimen by identifying the areas where mean growing season LSTs remain below 0°C.
Finally, combining observed LST and NDVI with observed air temperatures from a regional meteorological station allows us to model the satellite data back to the 1950s. This approach is able to capture and identify seasonal, inter-annual and decadal changes in thermal and vegetational trends over a wider spatial scale, and contributes to the existing field-based research conducted in the region. Using an altitudinal transect on Galdhøpiggen for reference, we aim to identify the altitudes and vegetation zones that have been most vulnerable to surface warming or experienced the greatest change in vegetation cover in the study area.
II Study site
The study area (Figure 1) covers approximately 3780 km2 of the mountainous NE Jotunheimen, Norway between the latitudes of 61°25’N and 61°99’N and longitudes of 7°91’E and 8°70’E. The area encompasses several valleys (as low-lying as 60 m a.s.l.) and massifs, including the two highest peaks in northern Europe, Galdhøpiggen (2469 m a.s.l.) and Glittertind (2465 m a.s.l.). (a) A map of the full extent of the study area in Jotunheimen, Norway, (b) close-up of Galdhøpiggen. The circles represent a north to south altitudinal transect from 600 m a.s.l. to 1950 m a.s.l. Maps reproduced and modified with permission from MapTiler (2021).
Due to the large variation in elevations across the study area, climatic conditions vary considerably. The mean annual air temperatures (MAAT) for the normal period of 1961–1990 range from 0 to 4°C in the valleys in the north (c. 400 m a.s.l.) to below −6°C at higher elevations (≥1600 m a.s.l.) (Norwegian Meteorological Institute, 2021). Southern Norway is influenced by mild air flows from the Atlantic Ocean, which ensures that temperatures below −30°C, even at higher elevations, are rare (Farbrot et al., 2011). The annual precipitation for the same period ranges from 500 to 700 mm in the valleys to 1500–2000 mm at high elevations such as Galdhøpiggen.
Several studies have attempted to delineate the lower limit of permafrost on the slope of Galdhøpiggen through direct approaches, such as ground temperature measurements from boreholes (Etzelmüller et al., 2020; Hipp et al., 2012; Lilleøren et al., 2012), and indirect approaches, like measuring the bottom temperature of snow (Hauck et al., 2004; Isaksen et al., 2002) or using electrical resistivity tomography (Isaksen et al., 2002, 2011). The proposed lower limits range from 1410 to 1500 m a.s.l. (Hauck et al., 2004; Ødegård et al., 1996). Taking into account that the most recent measurements are a decade old, we here assign 1450 m a.s.l. as the lower limit of permafrost, as it also represents the mid-point of the suggested range. However, locating the exact position of this limit remains a challenge due to discontinuous permafrost typically occurring in patches.
Vegetation cover and permafrost presence across an altitudinal transect on Galdhøpiggen based on Robbins and Matthews (2014) and Farbrot et al. (2011). Each altitude corresponds to an individual pixel on the satellite image.

III Methodology
3.1 Data acquisition
Land Surface Temperature (LST) data for the study area were derived from the Moderate Resolution Imaging Spectrometer (MODIS) aboard NASA’s Aqua satellite. The dataset comprises 8-day composites of night-time and day-time spatial measurements of land surface temperatures at 1-km resolution, covering the period January 2003–December 2019. MODIS Normalised Difference Vegetation Index (NDVI) data were obtained for the same area for the period January 2001–December 2017. The data consists of 16-day composites of spatial estimates of NDVI values at 250 m resolution. NDVI is the normalised difference ratio between the red reflectance (MODIS band 1) and near infrared (NIR) reflectance (MODIS band 2) and is calculated for every pixel as follows: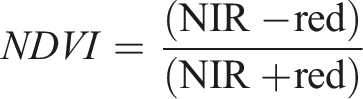
Meteorological records for three nearby stations, Brata-Slettom (61°90’ N 7°90’ E, 664 m a.s.l.), Fokstua (62°11’N 9°28’E, 952 m a.s.l.) and Sognefjellshytta (61°60’N 7°99’E, 1413 m a.s.l.), were accessed through the Global Historical Climate Network (NOAA, 2020).
Fokstua meteorological station provided the most consistent record of daily resolution air temperature data from 1957 to present. To match the meteorological and the LST data, 8-day average maximum (T max ), minimum (T min ) and daily mean (T day ) air temperatures were calculated for the period 1957–2019. Any missing values in the Fokstua dataset were approximated by using the data from either Sognefjellhytta or Brata-Slettom stations and applying a temperature lapse rate of 0.42°C/100 m (Isaksen et al., 2002). The same temperature lapse rate was also used to estimate air temperatures at various altitudes on Galdhøpiggen, based on the data from Fokstua station.
To investigate seasonal trends, each year was divided into two seasons. The ‘growing season’ is defined here as the period between 1 April and 30 September, and ‘winter’ covers the period between 1 October and 31 March. Growing season LST (LST gs ) and NDVI (NDVI gs ) refer to the mean April–September temperature and NDVI values at the pixel level.
All processing of MODIS data, satellite image analysis and statistical analysis were performed in R 4.0.3 (R Core Team, 2020). Packages ‘raster’ and ‘fields’ were used in the image analysis (Hijmans and van Etten, 2012; Nychka et al., 2017). The code used for analysis is outlined in the supplementary material.
3.2 Prediction of missing values in satellite data
Cloud cover in the satellite imagery resulted in a total of 23% of day-time LST data and 8% of night-time LST data being missing. Missing pixel values from used imagery were estimated using the R package ‘gapfill’, which follows the protocol described in Gerber et al. (2018). Gapfill uses both spatial coherence and temporal seasonal regularity to ‘predict’ missing values in spatio-temporal satellite datasets. The method operates by selecting subsets of data surrounding the missing points, ranking the images within subsets using a scoring algorithm and predicting the missing values through quantile regression (see Gerber et al., 2018).
The accuracy of the ‘gapfill’ method was tested in an experiment in which we used a mask to remove a number of randomly distributed pixels with observed values from the original day-time and night-time datasets to generate two artificial datasets. Specifically, we removed 138 pixel values from every sixth image. The prediction process was repeated and the Root Mean Squared Error (RMSE) was returned for both sets of data to approximate the prediction accuracy. We found RMSE values of 2.62 and 2.42 for day-time data and night-time data, respectively.
3.3 Estimation of LSTs from air temperature records
Pixel-level linear regression was performed between the gap-filled satellite-derived mean daily LST data and the measured mean daily air temperature data (Tday) from the three meteorological stations for the period 2003–2019. Daily mean LSTs were calculated by averaging the day-time and night-time observation values for each pixel. Separate pixel-level regressions were employed for day-time satellite images and T
max
, as well as night-time images and T
min
. Correlation coefficients were plotted for individual pixels in the entire study area (Figure 2). It is evident that the highest correlations were found in low- and mid-altitude areas, whereas the lowest correlations can be detected over lakes and mountain peaks. Correlation coefficients (indicated by colour) illustrating the relationship between mean daily land surface temperature values and fitted values for each pixel of the study area.
Employing the Tday air temperature records from Fokstua meteorological station that extend back to 1957, another pixel-level regression was developed to predict the surface temperature as a function of meteorological data. The output comprised a total of 2898 1-km resolution maps of mean daily LSTs covering the period 1957–2019. The analysis was replicated with T max and T min to obtain day-time and night-time LST datasets.
3.4 Estimation of NDVI from LSTs
To ensure that the analysis is focused on the relationship between NDVI and vegetation cover and to avoid exploiting the relationship between NDVI and snow cover, growing season LSTs and NDVI were used. The correlation between the 16-day average NDVIgs and LSTgs was high over vegetated areas (see Figure 3 for correlation coefficients of individual pixels). The NDVI in northern middle- and high latitudes is indeed more strongly related to temperature than precipitation (Ji and Fan, 2019; Los et al., 2001; Tucker et al., 2001), which is why our focus here is on the NDVI-temperature relationship. Correlation coefficients (indicated by colour) illustrating the significance of the relationship between growing season NDVI and growing season land surface temperatures for each pixel of the study area.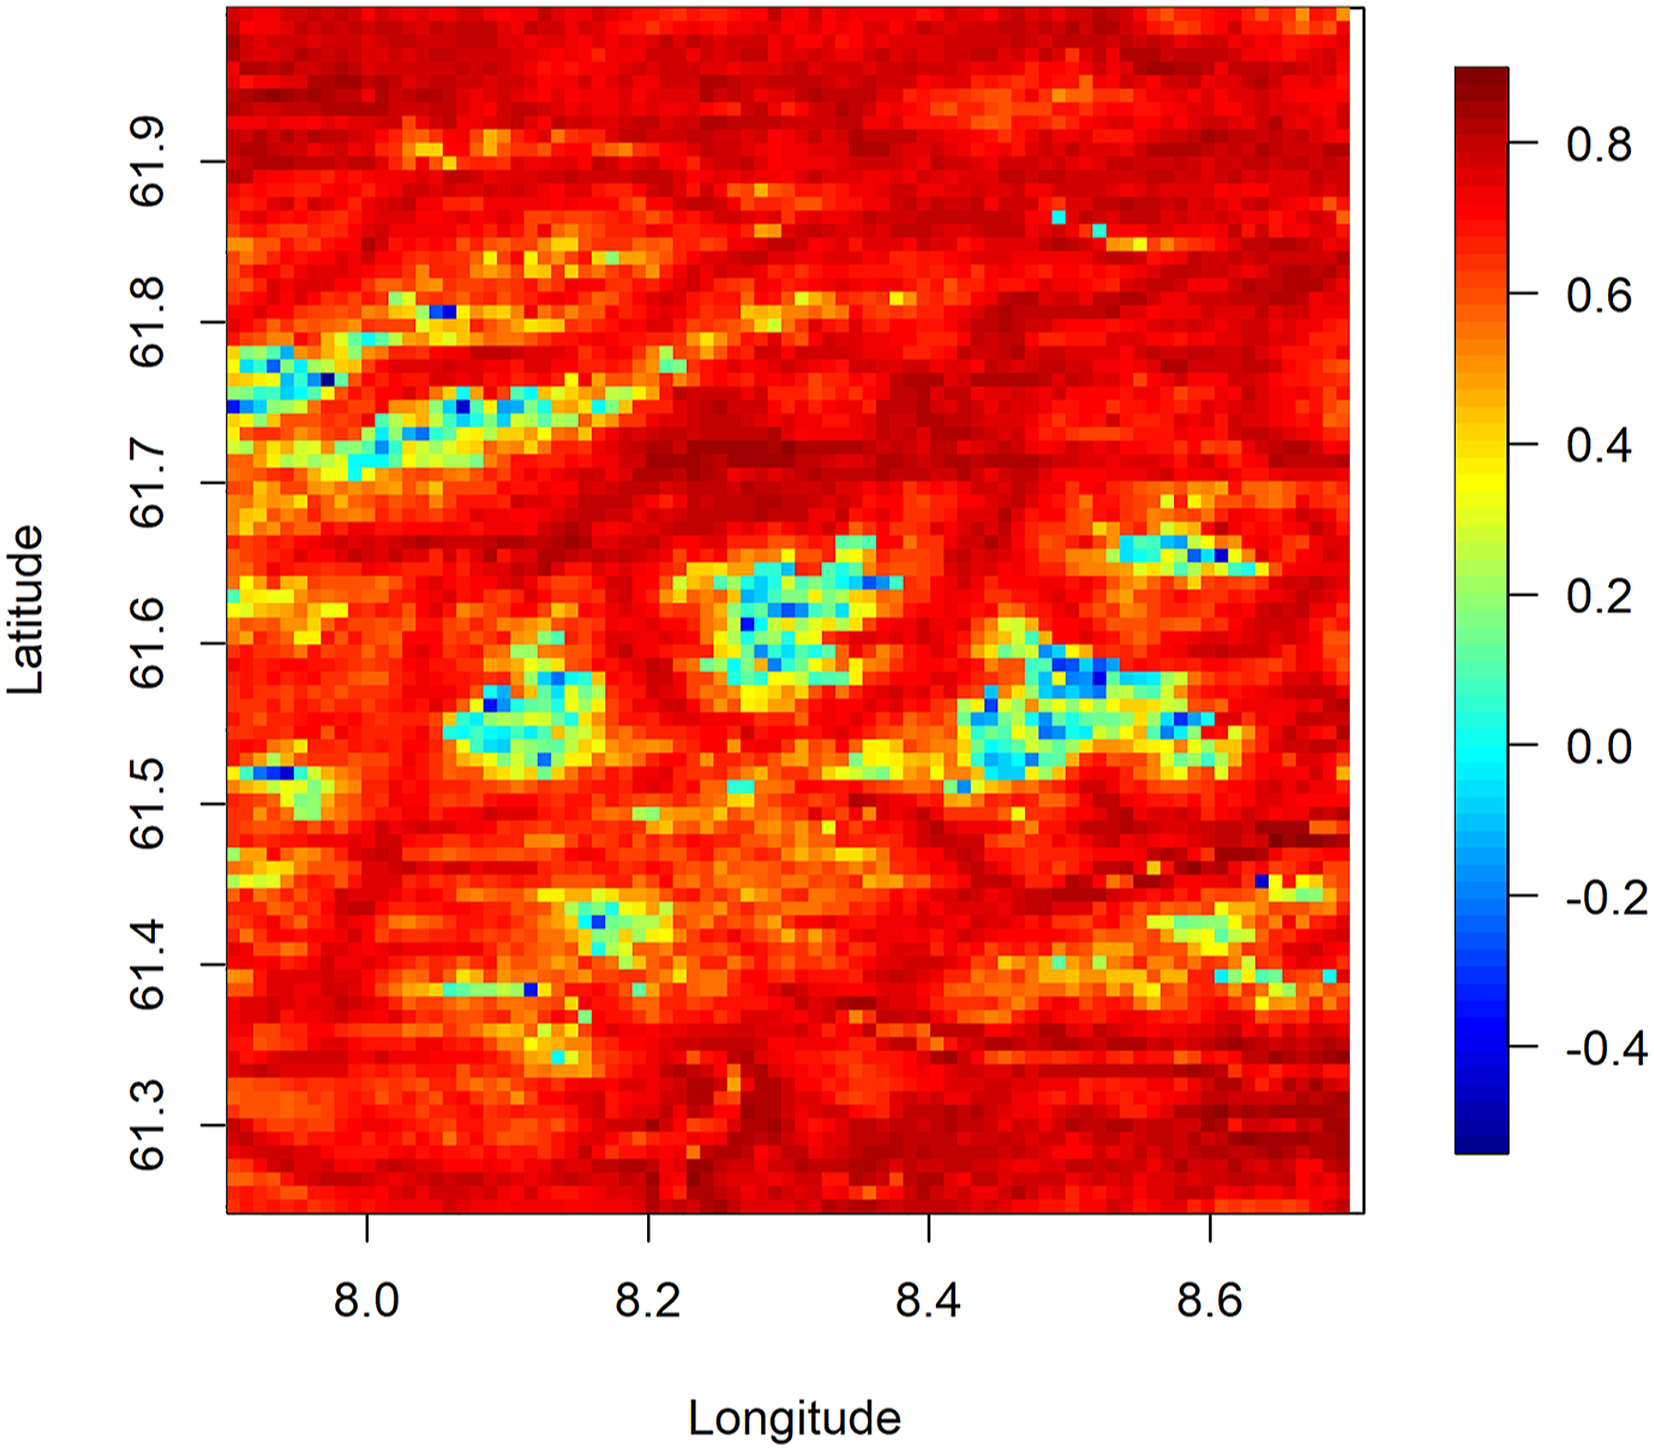
Instead of fitting a single linear regression to describe the relationship, we used segmented regression to estimate pixel-level NDVI from growing season land surface temperatures for the period 1957–2019. This takes into account the non-linear behaviour of the NDVI – temperature relationship in the higher and lower temperature ranges (Figure 4). However, it needs to be noted that this model ignores the influence of human land management, for example, the deforested plots of land used for farming in the valleys. Density plot of the relationship between growing season (April–September) NDVI and land surface temperature (K) for the period 2004–2017 (n = 2,235,324). Colours indicate the number of occurrences of the NDVI-T relationship in an interval; dots show median values. Segmented regression (indicated by grey lines) was used to fit three lines to the curved relationship.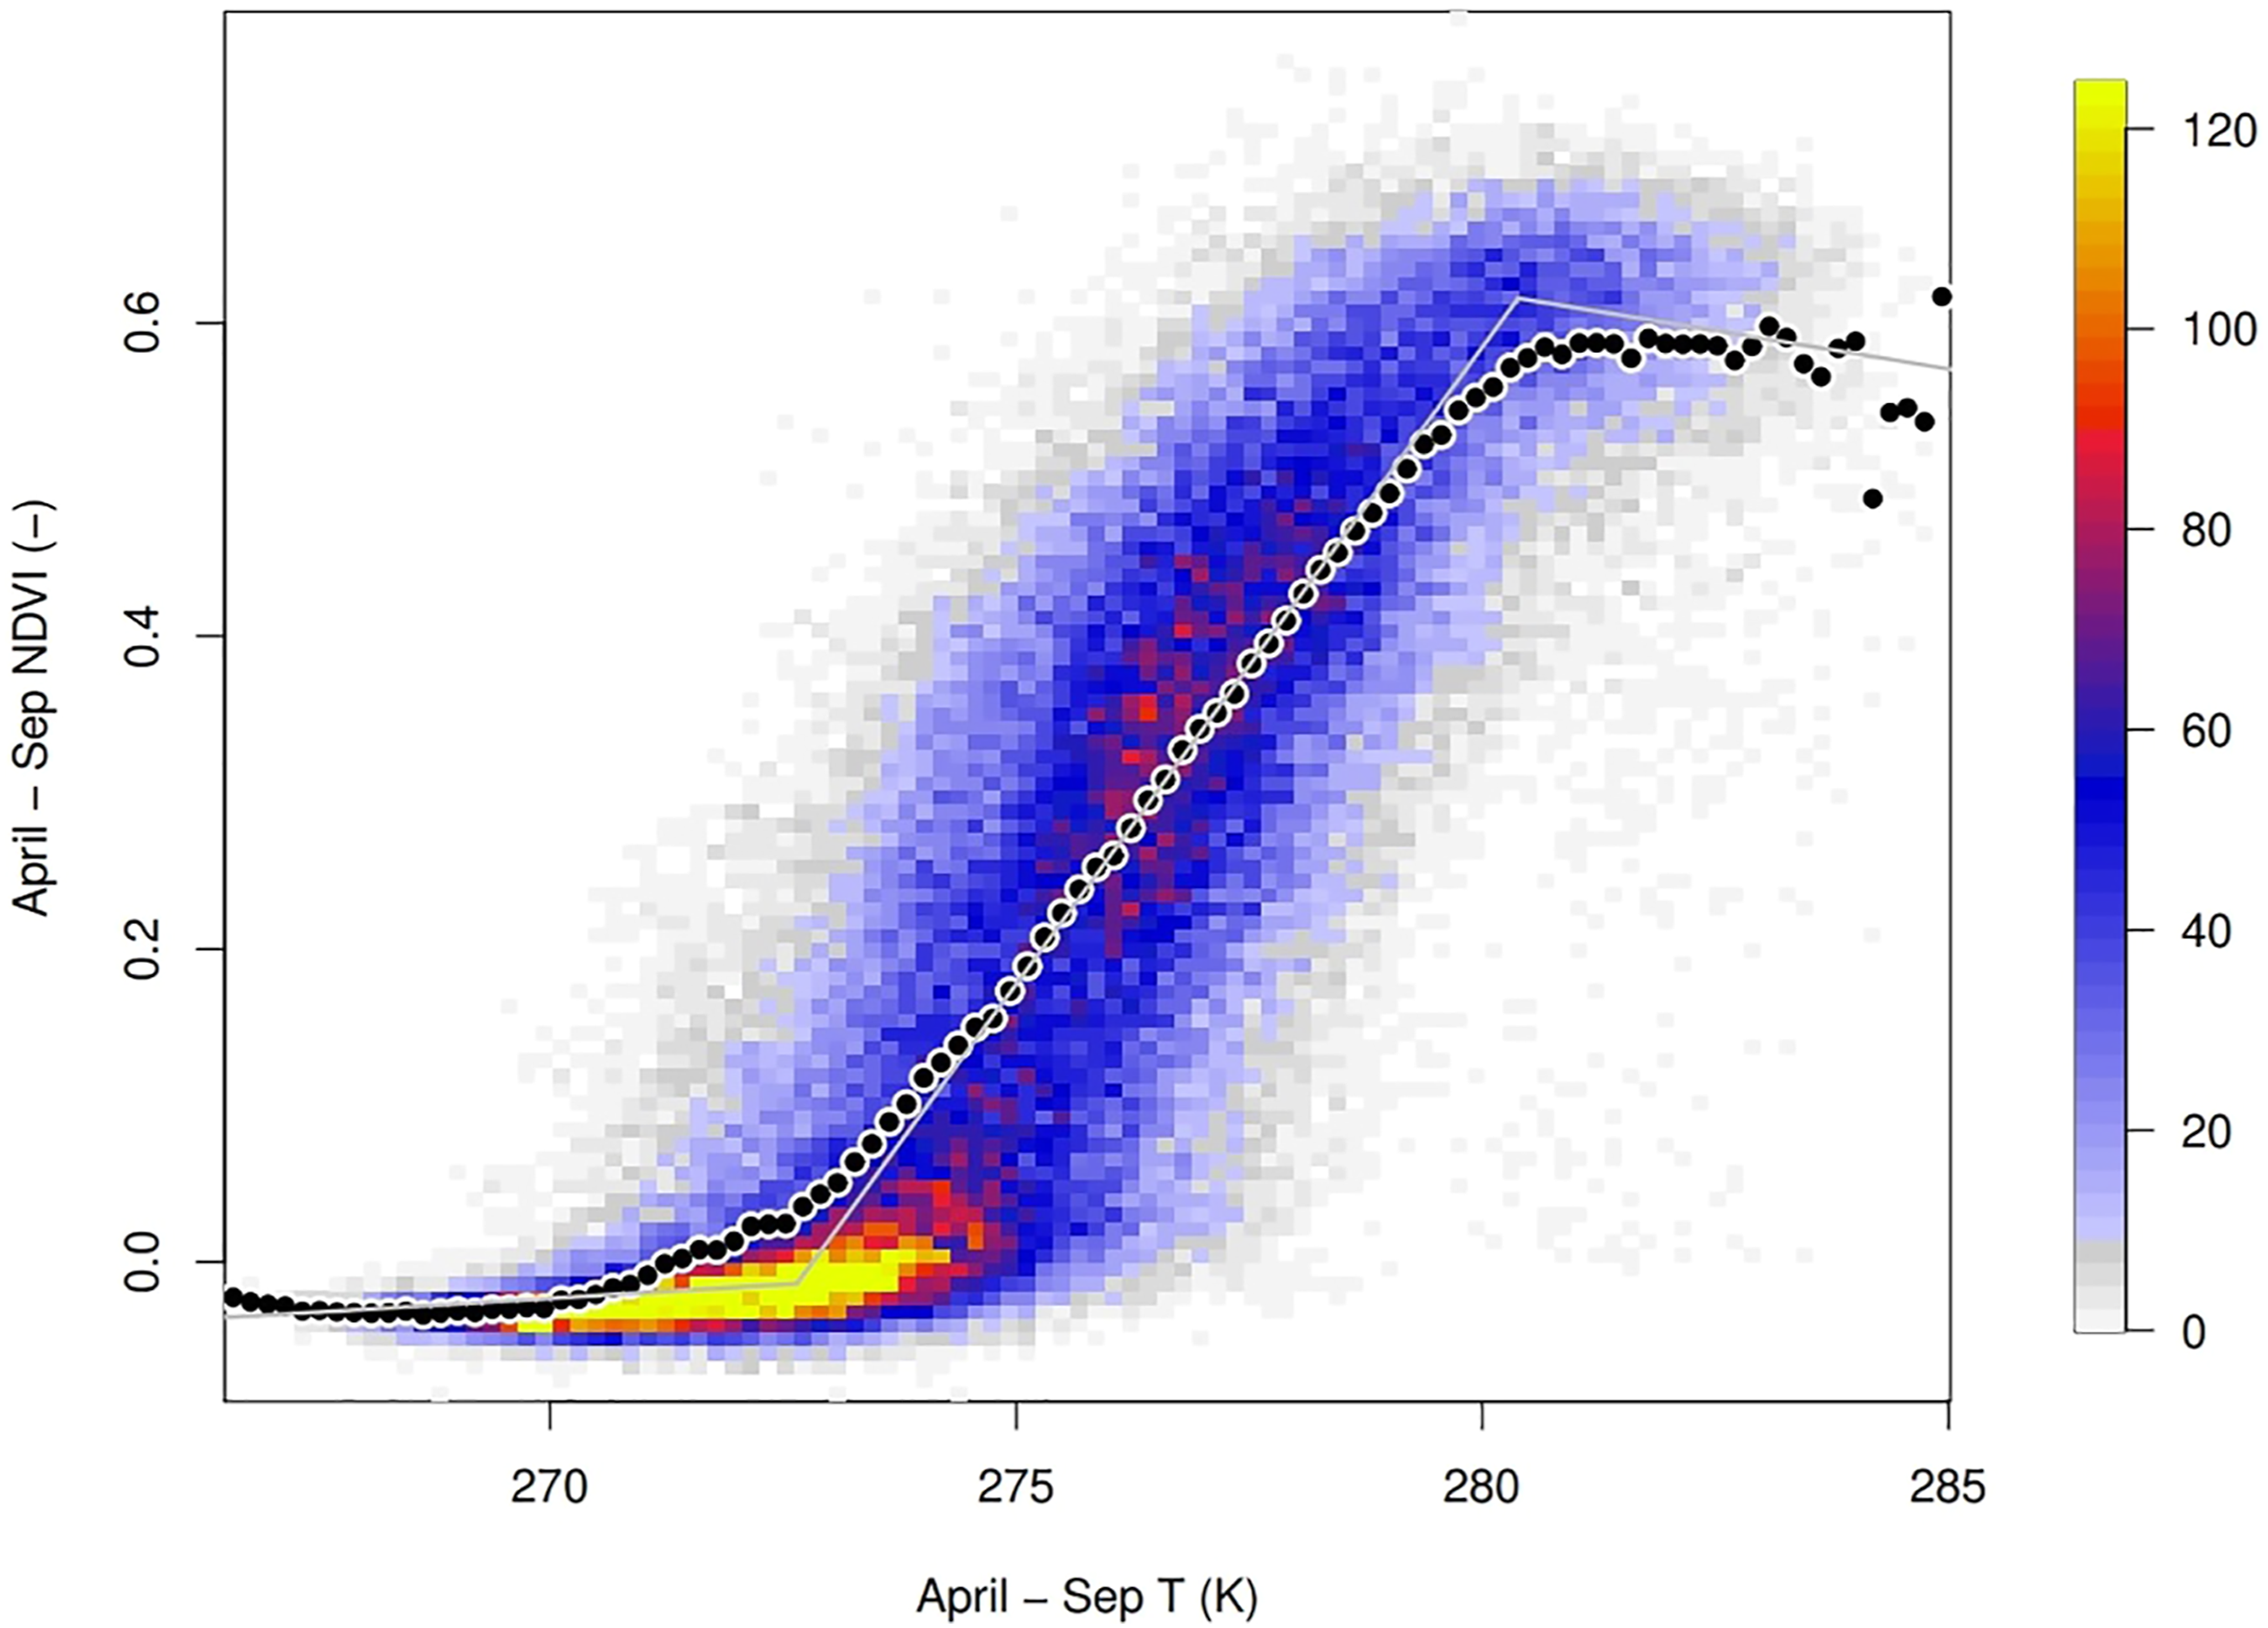
3.5 Altitudinal transect – ground truthing
To create a point of reference linking the satellite data to field conditions, we plotted an altitudinal transect consisting of eight locations corresponding to individual pixels on the north-facing slope of Galdhøpiggen (see Table 1 and Figure 1b). The vegetation composition and permafrost distribution in this area, and particularly along this transect, are well known and outlined in numerous publications (see Study site). Therefore, the transect allows us to explore the spatial trends in satellite-derived LST and NDVI across altitudes whilst being familiar with the conditions on the ground.
Due to the large number of pixels covering the study area (n = 7476), the significance values of the trends presented in Results correspond to a pixel at 1050 m a.s.l. on the Galdhøpiggen transect. However, all trends were plotted for a minimum of 30 pixels across the study area to ensure that the pixel at 1050 m a.s.l. is representative of the trend.
3.6 The use of MAAT and LSTs to delineate permafrost
It has been estimated that permafrost in southern Norway is rarely found on sites with a MAAT above −2°C (Isaksen et al., 2002). Furthermore, it has been proposed that the lower altitudinal limit of permafrost, as estimated from ground temperatures, correlates with a MAAT of −2.5°C on Galdhøpiggen, and with −3.5°C on neighbouring Glittertind (Ødegård et al., 1996). This provides a useful framework for review of our data in the context of permafrost dynamics. Here, we apply a temperature lapse rate of 0.42°C/100 m to calculate the MAAT at 1450 m a.s.l., which is the estimated limit of permafrost on Galdhøpiggen, and examine the changes in MAAT at that altitude over the past six decades.
Additionally, in an attempt to improve the reliability of our inferences, we replaced MAAT with land surface temperatures to determine whether they could be used to identify areas with thermal conditions suitable for permafrost. Permafrost forms where the ground is subject to a negative energy budget, i.e., mean annual LST below 0°C (Ballantyne, 2018). Here, we identify and map the areas where mean annual- and mean growing season LSTs remain below 0°C during the growing season and compare the output to previously published permafrost maps.
3.7 The use of NDVI and LSTs to determine the upper limits of tree lines
NDVI values of 0.6 and above typically indicate the highest possible density of green leaves, i.e., tree cover (Al-doski et al., 2013; Groß et al., 2018). We mapped the observed NDVI (at 250 m resolution) and the modelled NDVI (at 1 km resolution) to provide an estimate of past and present tree cover in our study area, using NDVI ≥ 0.6 as a proxy.
We then tested the applicability of satellite-derived land surface temperatures that indicate suitable growing conditions as another possible proxy indicator of tree cover. Accepted temperature tolerances for the two dominant tree species, B. pubescens and P. sylvestris, were used to map areas suitable for tree growth to make inferences about tree line dynamics in the Jotunheimen area over the past six decades (see Discussion). The output was compared to past and present aerial photographs to determine the accuracy of each method, and the Galdhøpiggen transect was used as reference.
IV Results
During the period 2003–2019, we found no statistically significant trend in observed air temperatures (T max , T min and T day ), nor in the observed daily average (p = 0.8), day-time (p = 0.8) or night-time (p=0.7) LSTs in our study area. The overall fit for the linear model that was used to predict LSTs from observed air temperatures for the period 1957–2019 was R2 = 0.86.
4.1 Warming trends 1957–2019
Observed T max , T min and T day all show a significant warming trend over the period 1957–2019 (p< 0.001, again corresponding to a pixel at 1050 m a.s.l.), and if we directly compare the periods 1957–1976 and 2000–2019. These two periods were selected because 20 years provides a sufficiently long time frame to calculate meaningful averages that can be compared, yet the periods are still far enough apart to allow us to contrast the conditions at the start of the observation period and the most recent two decades. The largest increase in observed air temperatures recorded at Fokstua station (952 m a.s.l.) was found for T min at 1.8°C, but T max also increased by 1.2°C and T day by 1.4°C within the same time frame.
LSTs also increased across all locations in the study area (Figure 5). The increase was statistically significant for day-time, night-time and daily mean temperatures. The mean land surface temperature over the entire NE Jotunheimen study area per decade. The error bars represent the mean day-time values (maximum temperatures) and mean night-time values (minimum temperatures).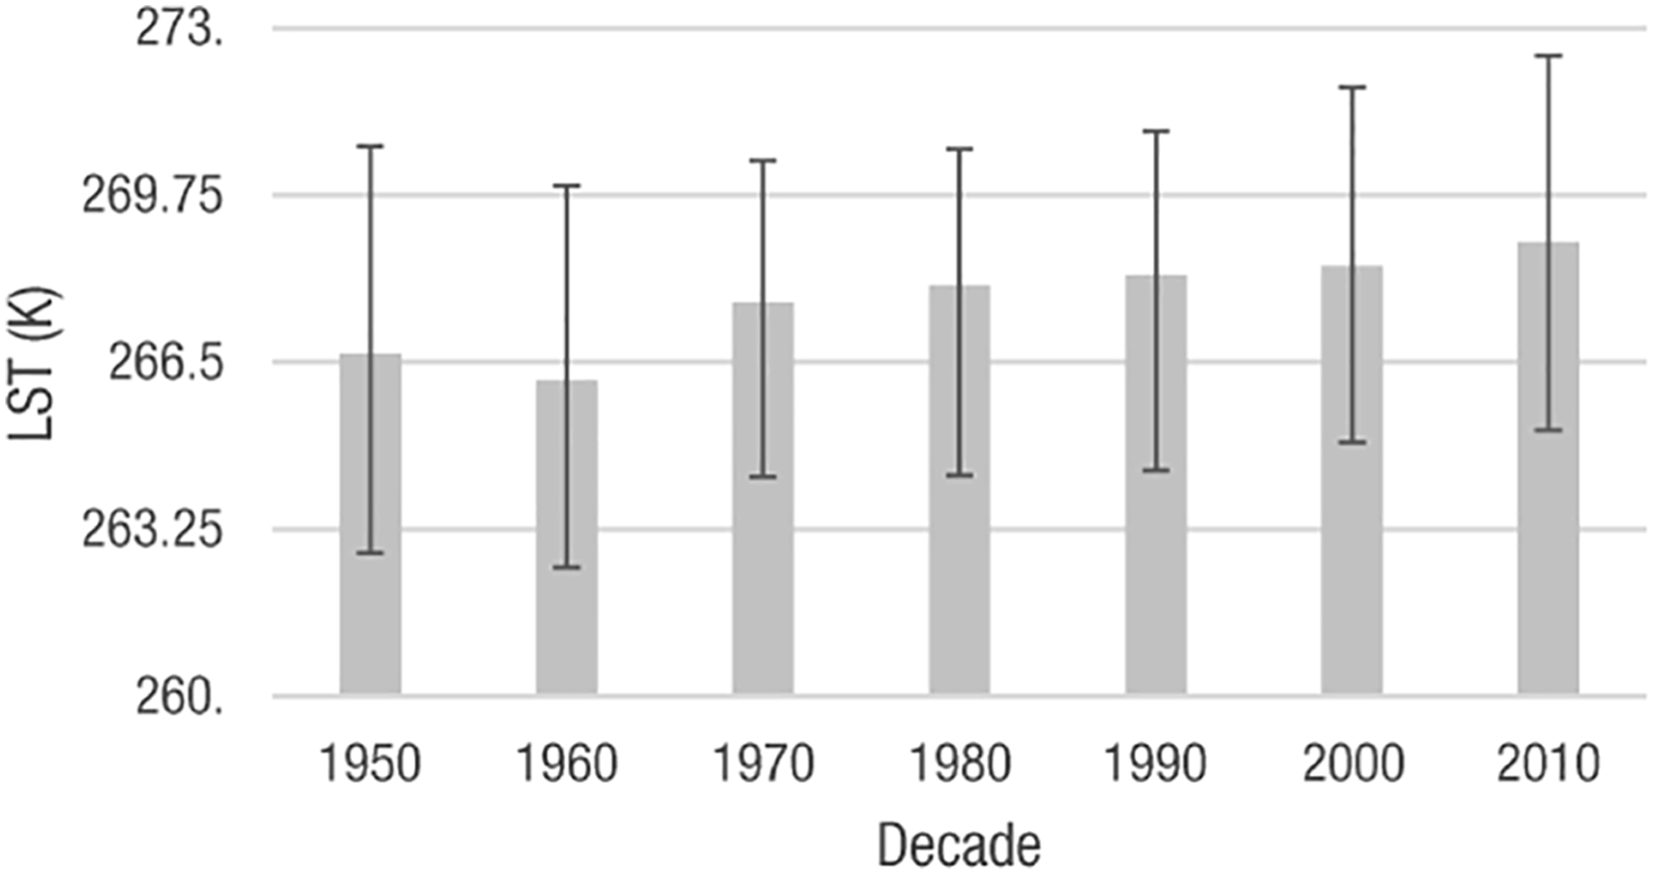
The largest increase in decadal mean LSTs occurred in 1970s, with a steady increase over the two following decades, decelerating from 1990 onwards (Figure 5). Mean daily LSTs increased by 1.2–2°C. The temperature increase was largest in the winter, as daily mean LSTs warmed by 1.8°C at highest altitudes (>1900 m a.s.l.) and by 2.4–2.8°C at mid- and low altitudes; the spatial pattern of temperature increase showed an almost inverse relationship with altitude (Figure 6). Mean winter (October–March) land surface temperatures (K) for the periods (a) 1957–1976 and (b) 2000–2019, and (c) the temperature difference between the two periods. Circles indicate the altitudinal transect on Galdhøpiggen.
Across the Galdhøpiggen transect, the highest annual mean LST increases (by ∼1.8°C) and LST
gs
increases (by ∼1.2°C) were recorded at 600 m a.s.l. and 1550 m a.s.l. (Figure 7). Over the whole area, LST
gs
increased by approximately 0.8°C at the highest, snow-covered peaks, and by 1.4°C in the valleys (Figure 9a). The differences between mean growing season land surface temperatures and mean growing season NDVI between the periods 1957–1976 and 2000–2019 at descending altitudes across the Galdhøpiggen altitudinal transect.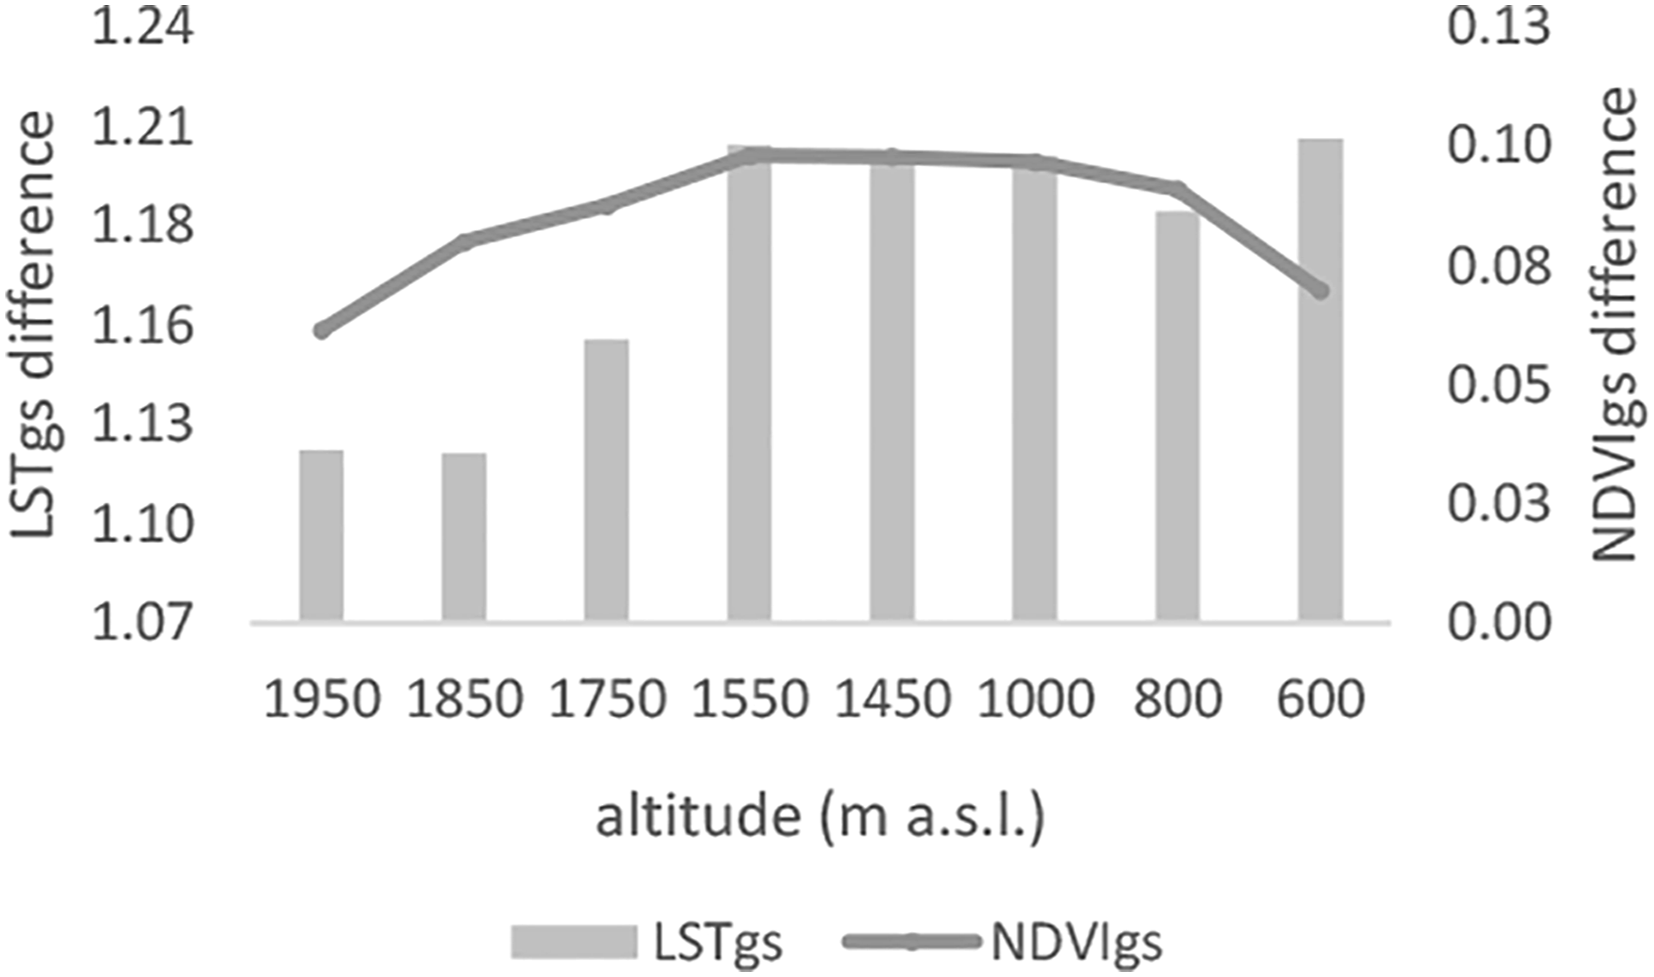
Satellite-derived LSTs were consistently lower than observed air temperatures. For example, at the present-day lower limit of permafrost (1450 m a.s.l.) on Galdhøpiggen, the calculated MAAT has largely remained above −2°C since at least 1990, apart from a few, what could be considered anomalous years (Figure 8a). However, mapping the observed mean annual LSTs above −2°C for the period 2009–2019 revealed that surface temperatures at this altitude were significantly lower (Figure 8b), with a mean of −4.2°C. (a) MAAT (°C) at 1450 m a.s.l. calculated from observed temperatures from Fokstua meteorological station. (b) Mean annual land surface temperatures (K) above −2°C (271.15 K) for the period 2000–2019. The circle indicates the altitude of the estimated present-day lower limit of permafrost (1450 m a.s.l.).
However, the mean difference between LST and air temperature varies across altitudes and seasons. At 1450 m a.s.l, the mean difference between MAAT and LST was 2.5°C for the period 1957–2019. However, the mean difference is reduced to just 0.2°C during the growing season (see supplementary material). Spatially, the temperature difference during the growing season is smallest at altitudes around 1450–1550 m a.s.l. (0.2–0.8°C), but increases towards the higher altitudes (up to 2°C at 1950 m a.s.l.) as well as lower altitudes (1.2°C at 1050 m a.s.l.).
Annual mean LST and LST gs both increase with decreasing elevation (LSTgs values shown in Figure 7), and the range of temperatures follows the same pattern. The mean LST gs over a wooded area at 600 m a.s.l. on the Galdhøpiggen transect was 6.4 ± 1.06°C, whereas at the predominantly bare landscape at 1950 m a.s.l., the mean temperature was −0.1 ± 0.98°C. Two examples of mapping the tree lines using LSTs are illustrated in Figure 14.
4.2 Trends in growing-season NDVI
NDVIgs values predicted by the model showed a statistically significant increasing trend between the periods 1957–1976 and 2000–2019. Across most of the vegetated study area, NDVI
gs
increased by 0.06–0.1; the spatial patterns of NDVI
gs
increase are illustrated in Figure 9b. On the Galdhøpiggen transect, the increase was most significant at altitudes between 1050 and 1550 m a.s.l. (Figures 9b and 10b; NDVI= 0.1, p <0.001), which are directly above the tree line and are dominated by dwarf shrub- and grass heaths. The observed NDVI
gs
(2001–2017) was found to have a much lower year-to-year variability than the modelled NDVI
gs
(1957–2019), suggesting that the model overestimates NDVI sensitivity. (a) Difference in mean growing season land surface temperatures (°C) and (b) difference in mean growing season NDVI values between the periods 1957–1976 and 2000–2019. Circles indicate the altitudinal transect on Galdhøpiggen. (a) Standard deviation of observed growing season land surface temperatures at 1-km resolution and (b) Standard deviation of observed growing season NDVI at 250m resolution over the period 2001–2017. Circles indicate the altitudinal transect on Galdhøpiggen.

Similar to the LST trend, NDVI
gs
is highest at lowest elevations (see Figure 11). Mean predicted NDVI
gs
during the period 1957–2019 was 0.04 at 1950 m a.s.l., increasing up to 0.5 at 600 m a.s.l. on the Galdhøpiggen transect (see Table 1). However, whilst the standard deviation of LST
gs
also increases linearly with decreasing altitude, the standard deviation of NDVI
gs
values peaks at altitudes between 1050 and 550 m a.s.l., as demonstrated by the altitudinal transect in Figure 10b. During the observation period (2003–2017), there was no statistically significant trend in overall observed NDVI (p=0.9) or NDVI
gs
(p=0.4) across altitudes (both p-values correspond to a site at 1050 m a.s.l.). Observed mean growing season NDVI between 0.2 and 0.6 for the period 2001–2017 at 250 m resolution. NDVI values between 0.2 and 0.4 correspond to areas with sparse vegetation and NDVI of 0.4–0.6 indicates moderate vegetation cover. Areas with NDVI <0.2 and >0.6 are covered in white.
V Discussion
5.1 Long-term warming trend
Analysis of observed MODIS LST and air temperature data revealed a slight positive trend in air- and surface temperatures over 17 years (2003–2019), but the trend is not statistically significant at any altitude. The observed mean annual NDVI and mean NDVI gs also show an insignificant trend across altitudes over the period 2001–2017 (this trend is positive at altitudes 1050–1550 m a.s.l., but negative at altitudes above and below this range). However, as NDVI generally responds positively to increasing temperatures (particularly growing season temperatures) in tundra environments (Blok et al., 2011; Cui and Shi, 2010; Raynolds et al., 2008; Walker et al., 2003), we should not expect a strong increase in NDVI during the period given insignificant increases in temperature.
Over the long term (1957–2019), however, modelled LSTs and NDVI reveal significant increases in both temperature and ‘greenness’ in Jotunheimen. The observed mean daily air temperatures and modelled mean LSTs over the period 2000–2019 were 1.4°C and 1.2–2°C higher than during the period 1957–1976. Simultaneously, the mean number of days per year with air temperature above 0°C at 1050 m a.s.l. increased by ∼12 days between the two periods (see supplementary material). The air temperature-and ground surface warming trend over the past decades is in line with other studies (e.g., Etzelmüller et al., 2020), some of which specifically investigate permafrost degradation in response to warming air temperatures (Hipp et al., 2012; Isaksen et al., 2007, 2011). On Galdhøpiggen, Hipp et al. (2012) predict a rise of the lower limit of permafrost from the present-day limit at 1450 m a.s.l. to 1800 m a.s.l. by 2100, and the degradation of all permafrost at c. 1560 m a.s.l. before 2050. This prediction is based on a model that follows the moderate A1B emissions scenario (IPCC, 2007), which assumes a future increase in renewable energy sources and a decrease in CO2 emissions. Based on the data from Juvvasshøe borehole (at 1894 m a.s.l., Figure 1), Isaksen et al. (2002) report a ground surface warming of 0.5–1°C over the past decades and had at the time already predicted a similarly rapid rise of the permafrost limit, leading to major changes in periglacial processes. Our results confirm the trends highlighted in the earlier studies and, importantly, demonstrate that mean annual LSTs were 0.14°C higher in 2010–2019 compared to 2000–2009, illustrating that the warming trend is continuing and contributing to permafrost degradation at its lower limits on Galdhøpiggen. Additionally, our results show considerable seasonal and diurnal differences in air- and LST warming trends. In the long term, T min and winter LSTs in Jotunheimen warmed at a higher rate than T max and LST gs.
Our findings for high-altitude environments draw parallels to high-latitude regions, where climatic warming is similarly predicted to be greater in the winter, and wintertime warming events will become more frequent (Bjerke et al., 2011; Callaghan et al., 2010; Kreyling et al., 2019; Stocker et al., 2013). In fact, a pronounced multi-decadal winter air temperature warming in Norway has been reported before (Førland et al., 2000; Isaksen et al., 2002). There is evidence that winter warming accelerates the thermal degradation of permafrost (Zhang et al., 2019), however, the impacts of more rapid winter warming compared to growing season warming largely remain unknown.
5.2 The use of MAAT, LST and LSTgs to infer sub-surface temperature conditions
Our results indicate that the MAAT at the estimated present-day lower limit of permafrost on Galdhøpiggen (1450 m a.s.l.) has largely remained above −2°C since c. 1990 (Figure 8a). Taking the −2°C threshold for permafrost occurrence estimated by Isaksen et al. (2002), this would suggest that over the past decades conditions would have been too warm to sustain permafrost at this altitude. Whilst the calculated MAAT for the period 1957–1976 was indeed −2.5°C, and theoretically sufficiently low to have supported permafrost (cf. Isaksen et al., 2002; Ødegård et al., 1996), the recent warming has resulted in a MAAT of −1.1°C for 2000–2019. Furthermore, the MAAT at 1050 m a.s.l. is nearly a degree higher today compared to the estimation of −0.2°C by Ødegård et al. (1996) over two decades ago. With ongoing warming, the MAAT of −2.5°C is likely restricted to higher elevations on Galdhøpiggen today. However, it has to be noted that our temperature estimate was calculated based on data from a meteorological station c. 60 km from Galdhøpiggen. Air temperature calculations based on rise in elevation assume that temperature increase has been uniform across all altitudes. Whilst air temperature records provide insight of temporal patterns, this method fails to account for spatial differences in the microclimate of the slope, possibly misestimating the air temperature at 1450 m a.s.l.
The large discrepancy of 3.1°C between the MAAT and LSTs at this altitude could also be due to the LSTs being underestimated in the winter, as the surface of the snow cover can be colder than the ground surface underneath it. Moreover, the estimated air temperatures and LSTs match closely during the growing season, but exhibit a 2.5°C difference in mean annual estimates. A strong wintertime cold bias in LST measurements over areas of the Arctic has been reported before (Langer et al., 2010; Westermann et al., 2011, 2012), as clear-sky conditions in the winter allow long-wave radiation emitted by the land surface to escape into the atmosphere, thus cooling the surface.
Figure 8b illustrates the land surface area with mean annual temperature above −2°C, which is entirely constrained with the valleys. The remaining area of the map should, according to Isaksen et al. (2002), therefore be indicative of conditions suitable for permafrost occurrence (≤-2°C). This area extends to lower altitudes below the Galdhøpiggen reference point at 1450 m a.s.l. and covers the majority of the region. Whilst mountain permafrost is indeed widespread in the area, comparing Figure 8b to previously published permafrost maps and measured borehole temperatures (e.g., Farbrot et al., 2011; Lilleøren et al., 2012) suggests that annual mean LSTs overestimate the area suitable for permafrost occurrence in this region.
However, on a large scale, the regions with mean growing season LSTs below 0°C, identified on Figure 12b, are comparable in shape and extent with previously mapped permafrost distribution in Jotunheimen (Gisnås et al., 2017 in Lilleøren et al., 2012; Gisnås et al., 2017), albeit at a lower resolution. However, on closer inspection, both figures (12a and 12b) underestimate the lower limit of permafrost on Galdhøpiggen by about 300–400 m compared to the previously published maps. Nevertheless, at higher altitudes of the slope, the surface with below-freezing LST
gs
borders the reference point at 1850 m a.s.l. in Figure 12a, which corresponds to the continuous permafrost zone above 1800 m a.s.l. (Hipp et al., 2012). Therefore, the LST
gs
below 0°C could be indicative of the continuous permafrost zone rather than the full extent of mountain permafrost in the area. Mean growing season (April-September) land surface temperatures (K) above 0°C for (a) 1957–1976 and (b) 2000–2019. The white areas indicate LSTs below 0°C.
5.3 Spatial variation in LST and NDVI, with highest increases over shrub- and graminoid heaths
The comparison of Figures 12a and 12b highlights the substantial LST gs increase across NE Jotunheimen since 1957, and the visible decrease in the extent of land with LST gs below 0°C. However, the changes have not been uniform across altitudes. At higher altitudes above c. 1700 m a.s.l., both growing season air- and surface temperatures showed lower increases over time as well as lower year-to-year variability (Figure 10). Although LSTs are known to decrease with altitude (Peng et al., 2020), this effect is likely to be enhanced by the higher albedo of the permanent snow cover or bare ground on the highest peaks in the Jotunheimen area (e.g., Galdhøpiggen, Glittertind). A higher proportion of shortwave radiation is reflected back to the atmosphere due to the high albedo of snow and ice (0.80) and the surrounding lichen-dominated alpine heaths (0.26) compared with the lower albedo of vegetation, for example, shrubs (0.12) (Robock, 1980; Aartsma et al., 2020). Throughout the study area, higher altitudes are sparsely vegetated (Figure 11), and mountains like Galdhøpiggen are covered with extensive areas of block field and patterned ground (Isaksen et al., 2001; Winkler et al., 2016). The albedo of barren rock surfaces is 7% higher than that of bare soil in Arctic permafrost landscapes, and bare rocks have been shown to remain about 5°C cooler than the regional mean (Muster et al., 2015). Despite the patterned ground being partially covered by cryptogamic crust, herbaceous plants and even prostrate shrubs at high altitudes (Hallang et al., 2020; Matthews et al., 2018), the vegetation cover is too sparse to be detected by low spatial resolution satellites. It is evident from Figure 11 that the highest altitudes where the NDVI indicates sparse vegetation along the Galdhøpiggen transect, remain below c. 1800 m a.s.l. (NDVI ≥0.2). It may therefore be expected that the land surface at high altitudes will warm less during the growing season than more vegetated surfaces with a lower albedo (at lower altitudes), resulting in a lower range of recorded temperatures.
We found little change in the modelled NDVI gs values over the past six decades at higher altitudes (>1700 m a.s.l.). This is easily explained by the scarcity of green vegetation, but we also recorded little change at the lowest altitudes in the valleys (600–800 m a.s.l.) (Figure 9). It is important to note here that the modelled NDVI is derived from the spatial variation of LSTs with NDVI, and an assumption is made that this corresponds to long-term temporal variation.
From old aerial photographs (Kartverket, 2021), it is clear that a mature woodland was already established in the valleys in the late 1950s, which explains why any increase in NDVI (i.e., indicating the densification of the woodland) would be less pronounced here than over areas above the tree line (1050–1550 m a.s.l.), where vegetation is becoming more abundantly established on previously sparsely vegetated surfaces. Thus, the surface albedo at highest and lowest altitudes in NE Jotunheimen has probably remained stable over this period.
The highest increases in modelled NDVI gs occur in the low alpine dwarf shrub-heath and the grass- and lichen dominated mid-alpine vegetation zones (Matthews et al., 2018), which are thought to reflect increased shrubification at the expense of non-vascular plants: deciduous shrubs have larger canopy leaf areas and shrub communities tend to have higher NDVI than other tundra species (Boelman et al., 2011; Street et al., 2007; Walker et al., 2003). Moreover, NDVI increases are likely to occur near boundaries between graminoid and shrub communities and shrub and forest communities, as such transition zones often respond rapidly to warming (Epstein et al., 2004; Raynolds et al., 2008). Based on the classification in Raynolds et al. (2008), our NDVI gs values directly above the tree line (1050 m a.s.l.), provide evidence for a shift from dwarf shrub tundra (NDVI gs = 0.36) in 1957–1976 to low shrub tundra (NDVI gs = 0.45) in 2000–2019. However, it must be noted that individual pixels cover 1 km2 of the area, making it difficult to pinpoint the type of vegetation cover responsible for the increase. Nevertheless, the trend is indicating the increase in vegetation cover and/or abundance at this altitude.
Although the increase in LST gs with decreasing altitude on the Galdhøpiggen transect is arguably more linear compared to the increase in NDVIgs (Figure 7), we also detect a large increase in LST gs (by 1.2°C) in mid-range altitudes (1050–1500 m a.s.l.). This can also be explained by the decrease in surface albedo driven by increased shrubification. The lower albedo of shrub-covered ground compared to graminoid- or lichen tundra (Juszak et al., 2014), leads to surface heating through the absorption of a larger proportion of incoming solar radiation. The high values of both NDVI gs and LST gs at the mid-range elevations above the tree line are therefore most likely caused by increased vegetation cover since 1957.
Moreover, increasing ground- and near-surface temperatures further facilitate the encroachment of shrubs in mountainous regions (Anthelme et al., 2007; Dullinger et al., 2003; Hallinger et al., 2010), creating a positive feedback loop. Additionally, increased shrub cover can alter local and regional carbon- and nutrient cycles (Cahoon et al., 2012; Chapin et al., 2005; Frost et al., 2019; Pearson et al., 2013). In Jotunheimen, shrub encroachment at higher altitudes (on Galdhøpiggen) is predicted to result in increased CO2 efflux from the ground (Hallang et al., 2020).
5.4 The applicability of growing season NDVI for monitoring alpine tree dynamics
Figure 13 highlights the areas with mean NDVI
gs
of ≥0.6, indicating dense vegetation. The altitudinal limit of this mapped area on Galdhøpiggen corresponds very closely to the upper limit of the dense, pine-birch woodland (cf. Figure 1). Observed mean growing season NDVI above 0.6 for periods (a) 2001–2009 and (b) 2010–2017. Only the areas with NDVIgs ≥ 0.6 (i.e., tree cover) are shown. The red circle indicates the present-day tree line on Galdhøpiggen at 1050 m a.s.l.
Evidence from aerial photographs (Kartverket, 2021) suggests that sparse stands of Betula pubescens reach altitudes of 1150 m a.s.l. on this particular site (Hallang et al., 2020); however, the NDVI of these stands appears to remain below 0.6. Nevertheless, the mean modelled NDVI gs at 1050 m a.s.l. has experienced one of the highest increases along the transect, from a mean of 0.35 in 1957–1976 to a mean of 0.45 in 2000–2019. The mean NDVI gs at this site has even reached the value of 0.6 on four occasions within the last two decades. Correspondingly, the LST maps suggest that the growing season conditions have improved at this altitude over the past 6 decades, becoming more favourable for the growth and expansion of B. pubescens (Figure 14). Therefore, whilst Figure 13 demonstrates no significant expansion of the extent of land with NDVI of ≥0.6 during the past two decades, this could be due to a lag in response, or the inability of the decadal mean NDVI values to pick up on smaller year-to-year changes. This reasoning is substantiated by a study by Zhang et al. (2009) that found no shift in alpine tree lines in NE China over two decades (1977–1999) using satellite-derived NDVI. However, by combining remote sensing with field surveys and using a ratio of NDVI between the birch tree line forest and the adjacent old-growth coniferous forest, they also found an increase in the NDVI ratio of tree line forest against the reference forest, indicating that the birch-dominated tree line forest had grown denser.
Although the observed NDVI of ≥0.6 corresponds closely to the dense mixed woodland in our study area, this value alone fails to identify the upslope advancement of smaller patches of trees, which is detectable on the ground and from aerial photographs (Hallang et al., 2020). The challenge of estimating the positions of tree lines is further complicated by the various definitions of the concept of ‘tree line’ (e.g., Aas, 1969; Kullman, 1990), and the inevitability that trees take time to reach maturity and form denser stands on previously treeless surfaces. Therefore, whilst the upper range of NDVI is a good indicator of mature, dense woodland in this mountainous area, we suggest combining NDVI with other methods like aerial photographs or field surveys to investigate the advancement of alpine tree lines in response to warming.
5.5 The potential of satellite-derived LSTs for estimating the altitudinal limit of the tree line
From previous vegetational studies conducted in central Norway, it has been established that the Pinus sylvestris tree line correlates well with a July mean air temperature of 11°C (Paus, 2010). The mean July LST at the present-day tree line on the Galdhøpiggen transect was 11.3°C over the period 2000–2019. The temperature requirements mapped on Figure 14b therefore match perfectly with the tree line on Galdhøpiggen. However, the 1957–1976 mean July LST (Figure 14a) underestimates the pine tree lines in the area more significantly, as a comparison of the map with aerial images (Kartverket, 2021) shows that pine trees were fully established in the valley and at 1050 m a.s.l. in 1981. Mean July land surface temperatures (K) above 11°C (284.15 K) for (a) 1957–1976 and (b) 2000–2019, and mean June–September land surface temperatures (K) above 7°C (280.15 K) for (c) 1957–1976 and (d) 2000–2019. The circle represents the altitude of the present-day tree line (1050 m a.s.l.).
Birch (B. pubescens) requires minimum summer (June–September) mean air temperatures of 7°C to grow (Nesje and Kvamme, 1991). On Galdhøpiggen, the mapped area of temperatures equal to and above 7°C for the period 2000–2019 covers the present-day birch tree line, which extends up to 1150 m a.s.l. in sparse stands (Figure 14d). In fact, the mean June–September temperature at 1150 m a.s.l. was 8.27°C over the period 2000–2019, suggesting that the minimum summer temperatures required by birch currently extend above their present-day range, and Figure 14d is providing a slight overestimation of the altitude of the birch tree line.
Conversely, the 1957–1976 summer LST averages slightly underestimate the tree line position, particularly on the east-facing slope of Galdhøpiggen (Figure 14c). Although the temperature values used here as a baseline refer to minimum growing season air temperature requirements, it is suggested that growing season LSTs can also be used successfully to locate the areas suitable for birch and pine growth. In this case, however, the 1957–1976 mean LSTs provide a less reliable estimate of the full area suitable for tree growth, likely due to the low temperatures prevailing in the area in the 1960s (Figure 5). Nevertheless, there is potential in using satellite-derived mean LST gs to identify areas suitable for the growth of specific tree species; particularly when the mean is calculated over a larger time span. Although the use of MODIS LSTs alone ignores other factors that control vegetation, such as precipitation, soil chemistry, or availability of habitat, it does have potential to map areas potentially suitable for vegetation expansion in cold environments, where temperature is a dominant driver of growth. Whilst the method does not allow for accurate delineation, it does provide a realistic approximate rate of change over time.
VI Conclusions
Our results demonstrate substantial increases in air- and land surface temperatures in NE Jotunheimen from 1957 to 2019, particularly in winter temperatures (up to 2.4–2.6°C). NDVI also showed an increasing trend (by 0.06–0.1) during the same period (1957–2019). However, these changes have not been spatially uniform.
We detect the highest increases in modelled NDVI gs and LST gs over mid-range altitudes (1050–1500 m a.s.l.) by ∼0.1 and 1.2°C, respectively. We attribute this to increased shrubification, as deciduous shrubs are ‘greener’ than the surrounding tundra and capture more incoming solar radiation to heat the surface. The mid-altitude warming evident from our results confirms that the thermal conditions in the past decade have continued to be suitable for permafrost degradation on Galdhøpiggen (previously reported by Isaksen et al., 2011; Hipp et al., 2012), especially at its lower limits.
We found that MODIS growing season LSTs have potential for identifying the spatial distribution of areas with suitable conditions for continuous sub-surface alpine permafrost. Moreover, mean growing season LSTs also have potential to be used for mapping areas suitable for tree (P. sylvestris and B. pubescens) growth in alpine regions if the mean is estimated over a longer period. MODIS LSTs thus provide an inexpensive, accessible tool with a potential to identify above-surface and below-surface conditions during the growing season based solely on surface thermal properties. However, the 1-km pixel resolution used here can be too coarse to precisely delineate the lower limit of permafrost or record the dynamics of tree lines in alpine regions where climatic and environmental conditions change over short distances. Moreover, MODIS does not provide information on other drivers of vegetation growth that can also affect above- and below ground conditions (e.g., precipitation and soil moisture). For greater accuracy, we suggest combining satellite data with other forms of ground verification in alpine settings.
Supplemental Material
Supplemental Material - Permafrost, thermal conditions and vegetation patterns since the mid-20th century: A remote sensing approach applied to Jotunheimen, Norway
Supplemental Material for Permafrost, thermal conditions and vegetation patterns since the mid-20th century: A remote sensing approach applied to Jotunheimen, Norway by Helen Hallang, Sietse O Los and John F Hiemstra in Progress in Physical Geography: Earth and Environment
Supplemental Material
Supplemental Material - Permafrost, thermal conditions and vegetation patterns since the mid-20th century: A remote sensing approach applied to Jotunheimen, Norway
Supplemental Material for Permafrost, thermal conditions and vegetation patterns since the mid-20th century: A remote sensing approach applied to Jotunheimen, Norway by Helen Hallang, Sietse O Los and John F Hiemstra in Progress in Physical Geography: Earth and Environment
Supplemental Material
Supplemental Material - Permafrost, thermal conditions and vegetation patterns since the mid-20th century: A remote sensing approach applied to Jotunheimen, Norway
Supplemental Material for Permafrost, thermal conditions and vegetation patterns since the mid-20th century: A remote sensing approach applied to Jotunheimen, Norway by Helen Hallang, Sietse O Los and John F Hiemstra in Progress in Physical Geography: Earth and Environment
Supplemental Material
Supplemental Material - Permafrost, thermal conditions and vegetation patterns since the mid-20th century: A remote sensing approach applied to Jotunheimen, Norway
Supplemental Material for Permafrost, thermal conditions and vegetation patterns since the mid-20th century: A remote sensing approach applied to Jotunheimen, Norway by Helen Hallang, Sietse O Los and John F Hiemstra in Progress in Physical Geography: Earth and Environment
Supplemental Material
Supplemental Material - Permafrost, thermal conditions and vegetation patterns since the mid-20th century: A remote sensing approach applied to Jotunheimen, Norway
Supplemental Material for Permafrost, thermal conditions and vegetation patterns since the mid-20th century: A remote sensing approach applied to Jotunheimen, Norway by Helen Hallang, Sietse O Los and John F Hiemstra in Progress in Physical Geography: Earth and Environment
Supplemental Material
Supplemental Material - Permafrost, thermal conditions and vegetation patterns since the mid-20th century: A remote sensing approach applied to Jotunheimen, Norway
Supplemental Material for Permafrost, thermal conditions and vegetation patterns since the mid-20th century: A remote sensing approach applied to Jotunheimen, Norway by Helen Hallang, Sietse O Los and John F Hiemstra in Progress in Physical Geography: Earth and Environment
Footnotes
Acknowledgements
Ground truthing for this project was carried out on the Swansea University Jotunheimen Research Expedition in 2018. We thank John Matthews and an anonymous reviewer for their very helpful comments, and MapTiler for permission to use their image. This paper constitutes Jotunheimen Research Expeditions Contribution No. 223 (see:  ).
).
Declaration of conflicting interests
The authors declared no potential conflicts of interest with respect to the research, authorship, and/or publication of this article.
Funding
The authors received no financial support for the research, authorship, and/or publication of this article.
Supplemental material
Supplemental material for this article is available online.
References
Supplementary Material
Please find the following supplemental material available below.
For Open Access articles published under a Creative Commons License, all supplemental material carries the same license as the article it is associated with.
For non-Open Access articles published, all supplemental material carries a non-exclusive license, and permission requests for re-use of supplemental material or any part of supplemental material shall be sent directly to the copyright owner as specified in the copyright notice associated with the article.
