
Abstract
The prediction accuracy of wind power affects the operation cost of the power grid, which is a direct result of the supply and demand balance of the grid. Therefore, how to improve the prediction accuracy of wind power is very important. Considering the prediction accuracy of current prediction methods is not high, a wind power prediction method based on a hybrid kernel function support vector machine is proposed. On the basis of the exhibited characteristics of different kernel functions, the hybrid kernel function is a linear combination of the radial basis function and the polynomial kernel function. The hybrid kernel function is selected as the kernel function of support vector machine. The global kernel function is used to fit the correlation of the distant sample data, while the partial kernel function is used to fit the correlation of the data in neighboring fields. The generalization performance of the support vector machine model is improved. At the same time, an improved particle swarm optimization algorithm is introduced to determine the optimal parameters of the hybrid kernel function and support vector machine prediction model. Finally, the built prediction model is used to predict the wind power. The simulation results demonstrate that the proposed prediction method has better prediction accuracy for wind power.
Keywords
Introduction
With the continuous consumption of oil energy, the energy crisis is becoming even more serious. Therefore, renewable energy is currently being developed all over the world (Panwar et al., 2011; Stambouli et al., 2012). At present, wind power as a productive and exploitable resource, its application rate in the power grid is gradually increasing. However, due to the randomness and volatility of wind power, especially in large-scale and high-concentration applications, wind power brings great challenges to the overall power grid. If researchers can predict the future wind power, not only can develop an effective power plan in advance but also can effectively prevent serious wind power events by analyzing the future wind power changes. Therefore, the accurate prediction of wind power can ensure stable operation of the power grid, which has great theoretical and practical significance (Ju et al., 2016).
At present, wind power prediction methods can be mainly classified into two types: the physical model and the statistical model (Ouyang et al., 2016). Among them, the physical model uses numerical weather prediction (NWP) results to predict wind speed. The future wind power can be obtained by the actual wind power curve (Chen et al., 2014). The physical prediction model is suitable for medium- and long-term wind power prediction. The physical prediction model requires accurate NWP data and detailed physical information on the area where the wind farm is located. At the same time, NWP data will be updated once every few hours. So, the physical prediction model is more suitable for the future 6 h or more wind power forecast. It is not suitable for short-term wind power prediction. The prediction accuracy of the physical model method relies on a high degree of accuracy and popularity of the NWP data. Meanwhile, the physical model method requires a lot of parameters such as wind speed, wind direction, and air pressure. In many areas, NWP system has not been established. NWP data are affected by the environment and physical factors. These factors greatly limit the prediction accuracy of the physical prediction model of wind power. However, the prediction accuracy of the statistical model in the short-term wind power prediction is higher. Through the training of a large number of historical measured data, the statistical model can find the corresponding relationship between historical input and output (Ott and Longnecker, 2015). The statistical models include time series prediction model (Li et al., 2014; Liu et al., 2016), neural network prediction model (De Aquino et al., 2014; Quan et al., 2014; Wang et al., 2016), Kalman filtering prediction model (Louka et al., 2008; Zuluaga et al., 2012), fuzzy clustering prediction model (Ko, 2016; Yang et al., 2015), and autoregressive moving average (ARMA) prediction model (Wang, 2013). According to the intrinsic statistical characteristics and rules of system development, through the historical data of the past and statistical analyses, time series analysis can further speculate the future development trend of the system. Through the study of time series prediction method, we can understand the structural characteristics of the system (such as the cycle of fluctuations, amplitude, and the type of trends); reveal its operating rules, and then used to predict and control their future behavior. The time series prediction method can grasp the nature of the system to achieve the future prediction. However, time series analysis methods have different prediction results with the different model order. Although the neural network has good robustness, generalization, and fault tolerance ability, its learning convergence speed is slow, easy to fall into local optimal value, and difficult to achieve the global optimal value. Kalman filtering model is difficult to obtain statistical properties of noise. ARMA is only suitable for the prediction of a linear sequence. For wind power with the nonlinear characteristics, the prediction accuracy is difficult to be guaranteed. At the same time, the fuzzy rules in the fuzzy clustering model are too difficult to be determined. Therefore, these prediction methods based on statistical models also have their specific shortcomings.
On the basis of statistical learning theory, support vector machine (SVM) is a new machine learning algorithm; it can improve the generalization ability of the algorithm, effectively solve the high-dimensional problems with small sample and nonlinear characteristics, and provide a new solution for pattern recognition, fault diagnosis, and time series prediction. Many scholars apply SVM model to the prediction of wind power and obtain some excellent research results (Kong et al., 2015; Xiao et al., 2014; Zeng and Qiao, 2012). However, the prediction accuracy of SVM is affected by the selection of type and parameters of the kernel function. At present, there is no clear theory to support the selection of the type and the parameters of the kernel function. In order to solve how to choose the type and the optimal parameters of SVM kernel function, this article proposes a hybrid kernel function. This hybrid kernel function can achieve the global kernel function to fit the correlation between sample distances and the partial kernel function approximation model between adjacent data domains to improve the generalization performance of the prediction method. Because the prediction accuracy is affected by the parameters of kernel function, an improved particle swarm optimization (IPSO) optimization algorithm is introduced to determine the optimal parameters of kernel function. Through the actual field wind power data, the simulation comparison experiment is carried out. The simulation results show that the proposed prediction method has better prediction effect.
The other contents of this article are arranged as follows. Section “SVM with the hybrid kernel function” introduces the hybrid kernel function SVM. Section “IPSO optimization algorithm” introduces an IPSO algorithm with better convergence speed and performance. Section “Wind power prediction model” introduces the wind power prediction method based on the hybrid kernel function SVM. The simulation results are provided in section “Simulation.” The summary and prospects of this article are summarized in section “Conclusion.”
SVM with the hybrid kernel function
SVM has good sparsity and generalization ability and can solve the realistic problems with nonlinear, small sample, local minimum, and high dimension. Some scholars point out that the performance of SVM is better than the traditional neural network algorithm.
Assuming that the nonlinear regression function can be expressed as

then, the optimization problem can be expressed as

Constraint conditions are
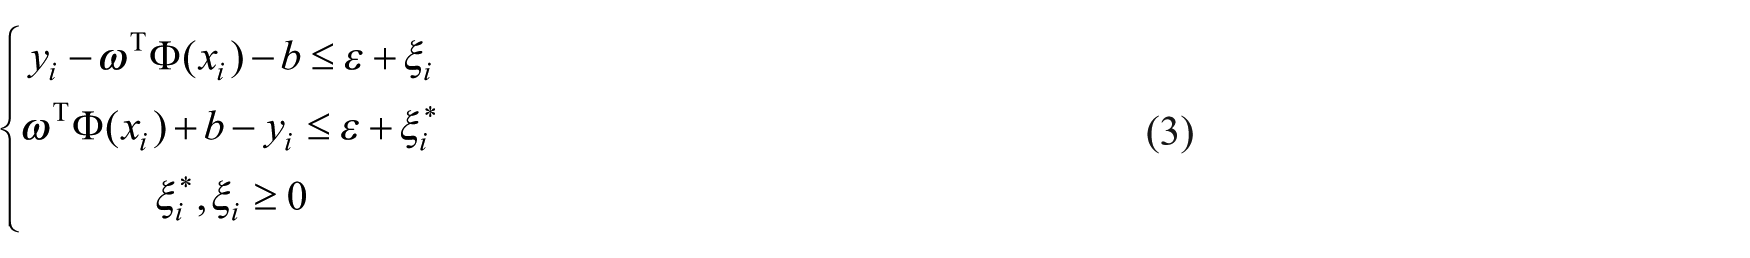
where


where
The Lagrange function is introduced to obtain the following minimum value

Constraint conditions are
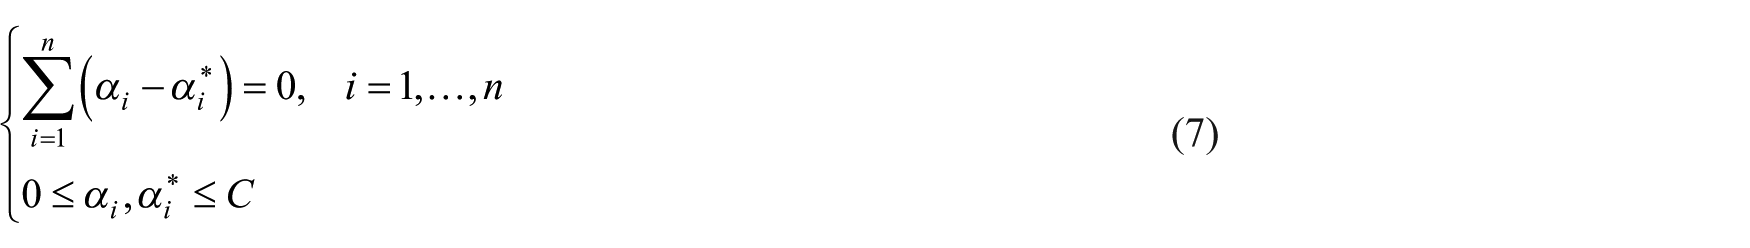
where


In the literature (Smits and Jordaan, 2002), the author points out that the polynomial kernel function is a global kernel function with global characteristics and good generalization ability. The sample point far away from the test point will also affect the output of the kernel function. As a kind of partial kernel function, the parameters
This article uses the following equation to construct a new kernel function

where
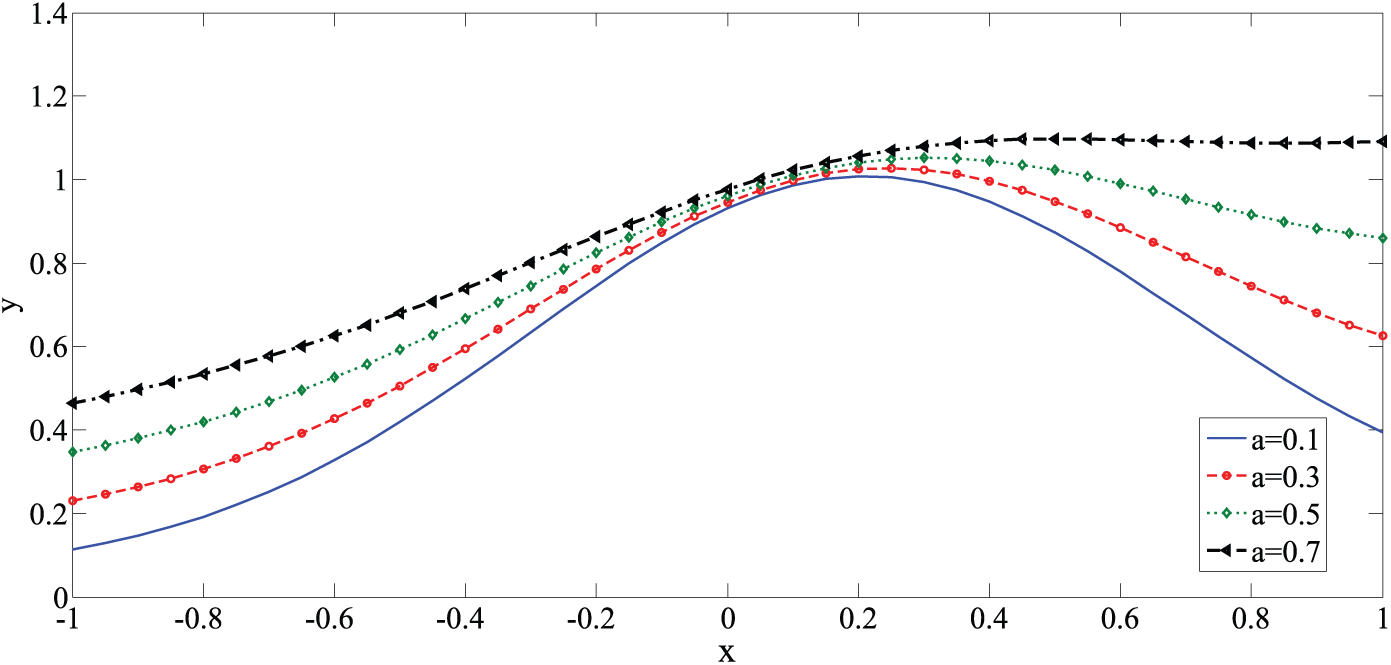
Characteristic curve of the hybrid kernel function with different
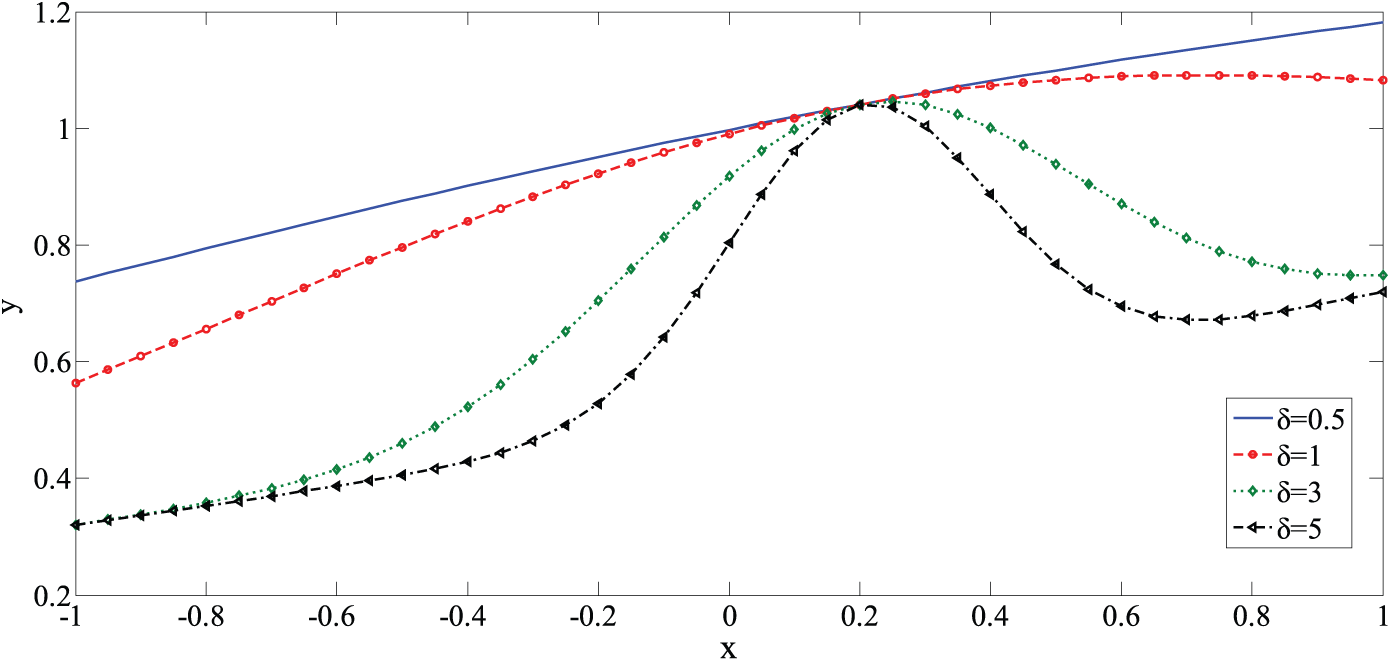
Characteristic curve of the hybrid kernel function with different
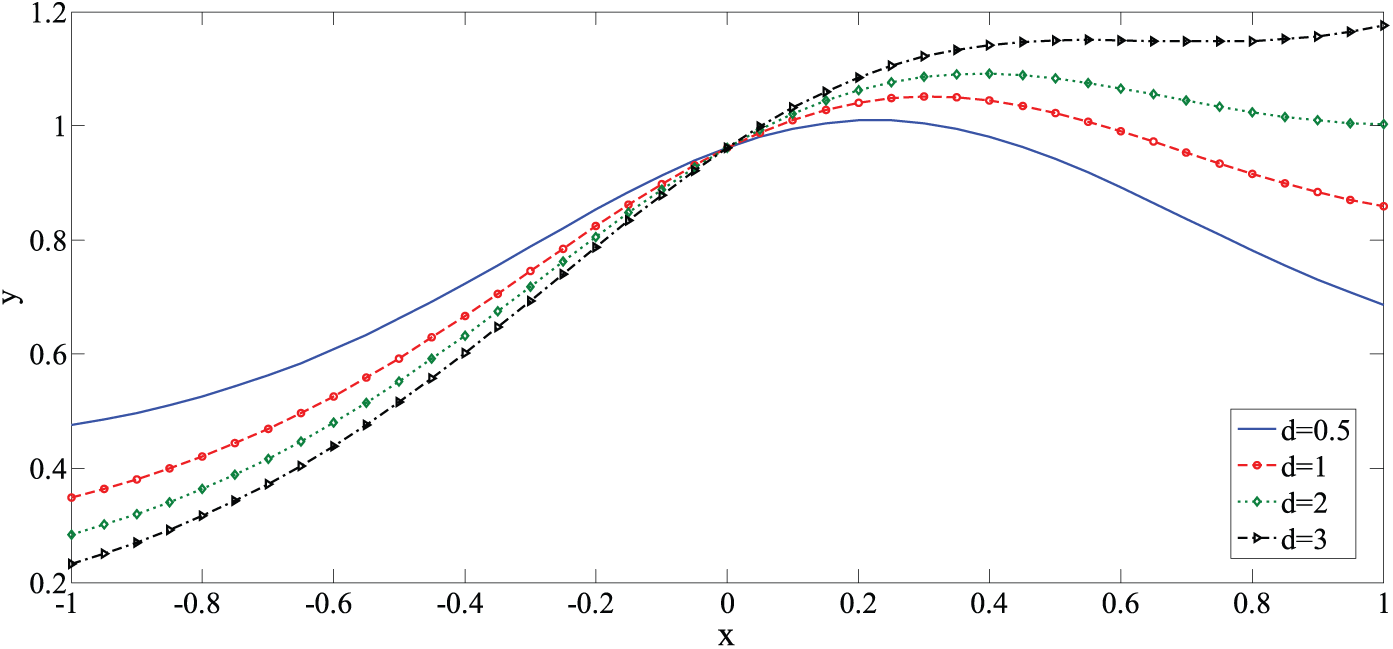
Characteristic curve of the hybrid kernel function with different
It can be observed from Figures 1 to 3 that the hybrid kernel function combines the global properties of the polynomial kernel function and the partial properties of the RBF kernel function and achieves better generalization ability. In the hybrid kernel function, each parameter has an impact on the ability of SVM. These parameters are interrelated and affected by each other. These parameters include
IPSO optimization algorithm
As a new evolutionary computation algorithm, PSO algorithm is proposed by Eberhart and Kennedy (1995). PSO algorithm is simple and easy to implement. It has been widely applied into many practical optimization problems (Banerjee et al., 2016; Taghiyeh and Xu, 2016; Wu et al., 2016). The convergence speed of the standard PSO algorithm is fast, but it is difficult to reach better performance when global and local search is conflicted. When the algorithm is iterated to a certain number of times, the movement of the particles tends to be the same, and the population diversity decreases, resulting in a slow convergence speed. Once the standard PSO algorithm falls into a local extremum, it is difficult to jump out. Inertia weight coefficient
A decreasing inertia weight coefficient tuning method is adopted. In the initial search phase, the inertia weight coefficient decreases in a nonlinear method when the search process is performed. It not only guarantees the ability of the algorithm to expand the search space in the initial phase but also makes the algorithm enter the local search as soon as possible to obtain better solution efficiency. After iterating to
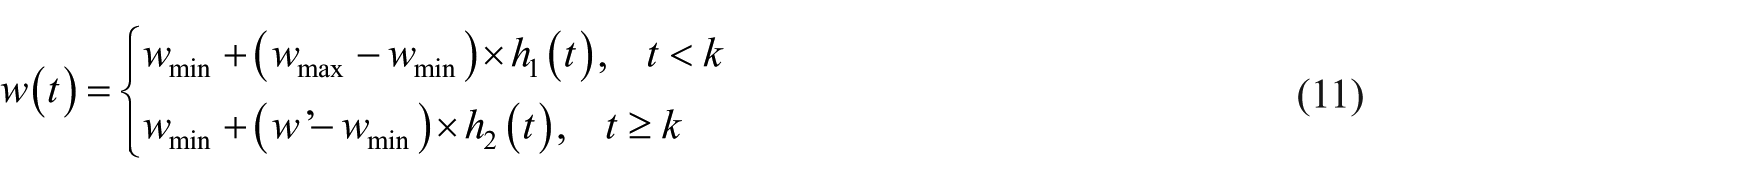
where


where
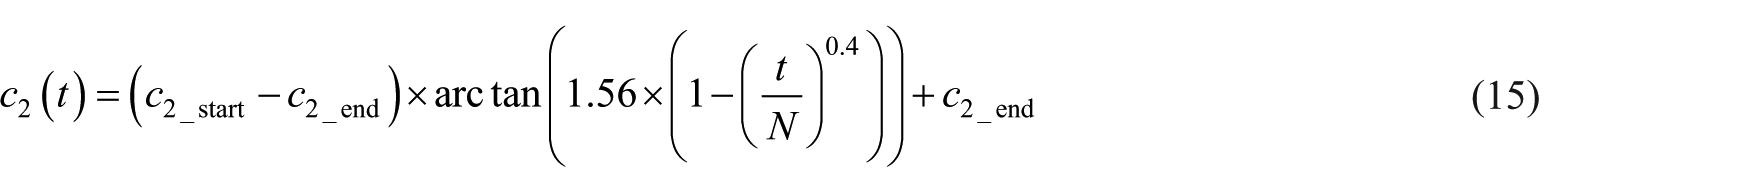
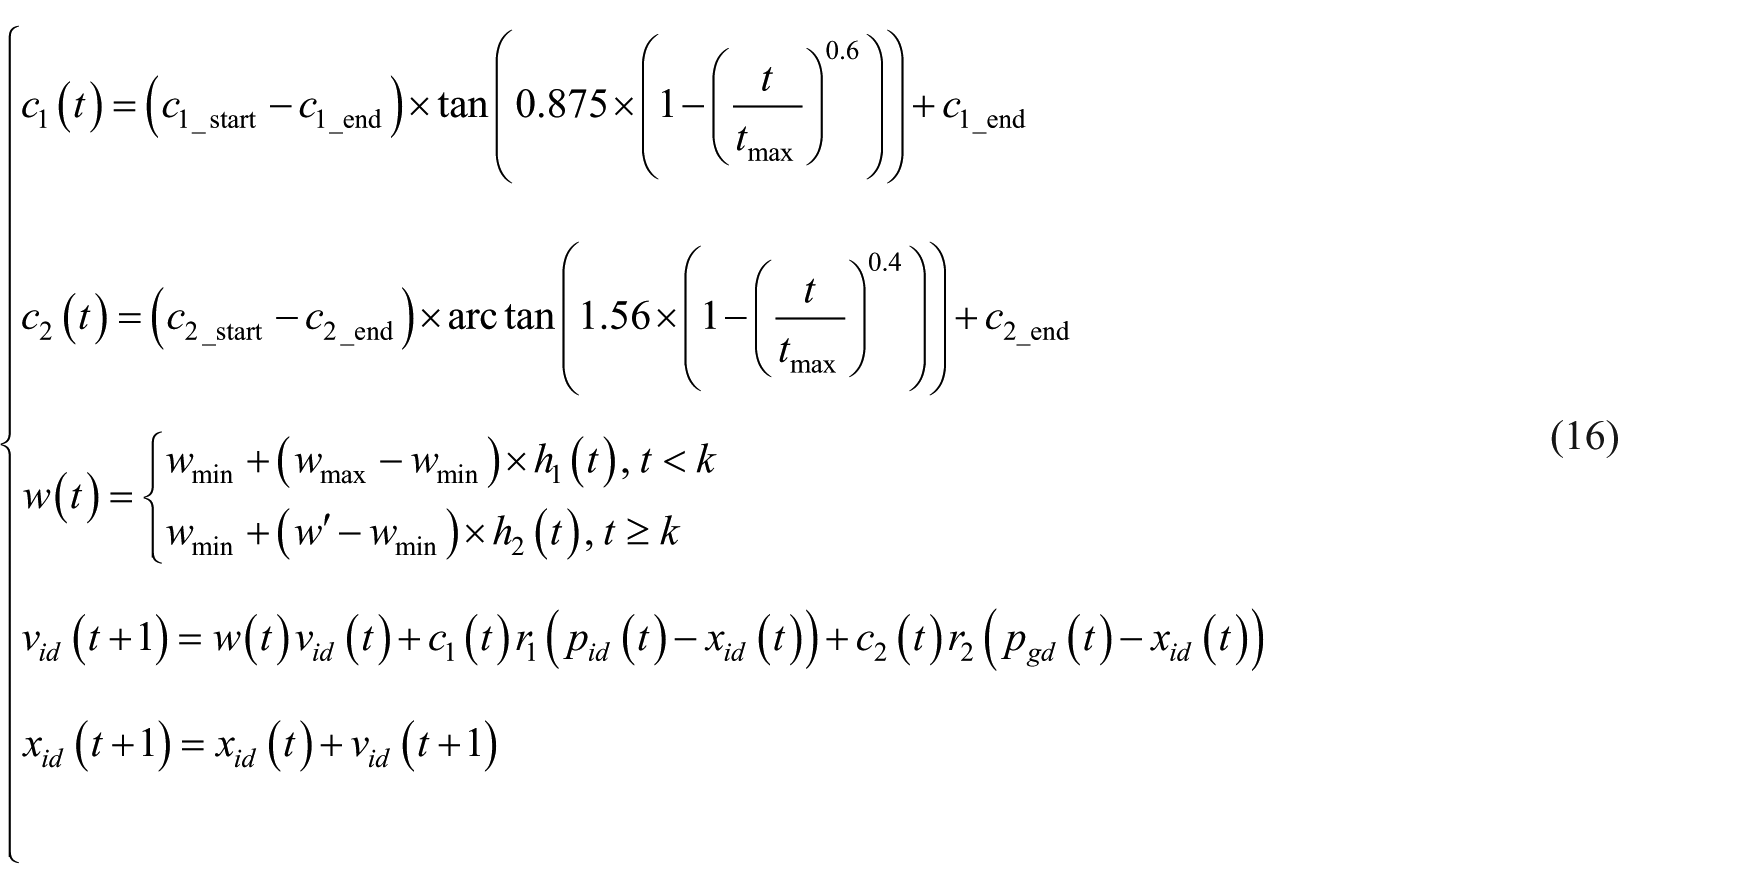
In the literature (Niu et al., 2014), the author proposed an improved inertia weight adjustment strategy based on tangent function. By contrast experiments, it is proved that this method has better convergence performance than others. Based on this literature, this article uses the following methods to adjust the parameters
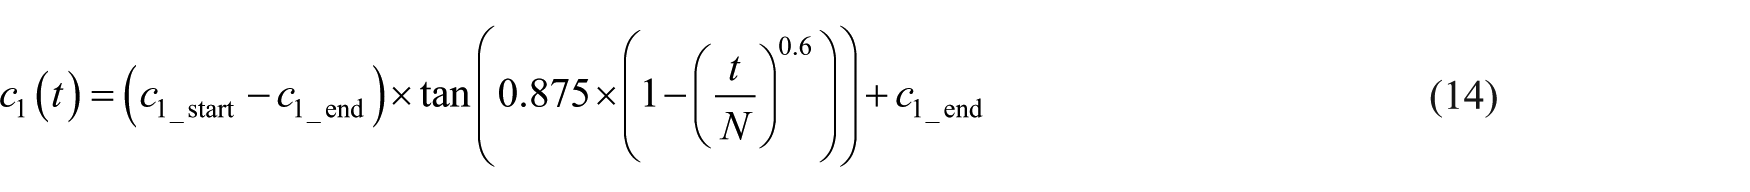
The change curve of the parameter
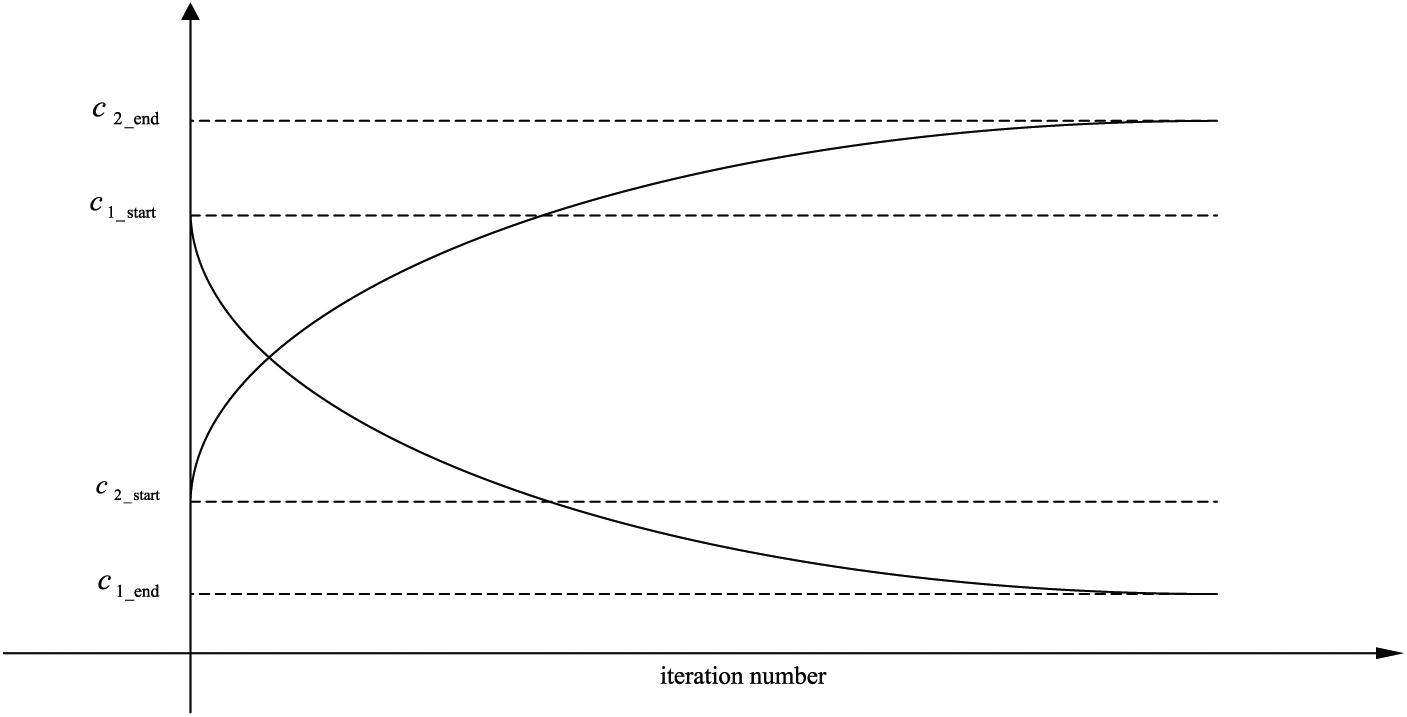
The change curve of the parameters
It can be observed in Figure 4, in the initial search stage,
In brief, adaptive adjustment method of the parameters in this article is as follows
In order to test the effectiveness of IPSO algorithm, a sphere function is used as a test function. IPSO algorithm is compared with the standard PSO algorithm. The sphere function is as follows

where
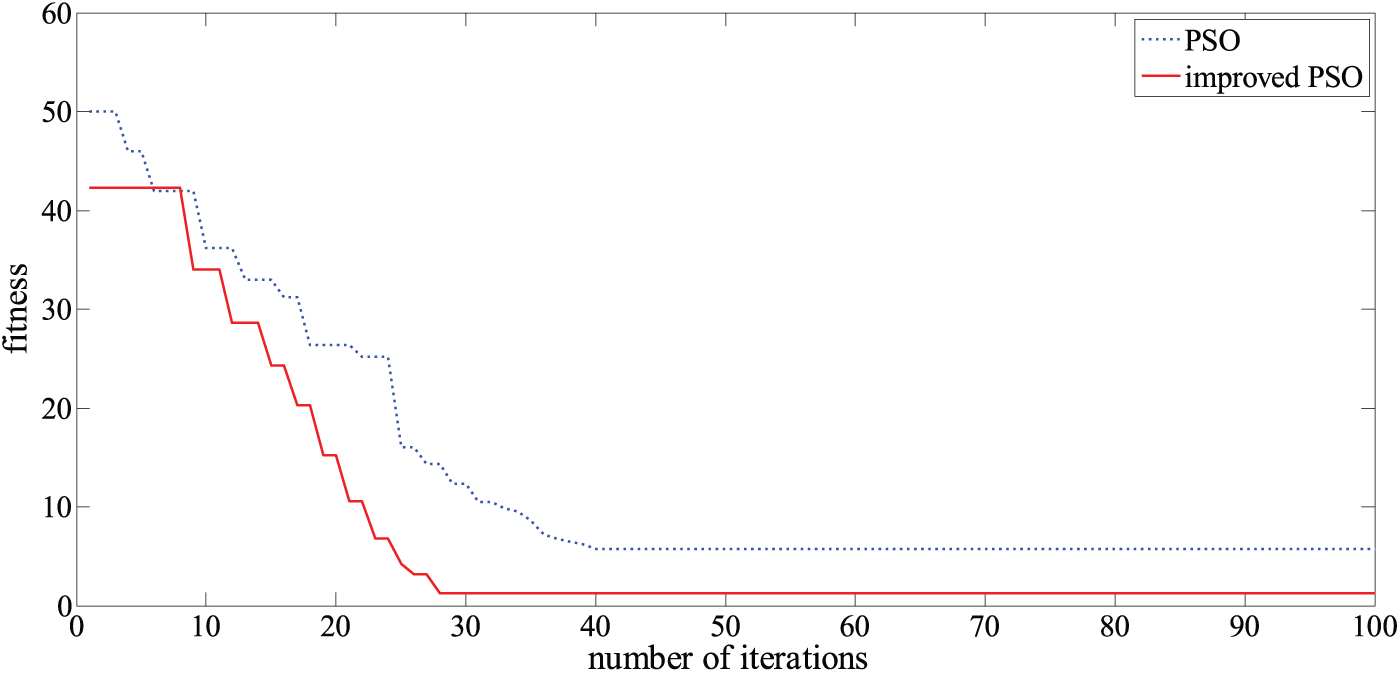
The fitness curve of PSO and improved PSO algorithm.
Wind power prediction model
Figure 6 gives the structure of the prediction model in this article. First, collect data and then select the sample set and test set. Then, SVM with the hybrid kernel functions is built. The optimal parameters of the prediction model are obtained through IPSO algorithm.
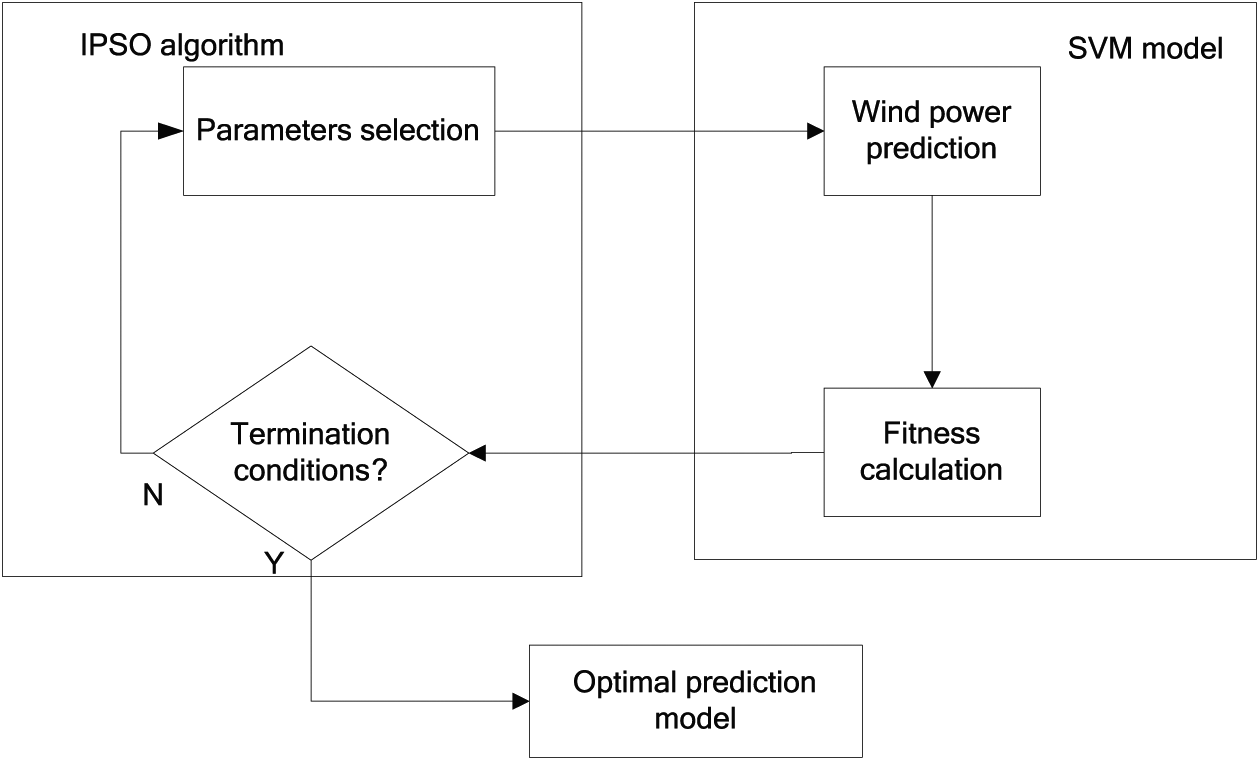
The structure of the prediction model in this article.
The wind turbine may be faulty or downtime, so data processing should eliminate outliers in the original data, and then, the training set and test set data are normalized to [0, 1] range. Normalized formula is as follows

where
In this article, the performance index of wind power prediction error adopts root mean square error (RMSE), mean absolute error (MAE), mean absolute percentage error (MAPE), and reliability. The definitions of these performance indexes are as follows
1. RMSE

2. MAE

3. MAPE

4. Reliability

where
The detailed prediction steps in this article are as follows:
Step 1. The parameter initialization of IPSO algorithm. These parameters include
Step 2. The wind power data are normalized. The input and output data of SVM predictive model are formed. Let
Step 3. The root-mean-square error of the actual and prediction values of wind power is determined as the fitness value. In the
Step 4. The fitness value of each optimal position of the particle is compared with the optimal position of the population. If the particle is better, the optimal position of the particle is taken as the optimal position of the population. The particle velocity and location are updated according to equation (16).
Step 5. Check the end condition of the algorithm. If satisfied, then the optimization process ends and output the optimal parameters. Otherwise, let
Simulation
In this study, the actual wind power data from a wind power plant in Liaoning Province, China, are chosen. The data set (start time: 06/01/2016 00:00, end time: 06/07/2016 23:45) has 672 group data. The sampling period of data is 15 min. The former 5 days (480 groups) data are chosen as the training set. The latter 2 days (192 groups) data are chosen as the testing set. The wind power sequence is as shown in Figure 7.
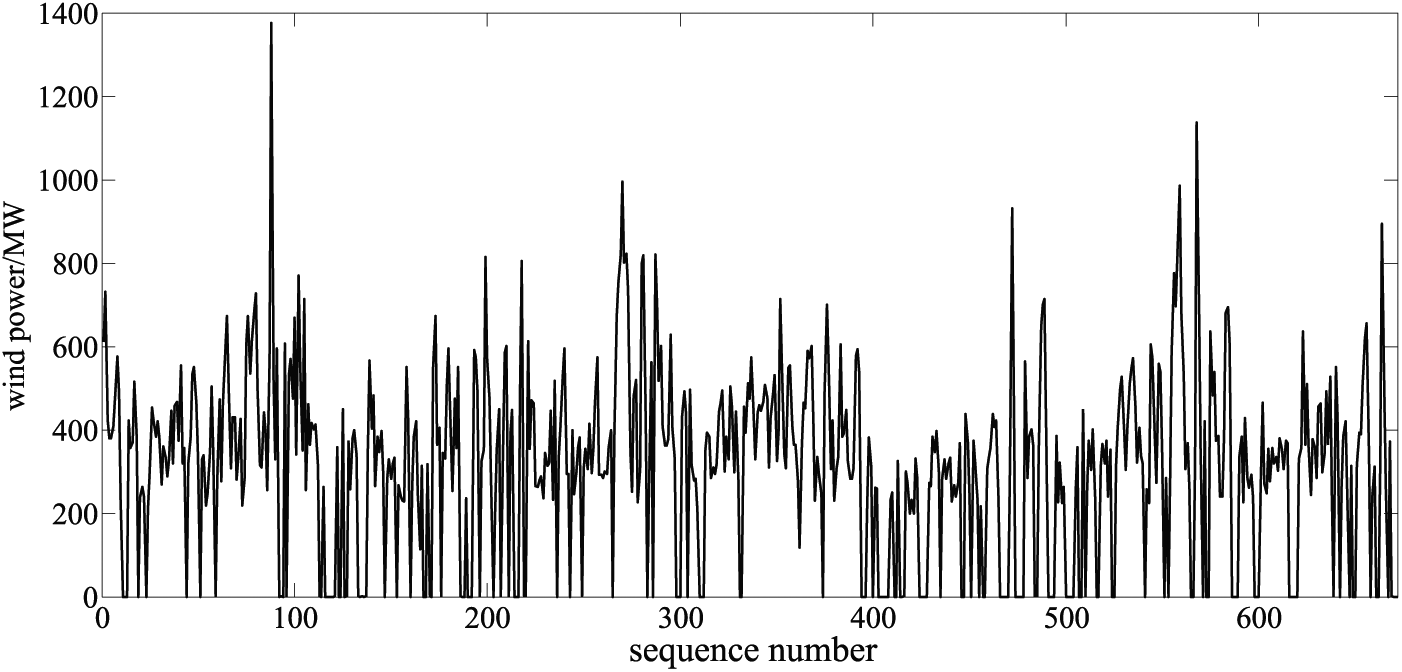
The wind power sequence.
First, the parameters of IPSO algorithm are determined as follows. The number of iterations is 100, population quantity is 20,

The fitness curve of IPSO algorithm optimizes SVM with the hybrid kernel function.
In order to demonstrate the prediction accuracy of the proposed prediction model, the prediction effect in this article is compared with the standard SVM with RBF kernel function (Xiao et al., 2014), echo state network (Smits and Jordaan, 2002), and ARMA model (Wang, 2013). The parameters of SVM are obtained by a cross-validation method in the SVM toolbox, that is,
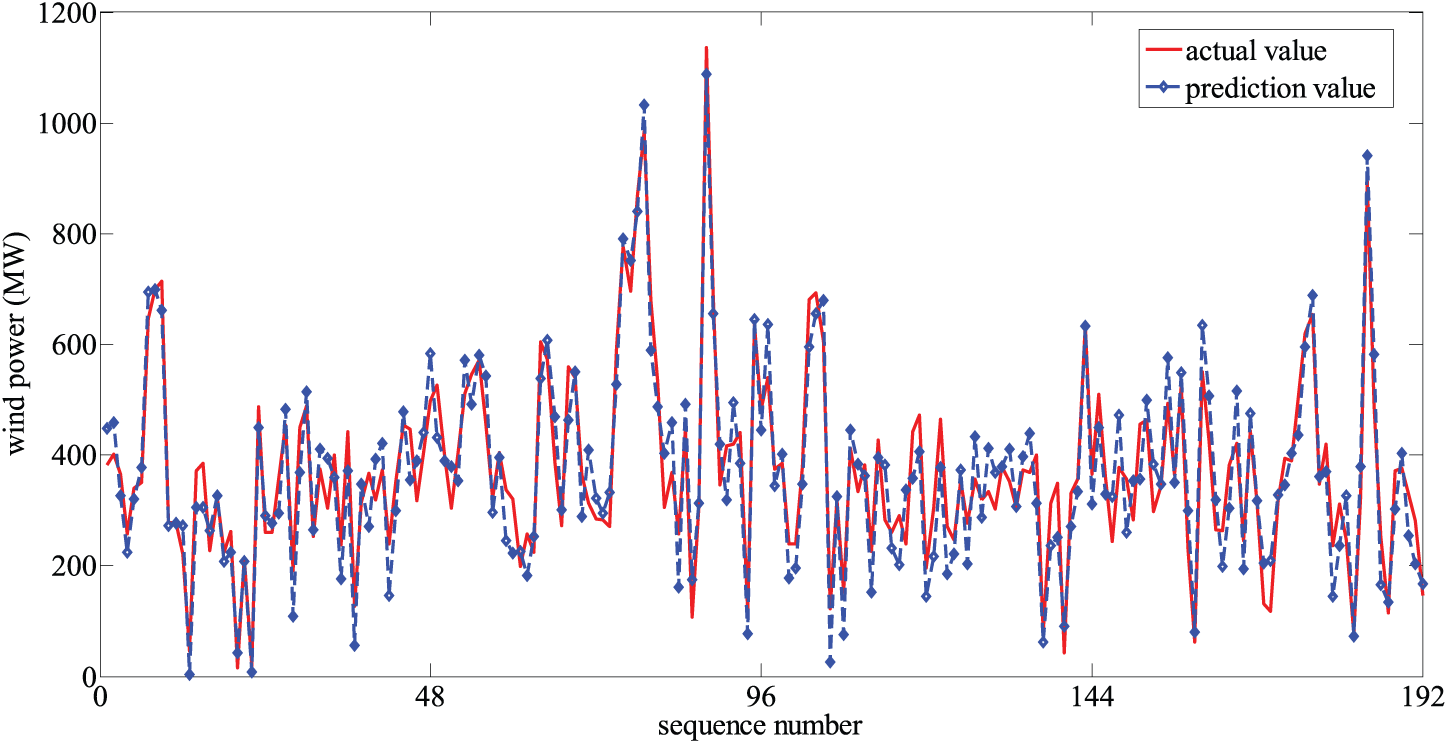
The contrast curve between the actual value and the predicted value of wind power in this article.

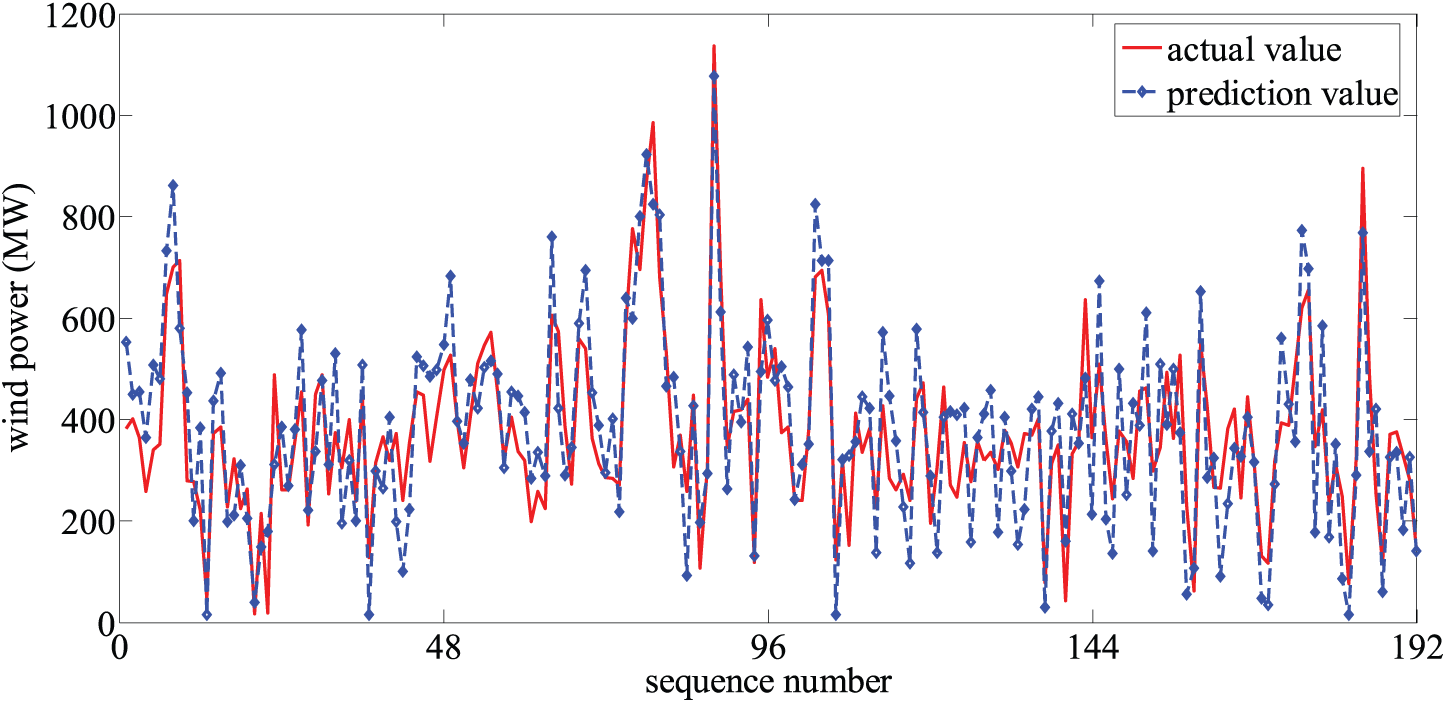
The contrast curve between the actual value and the predicted value of wind power with SVM.
The contrast curve between the actual value and the predicted value of wind power with echo state network.

The contrast curve between the actual value and the predicted value of wind power with ARMA.
Figure 13 is the prediction error distribution histogram of the predictive methods mentioned in this article. From Figure 13, it can be known that because the prediction error is smaller and prediction error distribution is more uniform, the prediction effect and performance in this paper are better.
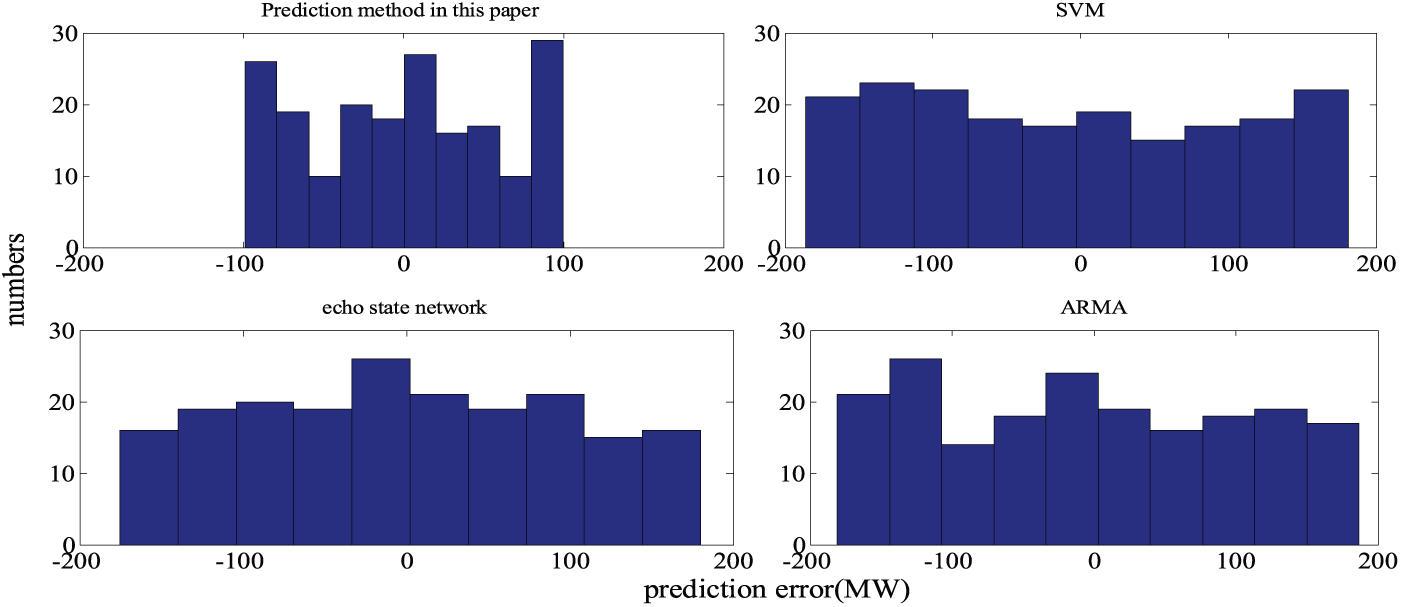
Prediction error distribution histogram of predictive methods.
Table 1 gives RMSE, MAPE, and MAE values of these prediction methods mentioned in this article. From the performance index comparison results in Table 1, prediction accuracy of the proposed prediction method is better than others.
The performance index comparison results.
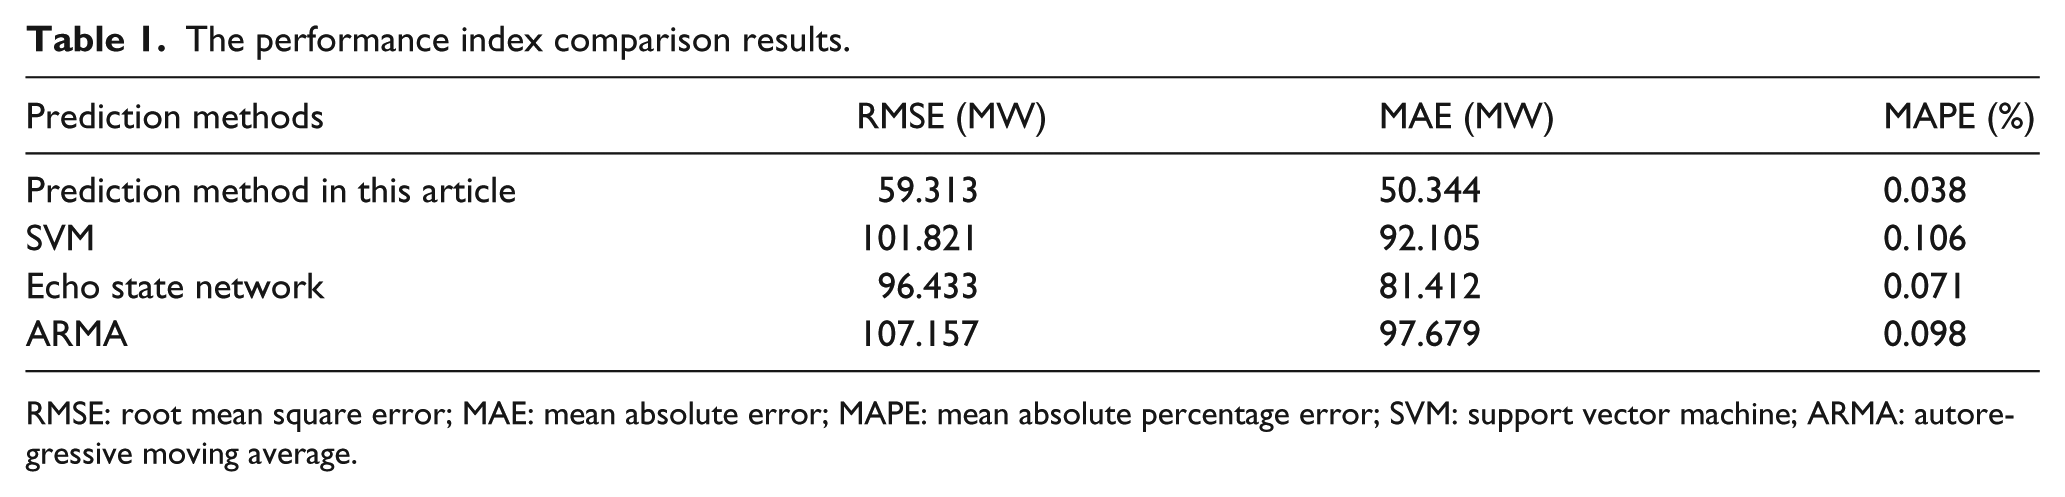
RMSE: root mean square error; MAE: mean absolute error; MAPE: mean absolute percentage error; SVM: support vector machine; ARMA: autoregressive moving average.
Figure 14 is the reliability and confidence distribution of the prediction methods mentioned in this article. It can be observed from this graph that the prediction method in this article has higher reliability under the same confidence level. It can be known that the reliability of wind power prediction method in this article is better than other prediction methods.
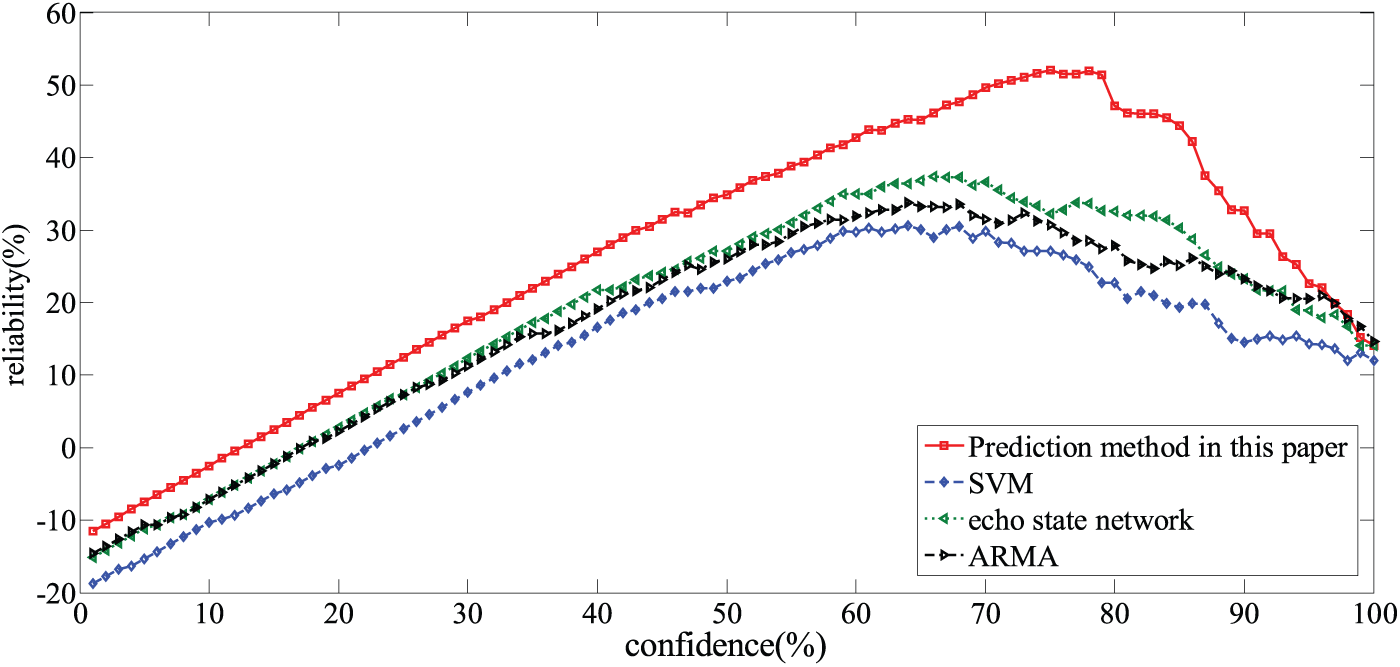
The reliability and confidence distribution of the prediction methods.
In summary, from the above-mentioned prediction contrast curve, prediction error distribution, performance index, and reliability, it can be concluded that the proposed wind power prediction method is better than the other prediction methods. The main reason of prediction accuracy improvement is the introduction of SVM with the hybrid kernel function and IPSO algorithm. The polynomial kernel function is used to simulate the correlation of the distant wind power data, while the RBF function is used to simulate the correlation of wind power data in neighboring fields. Then, the generalization performance of the SVM model is improved. Meanwhile, the optimal parameters of the prediction method are obtained through IPSO algorithm. Therefore, the accuracy of wind power prediction has been improved.
Conclusion
In this article, a wind power prediction method based on SVM with the hybrid kernel function and IPSO algorithm is proposed. On the idea of structural minimization, the SVM model is suitable for modeling of small sample. Through analyzing the influence of the kernel function on the performance of the SVM prediction model, a hybrid kernel function is proposed as the kernel function of the SVM model. In the selection of the parameters of proposed prediction model, an IPSO algorithm with better performance is introduced. The simulation results show that proposed wind power prediction method has better prediction ability.
In this article, the future research work is to introduce more types of kernel functions into the SVM model and find the hybrid kernel function which can improve the prediction accuracy. At the same time, the optimization of prediction parameters is further studied.
Footnotes
Declaration of conflicting interests
The author(s) declared no potential conflicts of interest with respect to the research, authorship, and/or publication of this article.
Funding
This work is partially supported by the Science Research Project of Liaoning Education Department (No. LGD2016009), the Natural Science Foundation of Liaoning Province of China (No. 20170540686), and the Natural Science Foundation of Shandong Province (No. 2016ZRE2703).