



Abstract
Due to the short life cycles of large-scale wind turbines and difficulties in getting permission for farms installations, micro-scale turbines have become interesting sustainable solutions to product energy. However, micro-size turbines have to be able to generate balanced powers while ensuring maximum life services under unpredictable environment conditions. Hence, designers must mainly investigate the dynamic characteristics of turbine tower–foundation systems in order to protect the structural security and stability of the system under vibration constraints. In this framework, this article aims to analyze the vibration behavior of modern micro-turbines. A new aerodynamic styling wind turbine, which is Rutland 504 six-bladed commercial turbine, is selected in this study in order to highlight the impacts of extra components like ring, nose, and tail on the vibrational properties. Accordingly, a three-dimensional model of the turbine tower–foundation system was created basing on finite volume method. The newest version of ANSYS academic software is used. Dynamic properties of the numerical model were determined by solving equations of motion. After identifying mode shapes and natural frequencies, experimental modal testing was applied to validate the numerical model. Then, deformations and vibrations of different components of the system were studied under free vibration conditions. The components of the system most sensitive to vibrate were determined. Moreover, the stress distributions were discussed in order to identify the components most exposed to fatigue fractures.
Keywords
Introduction
In 2015, new global targets concerning the reduction in the dependency on fossil fuels had been signed in Paris by many countries pushing governments to promote all kinds of their renewable energies. However, the irregular natural conditions make hybrid energy systems combining both solar and windy sources, the best choice for clean energy generation. Thus, sun-rich and wind-rich suitable sites have to be entirely availed by countries. Academic research has then paid much attention recently to technological innovations in solar panels and wind turbines especially to enhance their life services. Although there is decline in photovoltaic panels costs, wind turbines are more environmentally sustainable processes. Furthermore, turbines have seen important technological improvements in recent years. This makes wind turbines the most affordable tools of energy production (Cherp et al., 2017).
Wind turbines present ones of the most complex structures combining mechanical and electrical subsystems. These structures are subjected to both steady and unsteady loads, which make their structural dynamic testing a highly required task in order to improve their designs, materials, and operation life (Hearn and Testa, 1991). Predicting the behavior of these machines under vibrations, brake squeal, earthquakes, transport, and acoustic load phenomenon is an important task (Farrar and James, 1997). However, improving efficient techniques for life cycle policies is still a challenging issue (Sellami et al., 2014). Designers are mostly interested in fatigue tests to optimize operation life expectancy of machines. Therefore, structure robustness to several loads has to be initially checked (Montalvao et al., 2006).
One of the drawbacks of large-scale wind turbines is their short life service. Hence, small-scale turbines present viable options for generating energy. Developing micro-turbines at the consumer level may be the solution to reach the new global targets. Micro-turbines present reliable sources of electricity when their maximum powers are tracked. These turbines can respond to the basic energy demand in zones not covered by supply of the electricity grid. They are also required in autonomous processes involving high reliability level. Furthermore, they should be suitable for marine applications on small boats. These specific requests entail lightweight rotor designs with radius smaller than 1 m. Hence, micro-turbines need specific aerodynamic styling geometries to generate stable energy outputs regularly over short periods just like the cases of battery charging despite their small sizes. They also have to handle the turbulent loads conditions. Indeed, they require vigorous designs able to tolerate vibration stresses.
Engineers are still working on designs and materials’ innovations to improve energy generation of micro-turbines (Petrini et al., 2010). Hence, enhanced aerodynamic designs of wind turbines were developed in the energy production market with better-quality materials. This explains, for example, the presence of sharp nose domes in modern turbines in order to maximize the wind flow. Long tails are also added to enhance turbines’ orientation to wind. Modern turbines may also contain circular stabilization rings permitting the protection of the blades. However, these improved designs may not ensure a high level of structural security and stability of the system when strong wind or earthquake occurs. Hence, condition-monitoring systems have to be implemented in order to avoid sudden failures caused by severe environmental conditions (Hu et al. (2015). These systems are especially based on continuous calculation of vibrational parameters (natural frequencies and mode shapes) during time. In the study by Zhiquan et al. (2001), a horizontal-axis wind turbine dynamic was analyzed using modal analysis method. The authors discussed the dynamic properties of the model. Natural frequencies due to different accreted icing load scenarios of a wind turbine were investigated in the work by Alsabagh et al. (2015).
Numerical solutions are the most captivating tools for complex aerodynamic-designed turbines, thanks to their rapidity and efficiency (Baqersad et al., 2015). Numerical resolutions can perform advanced analyses dealing with different engineering areas speedily. Complex algorithms can be quickly solved. Furthermore, numerical approaches present an effective solution for pulling out vibrational replies of wind turbines. In the work by Juang and Pappa (1985), an Eigen system realization algorithm was developed for modal parameter identification. Finite volume method (FVM) is an effective numerical solution able to find approximate answers to satisfy the boundary conditions of micro wind turbines. The method deals with establishing an FVM-based model. FVM principle is based on generating nodes and elements devising spatial volumes. Then, models constitutive material properties have to be assigned. An adequate meshing is generated in order to display points where vibrations are important. ANSYS is one of the most efficient software for mechanical problems and vibration challenging. It proposes rapid algorithms for resolution of structures’ partial differential equations of motions. ANSYS program has a wide library of elements supporting vibration and acoustic fields. In the work by Sellami et al. (2016), a vibration analysis was executed by the newest version ANSYS16 for a three-bladed turbine.
Wind turbine tower–foundation system modeling
Micro-turbine modeling is still an active research field all over the world. The United Kingdom is a leading country with a growing market of commercial micro-turbines. The manufactured turbines are expected to cover the rural areas of the country where the wind speed is relatively high and the wind direction is stable. Hence, the selected wind turbine for this study is a British commercial Rutland 504 turbine. This micro-turbine, as shown in Figure 1, is chosen for its styling, aerodynamism, and inner materials (Sellami et al., 2017a). Moreover, three-bladed standard turbines had been widely investigated in literature. Rutland 504 turbine deliberates a current which is able to charge 12 V batteries. To protect batteries from overcharging, the turbine requires an adequate regulator like HRS504 regulator. A powerful airflow simulator is used to generate adequate airflow speeds. Three different available speeds are measured by a tachometer.
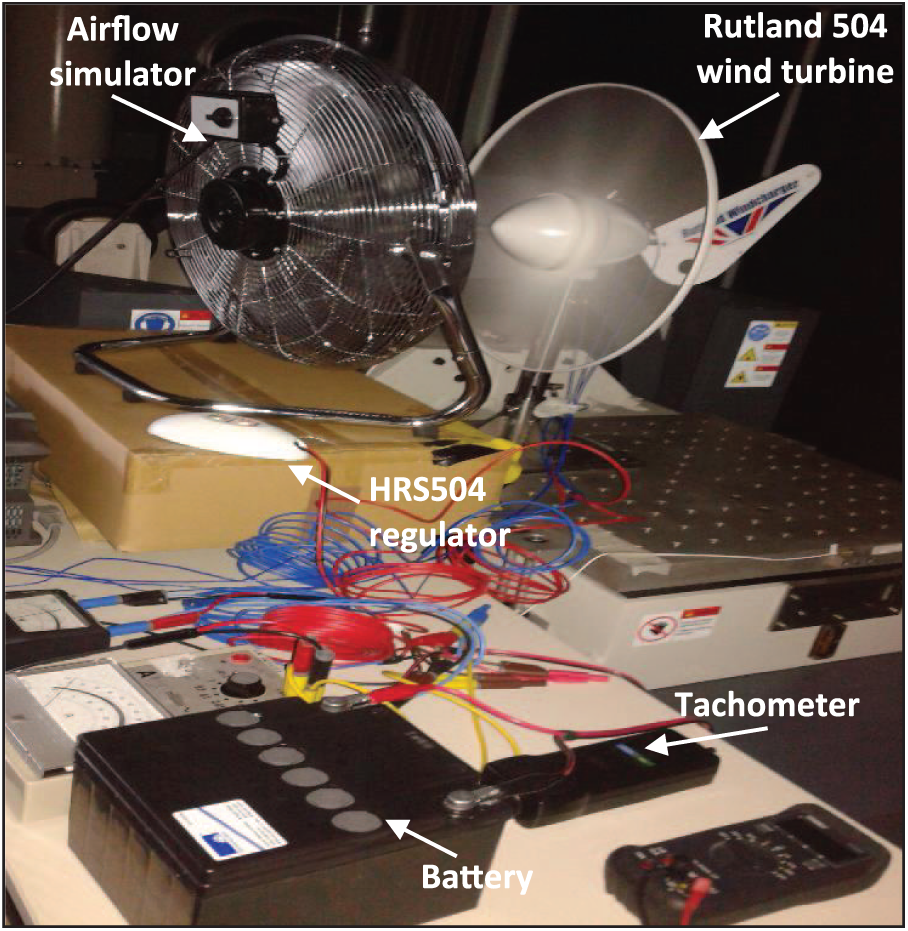
Overview of the tested Rutland 504 wind turbine coupled to a 12 V battery in the experimental platform.
Mathematical model
Wind turbine structure is principally composed of blades and a nacelle coupled to a tower, which is fixed to a suitable foundation. Micro-turbines are frequently used to deliver energy essentially supplying separated isolated stations and houses or sailors. Thus, a micro-turbine tower–foundation system is generally coupled to a battery. The connection is made via a converter (stator-side converter) attached to bus (direct current (DC)-bus), as shown in Figure 2 (Sellami et al. (2013). The stator-side converter is allied to stator windings of the generator in order to guarantee electrical and mechanical frequencies’ adaptation. The DC-bus voltage is controlled by regulators adapting reactive powers consumed or supplied by the battery (Sellami et al., 2017b).

Overview of the wind turbine tower–foundation system coupled to a battery.
The mechanical part of the turbine is composed of n orientable blades. As shown in Figure 3, the n blades are orientable and considered identical and consequently having the same inertia Jb, the same elasticity Kb, the same coefficient of friction relative to the air db, and the same coefficient of friction relative to the support fb. Each blade is subjected to a force Fbi (i = 1 … n) following the wind speed V. Absorbing a wind torque Car, the blades are fixed to a rotating drive shaft at Ωturbine speed. They are connected to a generator transforming the mechanical energy to electrical one. A gearbox is added in some turbines to increase the rotor speed Ωmec through a multiplication by a G coefficient. The drive shaft is characterized by an inertia Jd, an elasticity Kd, and a coefficient of friction relative to the gearbox fd. The rotor of the generator is characterized by an inertia Jg and a friction coefficient relative to the shaft fg. The turbine rotor transmits a torque Cg to the generator. The generator rotating at the speed Ωmec, produces an electromagnetic torque Cem (Sellami et al., 2017). An equivalent mechanical model with two masses is presented in Figure 3.
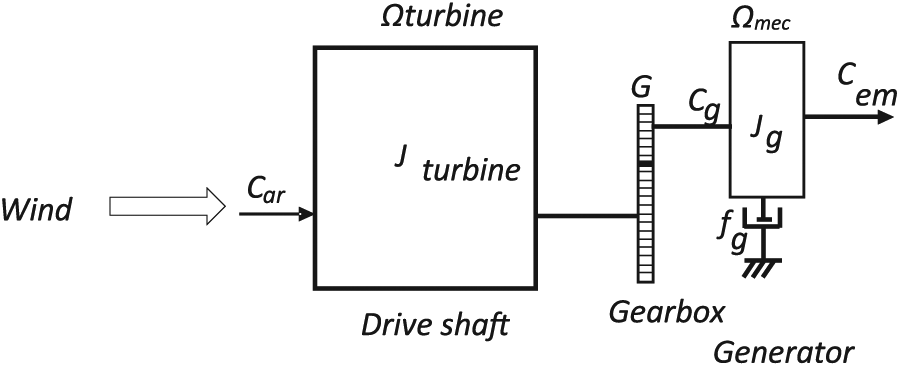
Equivalent mechanical system of the n-bladed wind turbine.
The turbine total inertia Jt can be defined as follows

The mechanical equation of the turbine is defined as follows

where fgΩmec is the torque due to the viscous friction fg.
The torque Cg is defined as follows

The rotor aerodynamic torque Car is given as follows

The wind turbine aerodynamic power Par can be written as follows

where R is the rotor radius of the turbine under test, ρ is the air density depending on the air temperature and the altitude. Cp is the power coefficient defined as a function of the pitch angle β and the tip speed ratio λ defined by λ = RΩmec/V. A maximum theoretical value of Cp indicated by the Betz limit assumes that Cp_max = 16/27 = 0.593.
The produced power is dependent on the wind characteristics of the installation site including the wind potential and the landscape conditions (Rissanen et al., 2016). The wind loads along tower can be assumed as follows

where
Dynamic characteristics extraction using modal analysis technique
The aim of this section is to investigate the vibrational behaviors of all the components of the turbine in order to identify which components are the most subjected to damage and the most affected by turbulent wind and torsional vibrations. The equivalent mechanical system of the wind turbine tower–foundation, as presented in Figure 3, includes various masses m considered as a generalized mass matrix [M], viscous damping coefficients c considered as a generalized damping matrix [C], and stiffness springs k considered as a generalized stiffness matrix [K] (Hansen, 2003). The vectors {u}, {u̇}, and {ü} present, respectively, the displacement vector, velocity vector, and acceleration vector of the various masses. The structure is characterized by eigenvectors expressed as follows

where
The modal decomposition method leads to solve displacement vector as a combination of vectors of mode shape

Numerical model establishing
Wind turbine tower–foundation numerical modeling
The Rutland 504 wind turbine, as presented in Figure 4(a), is one of the specific styling turbines. It is a six-bladed turbine whose tips are linked by an outer protective ring. The nominal power delivered by the turbine is 60 W. The wind charger produces great ampere-hours in real wind conditions, thanks to its high-inertia alternator design with a flywheel effect to generate more free power. A tail is constructed to improve its orientation to wind and to preserve its stability. A sharp nose dome is also manufactured to expand the flow of wind to the turbine.
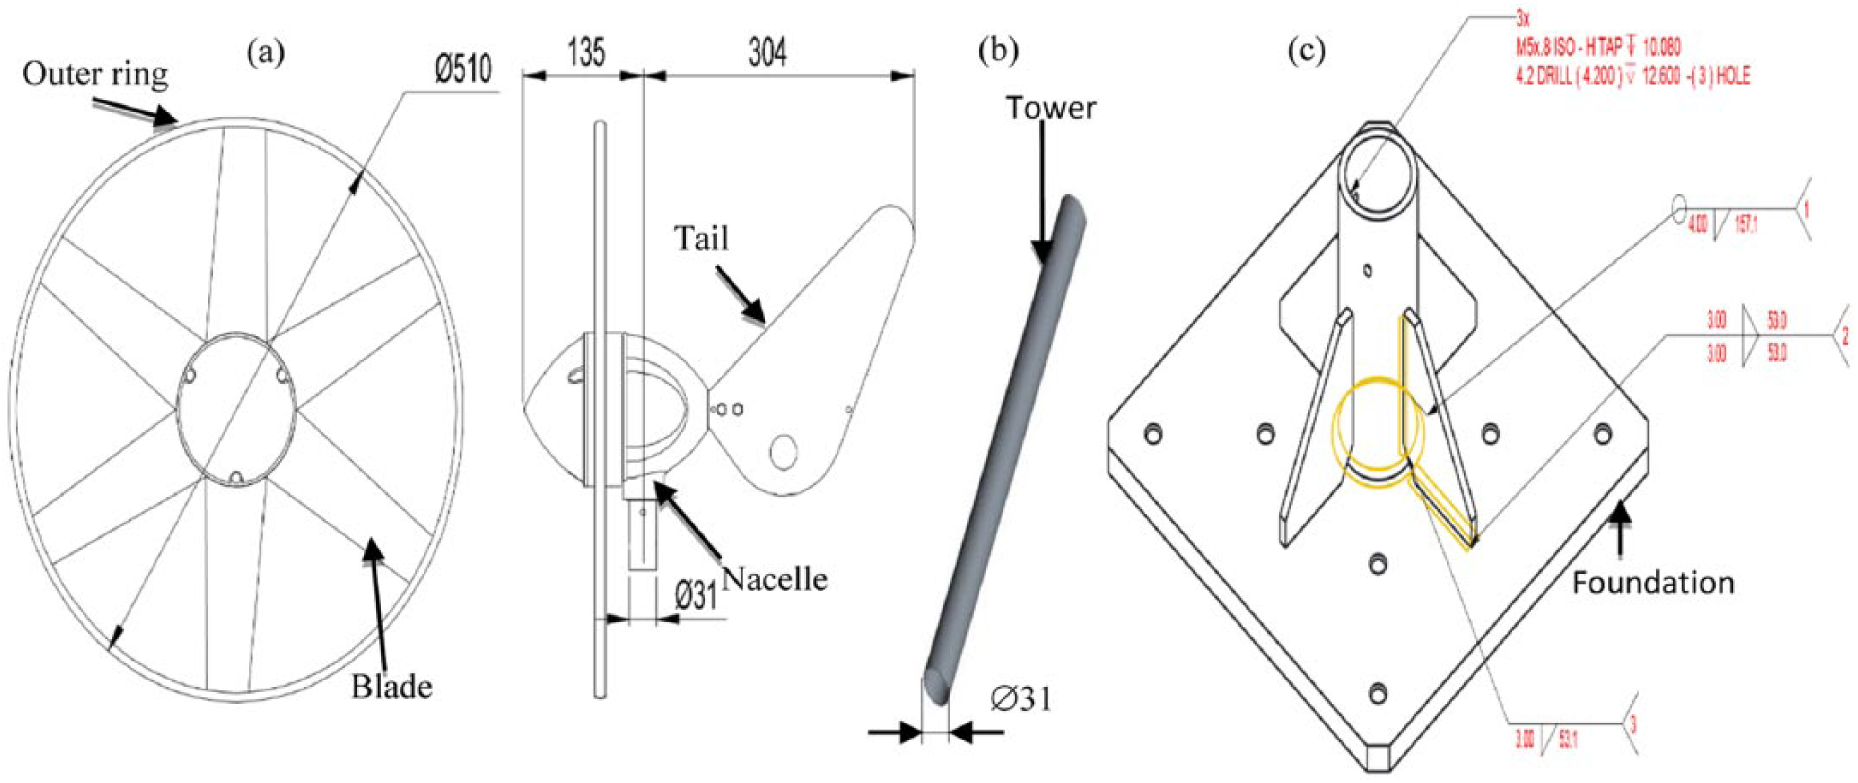
Wind turbine tower–foundation geometry dimension: (a) turbine, (b) tower, and (c) foundation.
An adequate tower is designated to fix the turbine as presented in Figure 4(b). In addition, an optimum foundation is required to fix the wind turbine to soil or ground as shown in Figure 4(c). A well-chosen foundation permits a higher more important production created by the turbine (Prasad et al., 2017). The foundation has to fit the tower dimension with an adequate stiffness in order to enhance the turbine tower–foundation system natural frequencies respecting experimental limits.
Geometry setup
A detailed three-dimensional (3D) model for the turbine tower–foundation system is presented in Figure 5(a). The model is set up basing on the FVM using ANSYS16. The structure is considered a hybrid system joining the generator nacelle (mechanical parts) to the blades–tower–foundation (structural part) modeled as beam elements. As presented in Figure 4, the diameter of selected turbine is 510 mm. The corresponding tower has a diameter of 31 mm and an altitude of 350 mm. The foundation cylinder has a diameter of 32 mm. Computer-designed aerofoils are made to generate each blade (Sellami et al., 2016). Applying all the dimensions of each component, the 3D geometry of the Rutland 504 turbine is generated.

Tested wind turbine tower–foundation system: (a) numerical model, (b) meshed model, and (c) zoomed parts.
Materials description
The tower and the foundation are manufactured from steel. However, the nacelle is constructed from complex materials. The six blades, the tail, and the outer ring are also constructed from a mixture of complex materials. The body and the nose of the turbine are high-grade materials with improved UV stability and durability.
Mesh generation
As shown in Figure 5(b), uniform and accurate meshing is chosen to display the areas where maximum deformations and stress are presented. More than 5000 triangular elements and 100,000 nodes had been generated to divide the 3D-built model as presented in Figure 5(c). The flapwise, edgewise, and spanwise directions are generated, respectively, following the x-axis, z-axis, and y-axis. Then, the blade, nacelle, and tower interactions and vibrational behaviors had been studied.
Boundary conditions
Adequate boundary conditions are selected for each analysis. The foundation of the turbine is fixed against translation and rotation in all directions. The loads of wind turbines are inertial, delivered aerodynamically from rotor and wind loads. Rotor aerodynamic loads are applied on top of the tower. The wind turbine tower–foundation system is directed by the wind load. The wind pressure is applied following the altitude of the tower as described by equation (6).
Results solving
After drawing the turbine geometry, fixing materials of each component, generating adequate meshing, and applying the boundary conditions, dynamic analyses were conducted. Free vibration analysis is the first stage in dynamic analysis of structures. Through modal analysis, natural frequencies, modal shapes, dampings, and stiffnesses of the structure can be calculated. The stability of the turbine tower–foundation structure can be guaranteed through avoiding natural frequencies.
Wind turbine dynamic analysis
Mode shapes and natural frequencies calculation
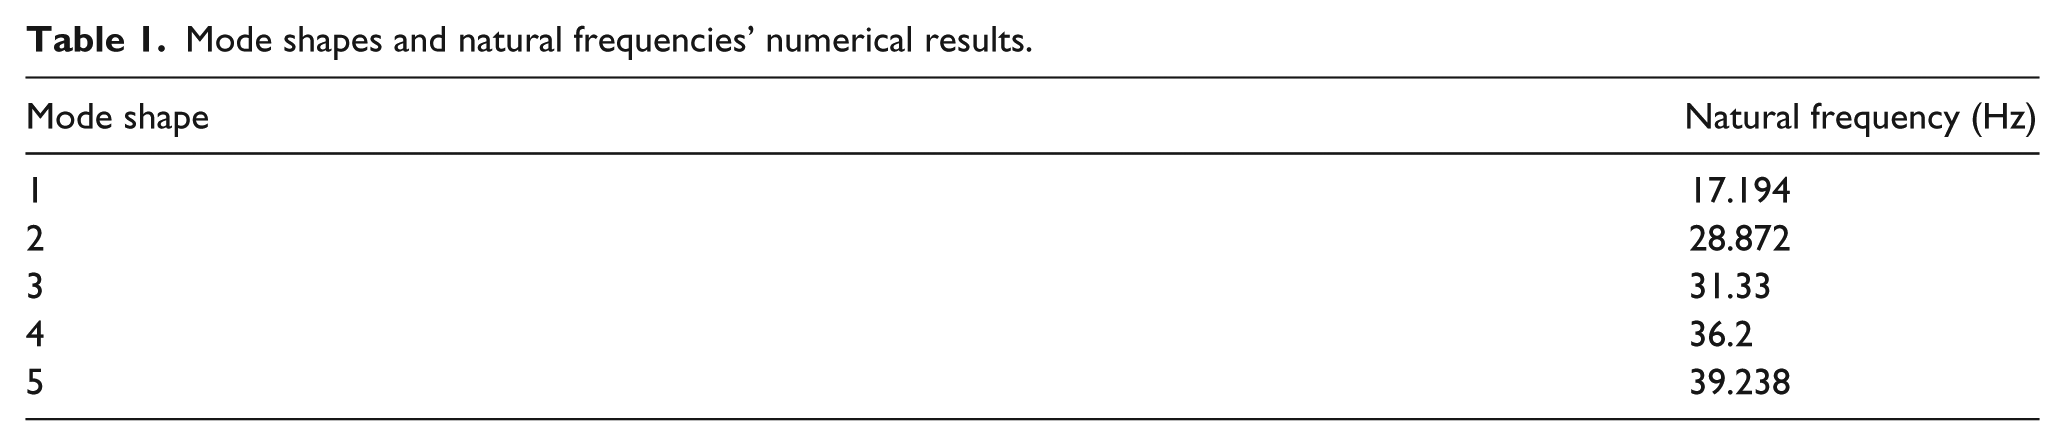
Calculating natural frequencies is extremely important to avoid resonance phenomena. In fact, natural frequencies should be separated from induced frequencies by passing frequencies of the rotor and blades (Jianbing et al., 2015). Thus, modal analysis technique is one of the most important tasks for engineers. The stability of the turbine tower–foundation structure can be guaranteed through avoiding natural frequencies. Applying modal analysis technique for the 3D-designed model, the motion equations are solved as described by equations (7) and (8). The first five natural frequencies of the system are calculated. Table 1 presents results in a frequency range of 0–40 Hz. The first natural frequency of the studied micro-turbine joined to tower and foundation is 17.09 Hz and then the frequency rises up to reach 39.06 Hz for the fifth mode shape. The third natural frequency relative to the third mode (31.33 Hz) is so close to the natural frequency relative to the second mode (28.872 Hz). Equally, the fourth natural frequency (36.2 Hz) is so close to the fifth natural frequency (39.063 Hz). It can be seen that two close modes can be assorted in experimental tests. Thus, two close mode shapes can be presented by one peak.
Mode shapes and natural frequencies’ numerical results.
Experimental modal testing validation
The experimental validation of a numerical model is based on the quantification of comparison between computational and experimental data. Indeed, the calculated modal parameters by the numerical approach are compared to experimental results evaluated by experimental modal testing method (Pandey et al., 1991). The experimental natural frequencies were then used to update the parameters of materials of the model until getting numerical modal results close to experimental ones and consequently a validated FVM model.
In this study, experimental modal testing method is applied based on a vibration test system including an electro-dynamic shaker (M4040A) coupled to an amplifier. The experimental setup is presented in Figure 6. First, Rutland 504 turbine is placed on the table shaker. The excitation and the response signals are measured using vibration sensors, which are accelerometers storing accelerations of the structure components. These sensors, with attractive prices, are easy to implement. However, selecting adequate sensitivity of accelerometers in structural analysis is a perplexing task. Thus, the sensor locations and sensitivity were selected based on the numerical simulation results. It was also verified that the used sensors do not induce mass loading or stiffening impact on the tested structure. In this study, the dynamics and shape measurement are achieved by attached PCB accelerometers. The sensors were positioned on the blades, the nacelle, the tail, and the tower with different orientations (x-axis, y-axis, and z-axis). As shown in Figure 7, flapwise (x-axis), edgewise (z-axis), and spanwise (y-axis) vibrations are measured under different external forces generated by the shaker and delivered by the amplifier.

Experimental setup carrying vibration test system based on an electro-dynamic shaker (M4040A).
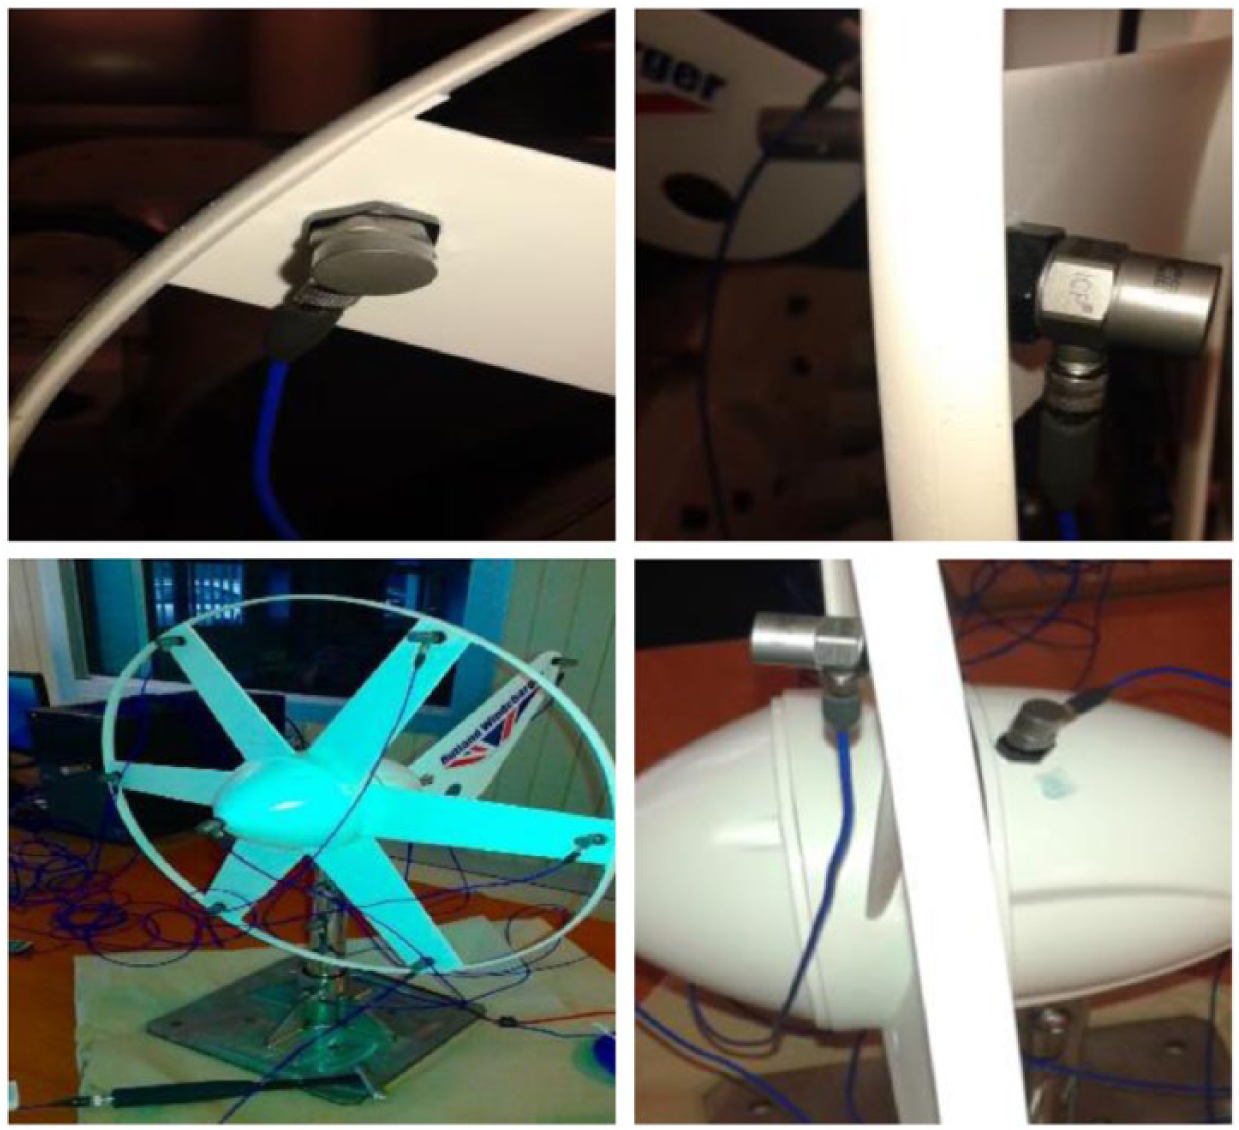
The micro-turbine and the connected test accelerometers.
After exciting the foundation of the system, by a measured force {F(t)} in time domain, the vibration acceleration {ü(t)} over the structure is estimated. Fast Fourier transform (FFT) analyzer calculates then spectrum vectors of excitation {F(jω)} and acceleration {ü(jω)}in frequency domain. The linear reaction of the tested turbine to the excitation force is expressed by means of the matrices [M(jω)], [A(jω)], and [R(jω)] named, respectively, frequency response functions’ (FRFs) mobility, accelerance, and receptance spectrums. They are defined as follows



The Hermitian expression of equation (11) leads to

The multiplication of equations (11) and (12) leads to

Naming m and r, respectively, the number of outputs and inputs, equation (13) can be expressed as follows

The matrix [Guu(jω)] is called the (m*m) output spectral density. The matrix [GFF(jω)] is called the (r*r) input spectral density. The matrix [R(jω)] is called the (m*r) FRF receptance spectrum.
The FRF receptance spectrum can be defined as follows

where N, λk, and Rk present, respectively, the modes number, pole, and residue. Rk can be expressed as follows

where γk and φk denote, respectively, the modal participation vector and the mode shape vector.
Basing on equation (16), the data acquisition system of the experimental platform generates the FRFs containing necessary information to evaluate modal factors of the tested structure. Figure 8 presents the saved FRFs during the modal testing. The stored peaks of the FRFs are highlighted. Each peak corresponds to a mode shape and measured natural frequency. The experimental first natural frequency is 19.53 Hz. The relative error between numerical and experimental results is 11.9%. The second saved natural frequency is 29.297 Hz relatively to both second and third mode shapes because the third natural frequency (31.33 Hz) is so close to the second one (28.872 Hz). The second relative error between numerical and experimental results is 1.4%. Natural frequency carries on increasing to reach 39.063 Hz corresponding to both fourth and fifth modes since the fourth natural frequency (36.2 Hz) is so close to fifth natural frequency (39.063 Hz). The third relative error between numerical and experimental results is 0.4%.
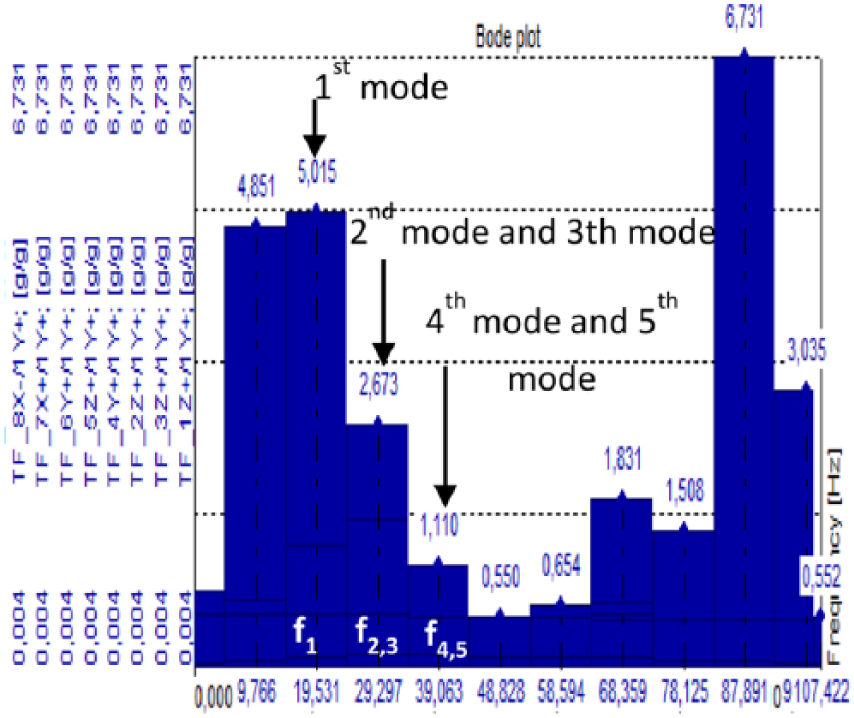
Generated FRF with experimental natural frequencies and mode shapes’ results.
The uncertainty quantity in structural answers is compared for numerous data sets to quantify the certainty impact on model prediction. Modal Assurance Criterion (MAC), a coefficient of correlation, can be generated to evaluate the correlation of experimental and numerical mode shapes. The MAC is defined as follows

where φExperimental and φModel are, respectively, the testing and the numerical modal vectors.
The obtained errors between experimental tests and numerical simulations can be explained by many reasons like the uncertainty of the acceleration measurement, the data acquisition errors, the environmental factors like temperature, and so on. It has to be mentioned that the numerical simulation has also uncertainties that have to be quantified to reduce the calculated errors. To decrease the uncertainty of the simulation, it is necessary to minimize the meshing uncertainty by generating refined meshing. It has to be noted that this task required a long time to execute the analysis and find out more precise results. The final meshing parameters of the validated model are shown in Table 2.
Meshing parameters permitting the uncertainty quantification.

The quantification of experimental uncertainty in the obtained modal parameters was achieved by conducting supplementary experiments. The major bias errors were caused by the damping and mass loading of the used instrumentation. A filter is also generated to keep the experimental uncertainty at a certain level. Besides, a mode indicator function (MIF) is generated by the data acquisition system to verify the transfer functions poles (natural frequencies) of the structure basing on stability diagrams analysis, as shown in Figure 9.
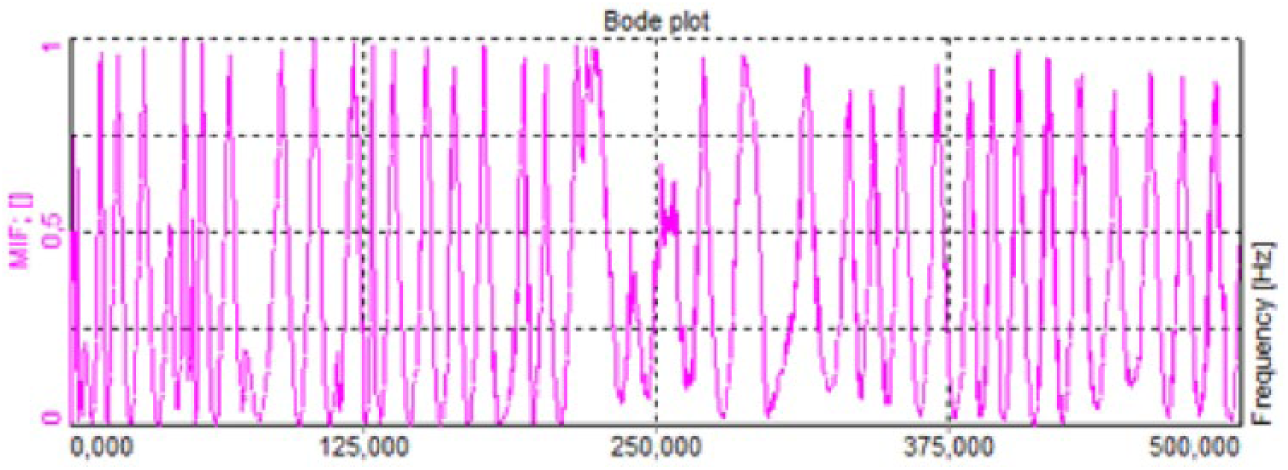
Measured MIF of the tested micro-turbine during modal testing.
Vibration results analysis
A vibration data can be evaluated as a displacement, as a velocity, and as an acceleration data. However, it is impractical experimentally to measure all three data at once because it is physically impossible to place three transducer types in the same locality. Thus, measuring displacement or velocity or acceleration data will be sufficient. After measuring displacement or velocity or acceleration, it is mathematically simple to make conversion between them using differentiation or integration (Wu et al., 2015).
Experimentally, displacements are measured by means of strain gauges defined by capacitive effects and induced radio frequency mechanisms to avoid affecting local masses. Total displacements of the wind turbine tower–foundation system are measured by ANSYS relatively to each mode shape under fixed free condition. A comparison between displacement results and distributions corresponding to the first five modes is presented in Figure 10. Minimum displacements are presented by a blue color in the model. More important displacements are shown by green color. Then, displacements are presented by yellow color. Finally, maximum displacement of the designed model is presented by red areas.

Total displacements calculated by ANSYS relative to first, second, third, fourth, and fifth modes.
The first mode engenders a maximum displacement of 13.9 mm concentrated in the tail. Then, displacements decrease for the following modes to reach about 3 mm (3.1 mm for second mode, 2.9 mm for third mode, 3.9 mm for fourth mode, and 3.4 mm for fifth mode). As it can be seen, the foundation and the tower stayed immovable and not affected by the natural frequencies. The tail, then the nacelle, then the six blades tips, and then the outer ring are the components vibrating awarding both flapwise and edgewise directions. As shown by red areas, the blade tips and the ring are the most subjected parts to displacements. Accordingly, maximum vibrations occur in tips of the six blades and in the outer ring.
Equivalent elastic deformation
Keeping the same (x, y, z) framework, deformations of the studied wind turbine tower–foundation system relative to the first five modes are presented in Figure 11. For each mode, the original state of the system is plotted in order to recognize the elastic deformation power and direction. A maximum elastic deformation of 3.6 mm/mm is caused by first mode. 2.8 mm/mm is produced by second mode, 3.1 mm/mm is produced by third mode, 1.8 mm/mm is produced by fourth mode, and 2 mm/mm is caused by fifth mode. It can be deduced that a gradient increasing deformation distribution moves in every blade from the root to the tip. Then, the gradient increasing deformation distribution moves from tips of blades to the outer ring. It is consequently realized that under free conditions, flapwise and edgewise vibrations are first presented in the tail, then blade roots, and finally in the ring.

Equivalent elastic deformation calculated by ANSYS relative to first, second, third, fourth, and fifth modes.
Equivalent Mises stress
The equivalent stress (von Mises stress) of the turbine tower–foundation volume related to first mode shapes has been extracted. Figure 12 illustrates the distribution of stress for the first five modes. The maximum Mises stress caused by first mode is 8.1 kPa localized in the tail. Then, for second mode, the stress decreases to 1.9 kPa concentrated in the tower. The tower carried on being the component the most affected by stress in third, fourth, and fifth modes with, respectively, maximum stress of 1.9, 9.7, and 1.5 kPa. However, Mises stress includes roots of blades too. Thus, under fixed free conditions, it can be noted that the maximum Mises stress occurs first in the tail, then in the tower of the system, and then in roots of blades, which can easily engender their fatigue fractures.
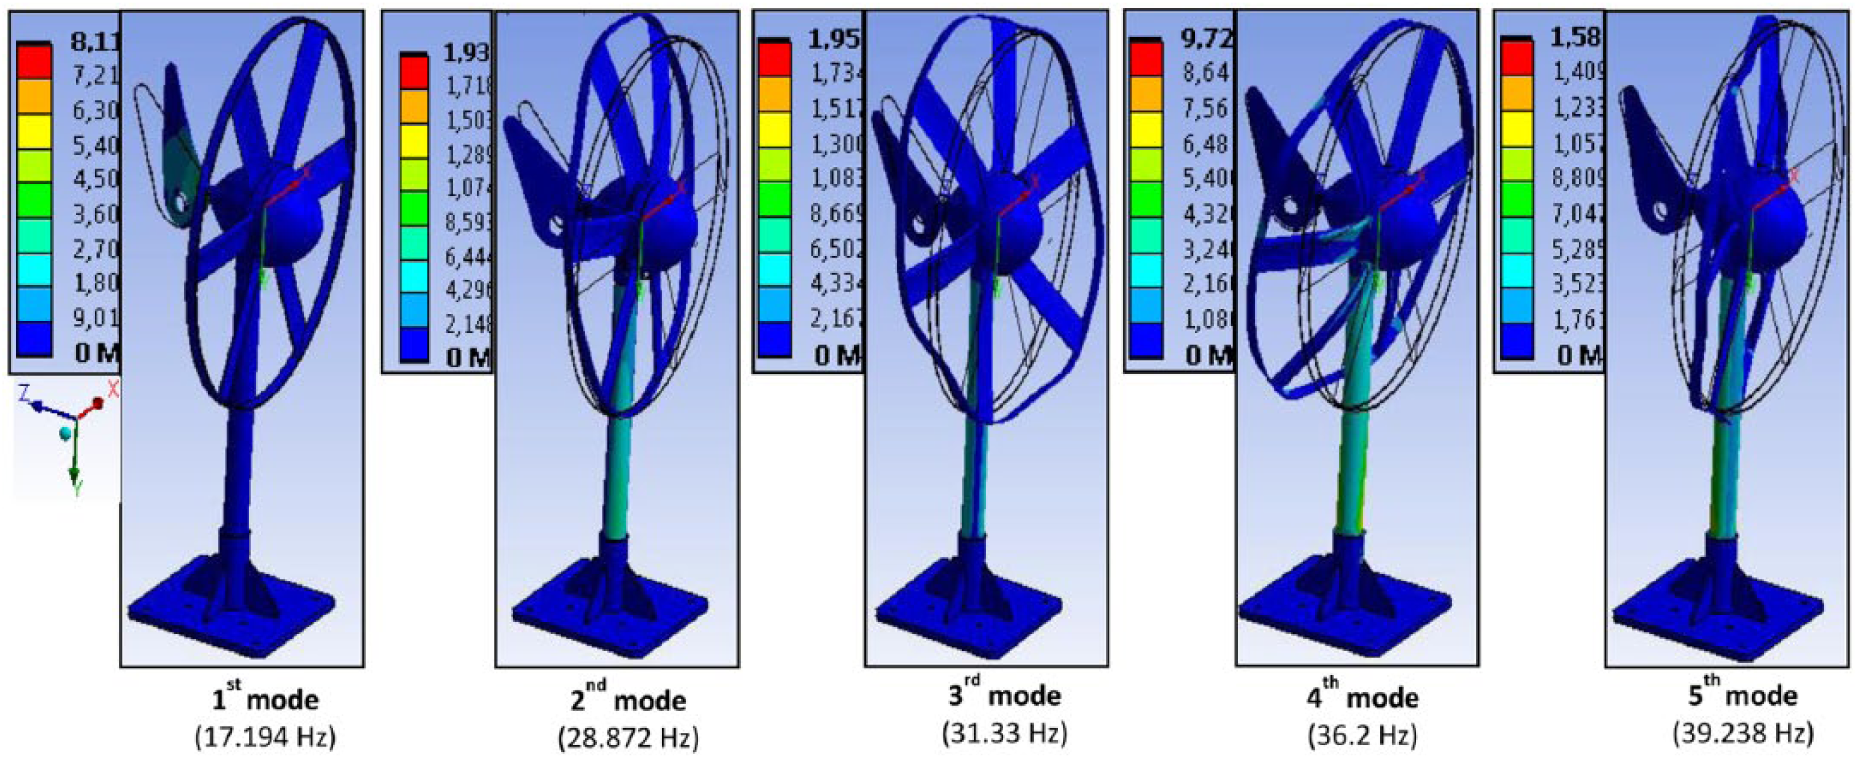
Equivalent stress calculated by ANSYS relative to first, second, third, fourth, and fifth modes.
Mises stress related to next mode shapes has also been extracted in order to recognize the other components of the turbine tower–foundation system affected by stress. Figure 13 shows the distribution of stress due to the next five modes (from 6th to 10th mode). Maximum stress caused by sixth mode is 2.5 kPa in the tail. Then, for seventh mode, the stress increases to 5.7 kPa in the tower. The tower carried on being the component the most affected by stress in 8th, 9th, and 10th modes with, respectively, maximum stress of 6.3, 2.1, and 1.1 kPa. It is observed that Mises stress also occurs in blade roots and then in the outer ring.
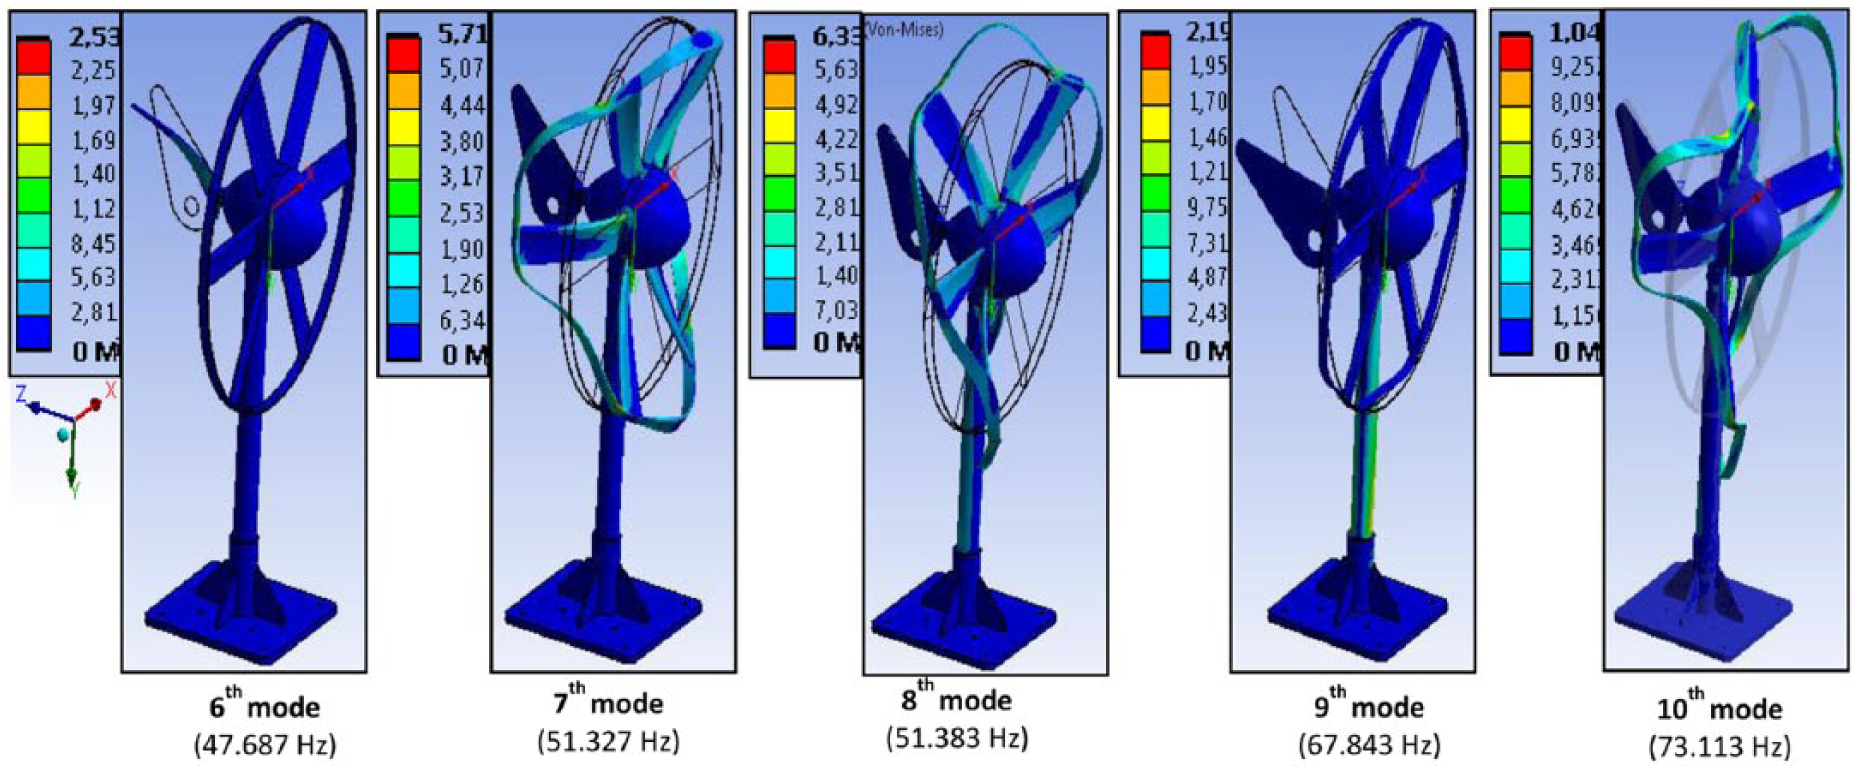
Equivalent stress calculated by ANSYS relative to 6th, 7th, 8th, 9th, and 10th modes.
Conclusion
The requirement of clean energy had paved path to the progress of numerous complex micro-turbine constructions. Like any rotating structure exposed to important aerodynamic drag and lift loads, the knowledge of its modal parameters is required task in order to avoid fatigue, resonance, and damage. Thus, the structural behavior of 3D geometries of these turbines with extra components like rings, noses, and tails has to be studied. In this context, the dynamic characterization of a modern aerodynamic micro wind turbine (Rutland 504 wind turbine) is investigated in this article based on FVM. First, mode shapes and natural frequencies of turbine tower–foundation system are identified for resonance assessment using both numerical and experimental methods. Vibrations and deformations of the system components are extracted for each mode under free vibration conditions. It is realized that maximum vibrations and deformation started in the tail of the structure. Then, gradient increasing deformations and displacements move from roots to tips of blades and the ring. This is explained by the specific geometries and materials of blades and ring. Moreover, Mises stress distribution is sketched relatively to different natural frequencies. The components the most subjected to stress and fatigue ruptures are identified in an increasing order: the tail, then the tower, then roots of blades, and finally the ring. The study also shows that the acceleration measurement can be used in modal parameters calculation. Furthermore, the method can be applied for large-scale turbines. The proposed study offers valid results for assessing the vibrational performance of horizontal-axis ringed micro-turbines with bigger size.
The obtained vibrational parameters can then be involved in structural monitoring and diagnostic of micro wind turbines. Indeed, monitoring the calculated modal parameters of the tested wind turbine will be used in the detection and isolation of damages affecting the structure in a future work. In fact, the supervision of modal parameters is involved in diagnosis tasks under many faulty conditions introducing additional vibrations to the structure. Furthermore, the validated numerical model may be used for fatigue analysis of the basic components of the wind turbine.
Footnotes
Acknowledgements
This work was realized in an experimental platform conjointly financed by the FEDER fund, the Ile-de-France region, the Val-d’Oise department, and the Urban Community of Cergy-Pontoise (France), which are appreciatively acknowledged.
Declaration of conflicting interests
The author(s) declared no potential conflicts of interest with respect to the research, authorship, and/or publication of this article.
Funding
The author(s) received no financial support for the research, authorship, and/or publication of this article.