
Abstract
Typically, it is desired to operate the wind turbine at the maximum power point. However, in small wind turbines which have a storage system integrated with them, harvesting as much energy as possible is more crucial. This may be achieved by reducing the cut-in speed while maximizing the mechanical power. These two goals may be achieved by optimizing the turbine blades. In this article, the turbine blades are optimized using improved blade element momentum theory including Viterna-Corrigan stall model with the objective to yield low cut-in speed and high power level. Using the blade element momentum analysis, the power coefficient curves as functions of tip-speed ratio at various range of wind speeds are obtained for the optimized turbine. Using MATLAB/Simulink tool, a wind energy system, which consists of a wind turbine, permanent magnet synchronous generator and a resistive load, is simulated. The curves obtained from the blade element momentum analysis are used to emulate the wind turbine. The results obtained from the simulation are compared to experimental results. It is noticed that the wind turbine may be optimized to harvest more energy.
Keywords
Introduction
Nowadays, our power system is evolving on form of interconnected microgrids. The microgrid is a group of microsources, storage units, and loads. The microgrid is able to supply the local loads via renewable and conventional energy sources. The conventional energy sources are that depends on burning of fossil fuels in their operation mechanism like oil, coal, and gas. This, in turn will result in reducing these resources revenue whenever there is an increasing energy demand while increasing the CO2 emission. To resolve the problem caused by using fossil fuel power plants, renewable energy sources should be used (Aldricy et al., 2018; Khalil et al., 2016; Shankar et al., 2016; Tahir et al., 2017a, 2017b; Yahyaoui et al., 2016; Mraoui et al., 2016).
Wind energy is one of the most promising sources of renewable energy (Aldricy et al., 2018; Shankar et al., 2016; Tahir et al., 2017a, 2017b). Wind turbines may be grid connected or independently operated from isolated locations. The wind turbine extracts energy from the kinetic energy of the wind and then that energy is converted into a usable form of electrical energy by a generator (Tahir et al., 2017a, 2017b; Martinello et al., 2016).
Wind turbines are divided into small, medium, and large wind turbines. Large wind turbines are of megawatt (MW) power range and incorporate complex systems. Wind farms typically consist of several hundreds of these large turbines. On the other hand, medium size wind turbines commonly provide between 20 and 300 kW installed power. These turbines usually have a blade diameter of 7–20 m, and the tower is not higher than 40 m. The output power rating of small wind turbines is less than 20 kW. These turbines are designed for low cut-in wind speeds (generally 3–4 m/s). One of the available and realistic usage of these turbines is for residential applications. Also, they are suitable for remote places, where the grid is far away and the power transmission is difficult. Their blades are about 1.5–3.5 m in diameter and produce 1–10 kW of electricity at their optimal wind speed.
In a study by Aldricy et al. (2018), a practical design of a small horizontal wind turbine (HWT) is investigated. The turbine is mainly composed of turbine blades, a gearbox, a DC generator, and electrical controller. These components are designed experimentally in the lab. The main advantages of this system are that it has a relatively low cost, operates at low speed at about 2 m/s, and it can be easily controlled. At wind speed 7.5 m/s, the wind power, power coefficient, and tip-speed ratio (TSR) values were 698.6 W, 0.3825, and 3.3510, respectively. Wind tunnel performance for different wind velocity, TSR, and solidity as well as rotor blade surface is evaluated experimentally by Howell et al. (2010) whether the surface roughness on the turbine rotor blades has a significant effect on performance. The performance coefficient is observed as a significant increase for three-bladed rotors over most of the operating range where the test is done for both two and three blades (Howell et al., 2010).
Wind turbines can be classified into two categories based on the axis about which the turbine rotates: horizontal axis wind turbine (HAWT) and vertical axis wind turbine (VAWT) (Patil, 2011; Rathod and Kamdi, 2014). In present time, the HAWT’s configurations are more common and highly used in electricity production, and proved to be more efficient. Moreover, VAWT usually is incapable of self-starting at low TSR (Baker, 1983). A typical HAWT consists of major parts including blades, rotor, nacelle unit, tower, and gearbox. Improving the efficiency of HAWT through its blade configuration is being the subject of interest nowadays. Wind turbine blade design optimization has been one of the ongoing research and industrial practices during the last two decades (Jureczko et al., 2005). The blade sectional shape in HAWT generally, formed of airfoils, in which lift and drag forces are generated. The blade geometry controls the torque and the power generated by the rotor. Thus, choosing the appropriate airfoil for HAWT’s blade plays a crucial role in maximizing the output power and enhancing the overall efficiency (Hsiao et al., 2013).
Numerous computational approaches have been applied to aerodynamic design of wind turbines such as blade element momentum (BEM) theory, vortex wake method, and computational fluid dynamic (CFD). Among these computational approaches, the BEM theory is proven to be the best for HAWT’s blades optimization and the most widely used and acceptably efficient approach for wind turbine blade design and analysis (Hsiao et al., 2013). Many codes have been developed to simulate the aerodynamics of HAWT based on the BEM theory. Lanzafame and Messina (2007) used the simple BEM theory to predict the performance of S809 NREL PHASE VI rotor. A difficult task in the implementation of the simple BEM theory is the correct representation of the lift and drag coefficients at post-stall regime. In a study by Hassanzadeh et al. (2016), the BEM based on the Viterna equations is incorporated for extrapolating airfoil data into the post-stall regime, and the results were compared with various mathematical models. Results showed the high capability of this method to predict the performance of wind turbines.
In a study by Bontempo et al. (2017), the impact of the standard approximations embodied in the well-known momentum theory on its performance prediction capabilities and the results of the momentum theory were compared with those obtained with an actuator disk model based on CFD techniques. Bai et al. (2013) designed small 10 kW HAWT using the BEM theory and the modified stall model, and the blade aerodynamics were also simulated to investigate its flow structures and aerodynamic characteristics. Therefore, this article will discuss the optimization of existed small 500 W HAWT Hummer model by utilizing the improved BEM theory including Viterna-Corrigan stall model, tip-loss factor, and stall delay model that has been developed for predicting the performance of the designed turbine blade. The concentration in this work is on finding the suitable airfoil geometry. Different airfoils such as S809, NACA0012, NACA0018, and NACA63-412 were examined in pursuit of reducing the cut-in speed and maximizing the output power. The optimum distributions of the chord length and the pitch angle in each section can be acquired according to the design parameters, which include the rated wind speed, number of blades, design TSR, and design angle of attack (Manwell et al., 2009).
BEM theory
The original BEM theory, developed first by Glauert (1935), combines blade element theory, which is based on the airfoil aerodynamic characteristics and the momentum theory, which subdivides the blade as a number of independent stream tubes with dr thickness and ignores the spanwise flow (Manwell et al., 2002). In the BEM theory, the airflow through the rotor is assumed axisymmetric. By applying the equations of momentum and angular momentum conservation, for each infinitesimal dr sector of the blade, axial force and torque can be defined as equations (1) and (2).
The axial force on the blade element of dr width is

The torque on the blade element of dr width is

The lift coefficient Cl and the drag coefficient CD depend on the shape of the airfoil and the angle of attack. They considered very significant in specifying the forces and torques according to equations (1) and (2). The rotor geometry such as the chord length and rotor radius are iterated to evaluate the rotor performance. The axial and tangential induction factors a and a’ can be found as follows
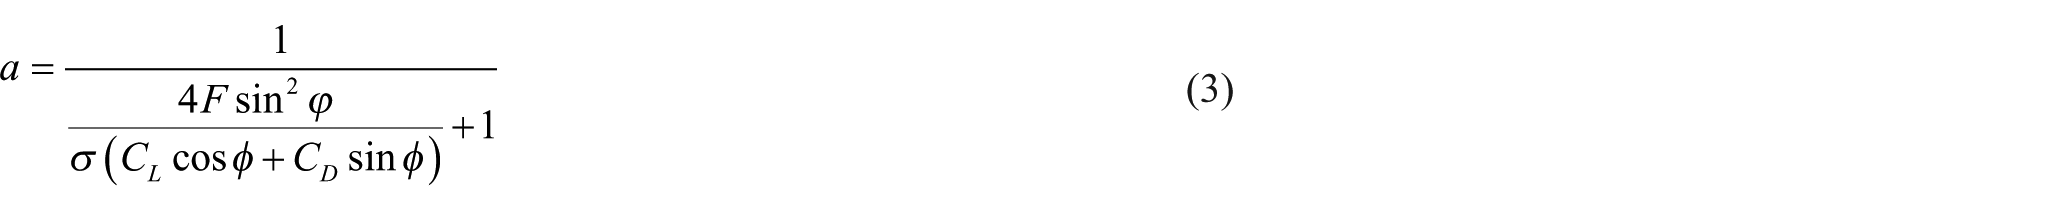
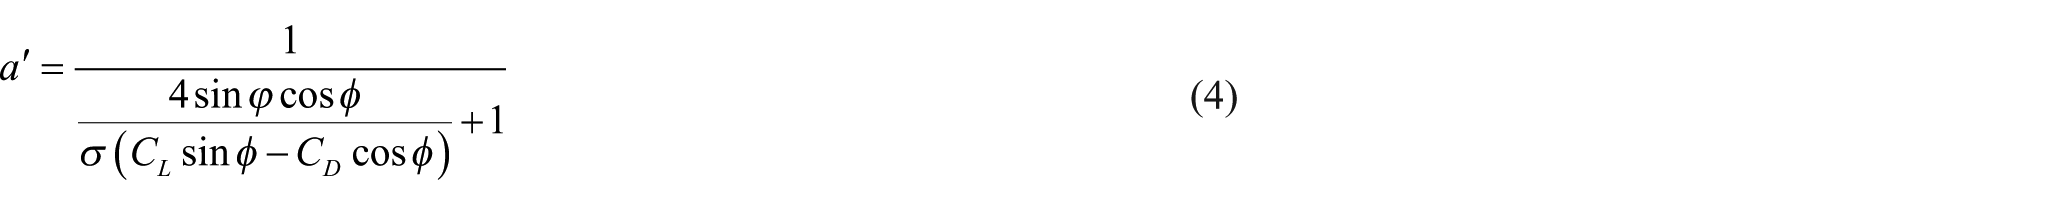
where F is the Prandtl tip-loss correction factor. An approximate formula for the Prandtl tip-loss function was introduced by Glauert (1935) as

where σ is the local solidity defined as follows

For axial induction factor greater than 0.4, equation (3) does not give reliable results, and another formula suggested by Buhl (2005) is used

In order to estimate airfoil behavior at high positive and negative angles of attack, other methods must be employed. A method based on the Viterna equations is used for extrapolating airfoil data into the high lift/stall development regime (Hassanzadeh et al., 2016).
For αstall ⩽ α ⩽ 90°, the drag and lift coefficients are calculated as follows


where


For angles of attack between 90° and 180° (positive or negative), the lift and drag coefficients are approximated as the flat plate/fully stalled regime values (Vesel, 2012)


Rotor blade optimization
Previous three-bladed HAWT rotor is optimized in this section using the BEM. Several blade airfoils have been tried and for each chosen airfoil, the blade is optimized in terms of chord length distribution and twist angles in every section of the blade. Figures (1) and (2) show the optimized blade chord lengths and twist angles for NACA0012, NACA0018, S809, and NACA 63-412.
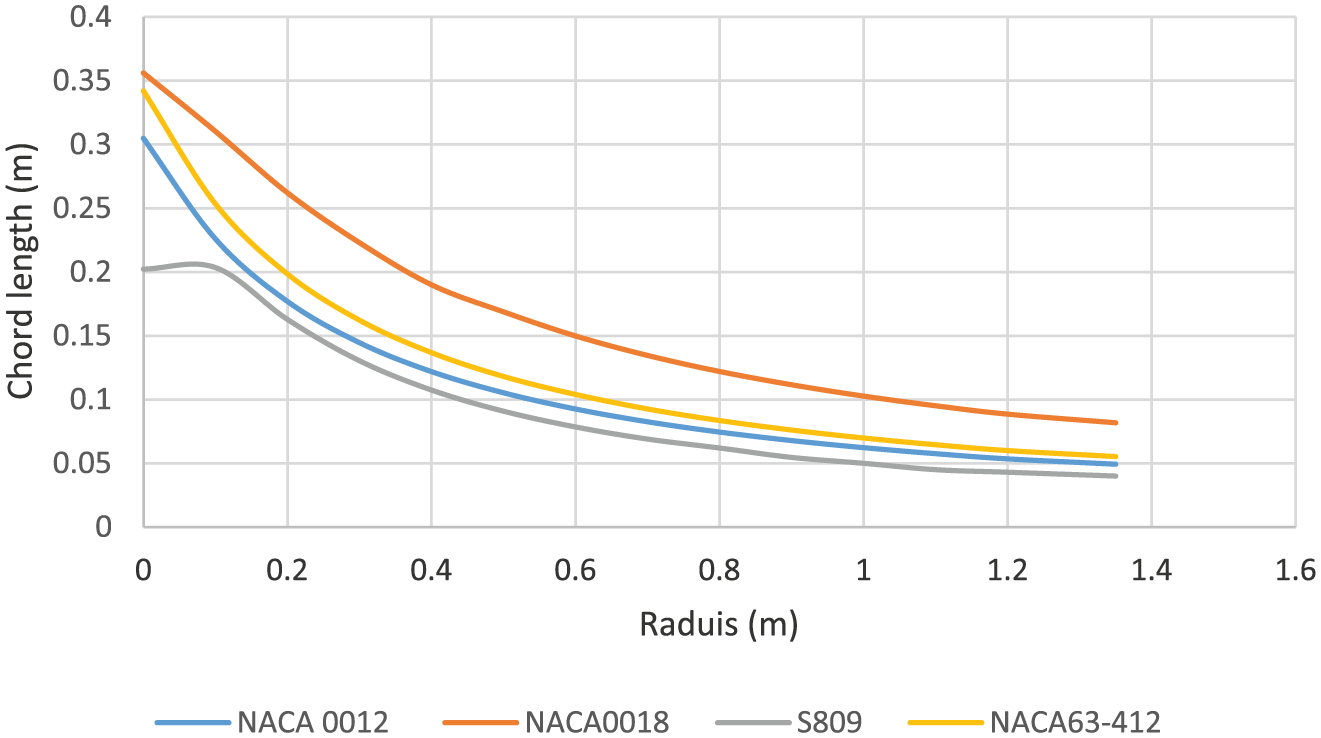
Chord length distribution along rotor blade radius for each examined airfoil.

Twist angle distribution along rotor blade radius for each examined airfoil.
For every airfoil shape, there are certain chord lengths and twist angle distribution along the blade that will give the optimum energy extracted from the wind. A number of iterations have been conducted in the BEM theory to attain the final optimized blade for each airfoil. For most small wind turbines with three blades, the TSR at the design wind speed is in the range of 6–8 (Tabesh and Iravani, 2006). Therefore, the design TSR is chosen to be 7 in this case of the study. The average wind speed measured at the site of designed turbine is approximately 7 m/s, thus we choose this value as the design wind speed.
Figure 3 depicts Cp versus TSR curves for three-bladed rotor of each selected airfoil. The simulation is carried out at average Reynolds number of 500,000, which is considered being suitable in our small turbine. In general, NACA 63-412 rotor shows the highest power coefficient and has a very wide range of operation. Thus, NACA 63-412 seems to be the best among the other three types and thus has been chosen to construct our three-bladed small turbine.
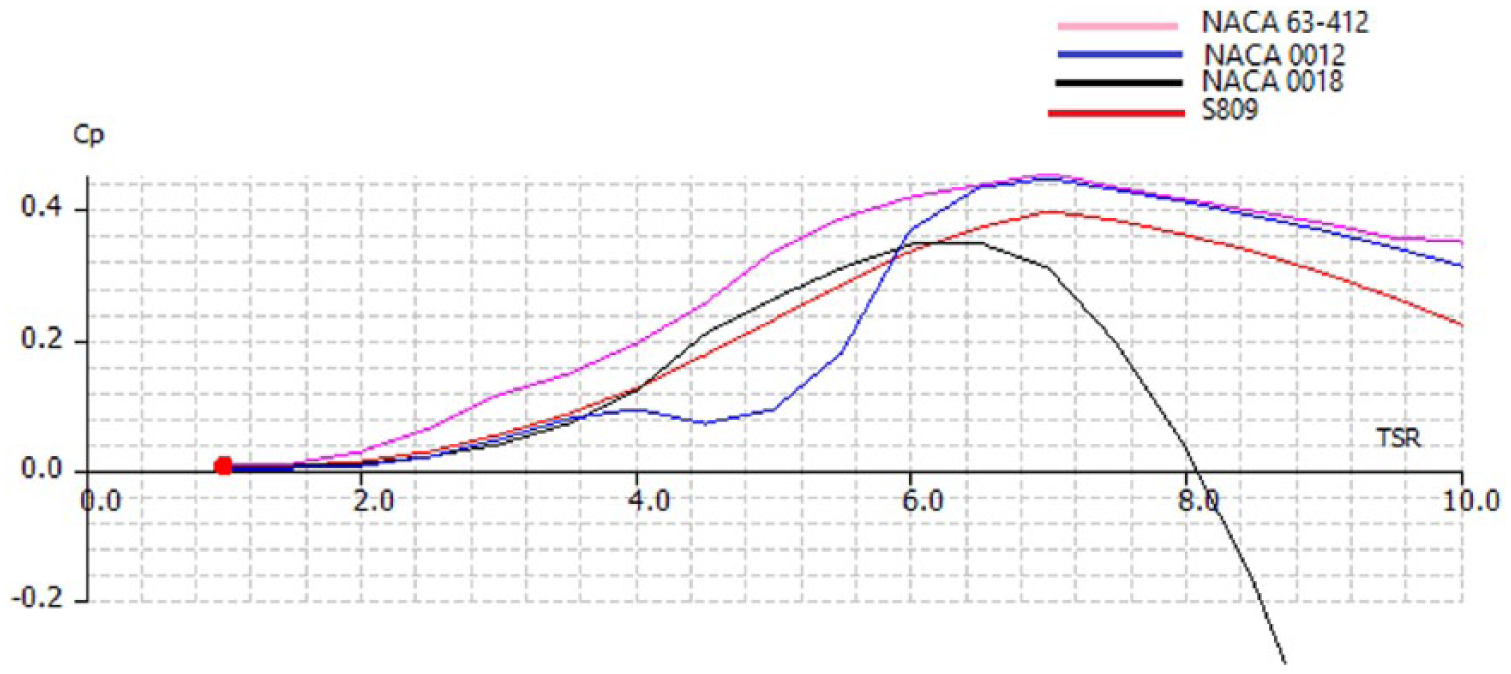
Power coefficient for the three-bladed rotor with the different examined airfoils.
The finalized blade configuration for NACA 63-412 airfoil with rotor tip radius 1.35 m is exhibited in Figure 4.
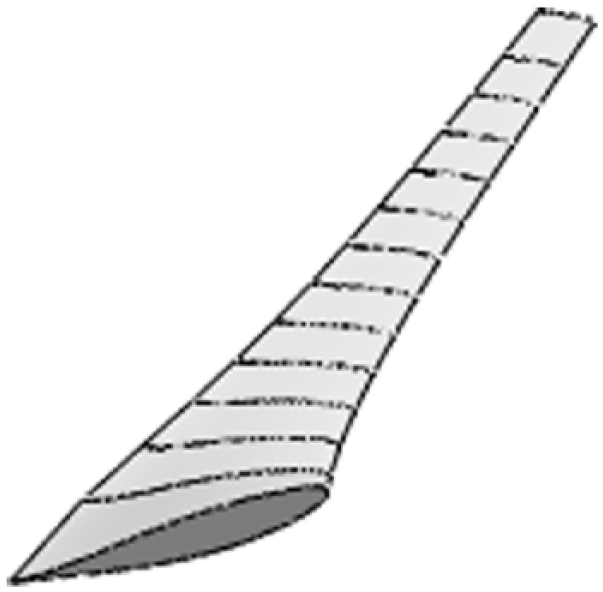
NACA63-412 optimized blade sections.
The power curves of the three-bladed NACA 63-412 rotor for range of rotational speeds 100–1000 r/min are exhibited in Figure 5 at several wind speeds ranging from 1–10 m/s. Investigating the power curve at the expected average wind speed average of 7 m/s shows that a maximum power of nearly 650 W can be achieved at 300 r/min.

Power curves vs rotational speed for wind speed range from 5 to 10 m/s.
The NACA 63-412 rotor also simulated at lower wind speed, and the power curves verses the rotational speed are illustrated in Figure 6.
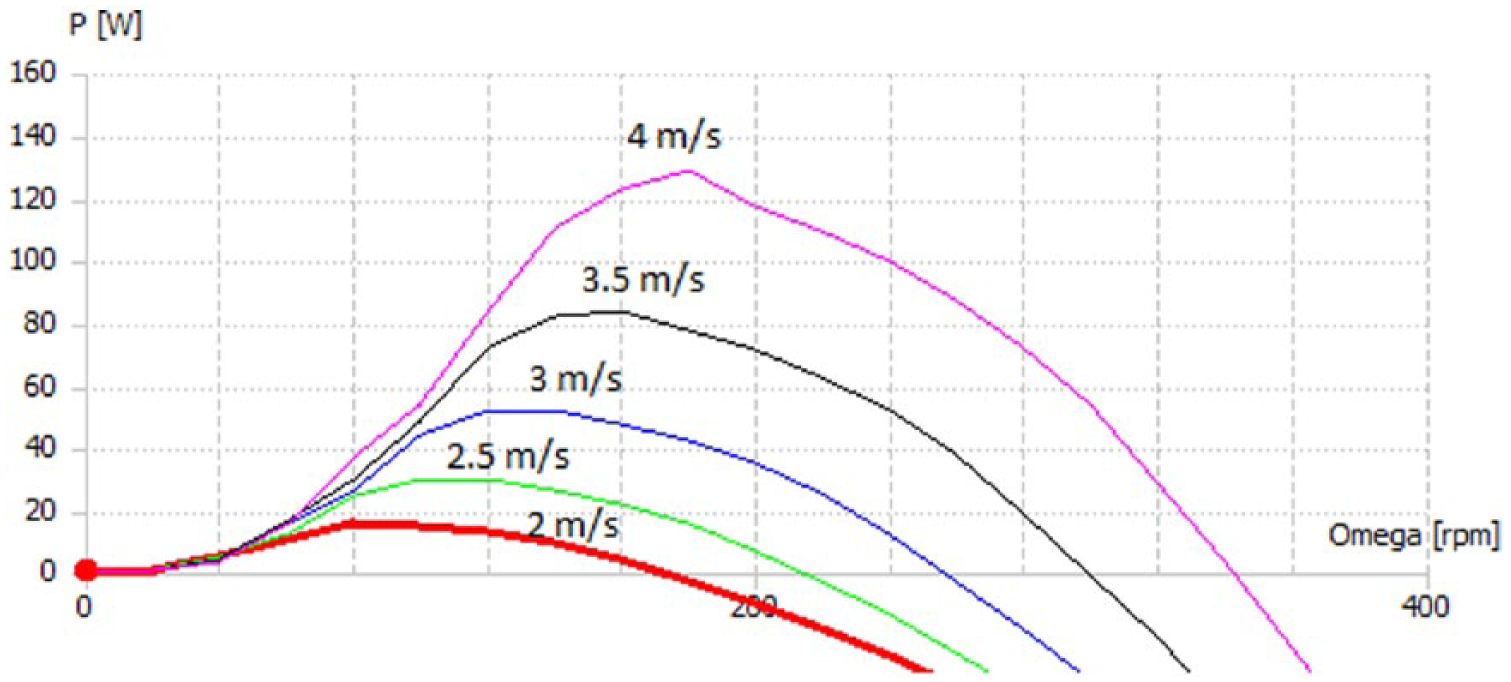
Power curves vs rotational speed for wind speed range from 2 to 4 m/s.
It is obvious from Figure 6 that the optimized three-bladed turbine using NACA 63-412 can generate useful power at low wind speed of 2 m/s.
Components of the wind energy system
The small wind energy system which was constructed practically consists of the following components:
Rotor
Wind turbines may be categorized into two types, based on the turbine axis: HAWTs, which are more common and the VAWTs which are less commonly used. The rotor, designed at height of 3.12 meters, is an important part of wind turbines (HAWT), where wind energy is converted to mechanical energy in terms of mechanical torque (T) and rotational frequency (ω).
Blades
A small wind turbine is composed of a three-blade system as depicted in Figure 7. The PVC blades are designed to operate at relatively low wind speed around less than 8.2 m/s. The tower is the main component that carries most of other components such as the turbine nacelle, blades, and generator. Its length was around 3.5 m.
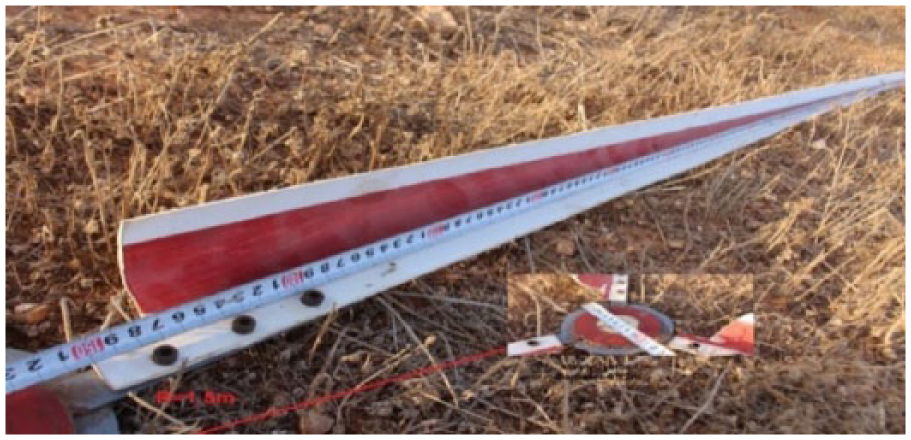
Blade dimension of the wind turbine.
Safety breaker
We have provided the turbine with a device that controls the rotation of the blades to regulate the rate of rotation and to stop movement if necessary or in case of electrical failure or excessive increase in speed.
Yaw control mechanism
When the wind direction is changed, a yaw drive is utilized with tail vane to track the wind and to blunder in any part of the wind that could blow. This mechanism is depicted in Figure 8 and is used instead of using yaw motor which consumes energy. This mechanism depends on the tail in the steering to keep the blades facing into the wind. Other designs operate in a downwind mode so that the wind passes the tower before striking the blades which does not have any tail vane.
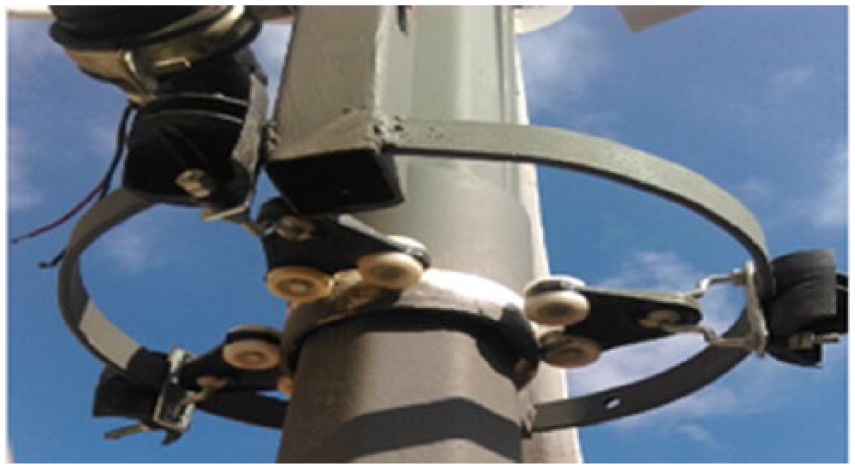
Yaw mechanism system.
Gearbox
The mechanical dynamics of the wind turbine may be modeled as two rotating masses, which represent the rotor of the wind turbine and the generator rotor shaft. The coupling between these rotating masses can be achieved either through a gearbox or through direct coupling. The wind turbine designed in this study consists of three rotary blades on a main shaft with high mechanical torque and low rotating speed. A gearbox forms the transmission of power at low torque and high speed to the shaft connected to the rotor of a permanent magnet (PM) DC machine as depicted in Figure 9. In addition, there are large bearings supporting the shaft which will introduce a little friction. The overall efficiency of these mechanical components is called the mechanical efficiency.
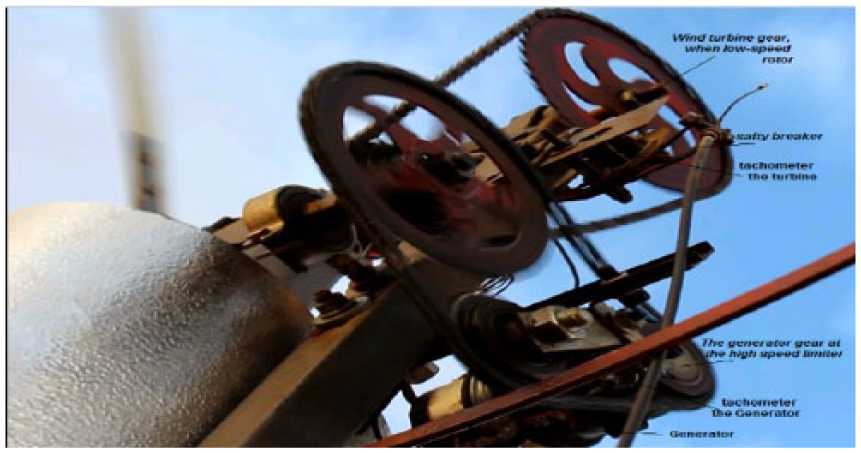
Gearbox.
Electrical generator
The generator, which is shown in Figure 10, is used to convert the kinetic energy of the wind into electrical energy, but indirectly. When the wind passes through the blades, a dynamic airflow is created which causes the rotations of the blades. The gearbox is used to couple the turbine, which rotates at low speed, with the alternator, which rotates at a relatively high speed. The maximum rotational speed of the generator is about 400 r/min at 24 V.

Permanent magnet DC generator (PMDC).
DC–DC converter
As illustrated in Figure 11, a DC–DC boost converter is an interface with proposed wind system to step up the generator output voltage and maintain constant output voltage on the load side. The fluctuation nature of wind makes the wind turbine unsuitable for standalone operation. To overcome this drawback, an energy storage device is used in the proposed system to compensate for the fluctuations and to maintain a smooth and continuous power flow in all operating modes to the load. The converter may operate as a boost converter which supplies energy to the load when the wind generator output power is greater than the required load power. It also operates as buck converter which charges the battery from the DC bus when output power is less than the required load power.
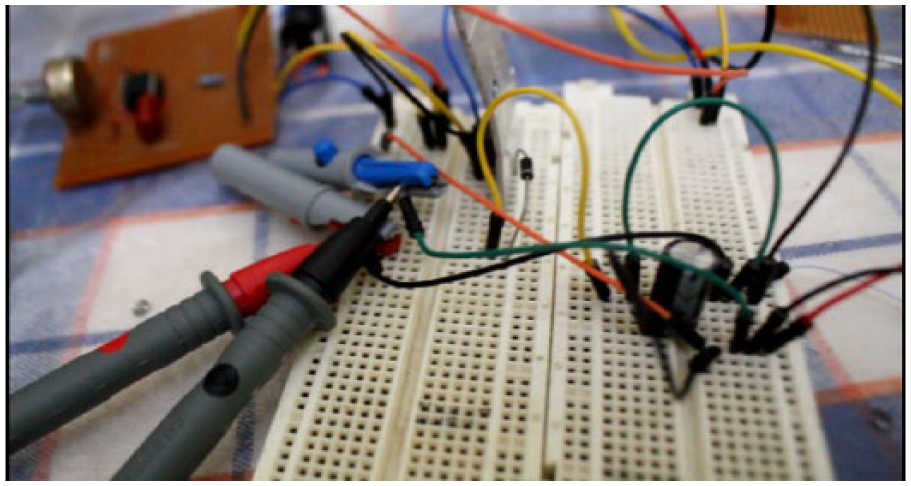
The boost converter circuit experiment.
Inverter
The system equipped with a single-phase inverter which is used to convert the DC output voltage from the converter to an AC voltage with a constant frequency and constant magnitude. The DC/AC converter is necessary to bring DC output of PV system to the AC load or to the grid. The inverter circuit is illustrated in Figure 12.
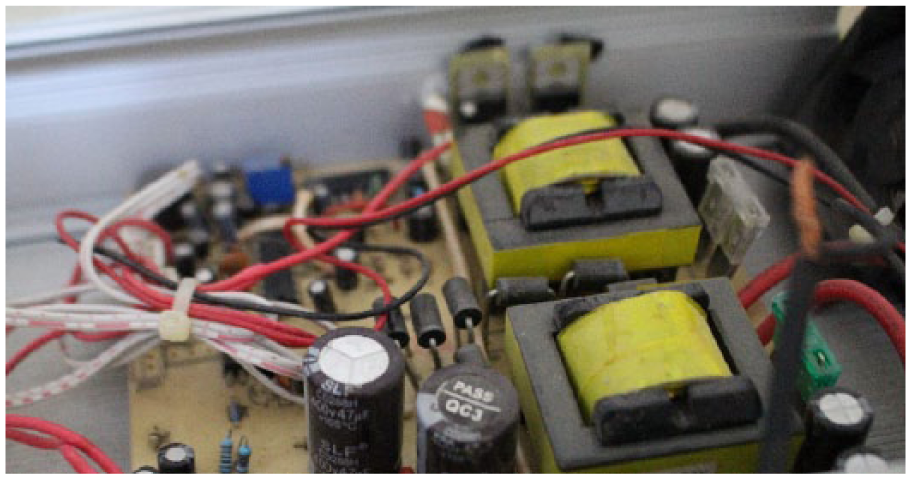
Inverter unit.
The control system which is composed of DC–DC converter and the inverter circuit with the charge controller is shown in Figure 13.
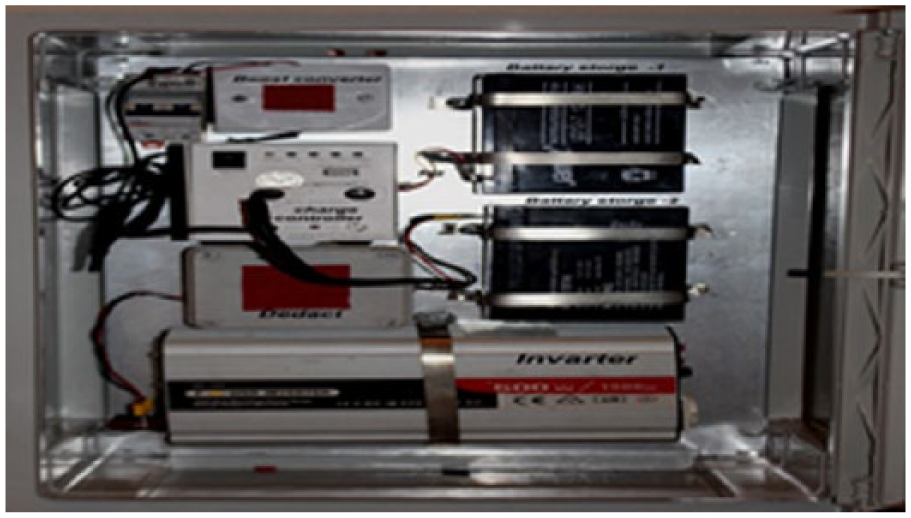
Control system panel.
Simulation and results
To evaluate the performance of the wind turbine, the wind energy system which consists of a wind turbine, PM generator, and a resistive load is implemented using MATLAB/Simulink model as depicted in Figure 14. The power versus speed characteristics obtained in the previous sections are used to emulate the wind turbine.

Simulink model of the wind energy system.
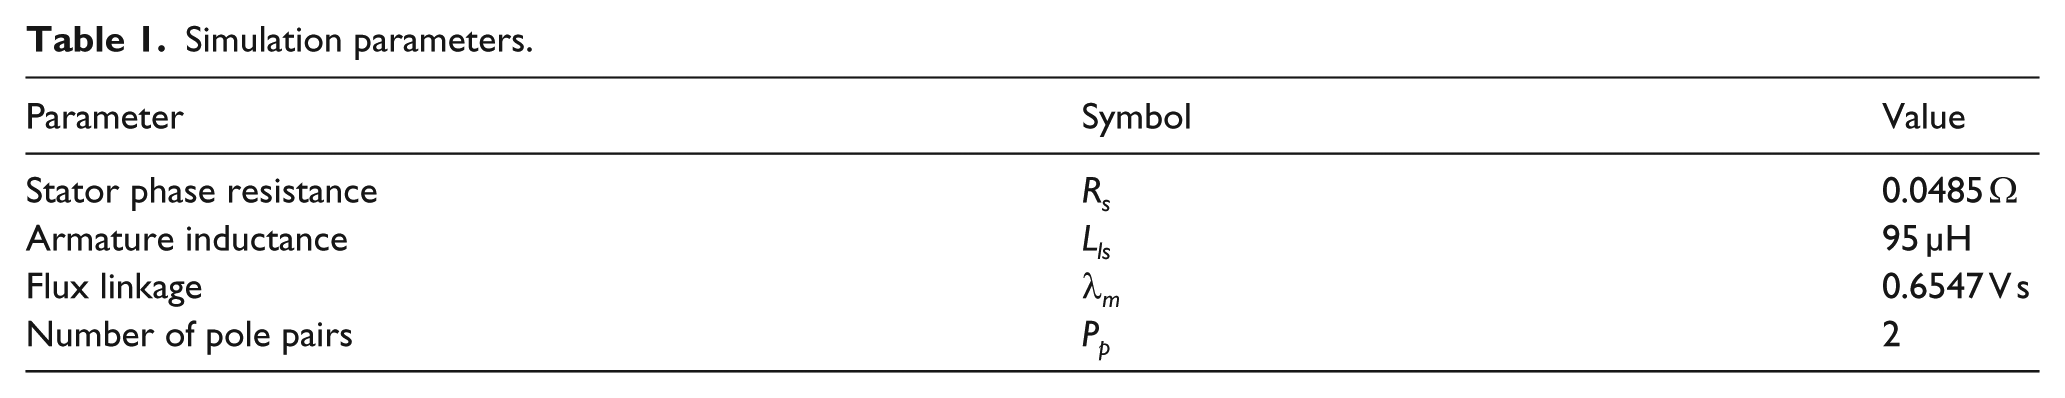
The simulation parameters are presented in Table 1.
Simulation parameters.
The simulation is performed after using the curves obtained using the improved BEM analysis to emulate the wind turbine and assuming that the wind speed is 7.5 m/s. The PM generator speed and electromagnetic torque are depicted in Figure 15.
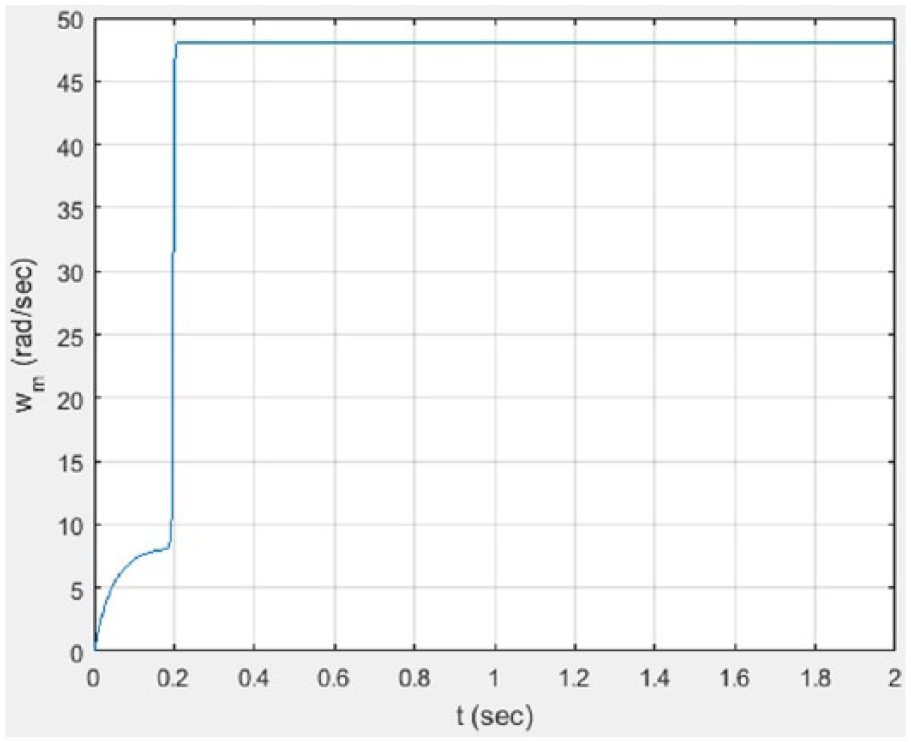
The PM generator speed at a wind speed of 7.5 m/s.
It is also noticed that although the optimized blade has a length of about 1.35 m, which is significantly less than the length of the old blade (1.5 m), the power generated at a speed of 7.5 m/s is more than the power generated by the old blades at the same wind speed as depicted in Figures 15 and 16, respectively. This performance proves that the existing hardware system is still not optimized as far as the turbine blades are considered.

The PM generator electromagnetic torque at a wind speed of 7.5 m/s.
Conclusion
In the work considered herein, a practical design of a wind turbine was presented. However, it was noticed that the turbine blades in this were not optimized. Therefore, an analysis based on the improved BEM method is used to obtain the optimum shape of the blades. The power coefficient versus TSR curves that correspond to these optimized blades are generated and used to emulate the wind turbine. Using MATLAB/Simulink tool, the simulation of the wind energy system using the optimized turbine was conducted. It was noticed from the results that the optimized turbine yielded an improved performance of the wind energy system compared with the practical results obtained from the existing wind energy system.
Footnotes
Declaration of conflicting interests
The author(s) declared no potential conflicts of interest with respect to the research, authorship, and/or publication of this article.
Funding
The author(s) received no financial support for the research, authorship, and/or publication of this article.