
Abstract
Accurate wind speed forecasting is important for stable operation of the power system when large-scale wind power is connected to the grid. According to the randomness of wind speed caused by the interaction of weather attributes, this article presents a new wind speed interval prediction method by improved regularized extreme learning machine based on attribute reduction. First, the principal component analysis is used to extract the principal component score sequences of multi-dimensional meteorological attribute factors, and the principal component score sequences are weighted by the variance contribution rate. Then, the original wind speed series is processed by fuzzy information granulation to obtain three components, which represent the minimum value, maximum value, and variation trend of the wind speed interval. The weighted principal component score sequence and the wind speed fuzzy granulation component are used as the input model of the prediction model, and the gradient prediction is performed using the improved regularized extreme learning machine of the gravity search algorithm. Finally, the prediction effect of the proposed method is simulated and analyzed based on the measured data of the wind farm. The results show that the combination prediction method can effectively improve the operational efficiency and accuracy of wind speed prediction, and has strong generalization ability.
Keywords
Introduction
Wind power has remarkable randomness and uncertainty. High wind power permeability will have a serious impact on economic dispatch and safe operation of power system (Liu and Zheng, 2016; Tian et al., 2016). The research on wind speed prediction has important practical significance and theoretical value (Shi and Pan, 2014; Yang et al., 2016).
Short-term wind speed prediction models include physical model (Feng et al., 2011), statistical model (Ding et al., 2017), artificial intelligence model (Schicker et al., 2017), and combinatorial model (Bai et al., 2015; Zhang et al., 2017). The physical model depends on the data of air pressure, temperature, humidity, and other attribute factors (Yang et al., 2012), but the dimension of attribute information is high and the operation efficiency is low. The statistical model is based on the implicit law of the measured wind speed data to construct the mapping relationship. The model is simple in modeling and fast in calculation, but the prediction accuracy of the low-order statistical model is low, and the related parameters of the high-order statistical model are difficult to determine. Artificial intelligence model can realize nonlinear intelligent prediction, in which extreme learning machine (ELM) has the advantages of simple parameter setting, strong learning ability, fast calculation speed, and easy convergence (Kong, 2016; Zhang et al., 2016), but the traditional ELM input-implicit interlayer weights and bias random generation have a great influence on the prediction effect. In Li et al. (2016), the autoregressive moving average model was used to generate the pulsating wind speed database, and the short-term wind speed was predicted by the ELM, but the parameters were not selected. In Wang et al. (2014), an interval combination prediction method of wind power fluctuation based on fuzzy information granulation (FIG) and least square support vector machine is proposed, but the evaluation index is relatively single. In Fan et al. (2017), the wind was built by using the correlation vector mechanism. The prediction accuracy of speed interval prediction model is higher, but the calculation process is more complicated.
In this article, a new prediction method is proposed, in which the principal component score series of wind speed attribute data is extracted by principal component analysis (PCA) method, and the principal component score series is weighted according to the contribution rate of each component variance to realize the reduction of dimensions of high-dimensional attribute data. Then, the original wind speed series is granulated with fuzzy information, and the interval prediction of wind speed is carried out by using the improved regularized extreme learning machine (RELM) of gravity search algorithm (GSA). Finally, the prediction results are compared with the measured data to verify the effectiveness of the method.
Analysis of wind speed and meteorological attributes
Selection of meteorological properties
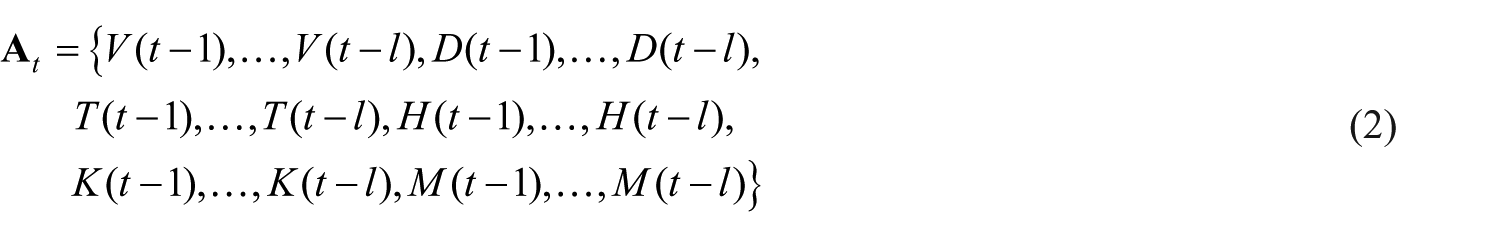
Wind speed fluctuation is influenced by many meteorological attribute factors. This article mainly studies six meteorological attribute factors, which are closely related to wind speed fluctuation, such as temperature, humidity, wind speed, wind direction, pressure, and wind speed deviation. Considering the time series characteristics of wind speed, the first three time values of each attribute factor are selected, and the 18 dimensional wind speed attribute characteristic data are taken as the initial input set of the prediction model

where
where
Attribute reduction based on PCA
Each time wind speed has n attribute characteristics, xt can be represented by n-dimensional vector, that is,
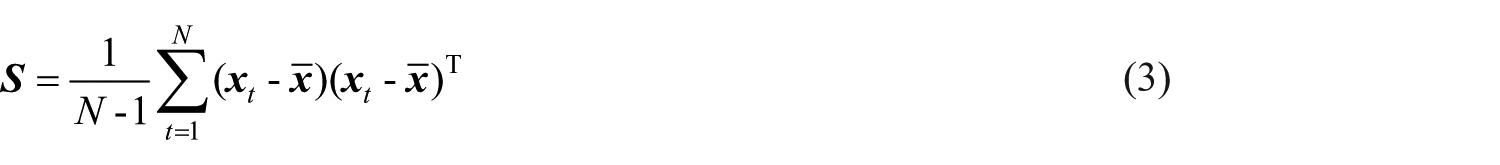
where
Let

The new input set can be expressed as
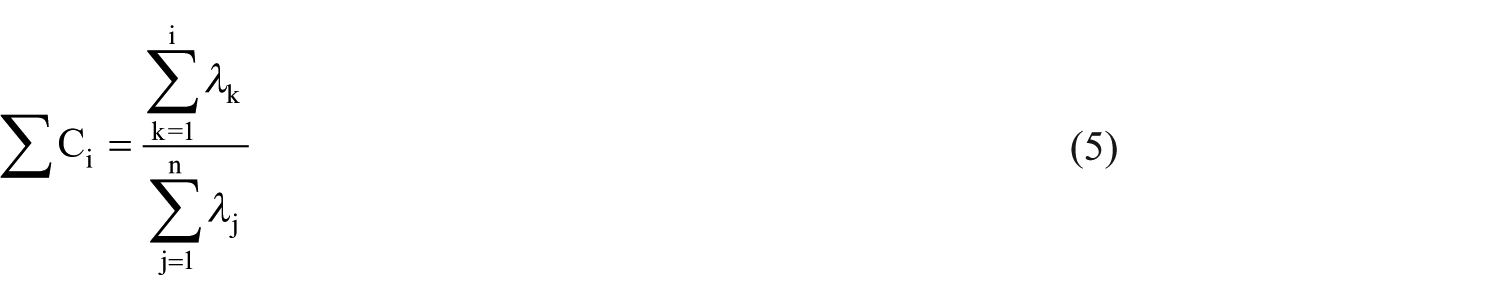
Previous studies (Yu et al., 2015) have shown that with the increase of ACR, the hidden information lost from wind speed attribute sample data decreases, but the number of principal components increases and the amount of calculation increases accordingly, and with the increase of the number of principal components, the contribution rate of subsequent components is gradually decreasing, so the criterion of determining the number of principal components q is ∑Ci which is more than 90%.
On the premise of guaranteeing the basic characteristic information of high-dimensional data, PCA can transform multiple attributes into a few unrelated principal component score sequences (Hu et al., 2014; Qi et al., 2013), and then replace the original high-dimensional data for regression prediction, to achieve the purpose of attribute reduction.
Fuzzy information graining
The wind speed series is divided into three components, low, up, and R, which represent the minimum value, maximum value, and changing trend of wind speed interval, respectively, by using FIG (Li et al., 2017), and includes two steps: window partition and blurring.
Window division: The original wind speed sequence
Blurring. A single piece of information is obtained by fuzzy granulation of window data, and a fuzzy particle Pi is selected on the window fragment ri that can fully characterize the temporal characteristics of the window

Where C is the membership function of the fuzzy concept.
Due to the need to determine the extreme value of wind speed fluctuation at each time for predicting wind speed interval, this article uses triangular fuzzy particles to granulate the fuzzy information of wind speed series (Wang et al., 2014).
Improved RELM wind speed prediction based on parameter optimization
Regularized ELM
The ELM model can be expressed as follows (Martínez-Martínez et al., 2011)
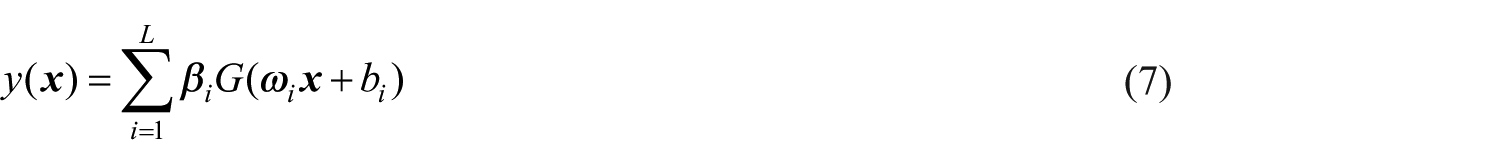
where G is the activation function,
In order to improve the prediction accuracy of the ELM network, a regularization coefficient is introduced to minimize the structural risk. The steps are as follows:
Establishing the objective function
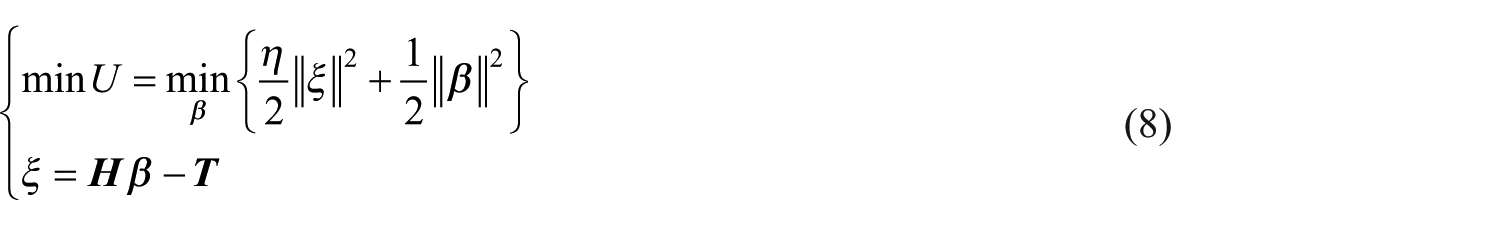
where η is the regularization coefficient,
2. Construction of the Lagrange equation

where α is a Lagrange multiplier.
3. Calculate the output weight matrix
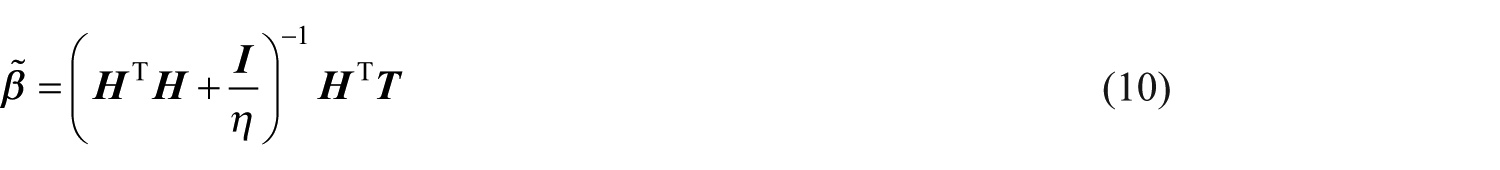
where
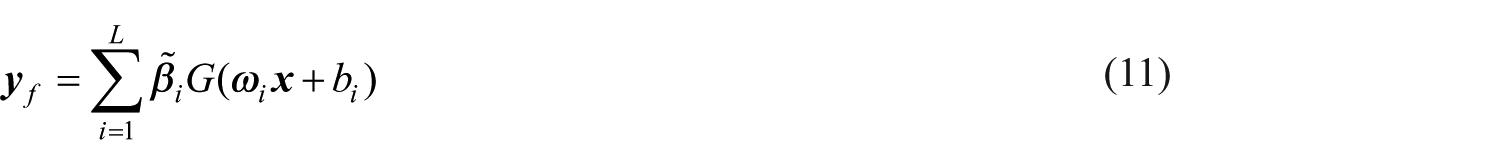
4. The mathematical model of wind speed prediction based on RELM can be obtained by substituting formula (10) with formula (7)
Gravitational search
The input-hidden interlayer weight and bias of RELM are randomly generated after the number of neurons in the hidden layer is determined. In order to avoid the randomness of parameter selection, the GSA is used to search the optimal input-hidden interlayer weight and bias. In order to achieve a better prediction result (Cheng et al., 2013), the steps are as follows:
1. Initialize parameters such as particle position and velocity.
2. Calculate the particle fitness value fit(t), and the fitness function is
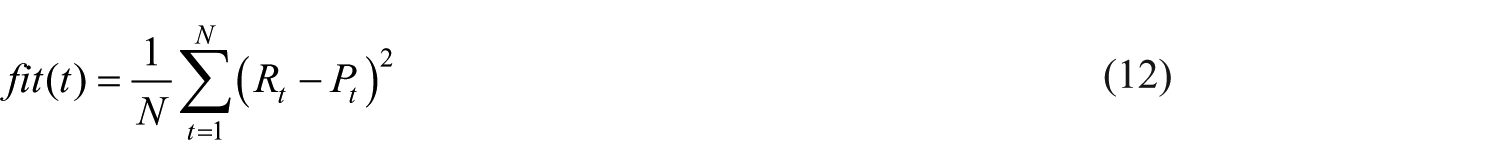
where Rt is the actual value and Pt is the predictive value.
3. Calculate the inertial mass and gravitational mass of particles
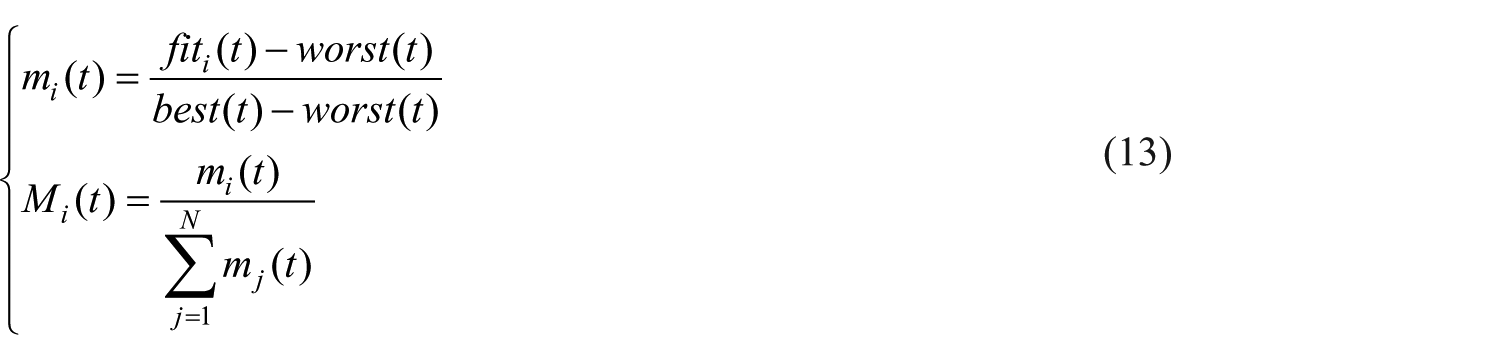
where
4. Calculate the gravity between particles i and j
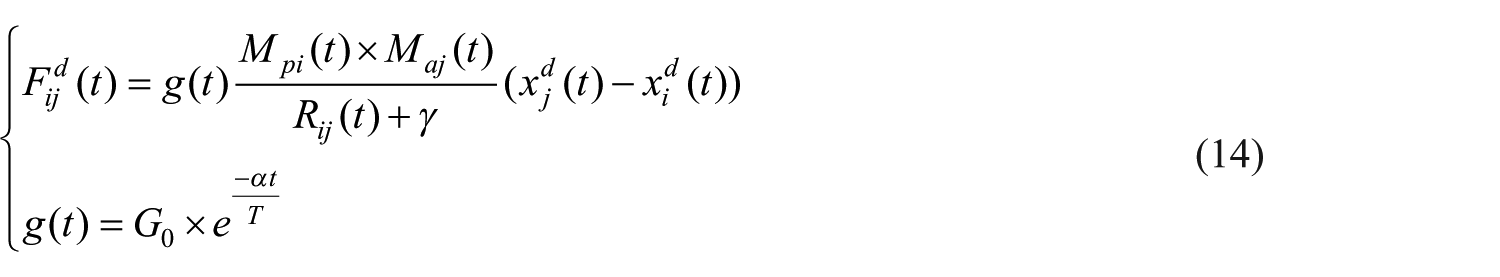
where
5. Calculate the resultant force of each particle in different directions

where randj is a random number from 0 to 1 and kbest is the first k particles arranged in descending order of particle mass.
6. Update particle velocity, position, and acceleration
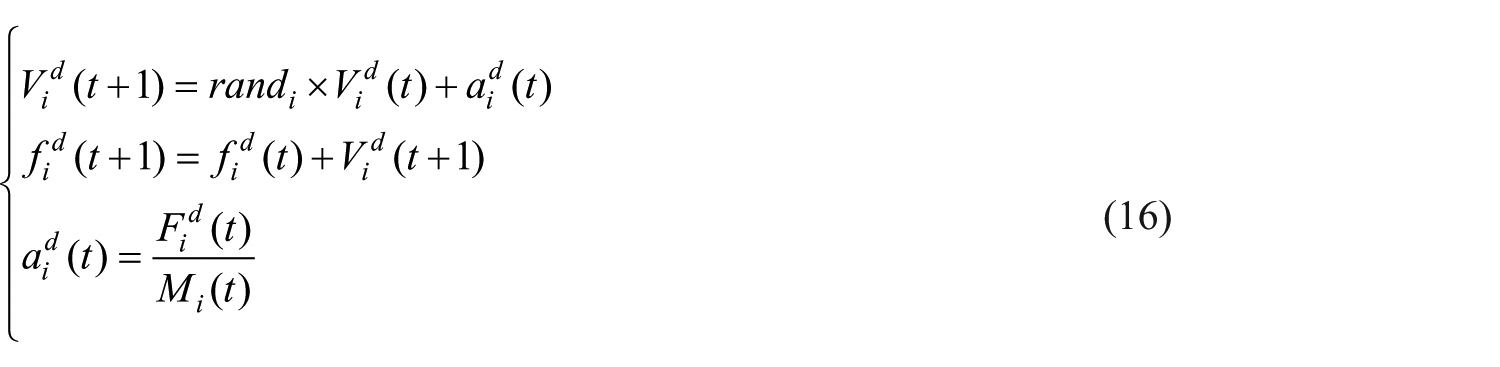
where randj is a random number from 0 to 1.
7. Start the next iteration from the second step until you reach the required precision or number of iterations.
Construction and evaluation of wind speed combination prediction method
The flow chart of the combination prediction method proposed in this article is shown in Figure 1.
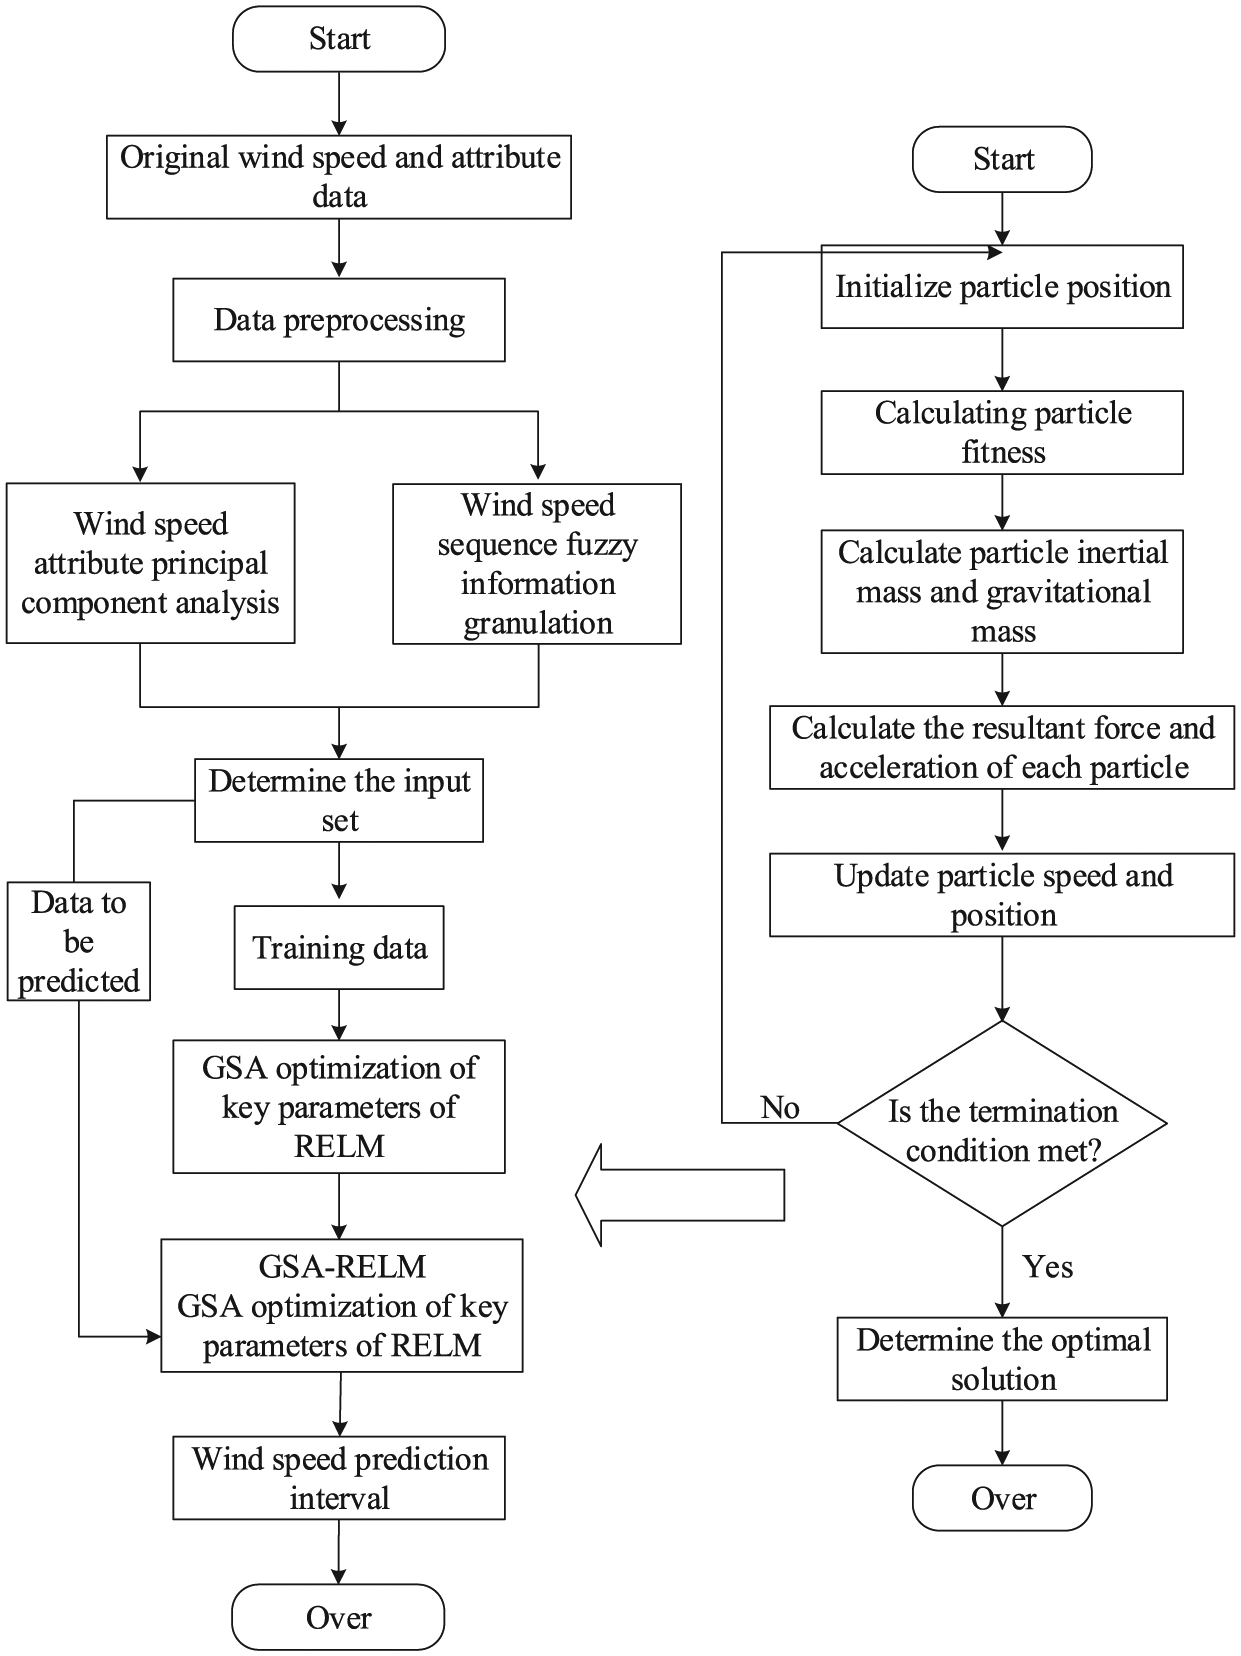
The flow chart of combination forecasting.
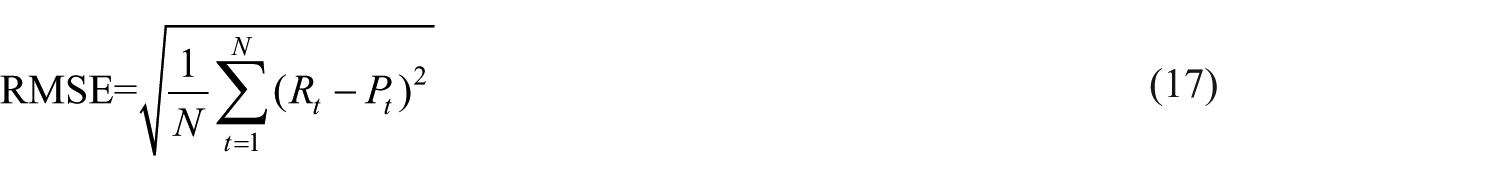
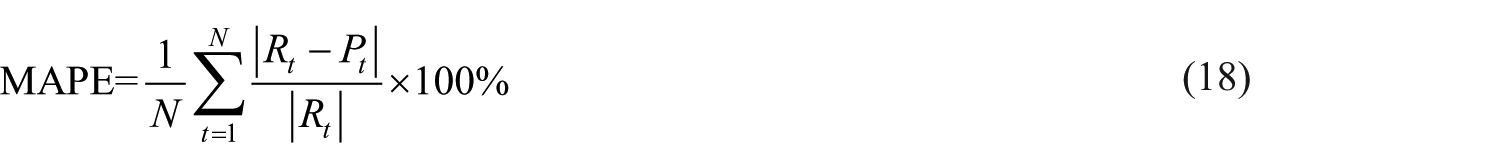
Four indexes of root mean square error (RMSE), mean absolute percentage error (MAPE), forecasting interval coverage percentage (FICP), and forecasting interval average width (FIAW) are used to evaluate the prediction results. The expressions are as follows
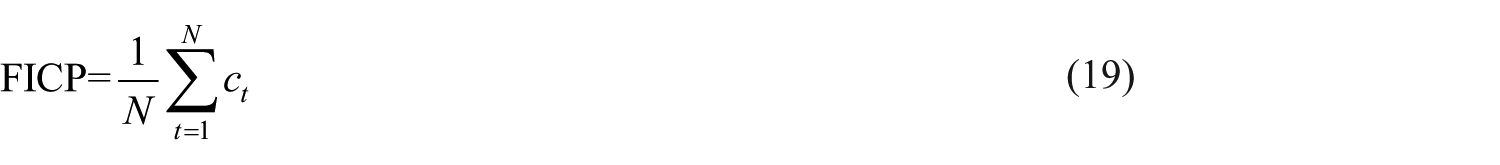
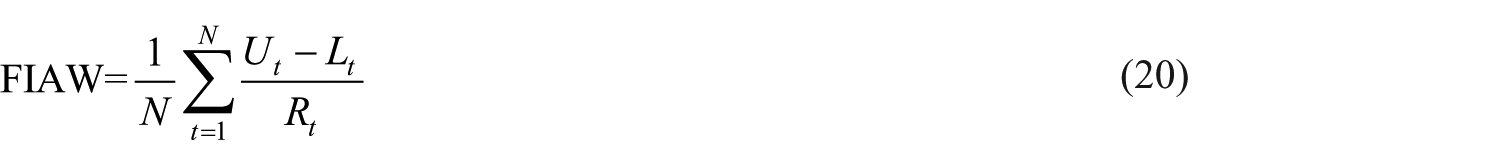
where ct is a constant of 0 or 1, if the measured value is inside the prediction interval, then ct = 1, otherwise ct = 0; Ut is the upper bound of the prediction interval at time t; Lt is the lower bound of the prediction interval at time t.
Study simulation
According to the measured wind speed and meteorological attribute data of a wind farm in Northeast China from March 15 to 21, 2018, the sampling interval of attribute data is 15 min, the sampling interval of wind speed sequence is 1 min. One week’s attribute data and wind speed sample points were 672 and 10,080, respectively.
Wind speed meteorological attribute analysis
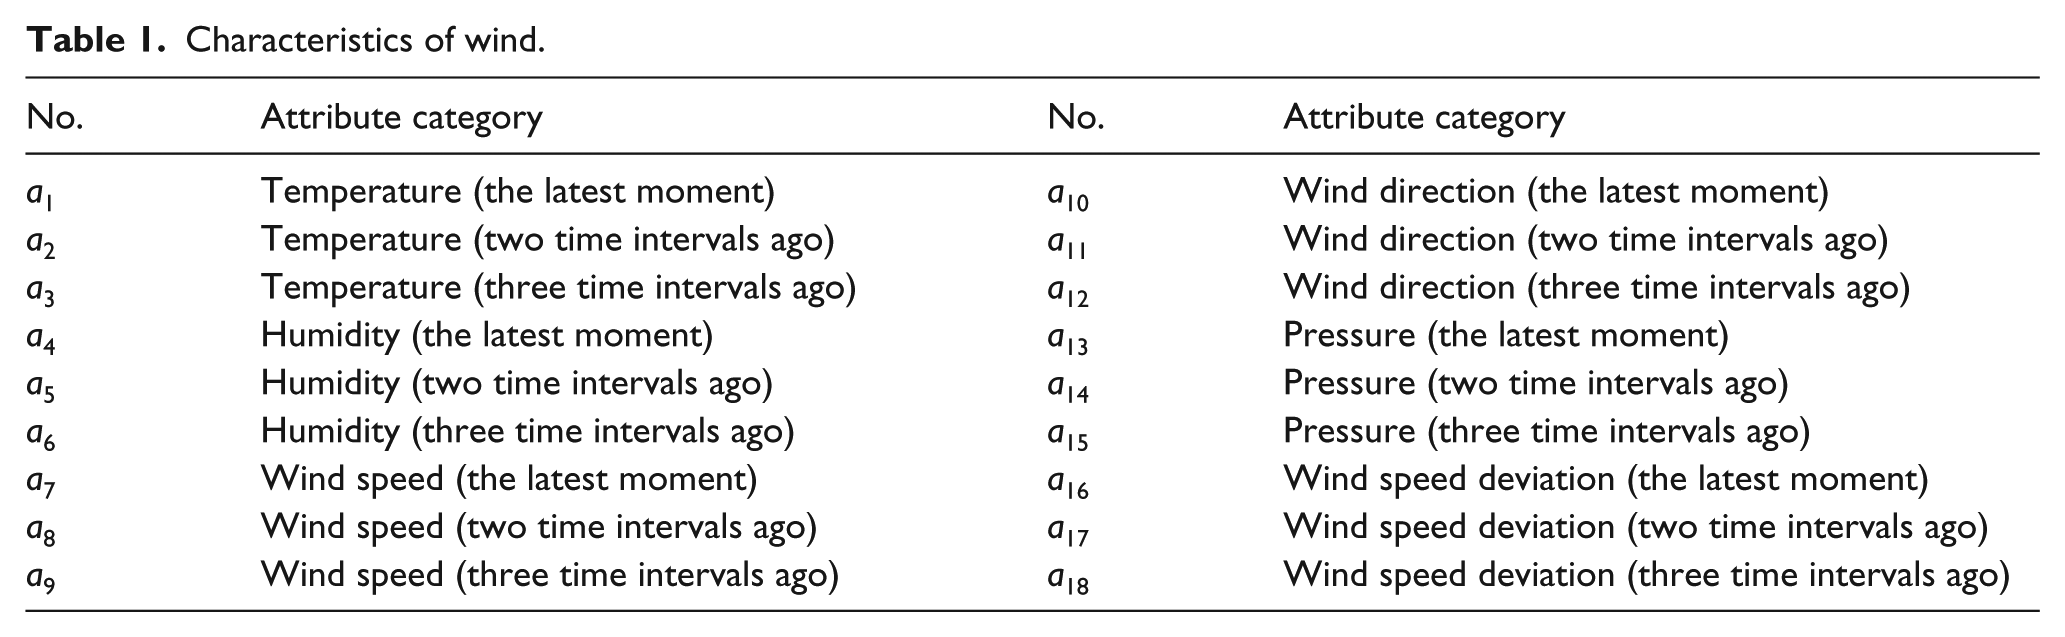
The 18-dimensional wind speed attribute characteristics with strong wind speed correlation are selected for research. The wind speed attribute categories are shown in Table 1.
Characteristics of wind.
The loading matrix of the principal component can indicate the ability of each principal component to influence the attribute factor of the initial attribute set. The bigger the value of the principal component is, the stronger the relevance with the attribute is. Since each principal component is a comprehensive evaluation index for different attribute sets, it does not have units and dimensions. At the same time, the principal component of the loading matrix is ordered by the number of the contribution rate, instead of the value. The principal component score sequence of the initial attribute set is extracted by PCA and weighted and sorted by variance contribution rate. The result is shown in Table 2.
Contribution rates and weights of principal components.
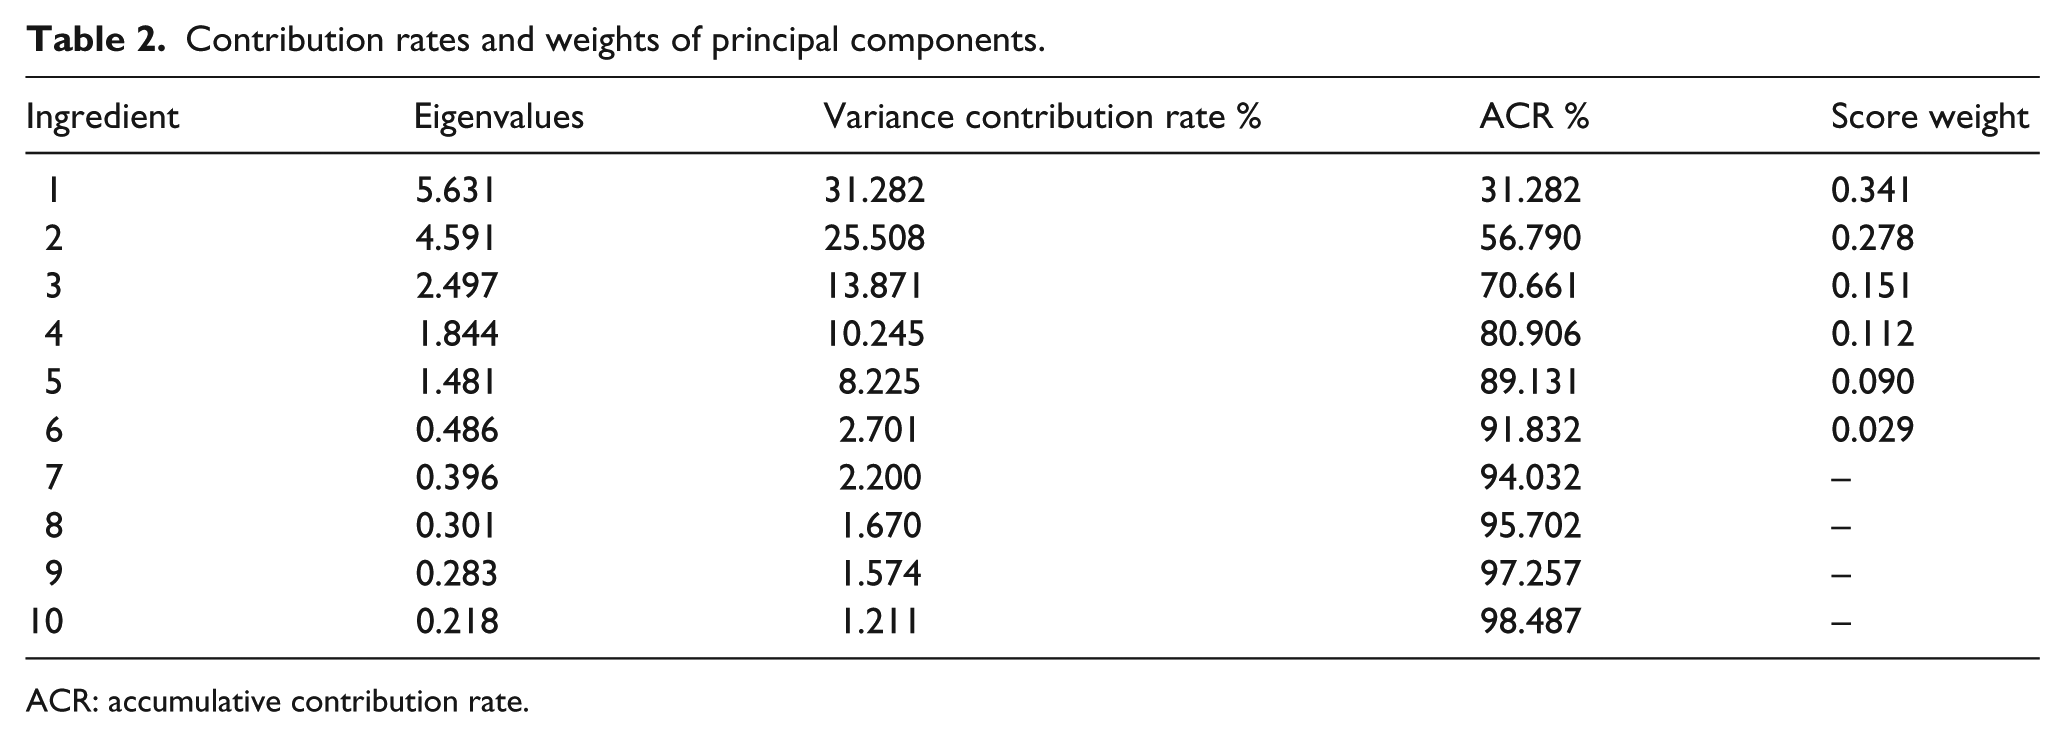
ACR: accumulative contribution rate.
The cumulative variance contribution rate of the first seven principal components is 91.83%, which is greater than the limited value of 90%, indicating that the basic information of the initial attribute data can be represented by using these components information, and the information contained therein does not overlap. Therefore, the reduced seven weighted principal component scores are taken as the input set of the prediction model.
The sample time series of wind speed is shown in Figure 2. In order to predict the wind speed of 15 min, 15 sample points are used as granulation window to granulate the fuzzy information of the first 6 days of wind speed series data. The low, R and up components obtained are shown in Figure 3.
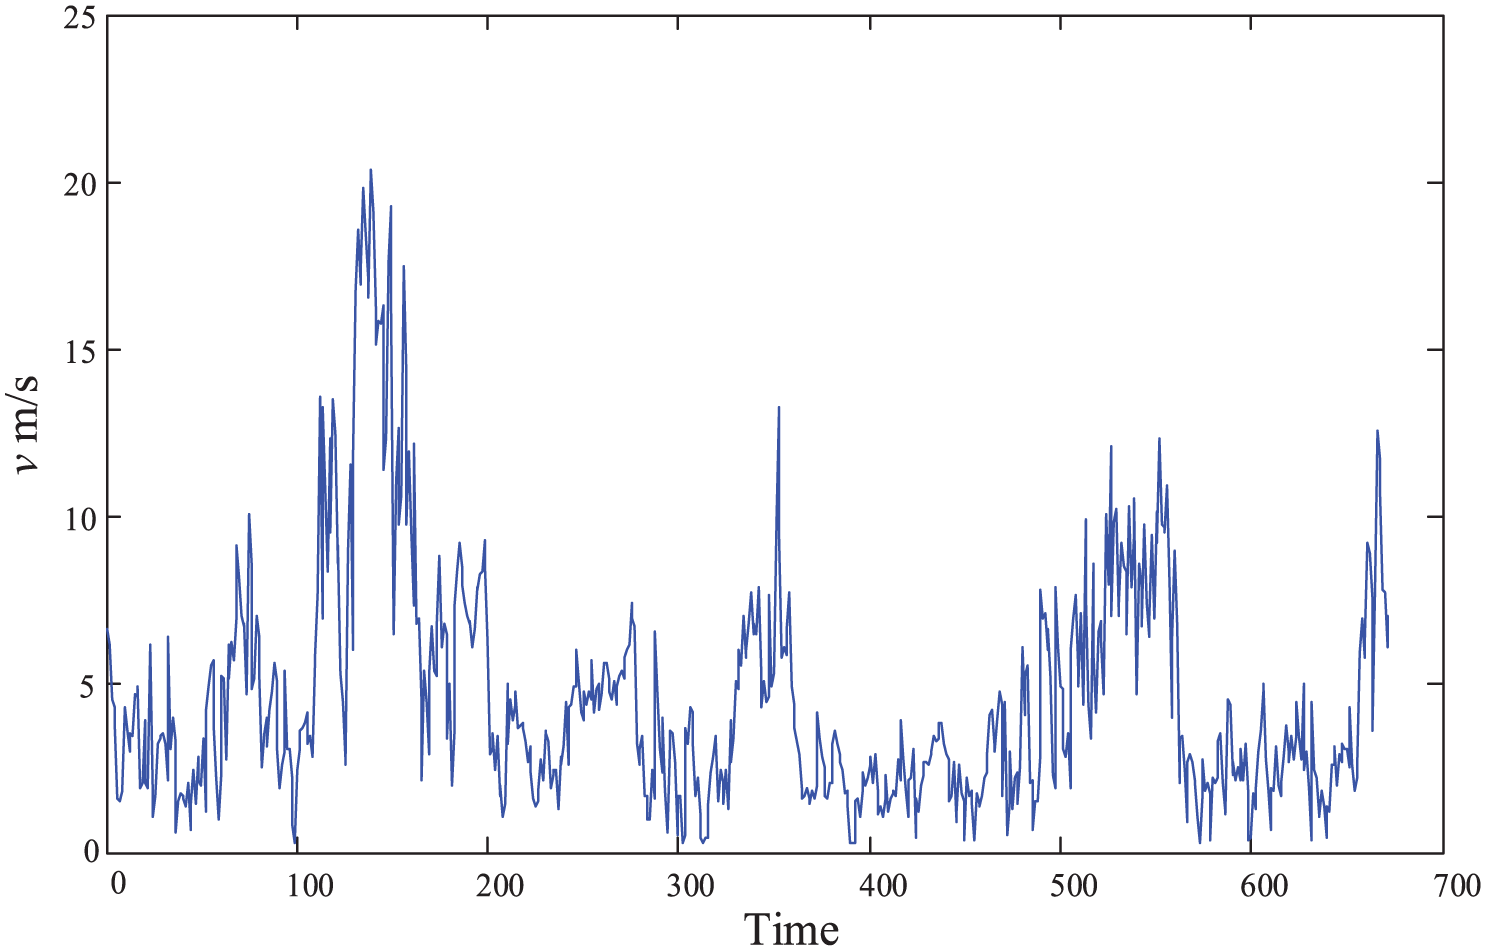
Schematic diagram of wind speed.
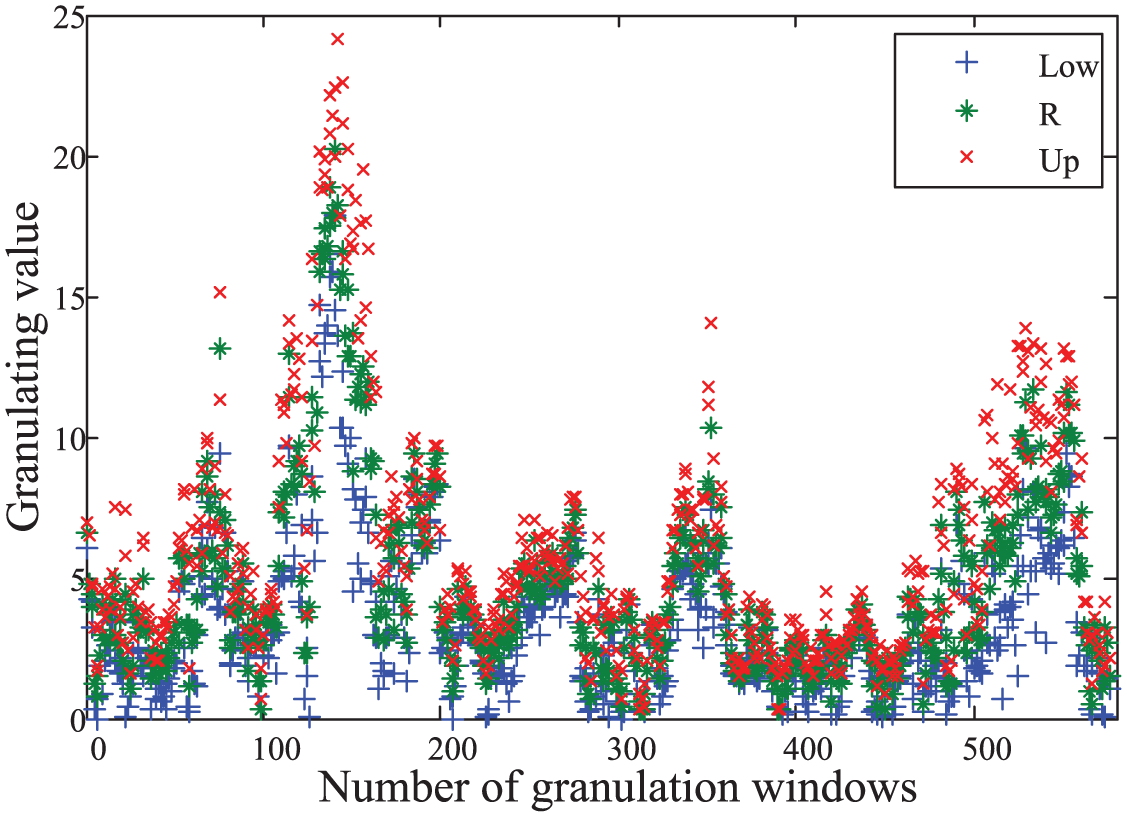
Visualization of fuzzy information granulation.
After granulating the fuzzy information of wind speed series, we can get three components, low, up and R, which represent the minimum value, maximum value, and variation trend of wind speed interval, respectively. And then the three components can be constructed to predict the wind speed interval separately.
Basic parameter setting
The number of neurons in the hidden layer should be set when using the RELM model to predict the typical wind speed in Northeast China in March. The relationship between the number of neurons in the hidden layer and the predicted results is shown in Figure 4.
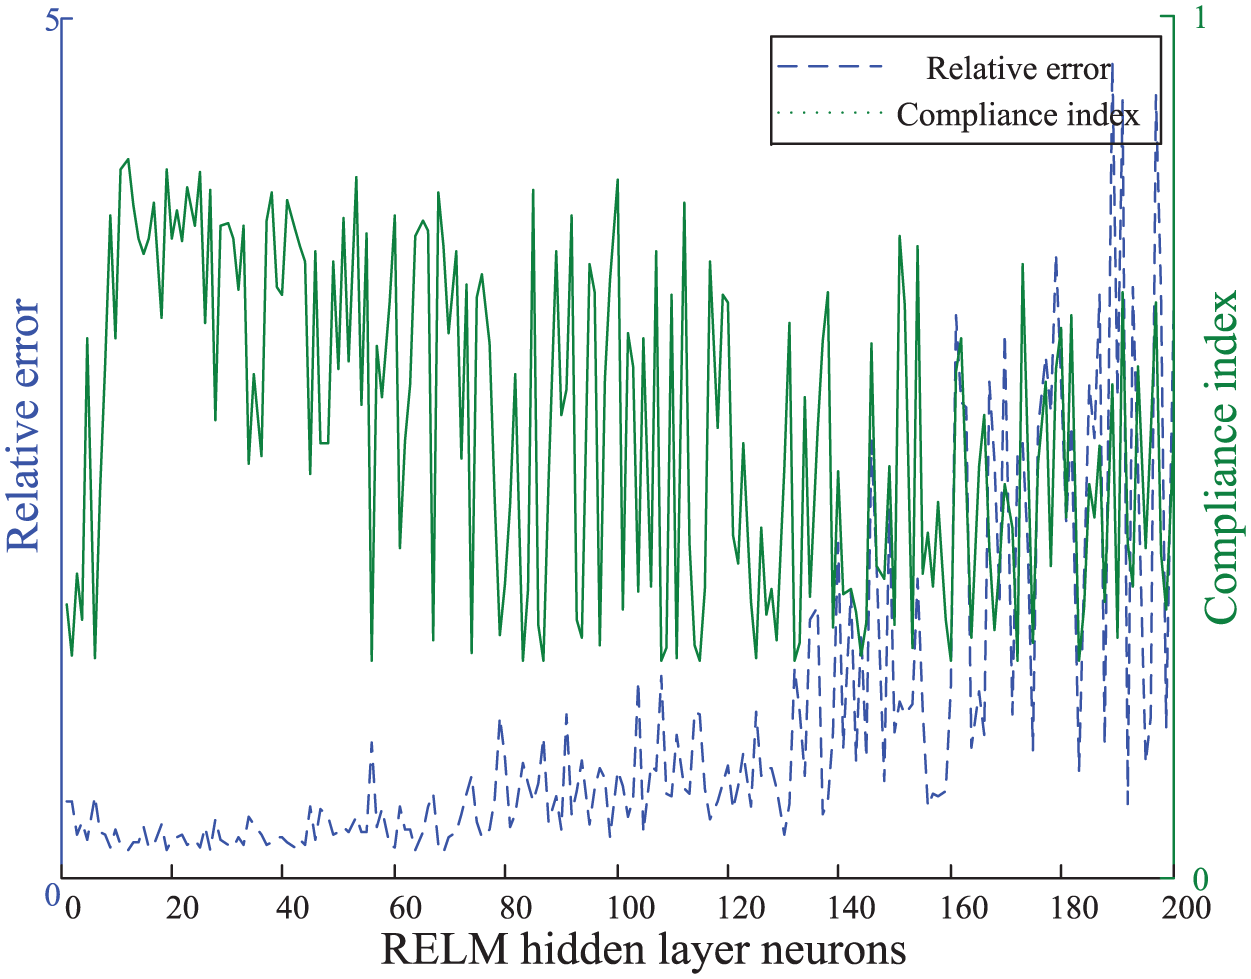
The relationship between the number of neurons in the hidden layer and the prediction results.
RELM activation function selects Sig function. When the number of neurons in the hidden layer is in the range of 0–17, the relative error of prediction decreases with the increase of the number of neurons, and the coefficient of determination increases with the number of neurons. The law of variation in the range of 17–200 is reversed. To minimize the prediction error, the number of neurons in the hidden layer is set to 17.
The input-hidden layer weight and bias of RELM network are optimized by GSA. The parameters of the algorithm are set in Table 3.
Algorithm parameters configuration of GSA.
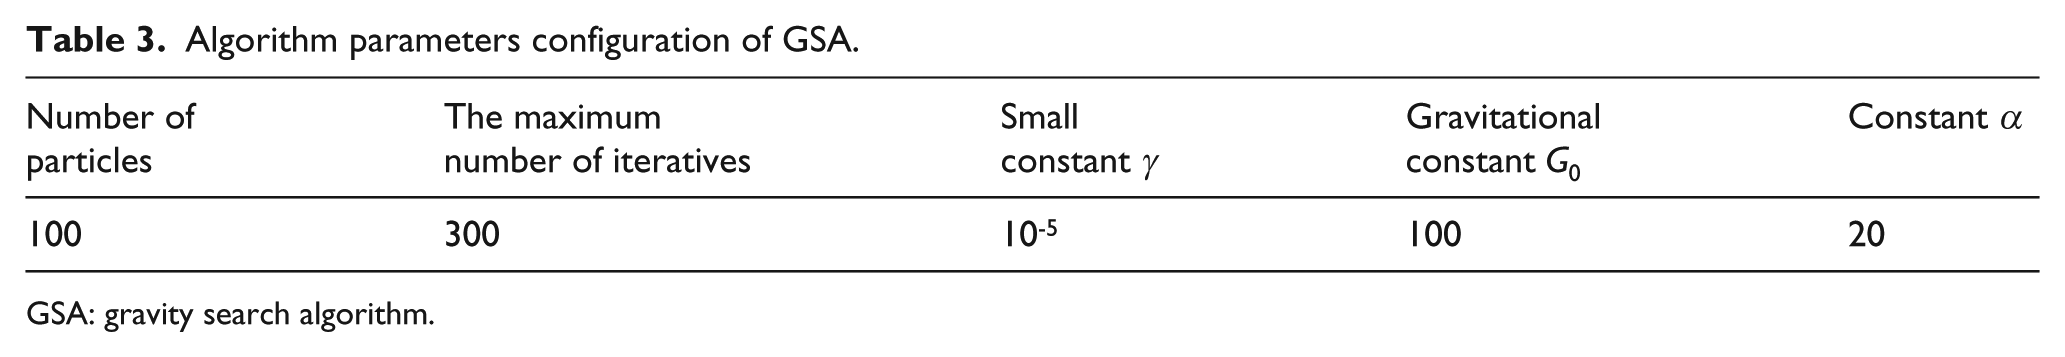
GSA: gravity search algorithm.
Prediction method simulation analysis
So as to verify the prediction effect of the RELM model, combined with the measured data of the Northeast wind farm on March 15–20, the single-step rolling prediction of the 21st wind speed trend is carried out, and the prediction results are compared with the backpropagation (BP) neural network and the traditional ELM model. The results are shown in Figures 4 and 5.
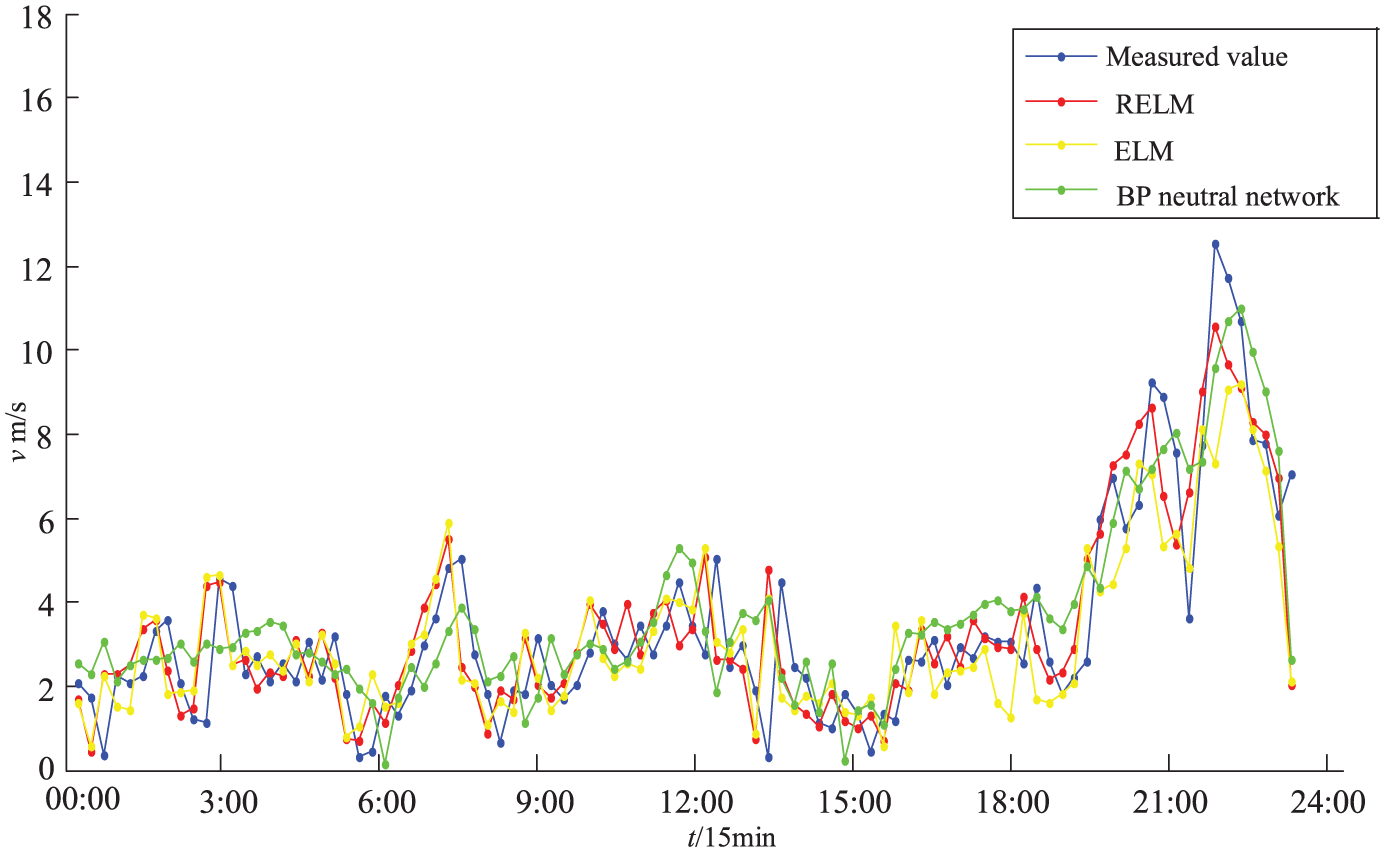
The results of different prediction methods.
From Figure 5, we can see that in the period of slow change of wind speed, the three prediction methods can show the trend of wind speed change reasonably and have better prediction effect, and in the period of severe fluctuation of wind speed, the forecast result of RELM is closer to the actual wind speed. Table 4 shows that the prediction error of RELM is lower than that of traditional ELM and BP neural networks. Therefore, a new combined prediction method based on RELM is constructed in this article. Figure 6 shows a graph of relative error versus time for Method 1.
The errors comparison of different prediction methods.
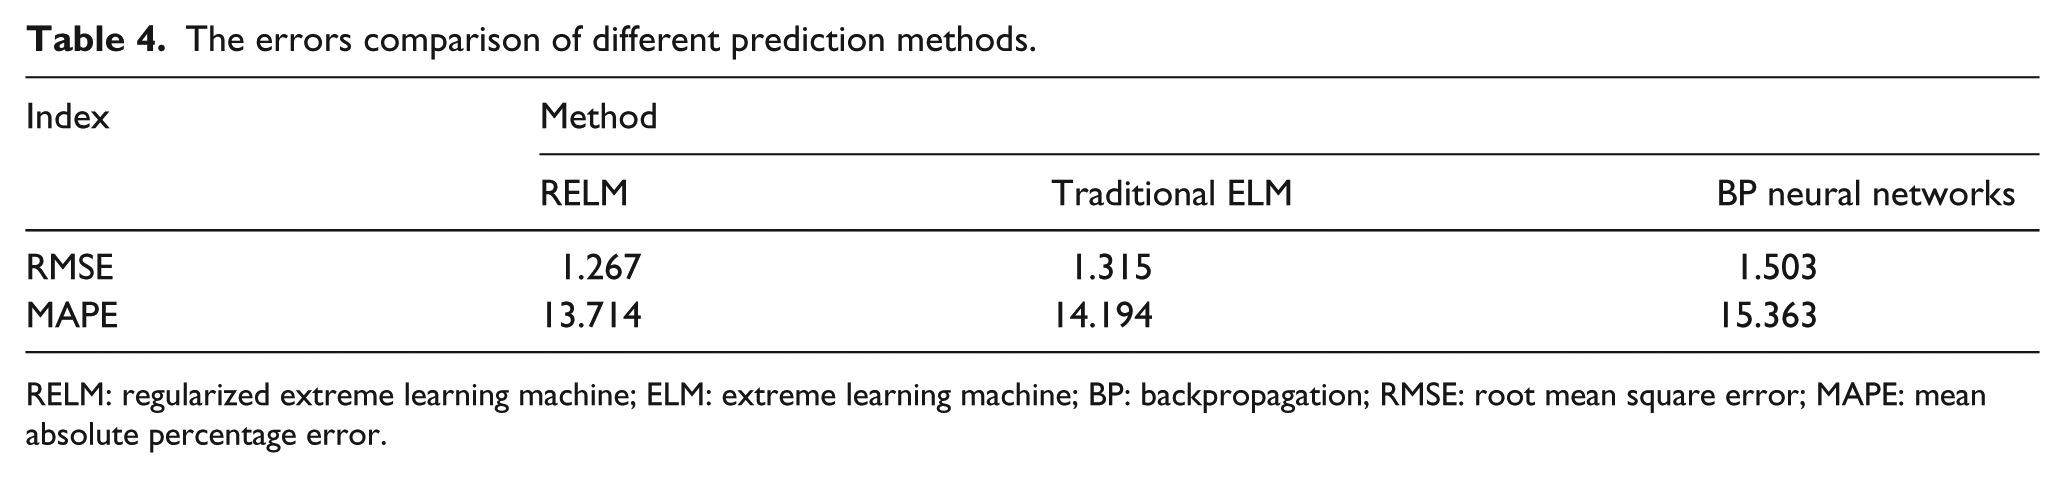
RELM: regularized extreme learning machine; ELM: extreme learning machine; BP: backpropagation; RMSE: root mean square error; MAPE: mean absolute percentage error.
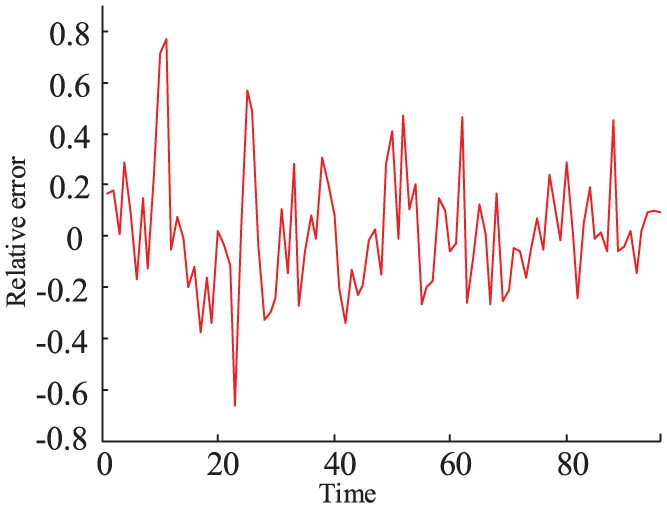
Prediction error of the method 1.
Further study on the calculation characteristics of different models is carried out. PCA + FIG + GSA + RELM (method 1), PCA + FIG + RELM (method 2), FIG + GSA + RELM (method 3), and FIG + RELM (method 4) are used to predict the wind speed on March 21. The forecast result of wind speed fluctuation trend is shown in Figure 7.
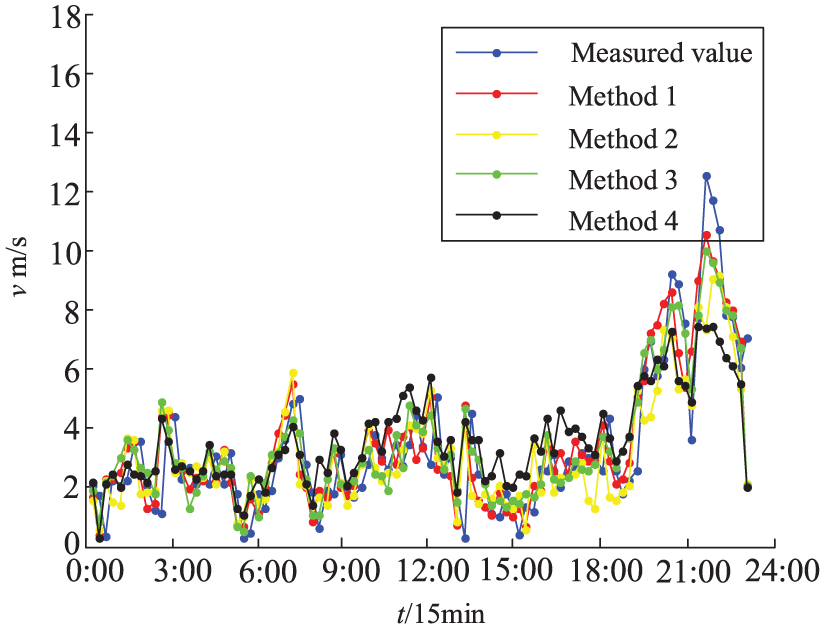
The prediction results of different combination methods.
It can be seen from the above figures that the wind speed changes slowly during 00:00–03:00 on the typical dates, so the prediction results of these four methods are consistent with the actual wind speed. But during the period of 21:00–24:00, the fluctuation of wind speed is relatively obvious; the prediction accuracy of method 1 is higher than that of other methods. The optimal selection of RELM parameters by GSA can improve the prediction accuracy. The results show that the prediction error of method 3 is lower than that of method 4, and the prediction value is closer to the measured value. However, these two methods do not reduce the attribute factors of wind speed and contain more redundant information. Methods 1 and 2 are based on methods 3 and 4. They extract the principal component of attribute factors’ score sequence according to PCA. The attribute reduction of wind speed can be realized. And the redundant attribute information can be eliminated effectively under the premise of ensuring precision, and the operation efficiency is improved.
The wind speed interval prediction results of different combination methods are shown in Figure 8.
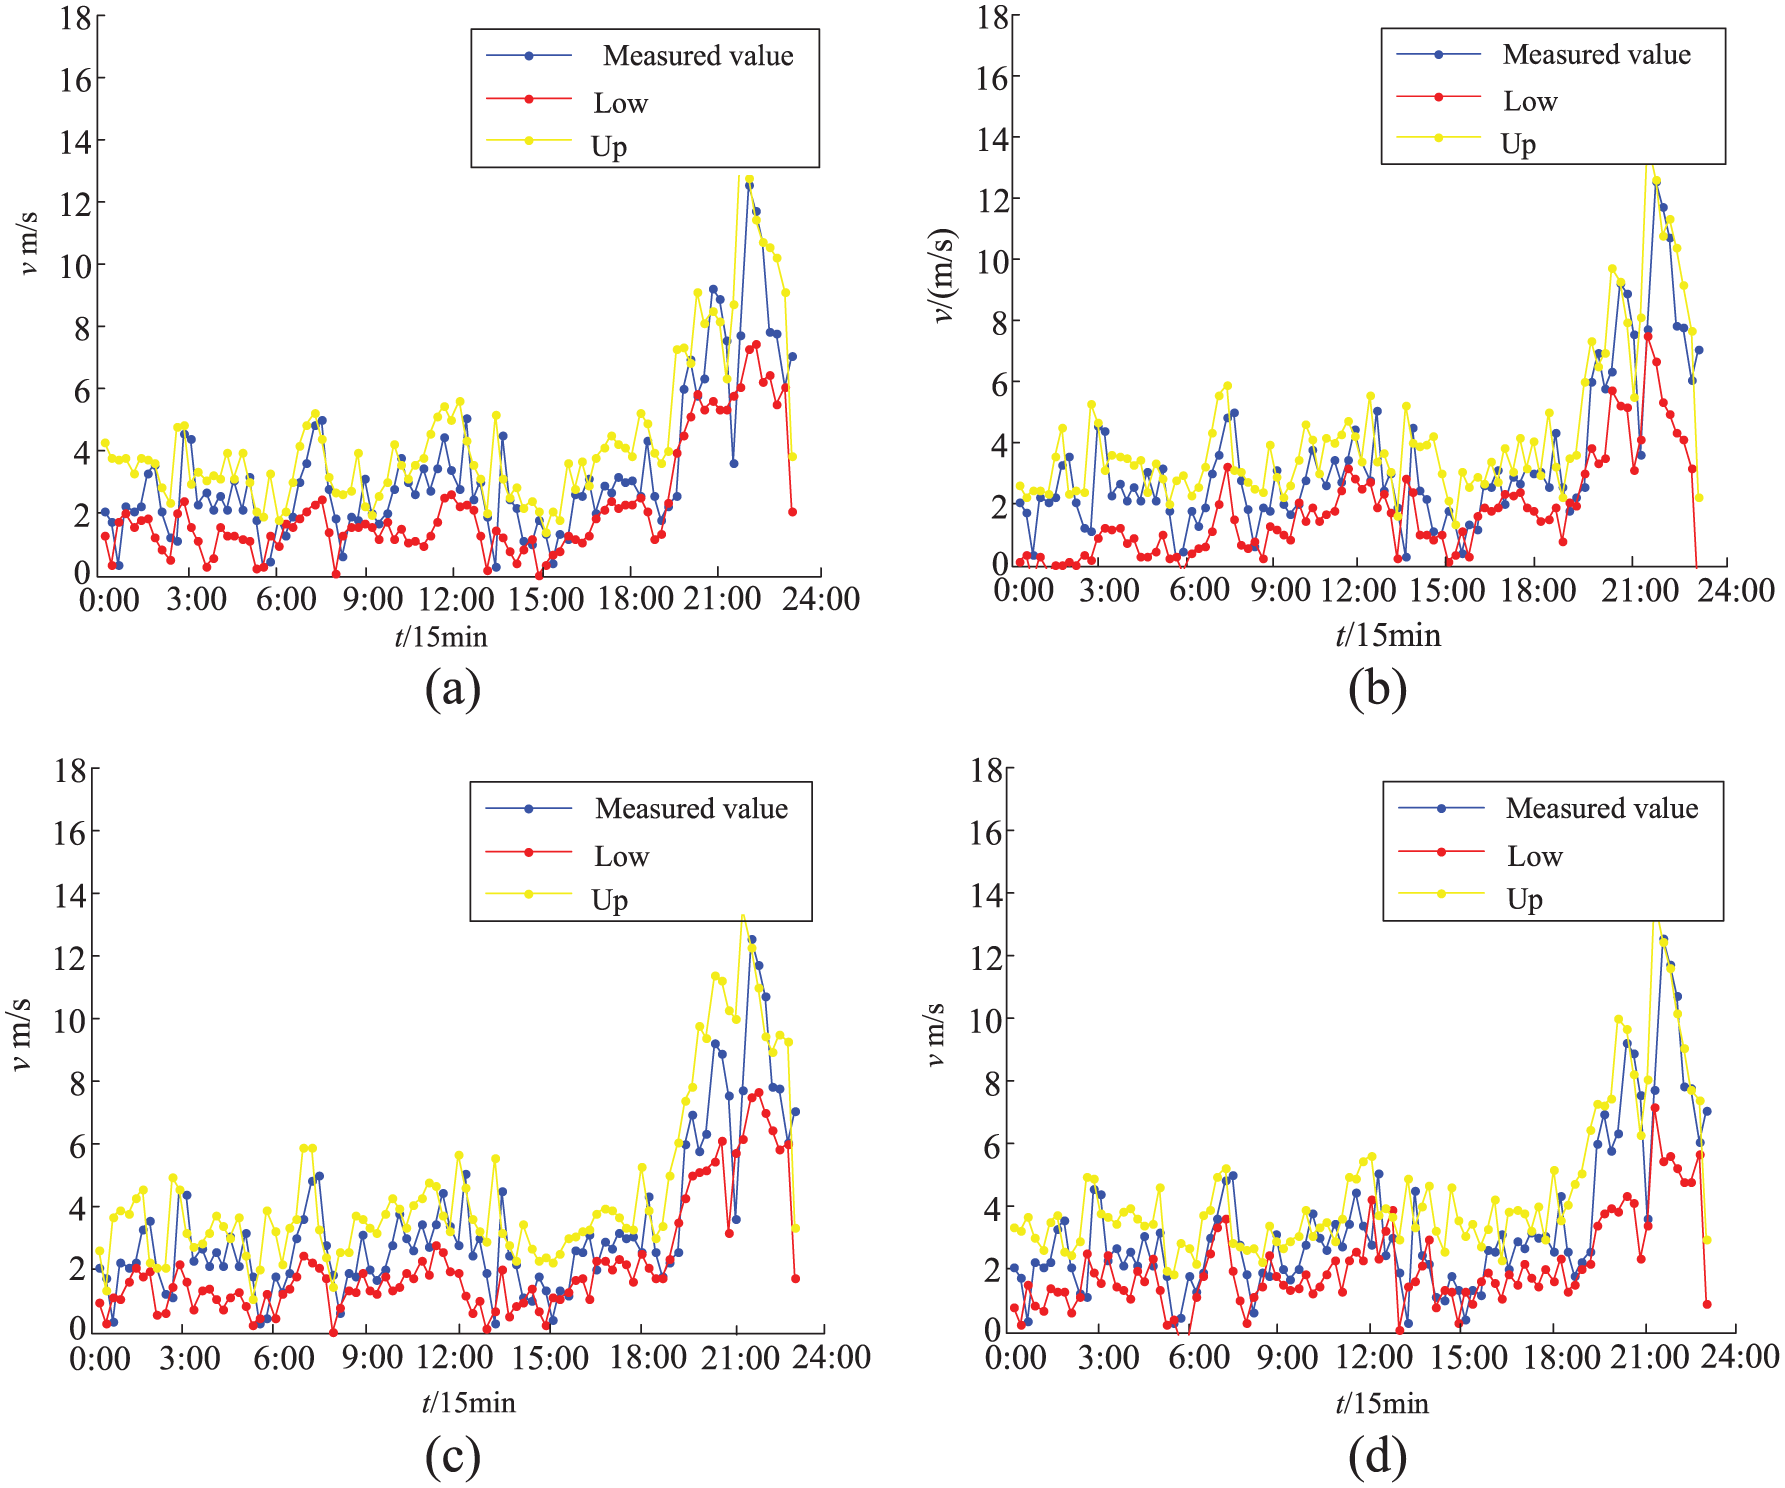
Interval prediction of wind speed by different methods: (a) Method 1, (b) method 2, (c) method 3, (d) method 4.
From Figure 8 and Table 5, we can see that method 1 can not only predict the trend of wind speed accurately, but also obtain reliable prediction interval. The method has the smallest prediction error, the highest interval coverage, the narrowest mean width of interval, and the better results.
Evaluation indices of different combination methods.
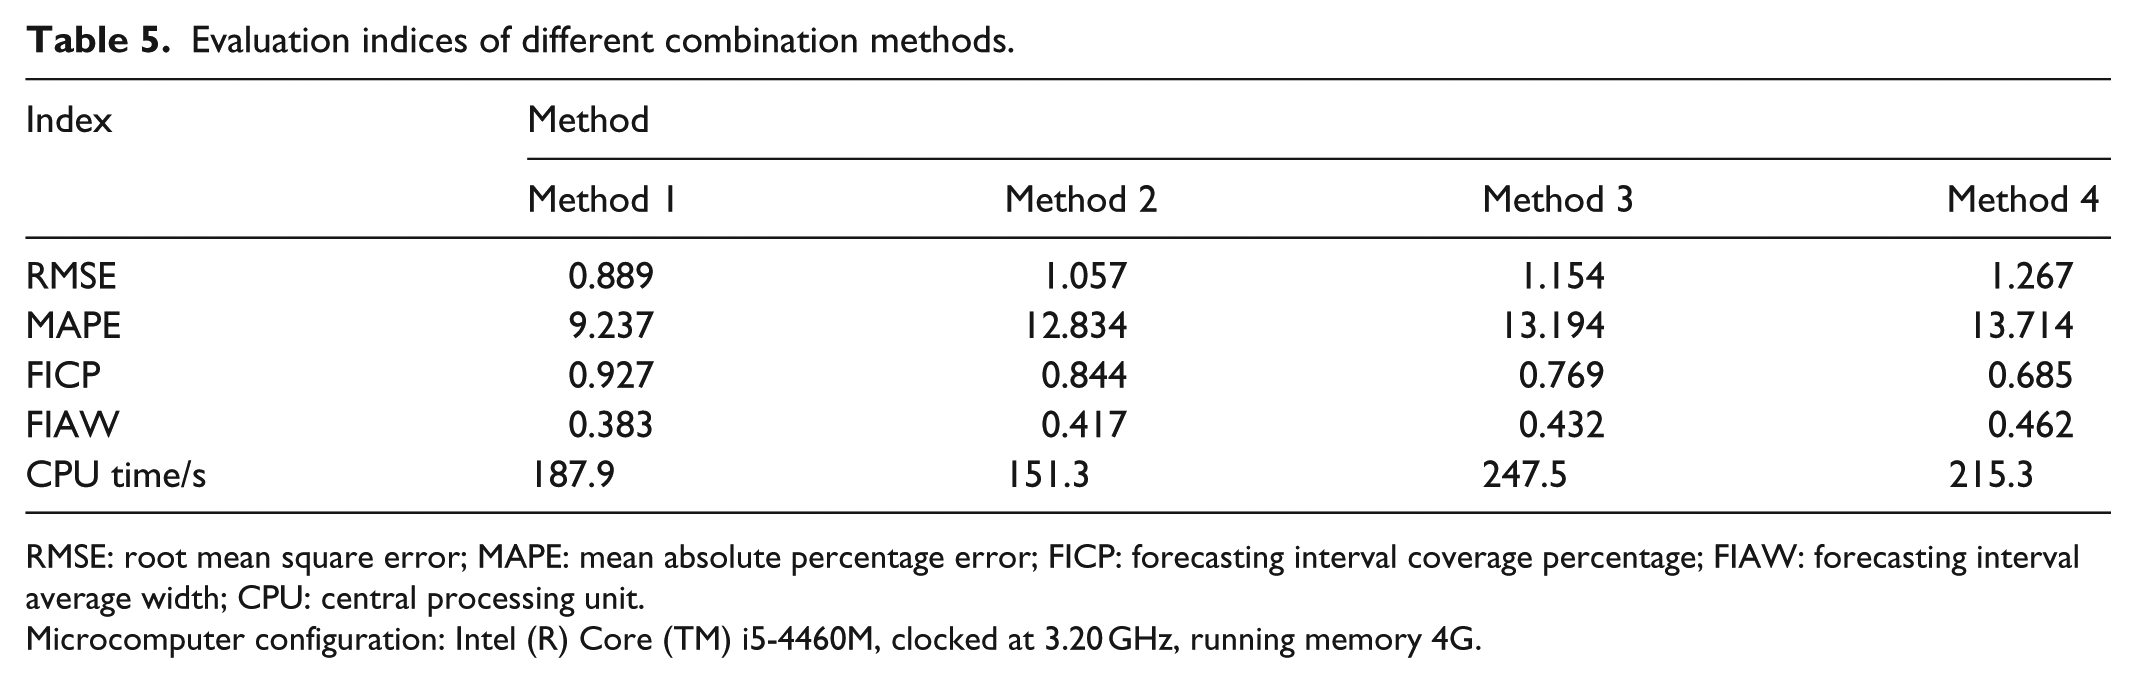
RMSE: root mean square error; MAPE: mean absolute percentage error; FICP: forecasting interval coverage percentage; FIAW: forecasting interval average width; CPU: central processing unit.
Microcomputer configuration: Intel (R) Core (TM) i5-4460M, clocked at 3.20 GHz, running memory 4G.
Generalization capability verification
The applicability of this method is further studied by combining the measured data of National Wind Technology Center (NWTC) wind farm (39.91°N, 105.23°W) in 2018. Taking the historical data of March 15–21 and October 15–21 as examples, the time series of wind speed fluctuation is shown in Figure 9.
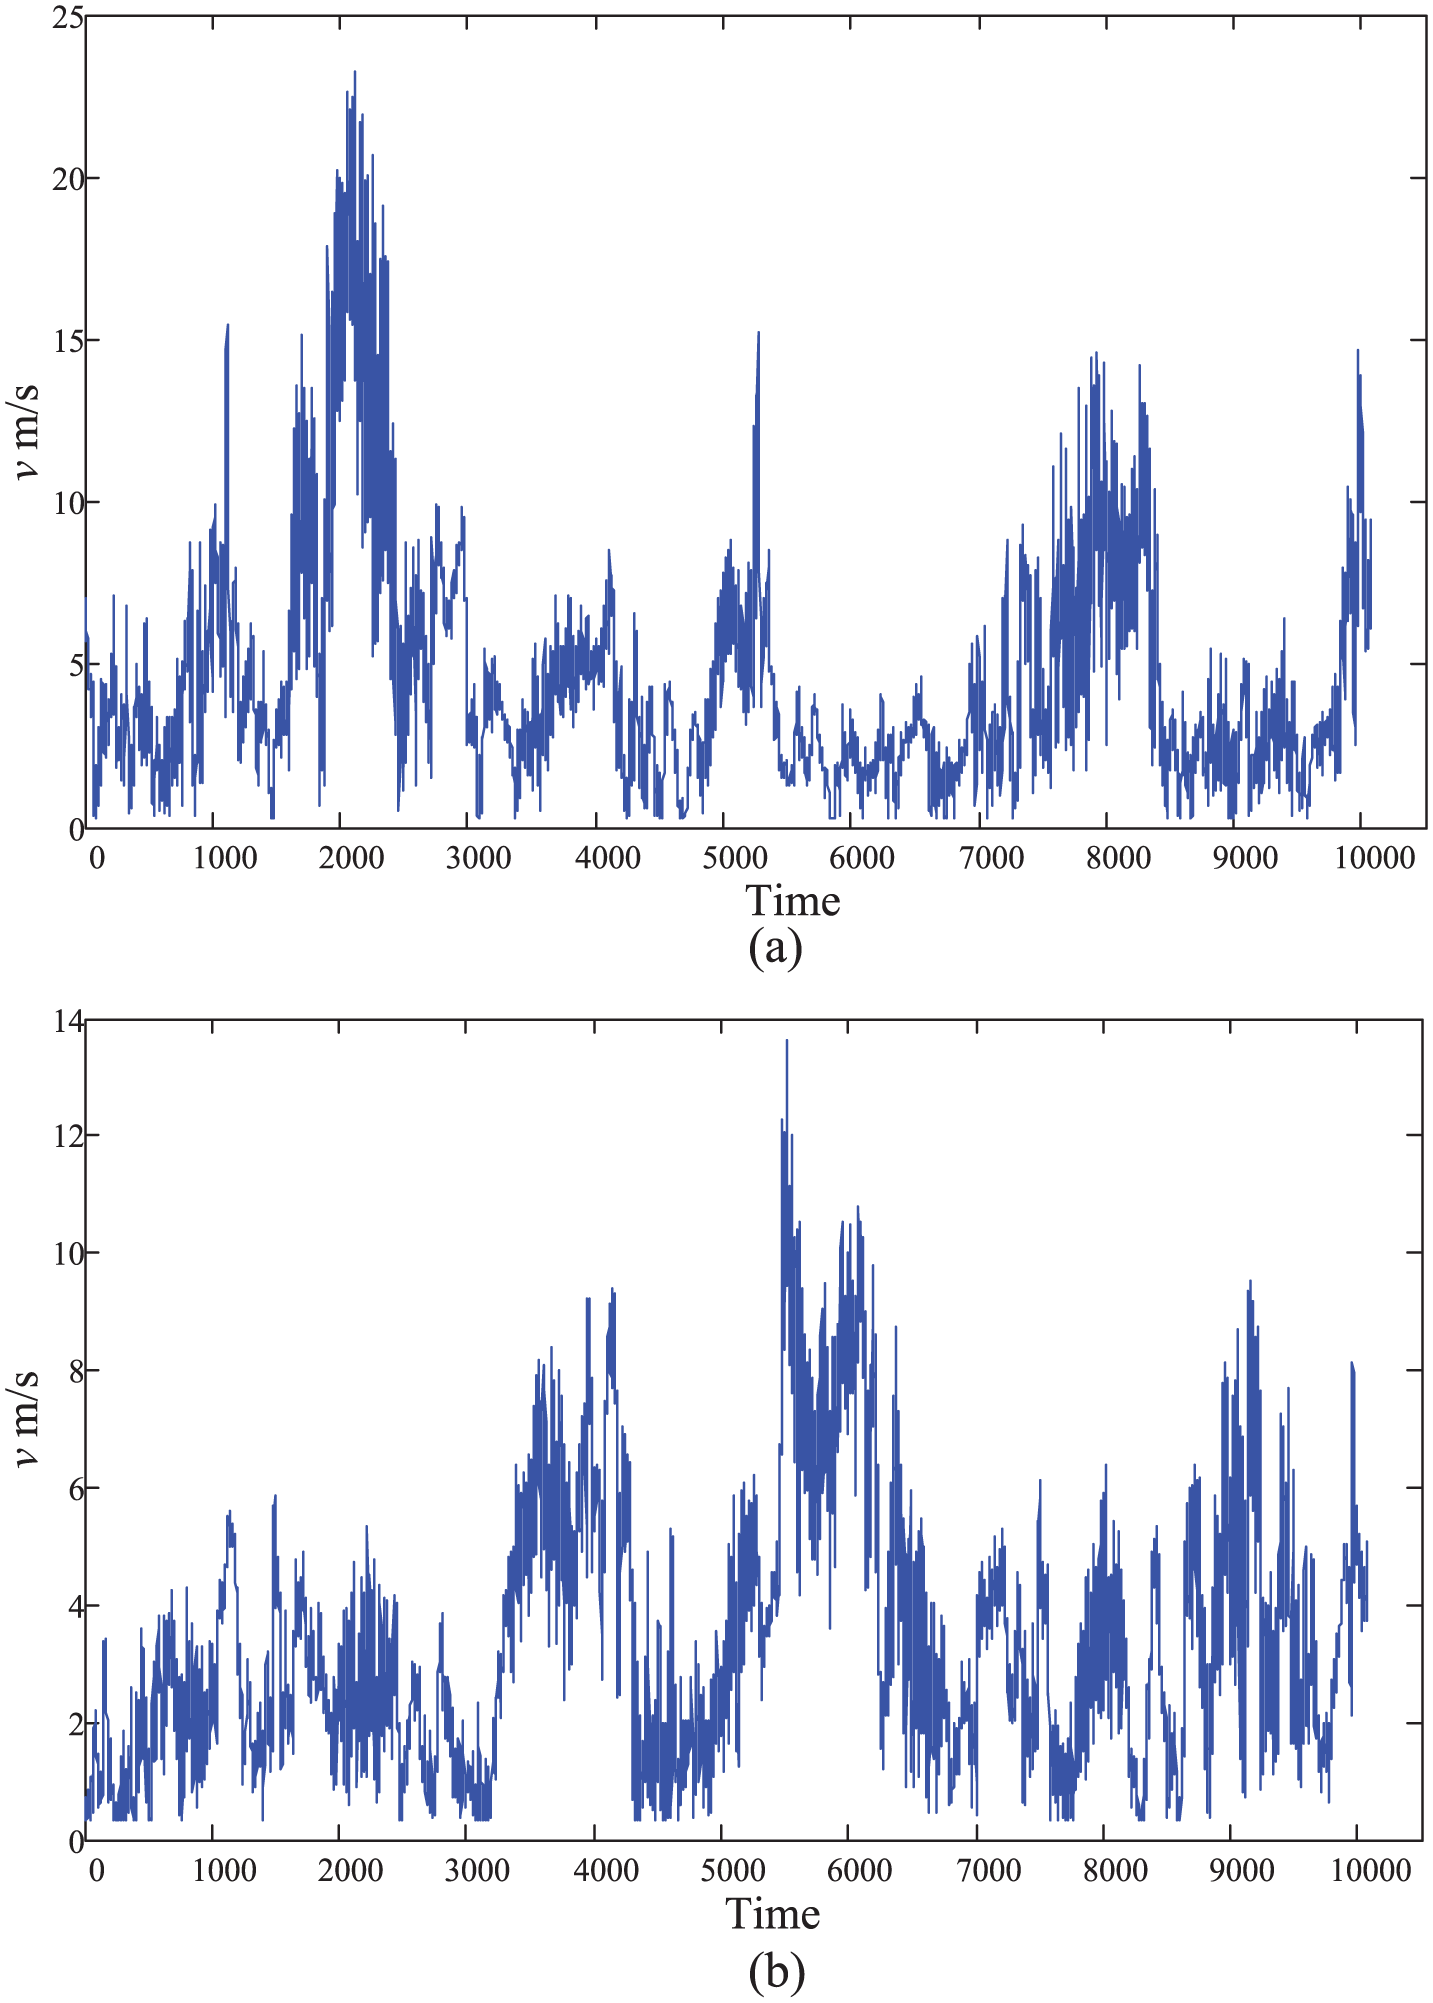
Schematic diagram of wind speed: (a) March 15–21, (b) October 15–21.
The wind farm is affected by geographical location and climatic environment, and the fluctuation characteristics of wind speed in different seasons are quite different from those in Northeast China. Based on the local historical meteorological data, the model parameters of RELM are modified, and the combined model is used to predict the wind speed interval. The results are as follows (Figure 10 and Table 6).
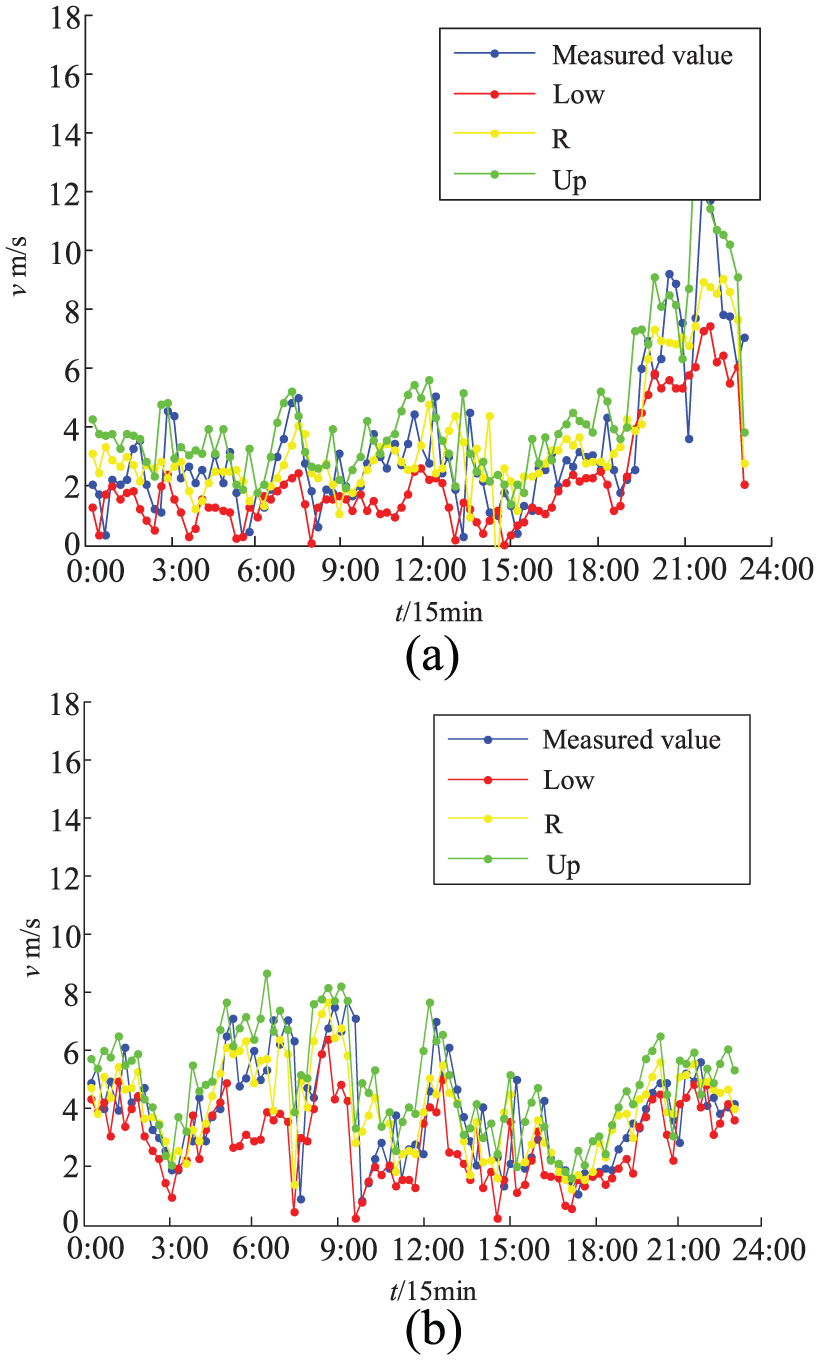
Interval prediction results of wind speed: (a) March 21, (b) October 21.
The prediction evaluation indices.
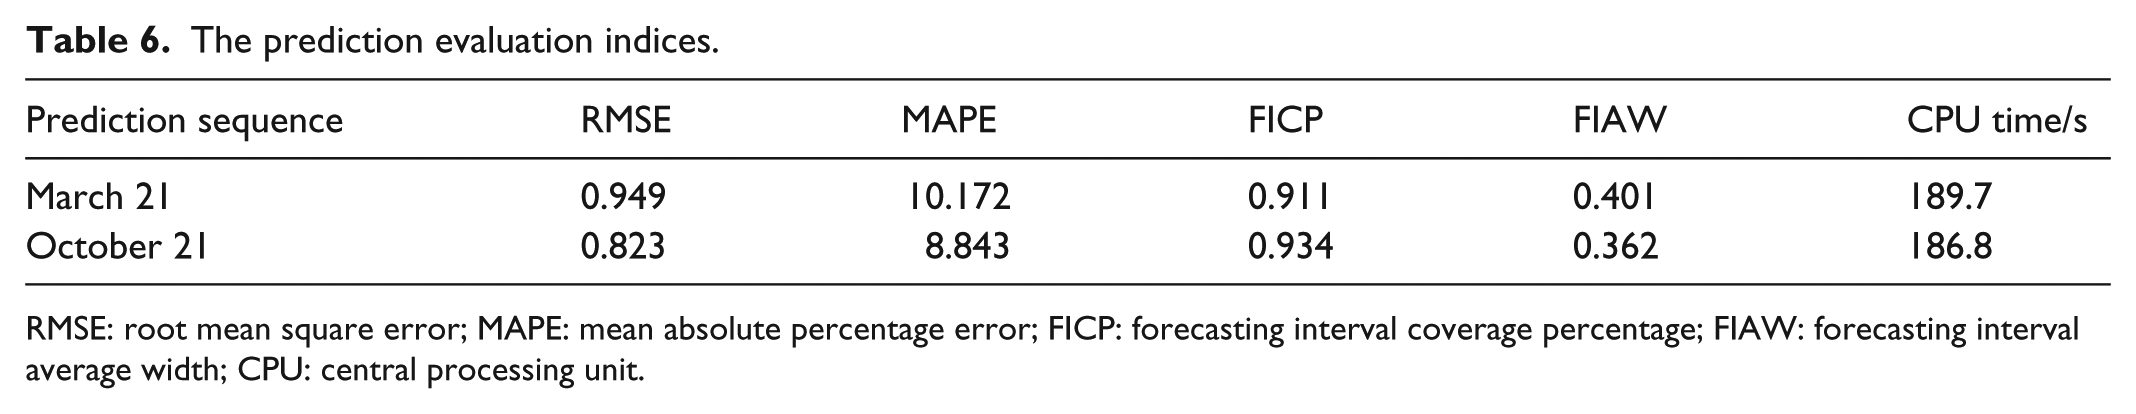
RMSE: root mean square error; MAPE: mean absolute percentage error; FICP: forecasting interval coverage percentage; FIAW: forecasting interval average width; CPU: central processing unit.
The prediction results can reflect the trend of wind speed and range of intervals accurately. All the prediction indexes meet the standard requirements, which prove that the method has strong applicability and generalization ability.
Conclusion
This article proposes an improved RELM wind speed interval prediction method based on information reduction. The conclusions are as follows:
PCA is used to extract the multi-dimensional wind speed attribute factor of cross-correlation, and weighted according to the variance contribution rate of each component, the redundant information is eliminated effectively, and the independence of input sequence is enhanced. The optimization of the input set of the prediction model is realized, and the calculation efficiency is improved on the premise of ensuring the prediction accuracy.
RELM based on parameter optimization can reduce the randomness of model parameters and improve prediction performance. Combined with the fluctuation of wind speed in different regions and seasons, the interval prediction model of wind speed in accordance with the actual fluctuation can be constructed by parameter modification and optimization, which verifies the validity and applicability of this method.
Footnotes
Acknowledgements
The authors are grateful for the technical support of the School of Electrical Engineering at Northeast Electric Power University.
Declaration of conflicting interests
The author(s) declared no potential conflicts of interest with respect to the research, authorship, and/or publication of this article.
Funding
The author(s) disclosed receipt of the following financial support for the research, authorship, and/or publication of this article: The research project was financially supported by the National High-tech R&D Program of China (Grant No. SS2014AA052502) and the National Natural Science Foundation of China (Grant No. 51507027).