
Abstract
Although Ethiopia does not have significant fossil fuel resource, it is endowed with a huge amount of renewable energy resources such as hydro, wind, geothermal, and solar power. However, only a small portion of these resources has been utilized so far and less than 30% of the nation’s population has access to electricity. The wind energy potential of the country is estimated to be up to 10 GW. Yet less than 5% of this potential is developed so far. One of the reasons for this low utilization of wind energy in Ethiopia is the absence of a reliable and accurate wind atlas and resource maps. Development of reliable and accurate wind atlas and resource maps helps to identify candidate sites for wind energy applications and facilitates the planning and implementation of wind energy projects. The main purpose of this research is to assess the wind energy potential and model wind farm in the Mossobo-Harena site of North Ethiopia. In this research, wind data collected for 2 years from Mossobo-Harena site meteorological station were analyzed using different statistical software to evaluate the wind energy potential of the area. Average wind speed and power density, distribution of the wind, prevailing direction, turbulence intensity, and wind shear profile of the site were determined. Wind Atlas Analysis and Application Program was used to generate the generalized wind climate of the area and develop resource maps. Wind farm layout and preliminary turbine micro-sitting were done by taking various factors into consideration. The IEC wind turbine class of the site was determined and an appropriate wind turbine for the study area wind climate was selected and the net annual energy production and capacity factor of the wind farm were determined. The measured data analysis conducted indicates that the mean wind speed at 10 and 40 m above the ground level is 5.12 and 6.41 m/s, respectively, at measuring site. The measuring site’s mean power density was determined to be 138.55 and 276.52 W/m2 at 10 and 40 m above the ground level, respectively. The prevailing wind direction in the site is from east to south east where about 60% of the wind was recorded. The resource grid maps developed by Wind Atlas Analysis and Application Program on a 10 km × 10 km area at 50 m above the ground level indicate that the selected study area has a mean wind speed of 5.58 m/s and a mean power density of 146 W/m2. The average turbulence intensity of the site was found to be 0.136 at 40 m which indicates that the site has a moderate turbulence level. According to the resource assessment done, the area is classified as a wind Class IIIB site. A 2-MW rated power ENERCON E-82 E2 wind turbine which is an IEC Class IIB turbine with 82 m rotor diameter and 98 m hub height was selected for estimation of annual energy production on the proposed wind farm. 88 ENERCON E-82 E2 wind turbines were properly sited in the wind farm with recommended spacing between the turbines so as to reduce the wake loss. The rated power of the wind farm is 180.4 MW and the net annual energy production and capacity factor of the proposed wind farm were determined to be 434.315 GWh and 27.48% after considering various losses in the wind farm.
Keywords
Introduction
Ethiopia is endowed with a huge amount of renewable energy resources such as hydro, wind, geothermal, and solar power. The hydroelectric, wind, and geothermal energy resources are estimated to be 45,000, 10,000, and 5000 MW, respectively. These resources can be harvested to generate approximately 60,000 MW of electricity (EEP, 2018).
Ethiopia’s current total electrical energy installed capacity is about 4250 MW. The country’s main electrical energy supply is hydropower with around 90% of the total installed capacity coming from hydropower power plants. The wind farms contribute to 8% of the installed capacity and the rest 2% is from diesel generators and geothermal power plants. The country’s installed capacity is expected to reach 10,000 MW when the country’s major ongoing hydropower, wind power, and geothermal projects are completed in the coming years (EEP, 2018).
The reliance on hydropower for power electrical energy production is risky and too unreliable. In times of drought and during periods of high demand, it cannot supply enough electricity. To solve this problem, Ethiopia needs to look for alternative energy resources that can support hydropower during dry periods where the water level in the dams is low. Wind energy is believed to be a good alternative source of electrical energy production due to its complementary nature with hydropower. During the rainy season, the country sees low wind and in the dry season, the potential of wind becomes high. This creates favorable conditions to use both. Combining the two, wind and hydropower, will add value to the hydropower plants by elongating their operational time (water saving through the wind).
Ethiopian Electric Power (EEP) has been undergoing a feasibility study in different areas of the country to identify potential sites in Ethiopia. Almost 80% of the identified favorable sites for wind power development are within the Somali Region of Ethiopia, most of which would require long transmission lines to the Ethiopian cities. The northern and central rift valley areas of the country have also a good wind speed potential suitable for development of wind farms (Figure 1).
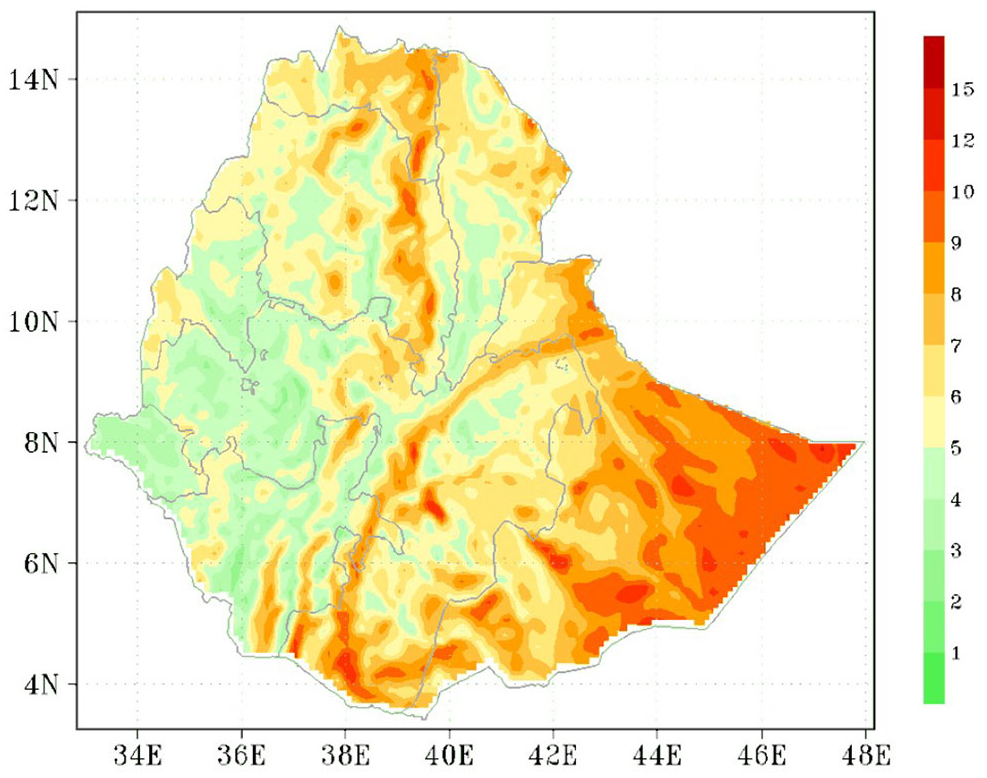
Distribution of average wind speed in Ethiopia at 50 m above the ground level (Hydrochina Beijing Engineering Corporation, 2012).
The EEP has been involved in construction of wind farms in different areas of the country. Construction of Ashegoda wind farm (120 MW), Adama I wind farm (51 MW), and Adama II wind farm (153 MW) is completed and all the three wind farms are operational and deliver power to the national grid. Construction of Ayisha I wind farm (120 MW) and Ayisha II wind farm (120 MW) is going in the Somalia Region of the country. Construction of Ayisha III wind farm (60 MW), Assela wind farm (100 MW), Debre Birhan wind farm (100 MW), and Galema I wind farm (250 MW) is also expected to follow (EEP, 2018). The expansion of Aluto–Langano Geothermal Project is also expected to bring its capacity to 70 MW. The wind power and geothermal projects are part of EEP’s aim to increase Ethiopia’s electric power generation capacity to 10,000 MW from the current 4244.67 MW capability (EEP, 2018).
Due to the absence of reliable and accurate wind atlas and resource maps, further studies on the assessment of wind energy in Ethiopia are necessary. The detailed wind resource maps and other information contained in wind atlas facilitate the identification of prospective areas for use of wind energy technologies for utility-scale power generation, village power, and off-grid wind energy applications. The main objective of the study reported in this article was to conduct wind energy resource assessment, develop wind atlas and resource maps, and model wind farm in Mossobo-Harena area, Tigray Region, North Ethiopia.
Methodology
Description of the study area
Mossobo-Harena site is located 10 km North of Mekelle City, the capital of Tigray Regional State. The measuring mast is located at 13°34′3.54"N latitude and 39°30′44.75"E longitude and has an altitude of 2400 m above the sea level. The selected study area covers 10 km × 10 km area from the measuring mast bounded by geographical coordinates of 550445.5 to 560445.5 m E longitude and 1494964 to 1504963.5 m N latitude. The area can be defined as semi-complex terrain. It has different topographical features ranging from 1937 to 2530 m above the sea level, which includes flat terrain around the metrological station, hills, and gorges. The area is covered mostly by bushes and farm land with small trees and a few houses (Figure 2).

Map of study area.
Data collection, screening, and validation
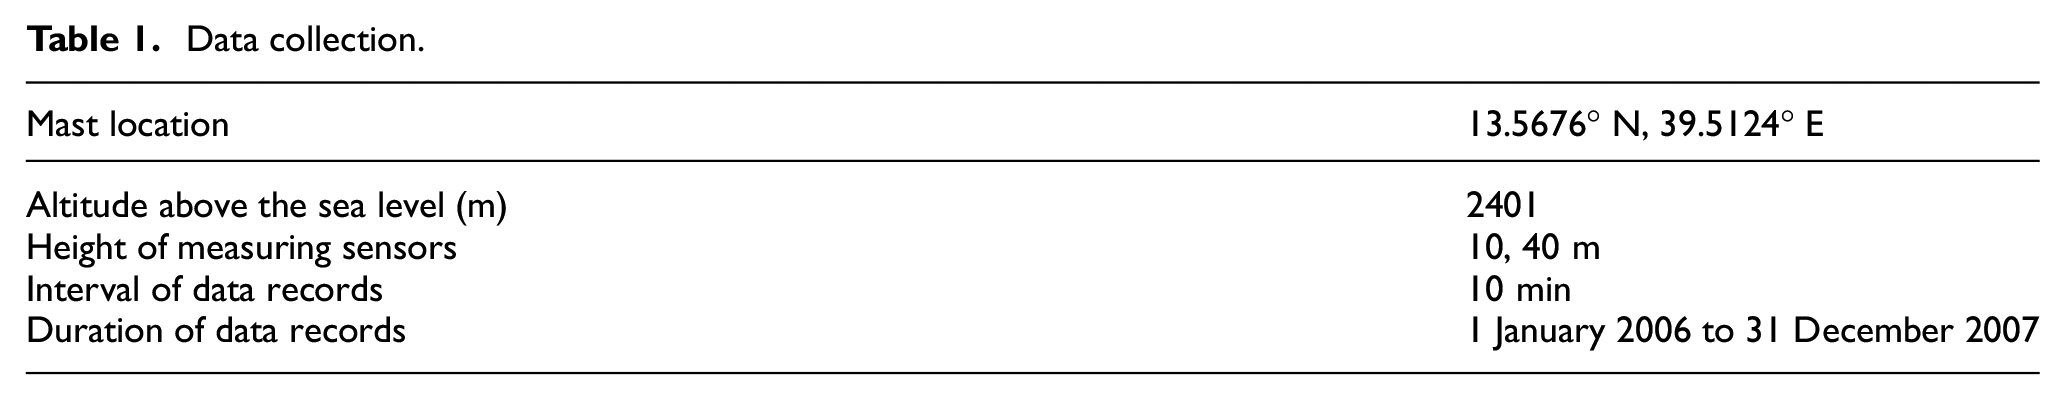
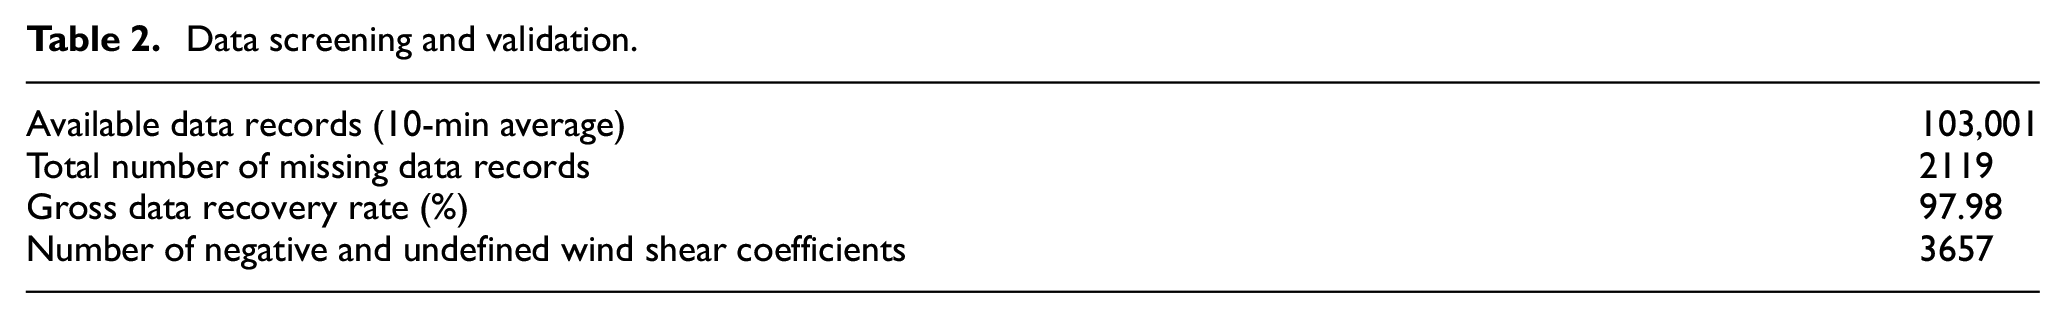
Wind speed and direction data recorded at a time interval of 10 min in Mossobo-Harena metrological station were used for this study. All the collected data were inspected for completeness and any erroneous records. The time series of the data was checked to look for missing data values and a number of data validation routines were used to screen all the data for suspect and erroneous values. General system and parameter checks were used for data screening and validation. The validation checks include: continuity test to identify missing records in the data, inspection of the average wind speed at each 10-min interval record, inspection of negative and unrealistic high wind speed and wind direction records, and observation of vertical profile of wind speed on same mast (negative and undefined wind shear coefficients) (Table 1 and Table 2).
Data collection.
Data screening and validation.
Measured data analysis
Average wind speed
The wind characterization in terms of speed, direction, and wind power is the first step to obtain the initial feasibility of generating electricity from wind power through a wind farm, in a given region. The most critical factor influencing the power developed by a wind energy conversion system is the wind speed. The average wind speed vm is given as

where vi is the wind velocity at each 10-min interval and n is the number of 10-min wind data records. The average wind speed is calculated at hourly, daily, monthly, and annual interval.
Wind power density
The wind power per unit area, P/A or wind power density at interval i is given by

where vi is the 10-min average wind speed in m/s and ρ is the air density. The power density is calculated for each 10-min average wind speed using the above expression and the annual average wind power density is thus the average of the sum of the power density of the 10-min data. The wind speed and power density at a certain height determine the wind power class of the site. The wind power class of a site is determined as per the standard classification reported in Bailey and McDonald (1997).
Wind shear coefficient
The wind shear coefficient is calculated assuming power law relationship at the two heights. The coefficient α is found from

where v1 is the wind speed at height z1, and v2 is the wind speed at height z2.
Turbulence intensity
The average turbulence intensity (TI) of the sites was calculated by taking the average of the individual TI values of 10-min records which were calculated by dividing the standard deviation with the average speed of each record. The TI of each record is given from Bailey and McDonald (1997)

where σ is the standard deviation of wind speed and v is the wind speed. The overall average turbulence is found in similar way to that shown for wind speed. TI is a relative indicator of turbulence with low levels indicated by values less than or equal to 0.10, moderate levels to 0.25, and high levels greater than 0.25.
Modeling with Wind Atlas Analysis and Application Program
Observed wind climate
WAsP (Wind Atlas Analysis and Application Program) was used to generate the wind atlas and to develop the wind resource map of the catchment. The flow modeling of WAsP is discussed in WAsP 11 help documentation. The various inputs in WAsP modeling are the observed wind climate (OWC) of the site, vector map of the study area, and obstacle groups to the measuring masts. OWC is a tabular summary of the frequency of occurrence of wind speed and wind direction at the measuring site. The OWC is produced from raw wind speed and direction measurements.
The OWC represents the data converted into the Weibull probability density function. The Weibull function is defined using two factors, namely, the scale parameter A and the shape parameter k. The OWC also shows the wind direction distribution as wind rose. Wind rose diagram shows the distribution of wind in different directions. The wind rose diagram is generated by dividing into 12 equally spaced sectors. The frequency distribution for each sector is calculated and plotted in the wind rose diagram.
Generalized wind climate (wind atlas)
Wind atlas is a generalized wind climate of the OWC. The data measured from the wind measuring mast are a site-specific data. The wind atlas data sets are site independent and the wind distributions have been reduced to certain standard conditions. The wind atlas contains data for five reference roughness lengths (0.000, 0.030, 0.200, 0.400, and 0.800 m) and five reference heights (10, 25, 50, 100, and 200 m) a.g.l.
Vector map
Vector maps are used to describe the elevation (orography) and land cover (surface roughness) of the area surrounding calculation sites such as meteorological stations, reference sites, turbine sites, or the sites in a resource grid. WAsP uses vector maps, in which terrain surface elevation is represented by height contours and roughness lengths by roughness change lines. The vector map of the study was prepared from a 30-m resolution digital elevation model (DEM) downloaded from ASTER Global Digital Elevation Model (GDEM) (http://www.gdem.aster.ersdac.or.jp/search.jsp) and Global Mapper program was used to create elevation contours at 10 m interval and export the map in WAsP map format. WAsP Map Editor program was used to edit the map by adding roughness change lines which are manually created and imported from Google Earth (Figure 3).
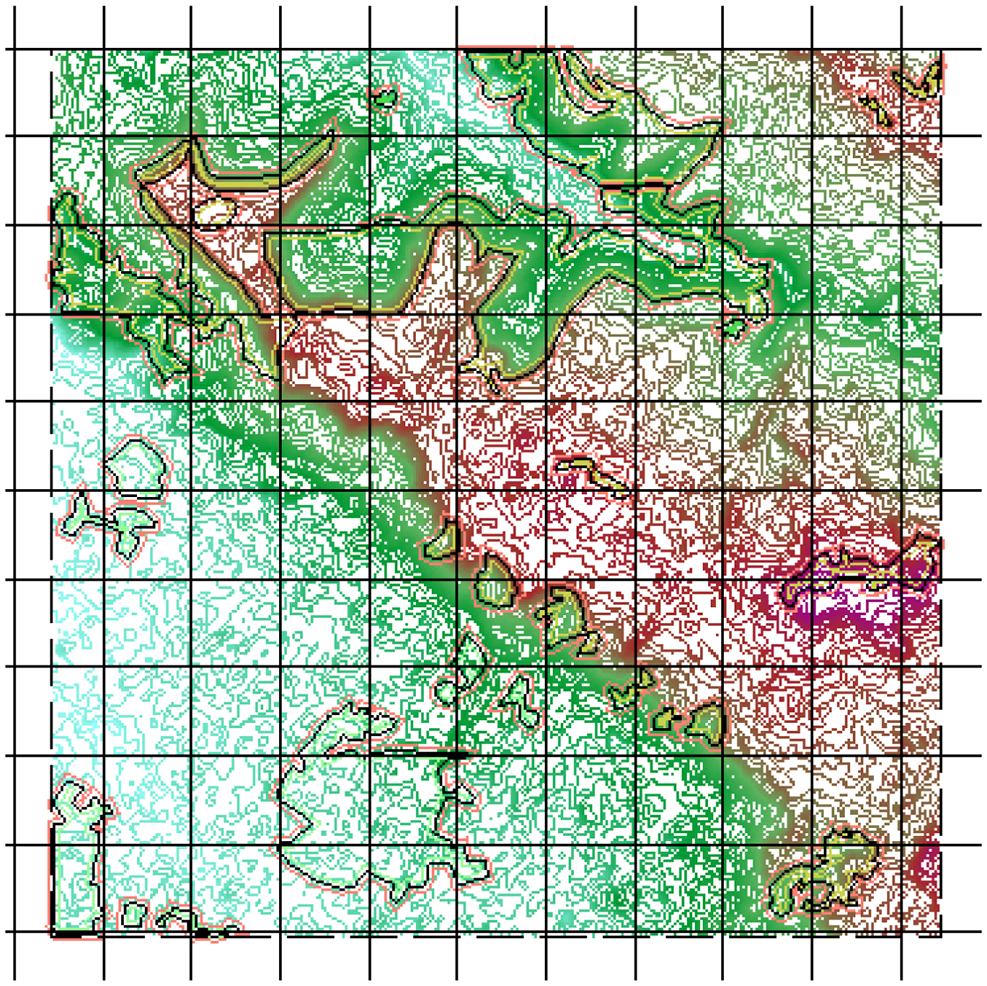
Vector map of the study area showing roughness and height contours.
Resource grid
Resource grid is a rectangular set of points for which summary of predicted wind climate data is calculated. The points are regularly spaced and are arranged into rows and columns. The resource grid is used to see a pattern of wind climate or wind resources for an area. Each point in the grid is like a simpler version of a normal turbine site. All the points have the same height a.g.l. If a wind turbine generator (WTG) is associated with the grid, then that specification is used for all of the points in the grid (WAsP 11). For each point in the grid, WAsP calculates the following data which can be displayed in the resource grid: elevation, mean wind speed, mean power density, annual energy production (AEP) (if a WTG is associated), Weibull-A value, Weibull-k value, ruggedness index (RIX), and delta-RIX (dRIX) performance indicator.
Result and discussion
Data screening and validation
Data screening and validation were conducted as per the procedure discussed in section “Data collection, screening, and validation.” The summary of the results of the data screening and validation is shown in Table 2. The data recovery rate was found to be around 98%. Measures were taken to replace the missing and erroneous data records when necessary. During data inspection, a large number of consecutive missing data which ran for up to 14 days were observed. There was no measure taken to fill these missing data since it is a large number of data and it is not possible to fill it by average values of the nearby data records. Wind shear coefficient will be negative if the wind speed at 40 m height is less than wind speed at 10 m height and it will be undefined when the wind speed at 40 m height is zero while the wind speed at 10 m height is greater than zero. The negative and undefined wind shear coefficients were corrected by power law using the average wind shear coefficient calculated based on overall average wind speeds at 10 and 40 m. Very large wind speed records surrounded by smaller records were inspected. This was corrected by replacing the abnormally large wind speed by the average of the wind speed records just above and below the large wind speed.
Results of measured data analysis
Average wind speed and power density
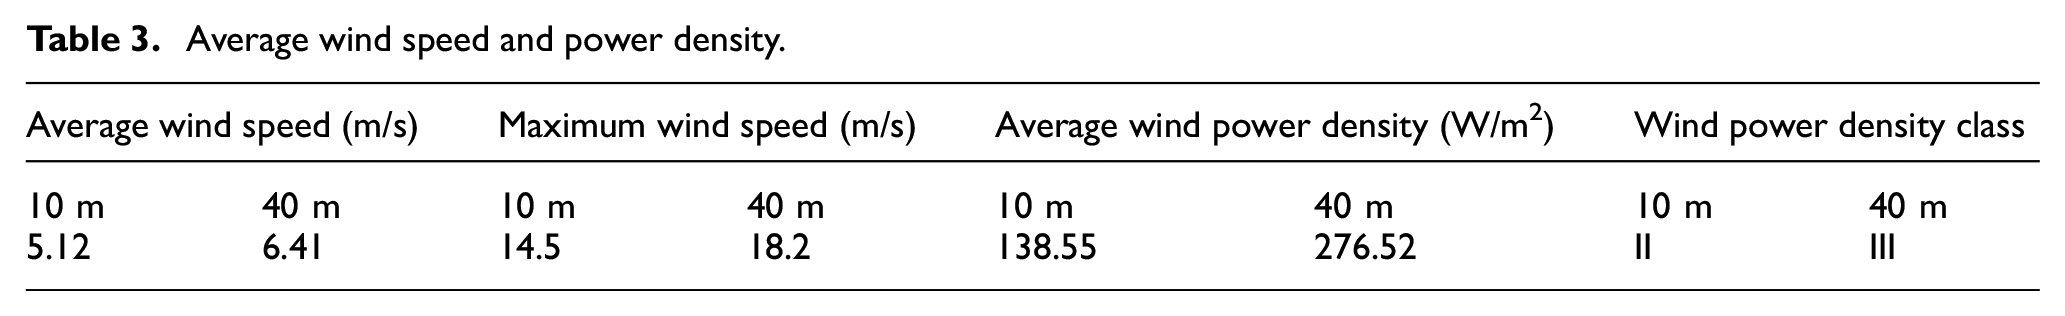
The overall average wind speed and average power density of the data during the period were calculated based on the equations discussed in section “Measured data analysis.” The results obtained are shown in Table 3. Included in this table is the maximum wind speed recorded averaged in the 10-min measurement interval. The wind power density class at each height for the respective sites as per the standard classification reported in Bailey and McDonald (1997) is also shown in the table.
Average wind speed and power density.
Wind shear
The wind shear coefficients were calculated based on the overall average wind speeds at 10 and 40 m using power law as per the equation shown in section “Wind shear coefficient.” The wind shear coefficient was calculated based on the overall mean wind speeds at 10 and 40 m and was found to be equal to 0.163. The wind shear profile of the site was plotted based on the calculated coefficient as shown in Figure 4.
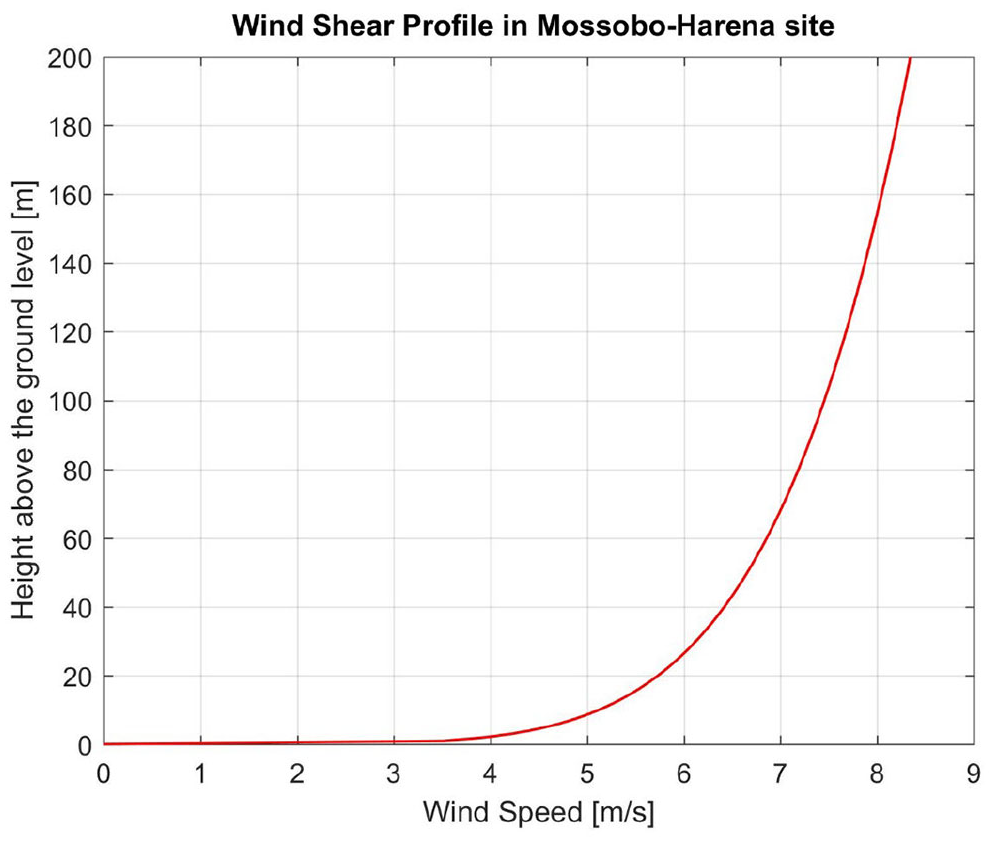
Wind shear profile.
TI
The average TI was calculated based on the formula discussed in the methodology section “Turbulence intensity.” The TI of each wind speed record was calculated by dividing the standard deviation of wind speed and the mean TI of the site was found by taking the average of the turbulence intensities of the individual wind speed records. The results at the two heights are shown in Table 4.
Turbulence intensity.
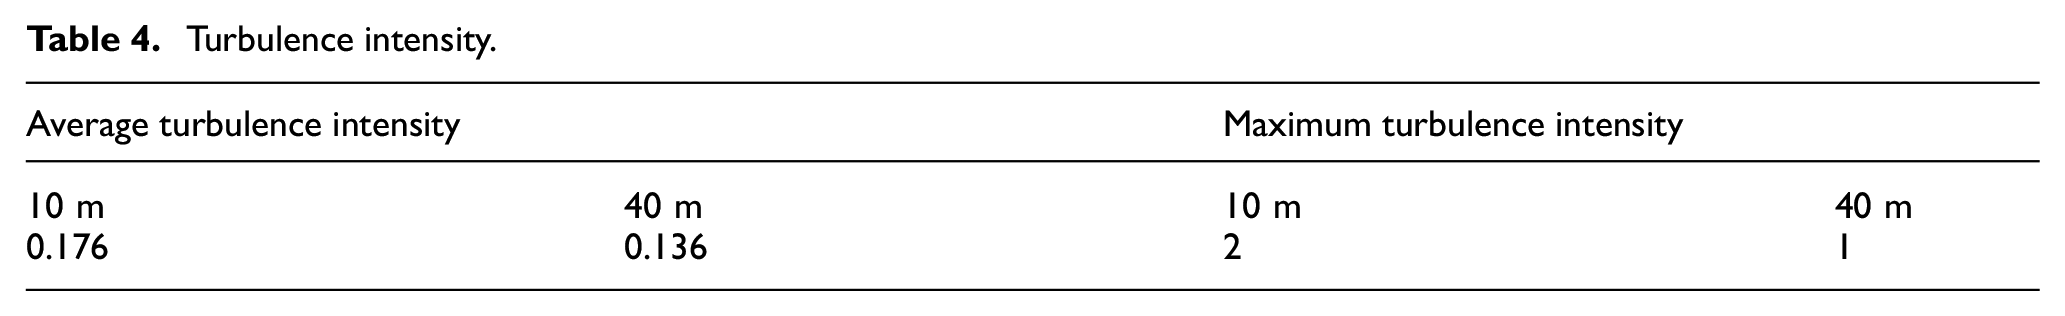
The average TI is less than 0.25 and greater than 0.1 which indicates that the site has a moderate TI in the sites. As shown in Figure 5, the TI decreases as wind speed increases as it is the ratio of standard deviation and wind speed.
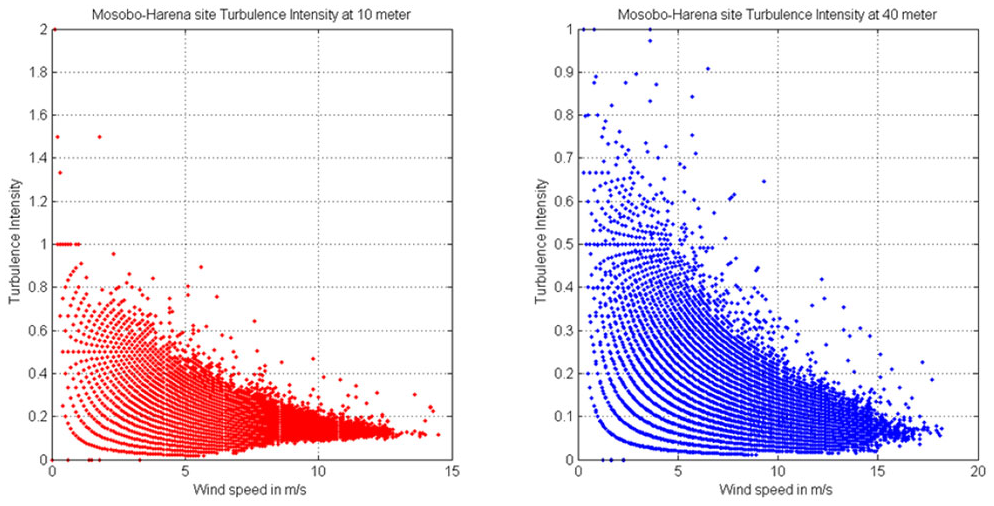
Turbulence intensity.
Results of WAsP modeling and analysis
OWC
OWC is a tabular summary of the frequency of occurrence of wind speed versus wind direction. The time series of wind speed and direction data were transformed into a table which describes a time-independent summary of the conditions found at the measuring site using the WAsP software. Figures 6 and 7 show the OWC results of the site at 10 and 40 m a.g.l.
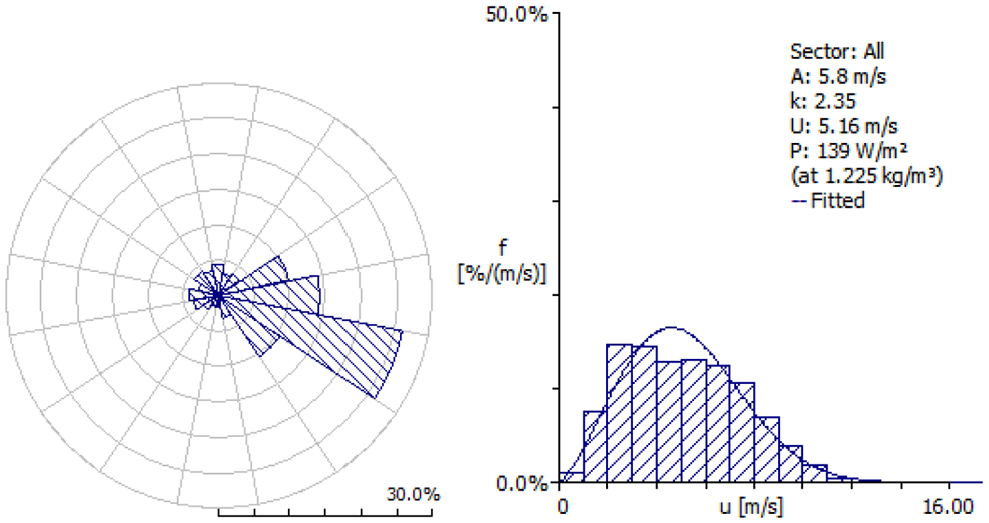
OWC at 10 m a.g.l.
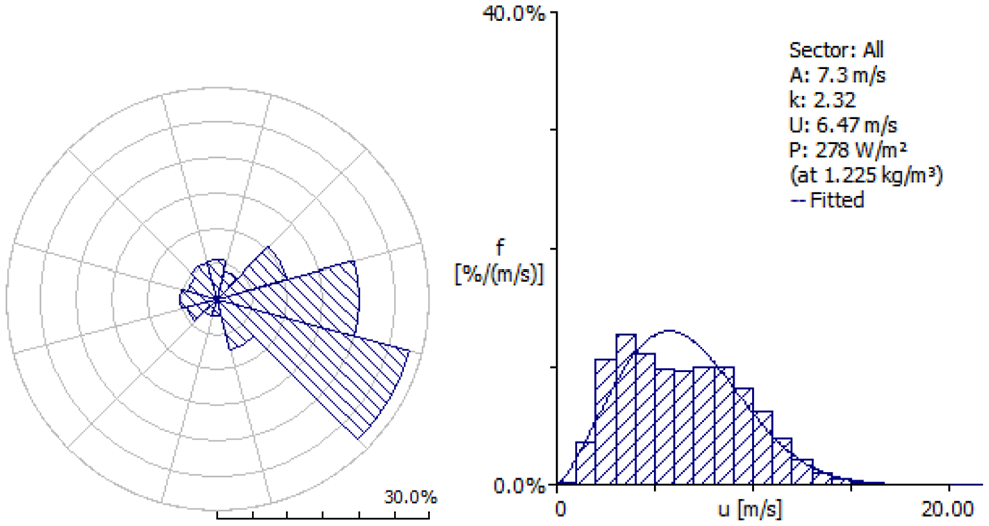
OWC at 40 m a.g.l.
As shown in Figures 6 and 7, the OWC result from WAsP has two parts, the wind rose indicating the wind direction distribution and the Weibull function overlaid on the bar chart of the raw data. The Weibull parameters, the average wind speed, and power density are also shown on the side of the Weibull function plot. The results shown as OWC were used as an input to determine the wind atlas of the site.
Generalized wind climate (wind atlas)
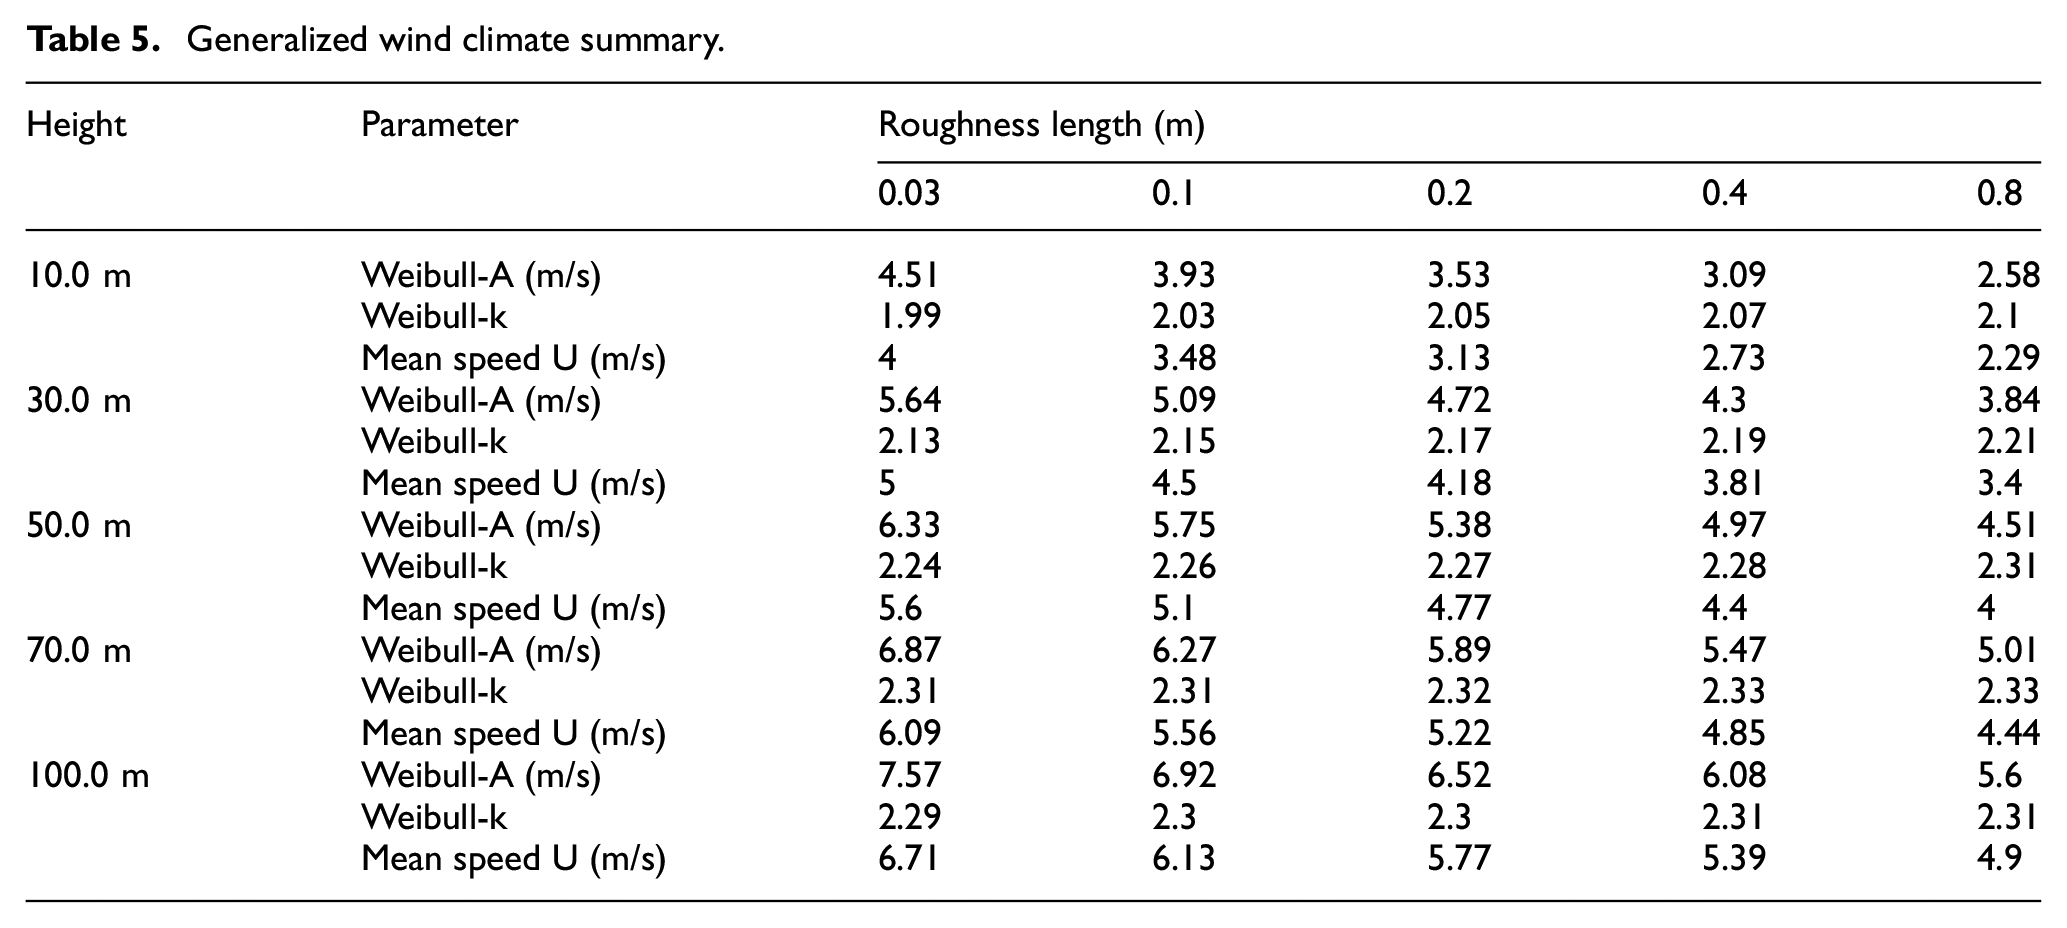
OWC is site-specific data from the measuring mast. Based on the OWC, generalized wind climate or wind atlas data sets are generated. Wind atlas data sets are site independent data sets and the wind distributions have been reduced to certain standard conditions. The results are tabulated for the five reference heights and five roughness lengths in terms of the Weibull parameters A and k, average wind speed, and power density. The wind atlas contains data for five reference roughness lengths (0.000, 0.030, 0.200, 0.400, and 0.800 m) and five reference heights (10, 25, 50, 100, and 200 m) a.g.l. Table 5 shows the summary of the generalized wind climate (wind atlas data sets) generated using the 40 m OWC. WAsP version 12.01 used for this study uses a new geostrophic wind shear model where the vertical and horizontal extrapolation models are modified to take into account large-scale horizontal temperature gradients (“baroclinic” effects), which induce geostrophic wind shear. The method is implemented by extracting average geostrophic-scale wind shear from global Climate Forecast System Reanalysis (CFSR) reanalysis data, with values from the nearest grid points automatically used to provide more accurate AEP predictions.
Generalized wind climate summary.
WTG selection for estimation of AEP
To ensure an appropriate level of safety and reliability, the environmental parameters shall be taken into account during the selection of appropriate wind turbines. Wind turbines are grouped into classes according to IEC 61400-1, Rev 3 depending on their ability to withstand defined wind conditions. These classes are characterized by the 10-min average value of the extreme wind speed with a transgression probability once every 50 years and by annual mean wind speed at hub height criteria, the subclasses A and B refer to the TI at a wind speed of 15 m/s at hub height.
Wind turbines are divided into four classes with respect to the design wind conditions. The classes are defined by wind speed and turbulence data (Table 6). The wind data forming the basis for the design are characterized by:
the mean annual wind speed vw;
the maximum wind speed to be expected as a mean value over 10 min, the so-called reference wind velocity (veref); and
the so-called characteristic TI at a wind speed of 15 m/s (I15).
Basic wind parameters at rotor hub height for wind turbine classes.
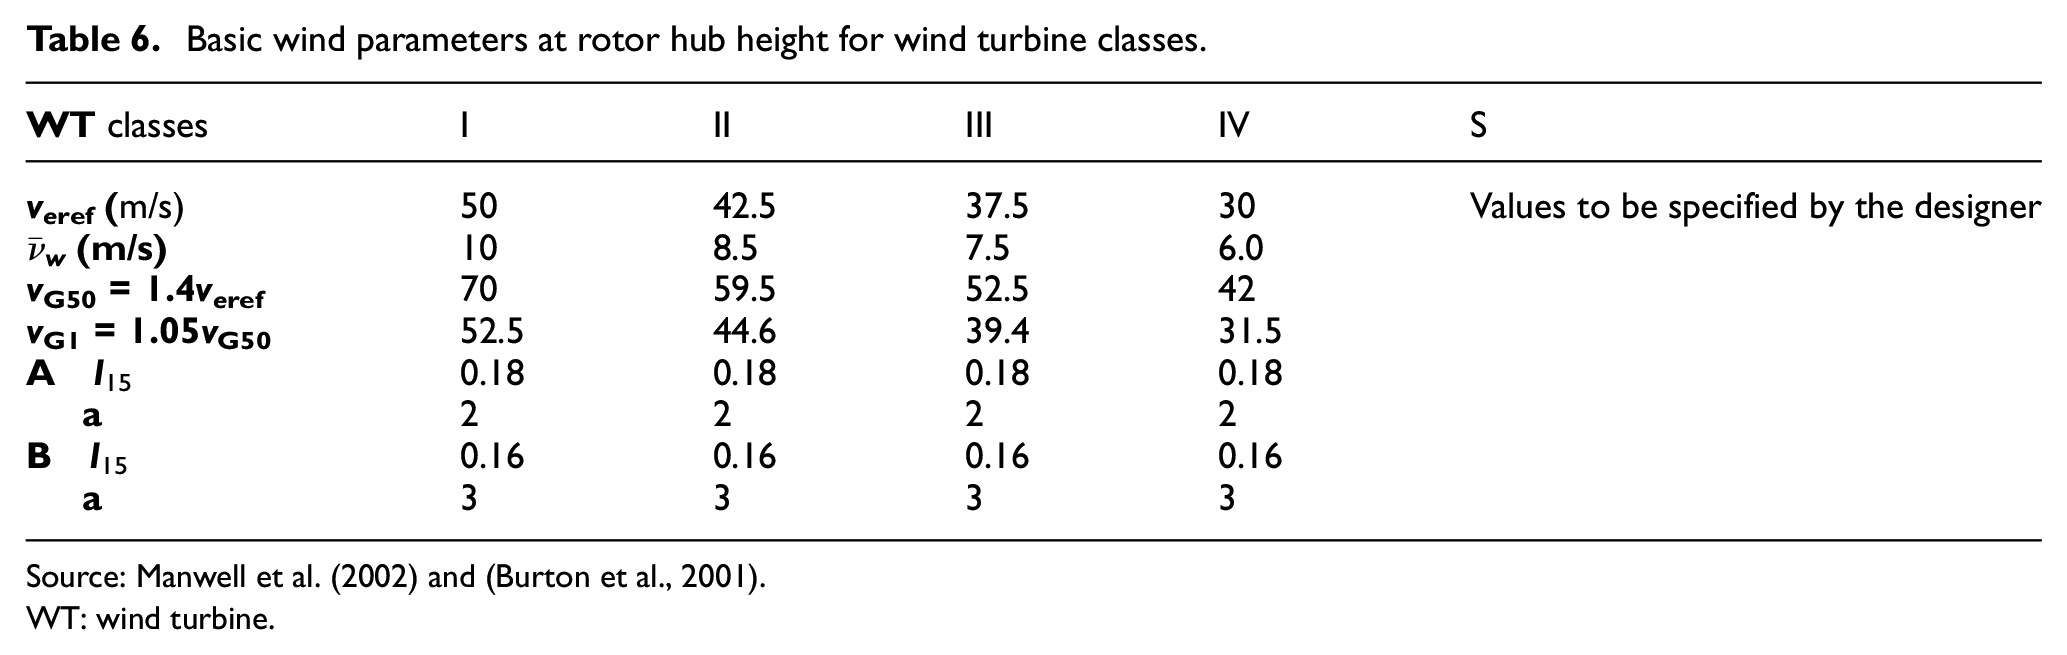
Source: Manwell et al. (2002) and (Burton et al., 2001).
WT: wind turbine.
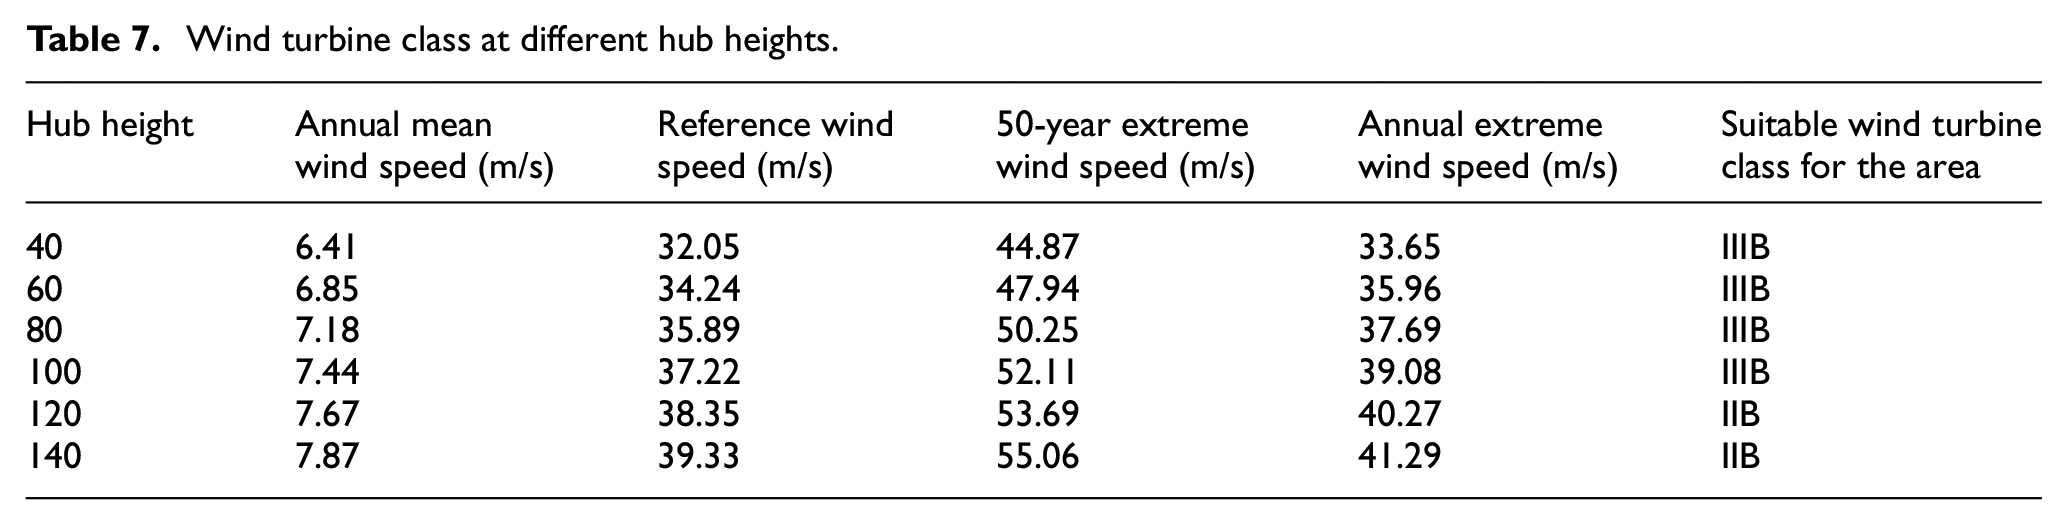
Wind turbine class at different hub heights.
Within the four classes, the two categories A and B characterize the design for different turbulence conditions. The standard deviation (σ1) of the longitudinal wind velocity (turbulence) is specified by the parameter a.
The wind speed parameters for IEC wind turbine classification are given in Table 6. Class I turbines are designed to operate in the harshest climates, with strong annual average wind speeds and turbulent wind. Class II turbines are designed for most typical sites and Class III and IV turbines are designed for low wind resource sites.
The IEC (2005) standard specifies a “reference wind speed”veref which is five times the annual mean wind speed. The 50-year extreme wind speed vG50 is then given by 1.4 times veref at hub height, and varying with height using a power law exponent of 0.11. The annual extreme wind speed vG1 is taken as 75% of the 50-year value (Burton et al., 2001). The annual average wind speed of the site at different hub heights can be read extrapolated from the 10-min average wind speed at 40 m and using equation (3) and shear coefficient of 0.163 calculated for determination of wind shear profile.
Wind turbine Class III is suitable for the site for hub heights ranging from 40 to 100 m and for hub heights from 100 to 140 m, wind turbine Class II is suitable. The average TI of Mossobo-Harena site—measured at Mossobo-Harena measuring mast—at 40 m is 13.6%. This leads that Mossobo-Harena site to be classified as IEC wind Class IIIB, the lowest wind class meaning that wind turbines of Class III or Class II on the current market can be suitable for development of wind park in the area.
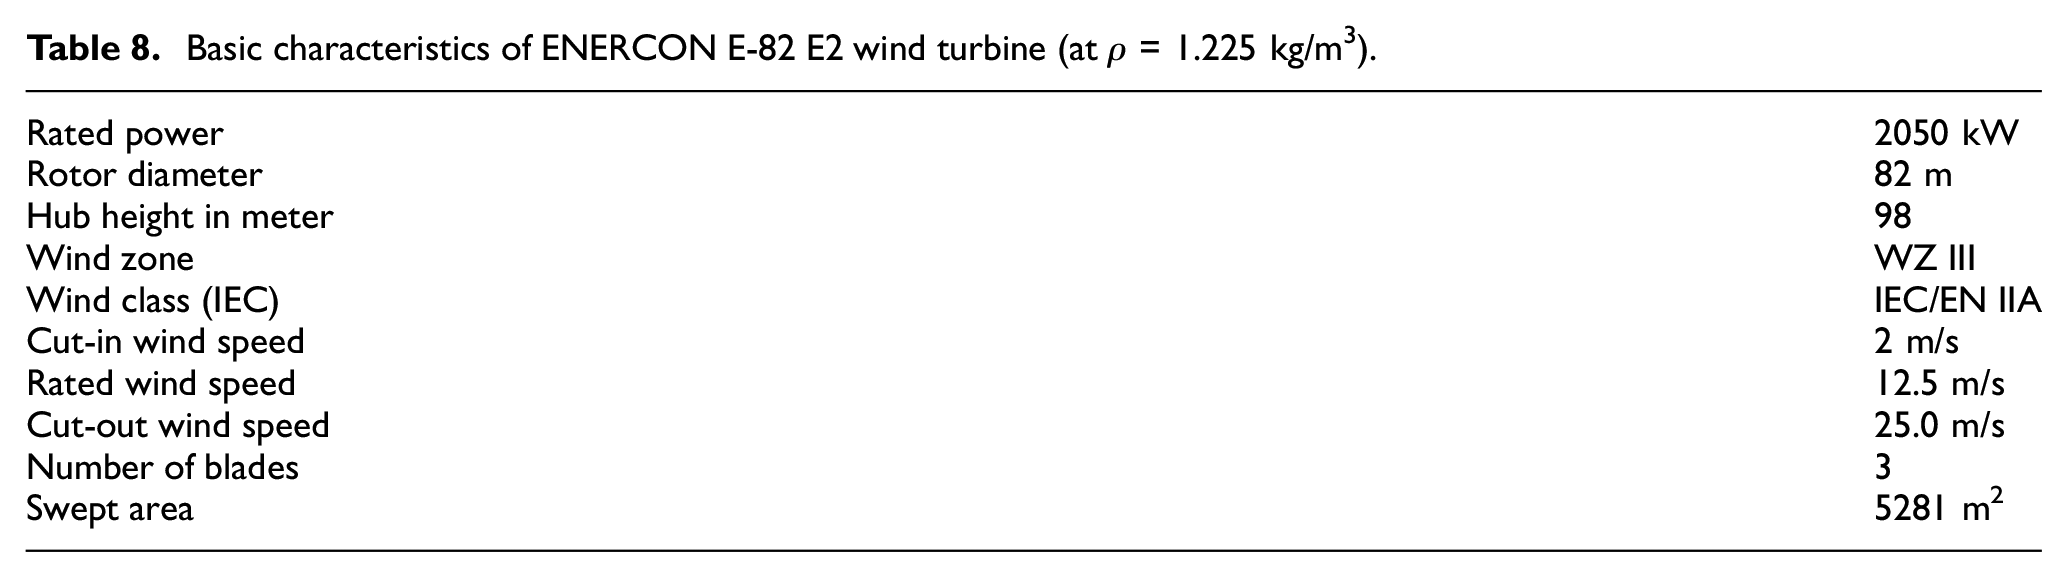
In addition to the wind class of the site, to select appropriate wind turbine for the site, the distribution of wind speed, TI of the site, the cut-in, rated, and cut-out wind speed of the turbine generator, and availability of the turbine in the market are taken into consideration. Considering the site’s wind resource potential, IEC wind turbine Class II or Class III with low cut-in wind speed (2–3 m/s), rated wind speed (12–13 m/s), and cut-out wind speed of 25 m/s is appropriate for the site. For the purpose of this study, ENERCON E-82 E2 WTG is selected due to its ability to work effectively in low to medium wind resource sites with low cut-in and rated wind speeds. ENERCON E-82 E2 has a rotor diameter of 82 m and comes with 78, 84, 85, 98, 108, and 138 different hub height alternatives.
For the purpose of this study, a hub height of 98 m is selected to maximize the AEP of the turbine. During feasibility study of the wind farm project, a detailed economic analysis and other considerations like topographical conditions on-site, turbine availability of the Ethiopian market, transportation, foundation work, and erection should be done to decide on the hub height of the turbine from the various alternatives. The E-82 E2 wind turbine has the following basic operational data and power curve (Figure 8 and Table 8).
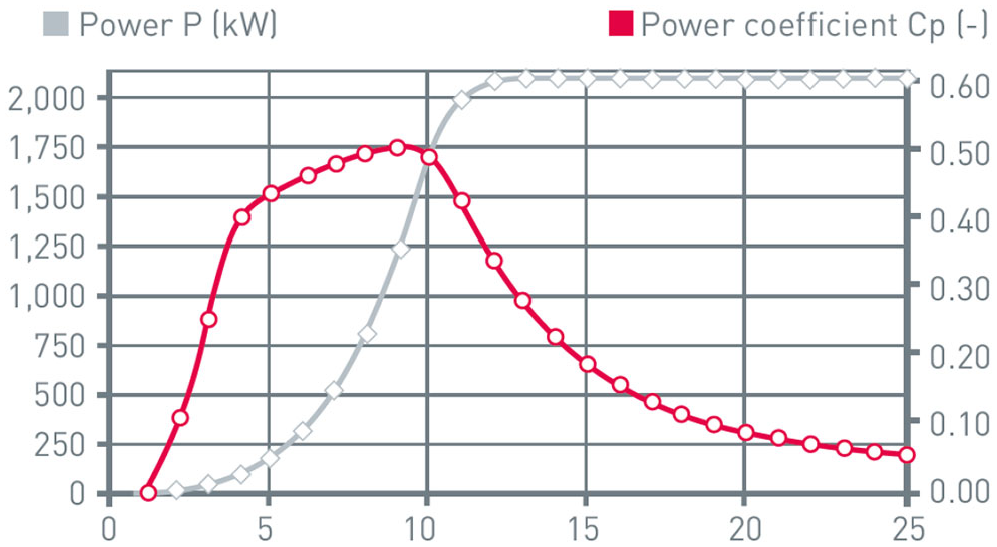
Power curve of ENERCON E-82 E.
Basic characteristics of ENERCON E-82 E2 wind turbine (at ρ = 1.225 kg/m3).
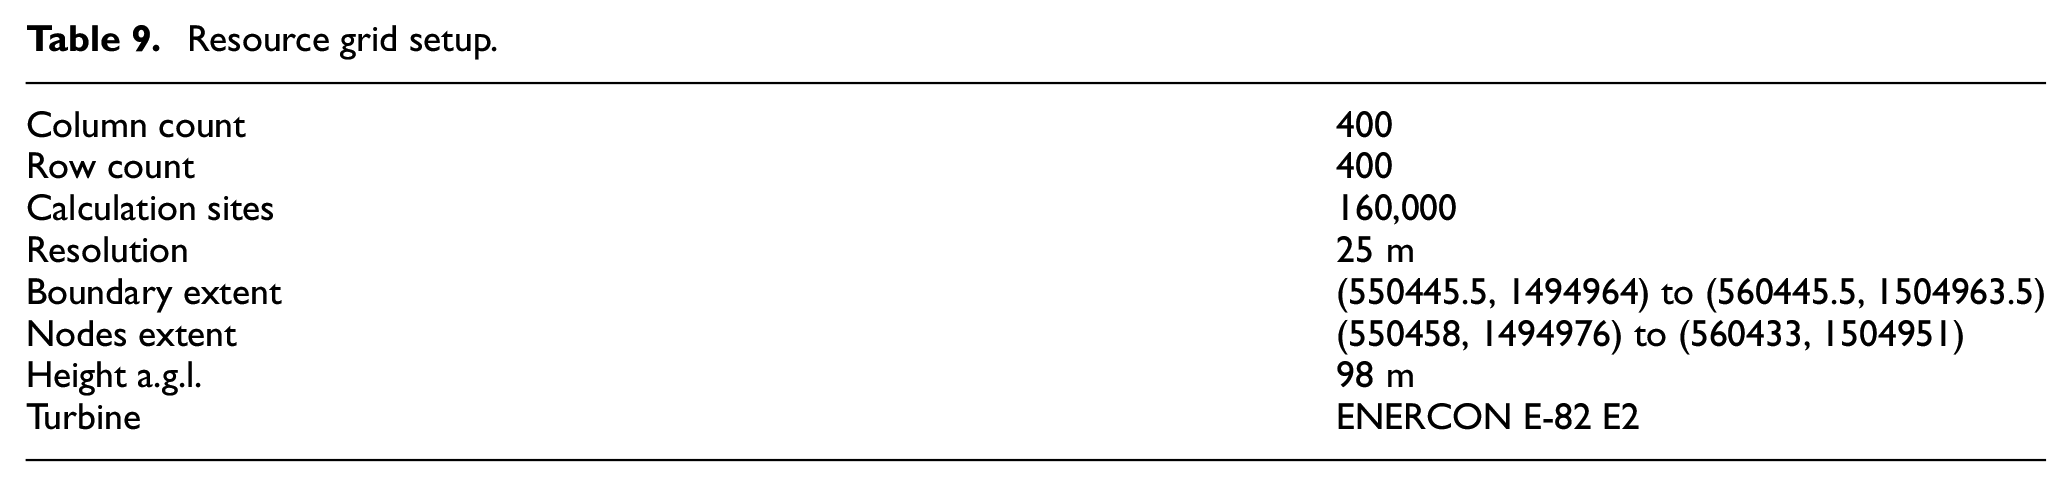
Resource grid at 98 m a.g.l
WAsP was used to generate the resource grid of the site and resource grid was setup as shown in Table 9. Inputs required in addition to the wind atlas are the vector map, roughness map, and obstacle groups around the measurement mast. The software then provided gridded maps of the wind speed, power density, AEP, Weibull parameters, RIX, change in RIX, and other grid results. ENERCON E-82 E2 wind turbine was associated with the resource grid to estimate annual energy. The main results from the resource grid are shown in Figures 9 to 11.
Resource grid setup.
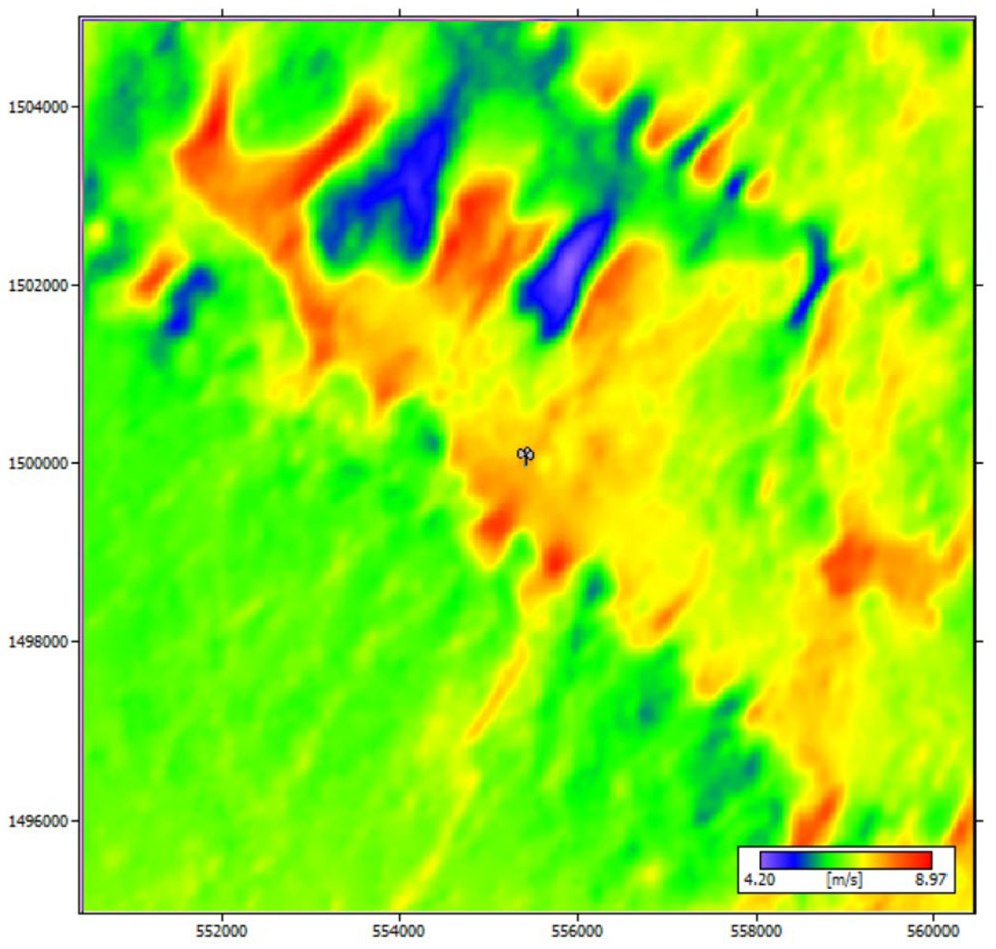
Mean wind speed.
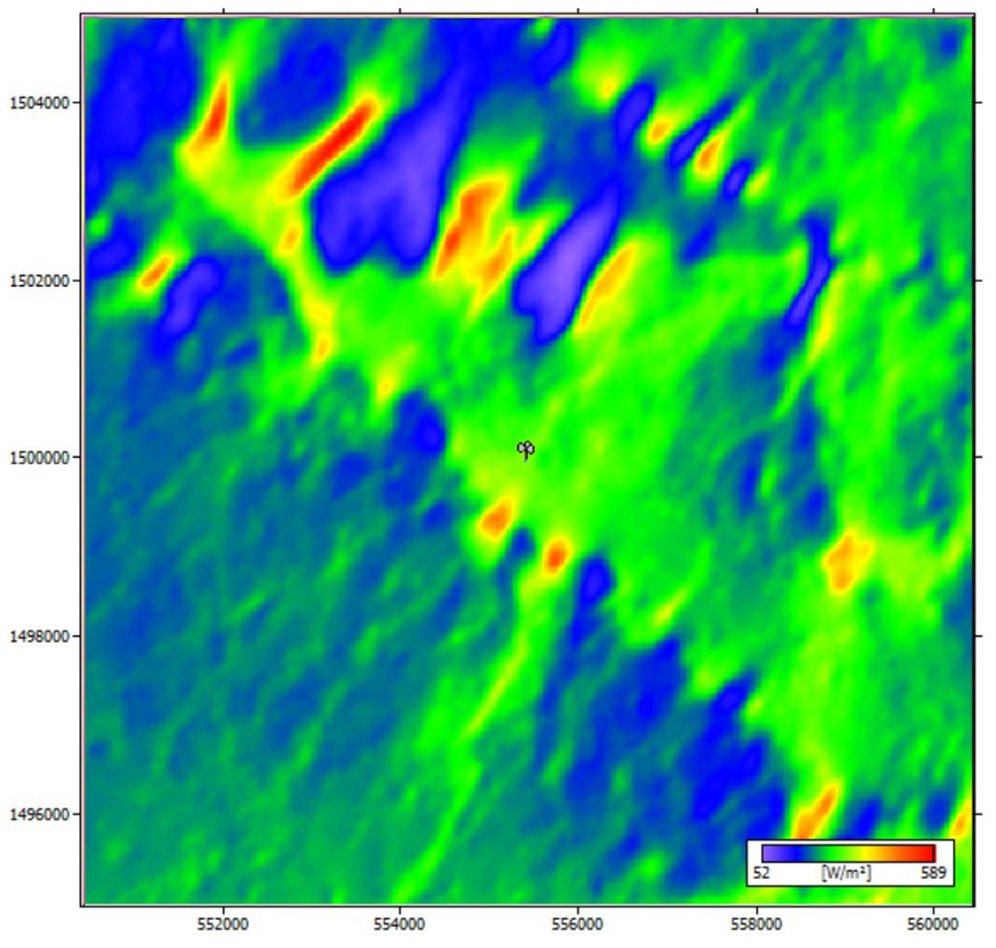
Power density.
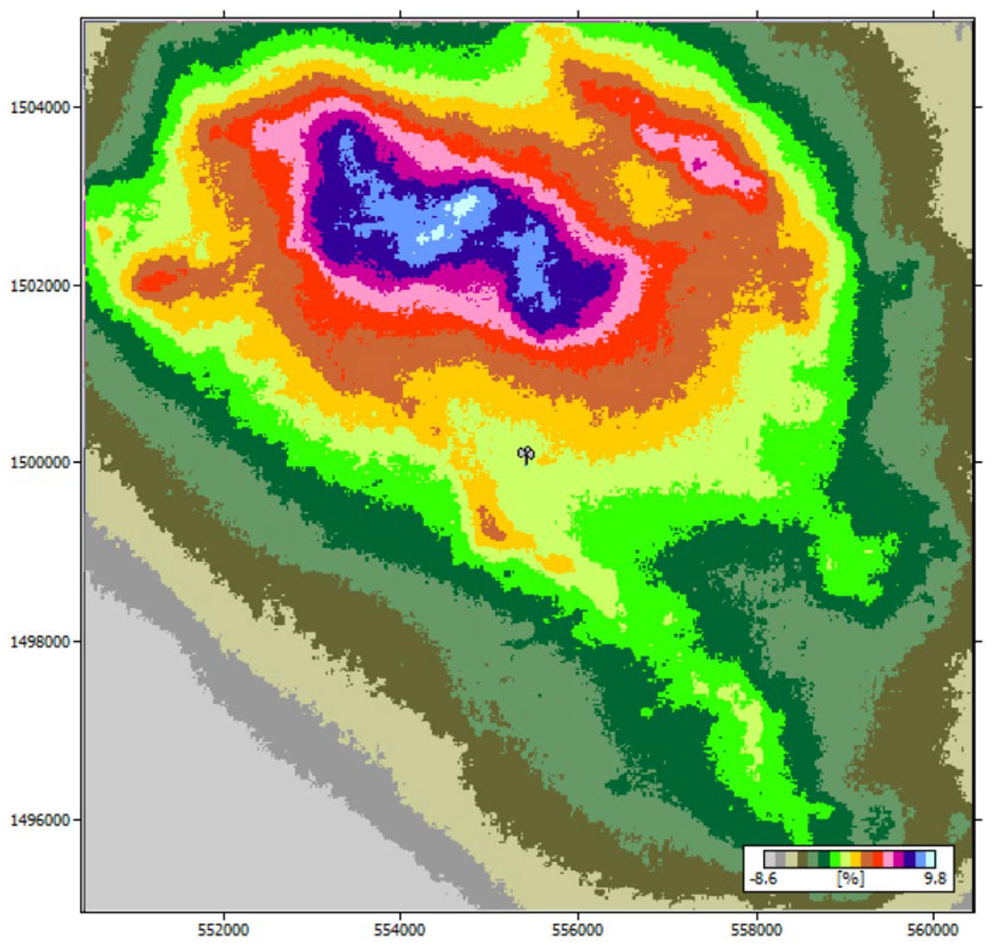
Change in ruggedness index.
Resource grid results
The overall resource grid statistics at 98 m above the ground level is shown in Table 10. As shown in the table, the mean wind speed and power density at 98 m above the ground level are 6.65 m/s and 235 W/m2, respectively.
Overall resource grid statistics at 98 m a.g.l.
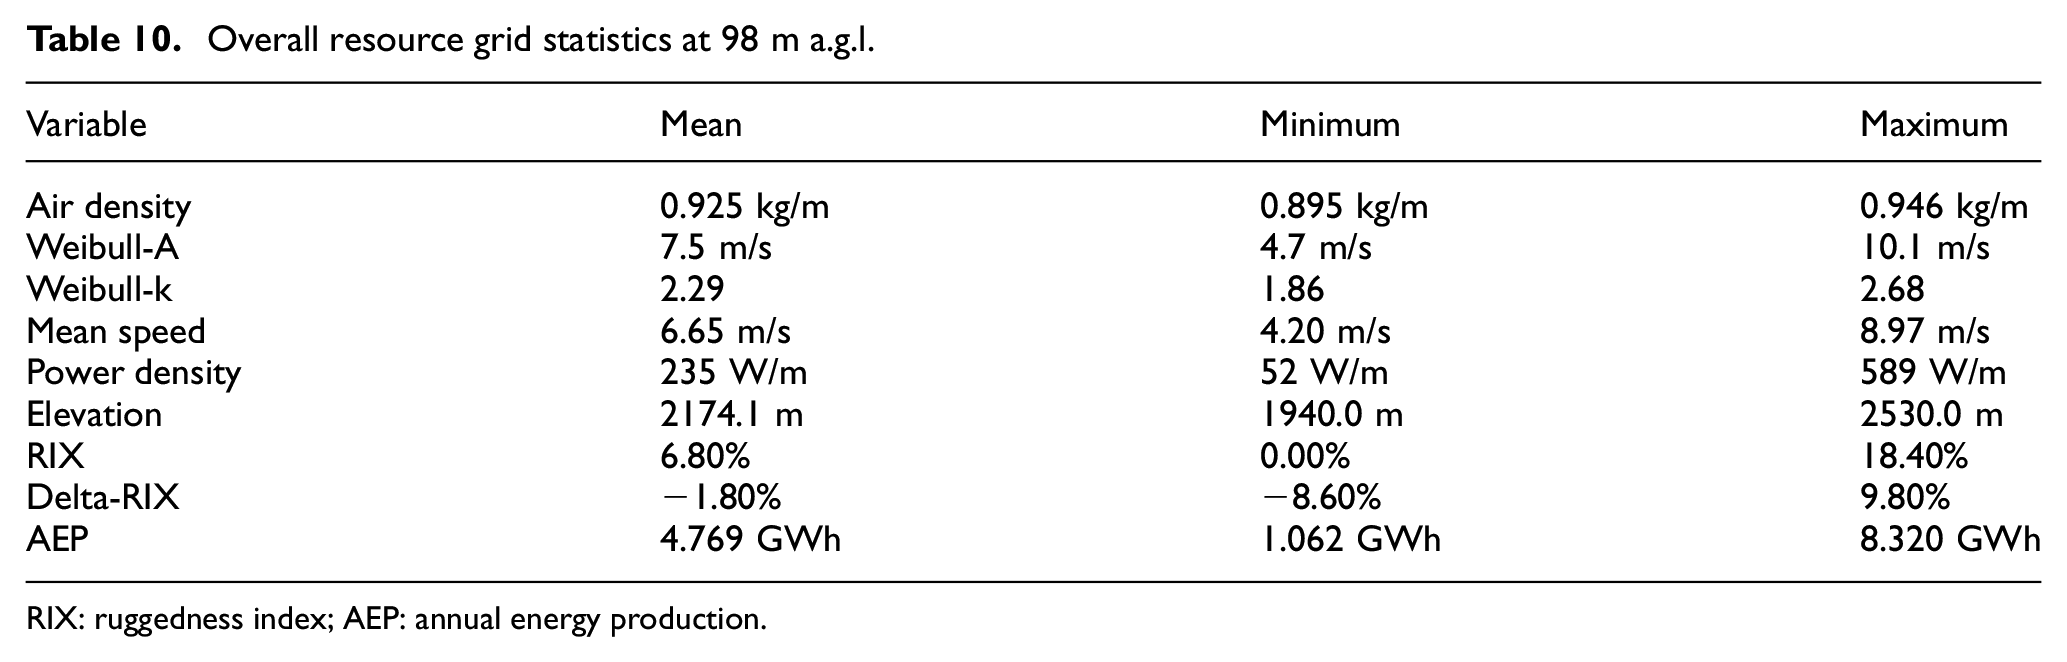
RIX: ruggedness index; AEP: annual energy production.
The mean AEP from the associated ENERCON E-82 E2 wind turbine is 4.679 GWh and the maximum and mean change in RIX of the site are 9.8% and −1.80%, respectively. The relation between the orographic performance indicator, dRIX, and the wind speed prediction error is given in Figure 12. The results were obtained from cross-predictions between five metrological stations in complex terrain in Northern Portugal. The data shown in the figure are from five Portuguese sites.
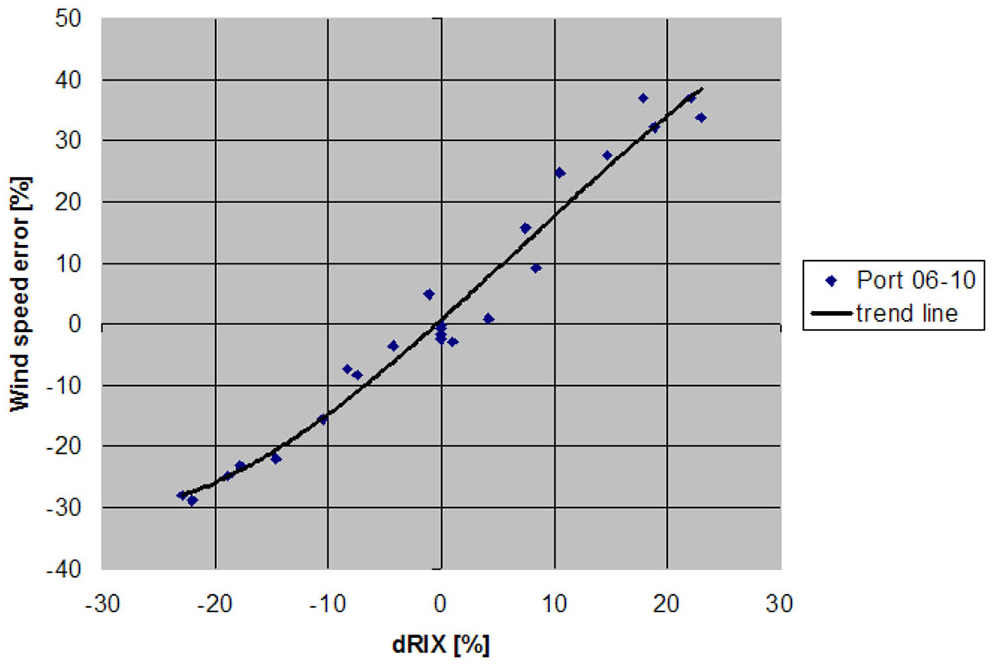
WAsP wind speed prediction error versus the difference in extent of steep slopes (RIX values) between the predicted and the reference site (WAsP 11).
As shown in Figure 12, as dRIX increases, the wind speed prediction error is increased. In Mossobo-Harena area, the maximum dRIX is 9.80%. According to Figure 12, a maximum of about 17% of wind speed error is expected. The mean value of dRIX is −1.8% which results in about 2% overall wind speed prediction error in the Mossobo-Harena area. As shown in Figure 11. most of the top flat topographical area of the site where the measuring mast is located has a lower change in RIX with respect to the metrological site indicating that the wind speed prediction error in this part of the site is low.
Wind speed and power density maps at 50 m
Wind speed and power density resource grid files at 50 m above the ground level were exported as Surfer grid files and Surfer software was used to create the final wind speed and power density maps at 50 m above the ground level. The wind speed and power density were divided into the following seven standards which are widely accepted in wind energy technology (Table 11). The wind speed and power density resource maps developed by Surfer are shown in Figures 13 and 14.
Wind power density classes.

Source: Manwell et al. (2002).

Mossobo-Harena wind speed map at 50 m.
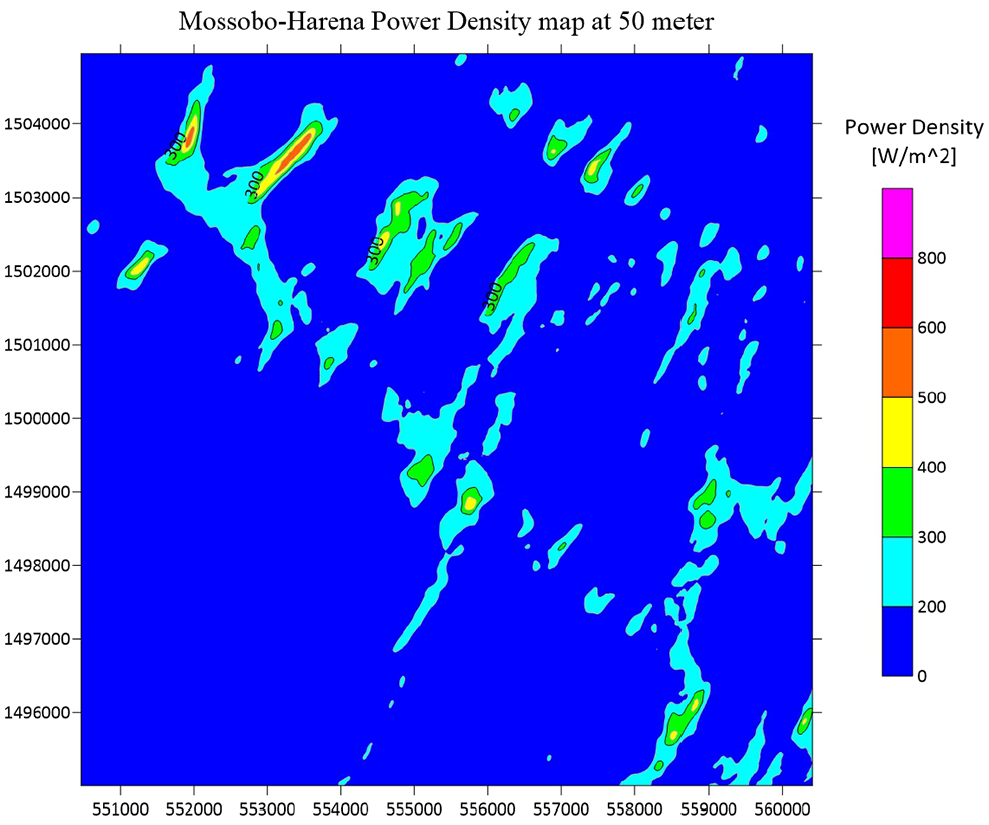
Mossobo-Harena power density map at 50 m.
The color map was done in such a way that the change in color designates a change in wind class, that is, blue (Class 1), Cyan (Class 2), green (Class 3), yellow (Class 4), orange (Class 5), red (Class 6), and magenta (Class 7). As shown in the figures, the majority of the site is covered by Class 1 area which is not suitable for wind energy development. The vicinity area of the wind mast is covered mainly by Class 2 and 3 sites can be used for wind energy development using tall turbines. As shown in the wind speed and power density maps developed and the Google Earth synchronization in Figure 15, the Mossobo-Harena site has a good wind resource potential at the top of the Mossobo-Harena ridge. Wind power density Class 2 and 3 sites are suitable for wind farm development using tall (high hub height) turbines. Google Earth synchronization of wind speed map at 50 m is shown in Figure 15.
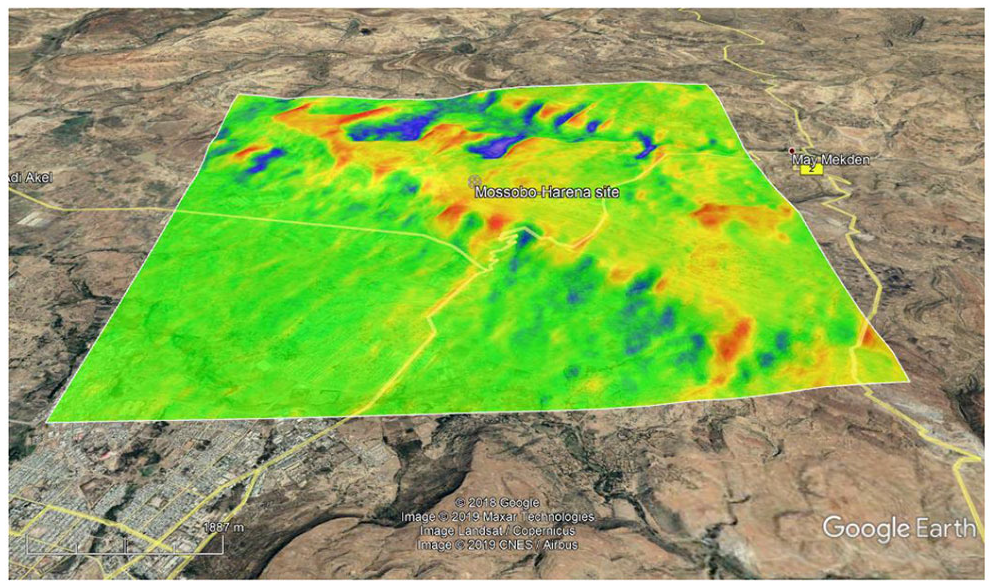
Wind speed map synchronization with Google Earth.
Wind farm modeling and estimation of AEP
Turbine siting and wind farm layout
A wind farm layout was developed in the study area to estimate AEP. Since the most important factor that should be considered when choosing a wind turbine location is the wind resource potential of the area, the location of turbine sites was chosen based on the wind speed map of the site which had been generated by WAsP.
Siting of turbines was done only considering energy production potential with minimum wake losses and thus other socioeconomic and road accessibility considerations were not considered. Other factors associated with installing WTGs like the suitability of the ground to install WTGs, economic and social factors require a detailed investigation and experience in the field and so many field measurements.
Based on the rule of thumb that is used to design a wind farm layout, turbines in a wind farm are usually spaced somewhere between five and nine times the rotor diameters apart in the prevailing wind direction, and between three and five times the rotor diameters apart in the direction perpendicular to the prevailing winds. The wind turbine selected for this study has a rotor diameter of 82 m and thus the turbine should be spaced 410–738 m apart in the prevailing wind direction and 246–410 m apart in the direction perpendicular to the prevailing wind direction. Therefore, in this research turbines are sited with a minimum of 650 m of spacing in prevailing wind direction and 400 m of spacing in the direction perpendicular to prevailing winds so as to optimize AEP with minimum wake loss and land availability.
In order to simplify the installation, operation, maintenance, and efficient power transmission of the wind park, groups of wind turbines are locally concentrated and installed forming a turbine cluster. A turbine cluster consists of a set of turbine sites which differ from each other in their map location. The proposed wind site has an area coverage of 10 km × 10 km on which a total of 98 turbines were sited (Figure 16).
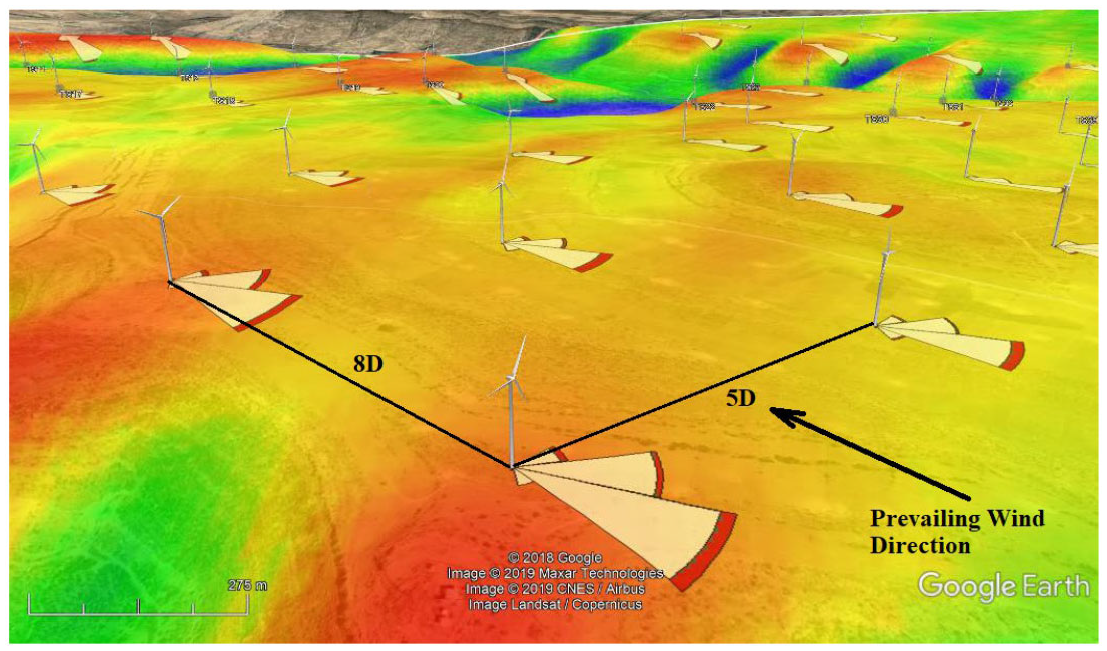
Siting and spacing of wind turbines in the wind farm.
The turbine sites were selected using the following points:
Sites having good mean wind speed were selected by the aid of the wind speed map at 50 m.
The Google Earth synchronization of the wind speed map was used to select turbine sites that are relatively flat (low RIX values).
The areas were also selected in such a way that it is not situated on towns, villages, roads, water bodies, and mountains.
The turbines were carefully sited with the help of Google Earth synchronization so that the farm produces higher annual energy with minimum wake loss (Figure 17).

WAsP resource grid map, showing the AEP potential, layout of the turbines, and prevailing wind direction.

Gross AEP and wake loss of turbine sites.
Mossobo-Harena wind farm results
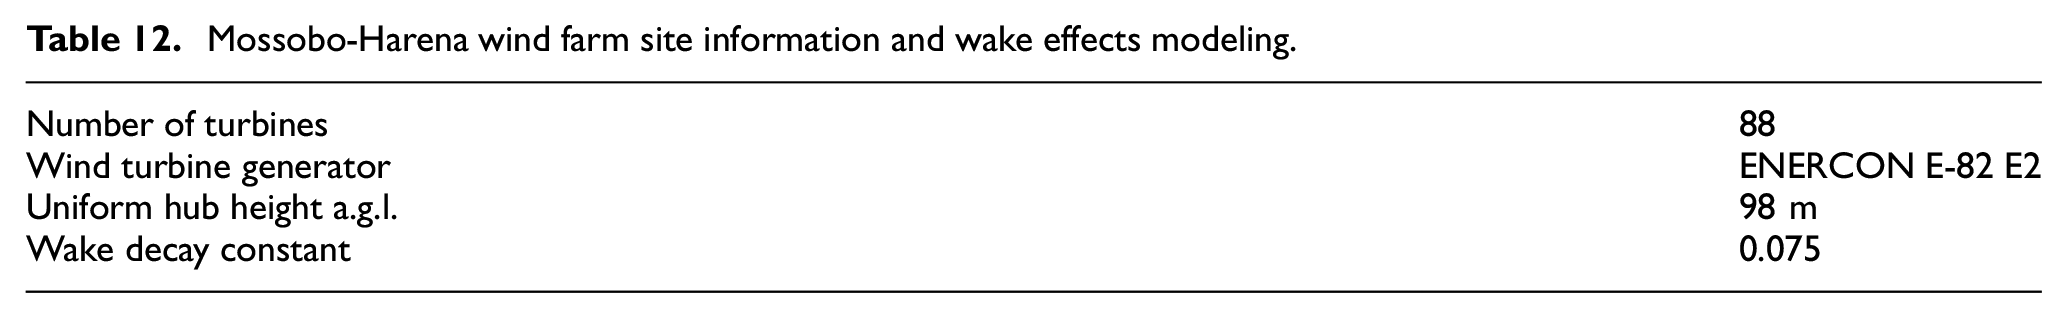
Site information and wake effects modeling
Wake losses are modeled using PARK2 wake model in WAsP (Table 12). Summary of wind farm results is shown in Table 13.
Mossobo-Harena wind farm site information and wake effects modeling.
Summary of results of Mossobo-Harena wind farm.
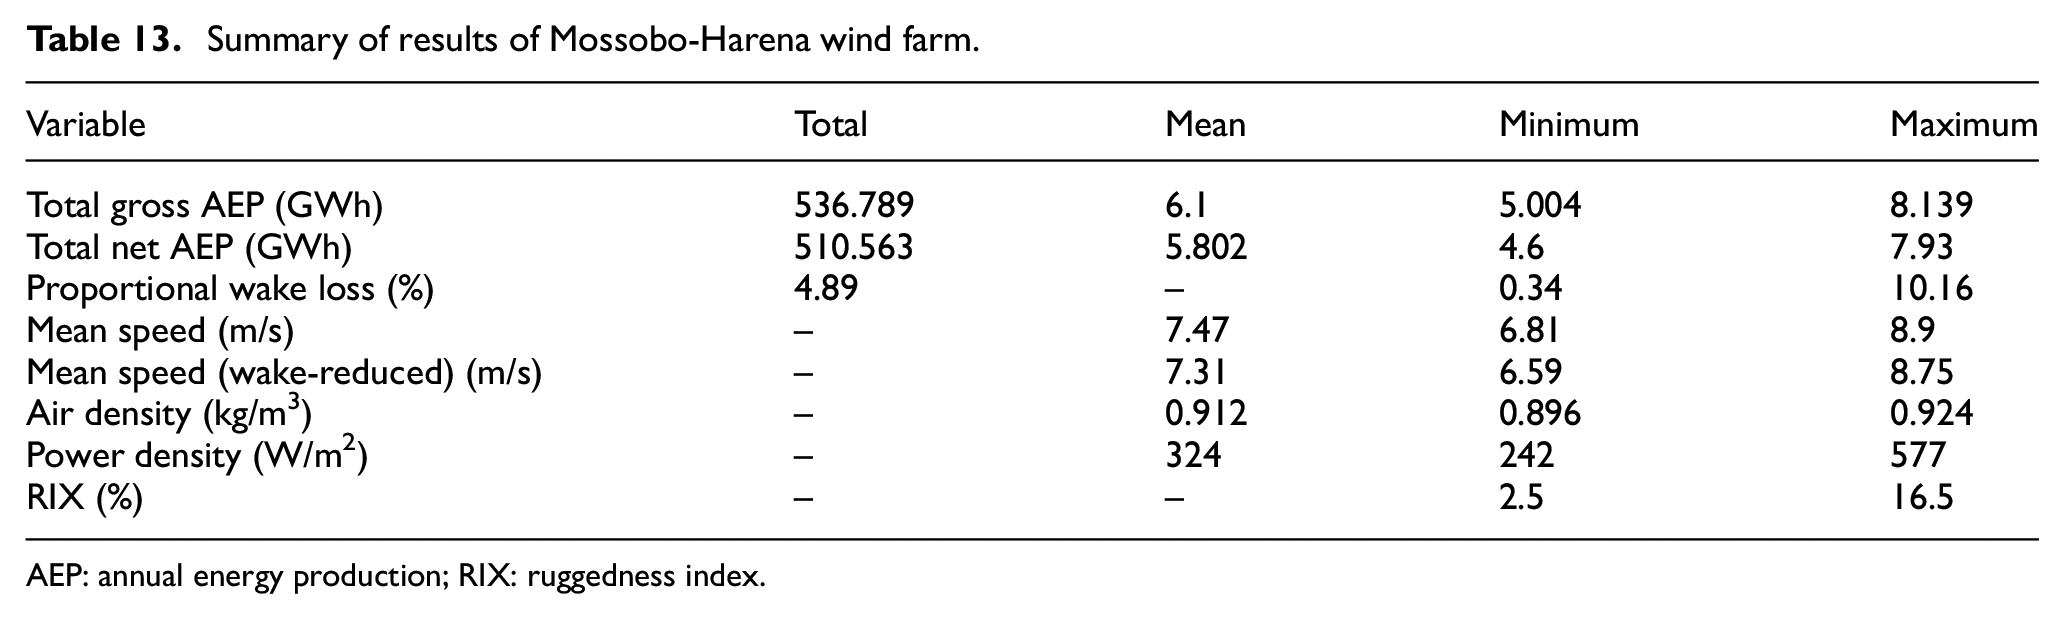
AEP: annual energy production; RIX: ruggedness index.
Mossobo-Harena wind farm losses and capacity factor
The net capacity factor (CF) is the ratio of an actual electrical energy output over a given period of time to the maximum possible electrical energy output over that period. The rated power of the selected wind turbine, ENERCON E-82 E2, is 2.05 MW. The rated AEP of the selected turbine is calculated as follows
Rated AEP = rated power × the number of hours in a year
= 2.050 MW × 8760
= 17,957 MWh = 17.957 GWh
Rated AEP of the wind farm = rated AEP of a turbine × total number of turbines
= 88 × 17.957 = 1580.304 GWh
As shown in the wind farm summary result in Table 13, the net AEP of the wind farm is 510.563 GWh. Therefore, the CF of the farm is
CF = 510.563 GWh/1580.304 GWh
= 0.323 = 32.3%
The net AEP calculation by WAsP considers only the wind farm wake loss. But in practice, there are various other losses occurring along the electromechanical drive which reduce the overall wind farm efficiency. Thus, the total net AEP of the farm will be lower the value calculated by WAsP.
In addition to the wake loss, the various other losses that occur in a wind farm have the following approximate values (Mathew, 2006):
Wake loss = 4.89% (calculated by WAsP).
Availability (amount of time for which it is available to operate when maintenance and repair time is taken into account) = 97%.
Bearing efficiency = 99.60%.
Gearbox efficiency = 97.20%.
Generator efficiency = 96.50%.
Efficiency of frequency converter = 97.50%.
Transformer and other transmission accessories = 98.00%.
Therefore, considering the above various losses, the net wind farm efficiency would be 80.91%. Then, the new actual net AEP is calculated to be 0.8091 × 536.789 GWh = 434.315 GWh, and therefore, the actual CF of the wind farm is
CF = 434.315 GWh/1580.304 GWh
= 0.2748 = 27.48%
The usage time or equivalent full-load hours are calculated by dividing the annual energy yield by the turbines’ rated power
Usage time = annual energy yield (kWh)/rated power (kW)
= 434,315,000 kWh/2050 kW × 88 turbines
= 2407.5 h
Conclusion
In this study, wind data from Mossobo-Harena wind measuring mast were collected and analyzed. WAsP was used to generate generalized wind climate (wind atlas) of the area and develop the wind speed and power density maps at 50 m above the ground level. The measured data analysis conducted indicates that the mean wind speed at 10 and 40 m above the ground level is 5.12 and 6.41 m/s, respectively, at measuring site. The measuring site’s mean power density was determined to be 138.55 and 276.52 W/m2 at 10 and 40 m above the ground level, respectively. The prevailing wind direction in the site is from east to south east where about 60% of the wind was recorded. The resource grid maps developed by WAsP on a 10 km × 10 km area at 50 m above the ground level indicate that the selected study area has a mean wind speed of 5.58 m/s and a mean power density of 146 W/m2. The average TI of the site was found to be 0.136 at 40 m which indicates that the site has a moderate turbulence level. According to the resource assessment done, the area is classified as a wind Class IIIB site. ENERCON E-82 E2 wind turbine which is an IEC Class IIB turbine with 82 m rotor diameter and 98 m hub height was selected for estimation of AEP on the proposed wind farm. 88 ENERCON E-82 E2 wind turbines were properly sited in the wind farm with recommended spacing between the turbines so as to reduce the wake loss. The net AEP and CF of the proposed wind farm were determined to be 434.315 GWh and 27.48% after considering various losses in the wind farm.
Recommendations
This study is only a preliminary study to estimate the energy potential in the wind farm and does not include environmental, economic, and financial issue studies. For a comprehensive study, before construction and installing wind energy conversion systems, a detailed environmental, economic, and financial feasibility analysis for the proposed wind farm should be performed. It is recommended that on-site observation be carried out for each wind turbine candidate site separately to examine the challenges of individual turbine installation. In this study, development of a wind farm was undertaken by modeling the wind flow at the intended wind farm using wind flow modeling tool in WAsP. As future work, the data that have been analyzed using the WAsP tool can be cross-checked with the computational fluid dynamics (CFD) modeling tool for reducing the uncertainties and errors that arise from the WAsP modeling.
Footnotes
Acknowledgements
The author thanks his wife, Bruktawit Mekonen, and his children, Soliyana Addisu and Nathan Addisu, for their patience during the research period. The author also thanks Ato Solomon Yismaw for his encouragement and for providing him data used in the research.
Declaration of conflicting interests
The author(s) declared no potential conflicts of interest with respect to the research, authorship, and/or publication of this article.
Funding
The author(s) received no financial support for the research, authorship, and/or publication of this article.