
Abstract
The objective of this paper was to assess the performance of the Adama-II Wind Farm in comparison to the feasibility study. Using 1-year mast data, the site potential was reassessed by WAsP software and the performance of wind turbine generators was assessed by 2 years of SCADA data. The obtained mean annual wind speed and power density were 7.75 m/s, and 462 W/m2 while in the feasibility study, 9.55 m/s, and 634.6 W/m2, which resulted in 18.8%, and 27.1% deviations respectively. The prevailing and secondary wind directions obtained were ENE and NE with 35.7% and 19.1% while, in the feasibility study, ENE with 36.5% and E with 17.3%. From the SCADA data, the Capacity factor, Annual Energy Production (AEP), and Availability of wind turbines were determined as 30.5%, 398 GWh, and 95.1%. The reasons for the deviation were difference in long-term correction data and weather conditions during study period.
Keywords
Introduction
There is significant wind power potential in Ethiopia, which is estimated to be more than 10,000 MW, with a speed of 7–9 m/s (Energypedia, 2016). However, the current installed capacity is only 324 MW which is less than 5%. The Ethiopian government has a long-term plan of increasing the utilization of the resource by involving independent power producers. The case study farm here is Adama-II Wind Farm, located in the southeastern part of the country, 95 km from Addis Ababa and 7 km from Adama town. The farm’s elevation ranges from 1741 to 2173 m, and its central location is at the latitude of N 008°34′18″ and longitude of E 039°12′10″ (Hydro China Corporation, 2013; Tadesse, 2014). Figure 1 shows the location map of the wind farm.
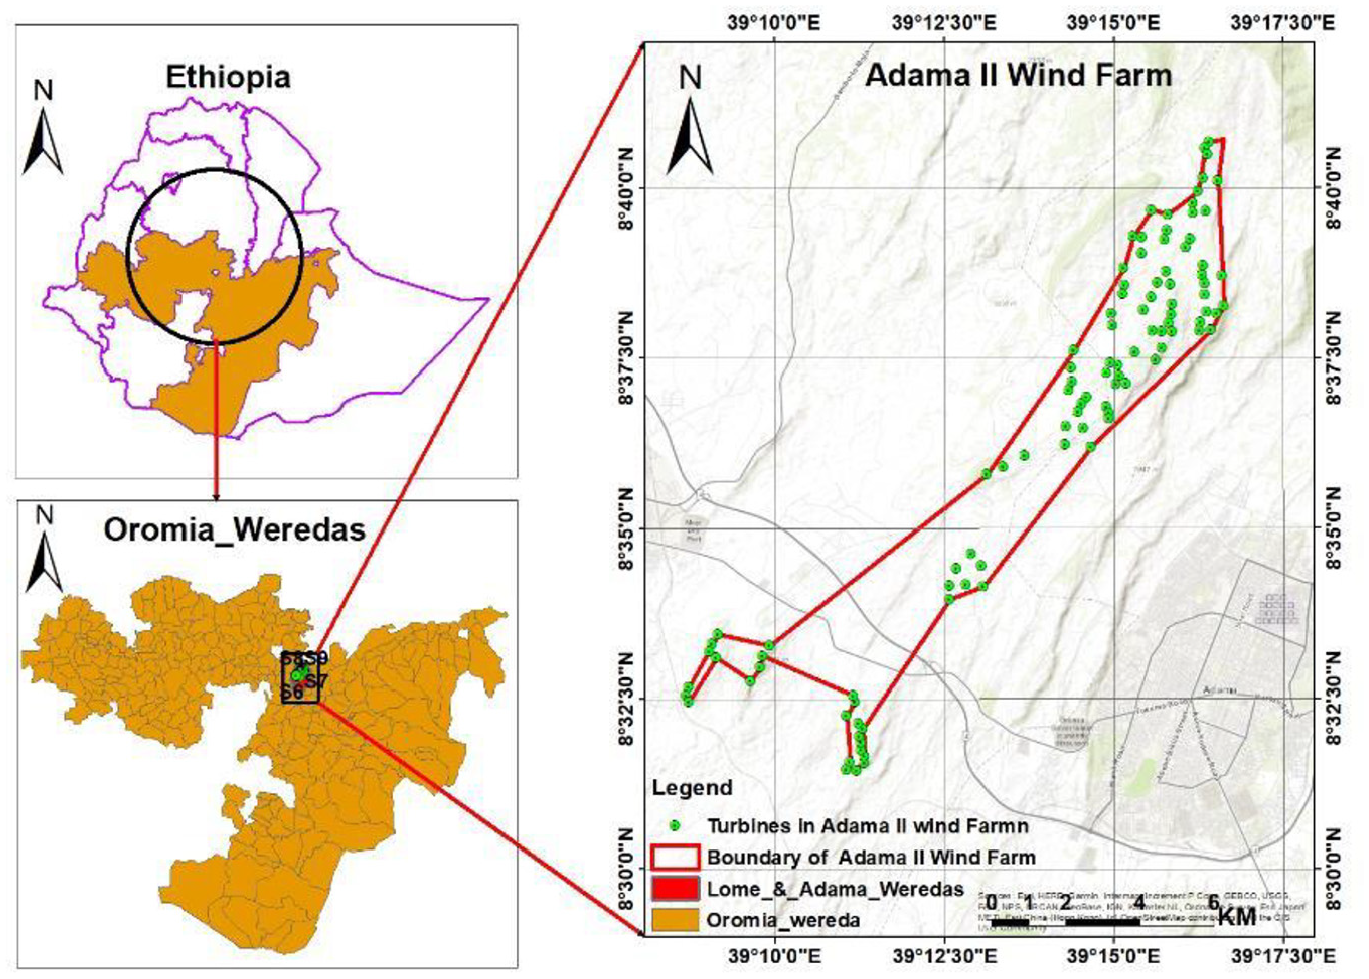
Location of Adama II wind farm (generated by Arc map 10.7, Appendix 2).
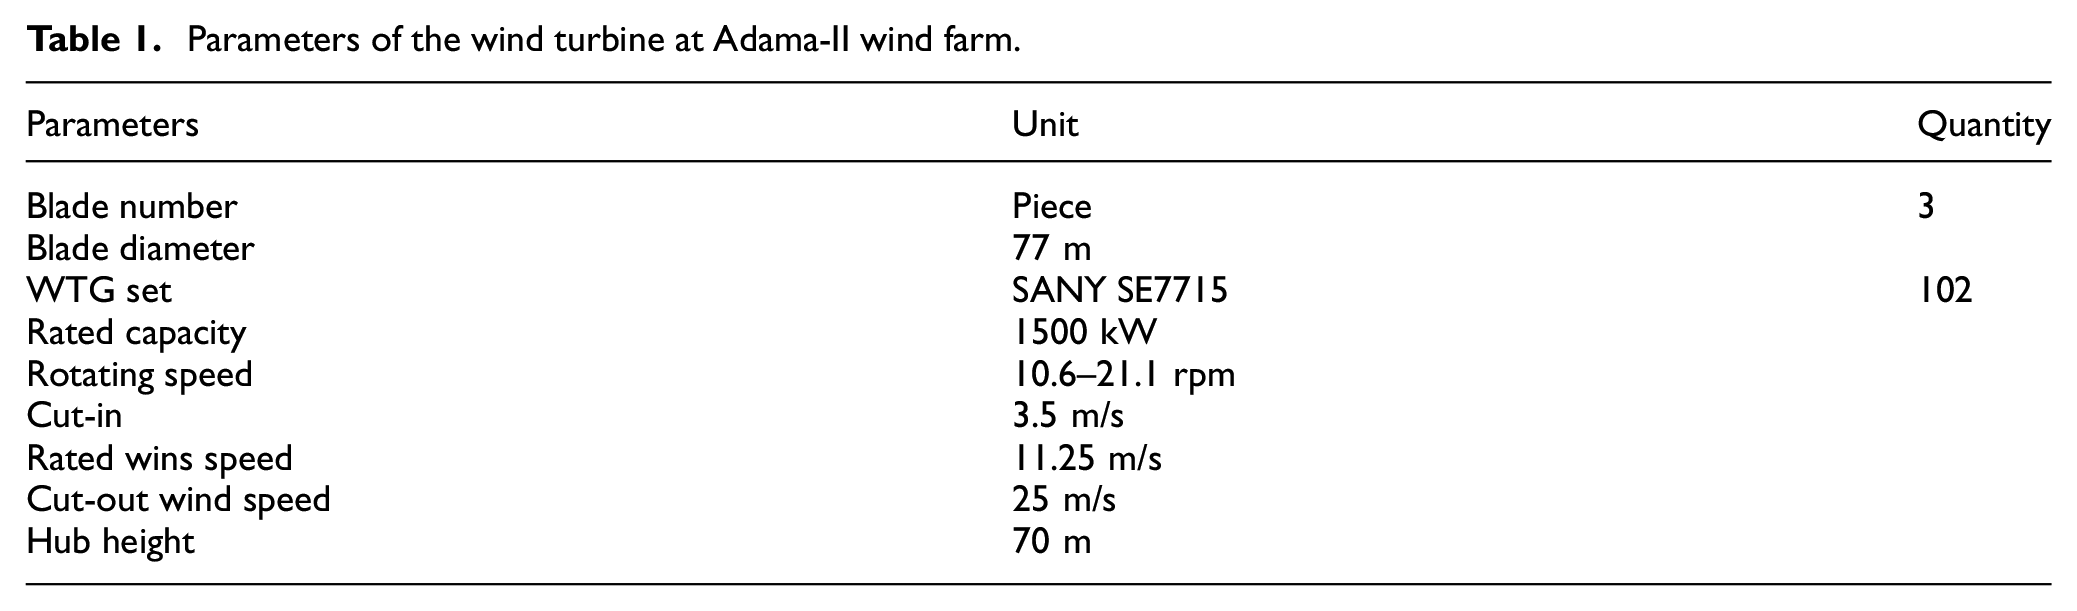
Table 1 shows the summary of wind turbine parameters in Adama-II Wind Farm. The installed power capacity of the farm is 153 MW with 102 turbines with a rated capacity of each turbine, 1.5 MW. The farm has a 230 kV step-up substation with a total capacity of 180 MVA with two transformers rated 90 MVA each and a voltage level of 230/33 kV. The 230 kV outgoing line is connected to the Koka switch through a single circuit overhead line (Hydro China Corporation, 2013).
Parameters of the wind turbine at Adama-II wind farm.
During the feasibility study, 4 years of mast data at wind speed measurement heights of 10 and 40 m, and wind direction measurement at 10 m were used. The wind data was extrapolated to the hub height of the turbines at 70 m. The wind data was corrected by 30 years of NCEP/NCAR (National Centers for Environmental Prediction/National Centers for Atmospheric Research) at the grid points of 7.5° N and 40° E which is 143 km from the central location of the wind farm. To verify these results, 9 months (in 2011) wind measurement at the hub height of 70 m was used and the wind potential of the site was estimated using these data.
Since the measurement period at the hub height was less than 1 year, there was an expectation that the results were prone to different uncertainties (Asian Development Bank, 2014). The uncertainties observed in the preconstruction period of wind resource assessment might be related to onsite measurement, long-term correction, and wind variability (Mönnich et al., 2016). So, the main aim of this research is to compare production performance with the estimated values during the feasibility study. The paper addressed the following research questions.
Is the feasibility study of the Adama-II Wind Farm comparable to the production data?
If there is a deviation from the feasibility study, what could be the main reason behind that deviation?
What should be considered to alleviate such problems?
To answer the above research questions, the site potential was reassessed using 1-year mast data by WAsP 10 and Weibull probability density functions (Weibull pdf), then the performance of wind turbine generators was assessed using 2 years of SCADA data, and KPIs were calculated and compared with the feasibility study.
Literature review
The review of the state of art in this paper has two parts. The first one is about the pre and post-construction wind resource estimation uncertainties and the second part is about the performance evaluation matrices of the operational wind farms.
Wind resource assessment before the construction of a wind farm is vulnerable to various uncertainties that include the wind variability, long-term correction, and turbine power curve. Kwon (2010) showed that wind energy uncertainties do arise from wind resources and energy production. The first one comes from the calibration problem of measuring instruments, which includes the uncertainties associated with the type of sensor, installation, calibration of sensors, location of the towers, etc. Annual energy production uncertainties related to the power curve of a wind turbine. Grünbaum (2010) stated that wind energy is so unstable and indeterminate in its very nature that energy extraction is highly reliant on the weather. This variability introduces a challenge in predicting and handling the resource. Such uncertainties will be prevalent as the penetration level is getting higher and higher. Padhee et al. (2017) stated that variations of wind power and system load have a great impact on the power system voltage profile. So, the study preferred a season-focused modeling approach from a season-independent modeling approach to effectively analyze the impacts of the variations in wind power output and system load on the voltage profiles. Wind resources at the west coast of Ireland showed substantial change at a seasonal scale (Ren et al., 2018) and the winter season was characterized by high wind speed than the rest of the three seasons. Lira et al. (2016) used probabilistic models, Monte Carlo simulation, and MCP methods to determine the uncertainties due to wind inconsistency. Therefore, these methods assessed the risk of power output deviance. Abolude and Zhou (2018) compared actual and theoretical power curves by doing an inspection of time series of wind turbine performance and energy yield under three different situations using two seasons (i.e. winter and summer). The study showed that wind direction has substantial effect on turbine power output. So, the researchers proposed performance based-power curve, Effective Power Curve, EPC) which results lower prediction error.
The second part of the literature review is about the performance metrics of wind farms. There are various performance indicators as stated by different researchers, for instance, Pfaffel et al. (2019) divided wind farm KPIs into maintenance, reliability, health, safety and the environment (HSE), and Finance KPIs. Here, the capacity factor, time-based and, production-based availabilities fell under maintenance KPIs. Pfaffel et al. (2017) also reported that Availability and capacity factors are key performance indicators of various wind farms worldwide. Conroy et al. (2011) compared time-based and energy-based wind farm availability and stated that time-based availability is the most commonly utilized by turbine manufacturers and power producers. The study also demonstrated that energy-based availability is preferable to time-based availability if the power producers have enough monitoring wind speed and SCADA data. Among the commonly used wind farm operational KPIs, capacity factor, time-based availability, energy-based availability, and wind energy index were described in Boccard (2009) and IEC TS 61400-26-1 (2011). The capacity factors cannot necessarily show the long-term wind potential of the site. They would rather indicate yearly output because they can evolve. For that reason, a low observed capacity factor might be due to low wind conditions, below their long-term potential (Rimple and Westerhellweg, 2013). There is also wind index which is considered as wind farm KPI which depends on the production of several reference wind turbines over a wide geographic area. Power system operators can identify a normal period of annual wind energy, expressed as 100%. This is also ideal in distinguishing underperforming turbines and wind strengths below expected levels. It also opens room for comparison of the production of a wind farm with the available wind resource (IEC TS 61400-26-2, 2014; Ritter et al., 2015).
Materials and methods
Available data
For post-construction assessment of the wind farm potential, a 1-year mast data was used and after preprocessing, this data was input to WAsP Climate analyst.
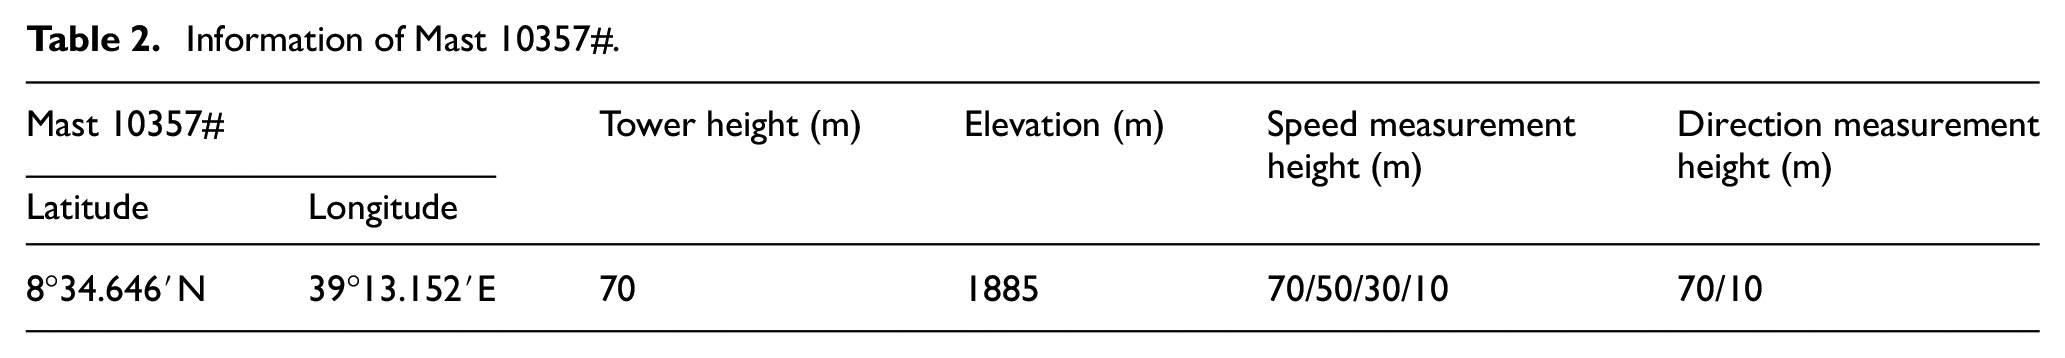
As shown in Table 2, the location of Mast 10357# is at a latitude of 8°34.646′N and a longitude of 39°13.152′E. The height of the tower is 70 m with four speed measuring heights meter, (10, 30, 50, and 70 m) and wind direction measuring heights of 10 and 70 m. The types of sensors that are used on this mast are wind vanes, anemometers, pressure sensors, temperature sensors, and humidity sensors. Table 2 shows the location of the mast with the nearest turbine sites.
Information of Mast 10357#.
As shown in Figure 2, N74 and N72 are turbines near the mast 10357#.
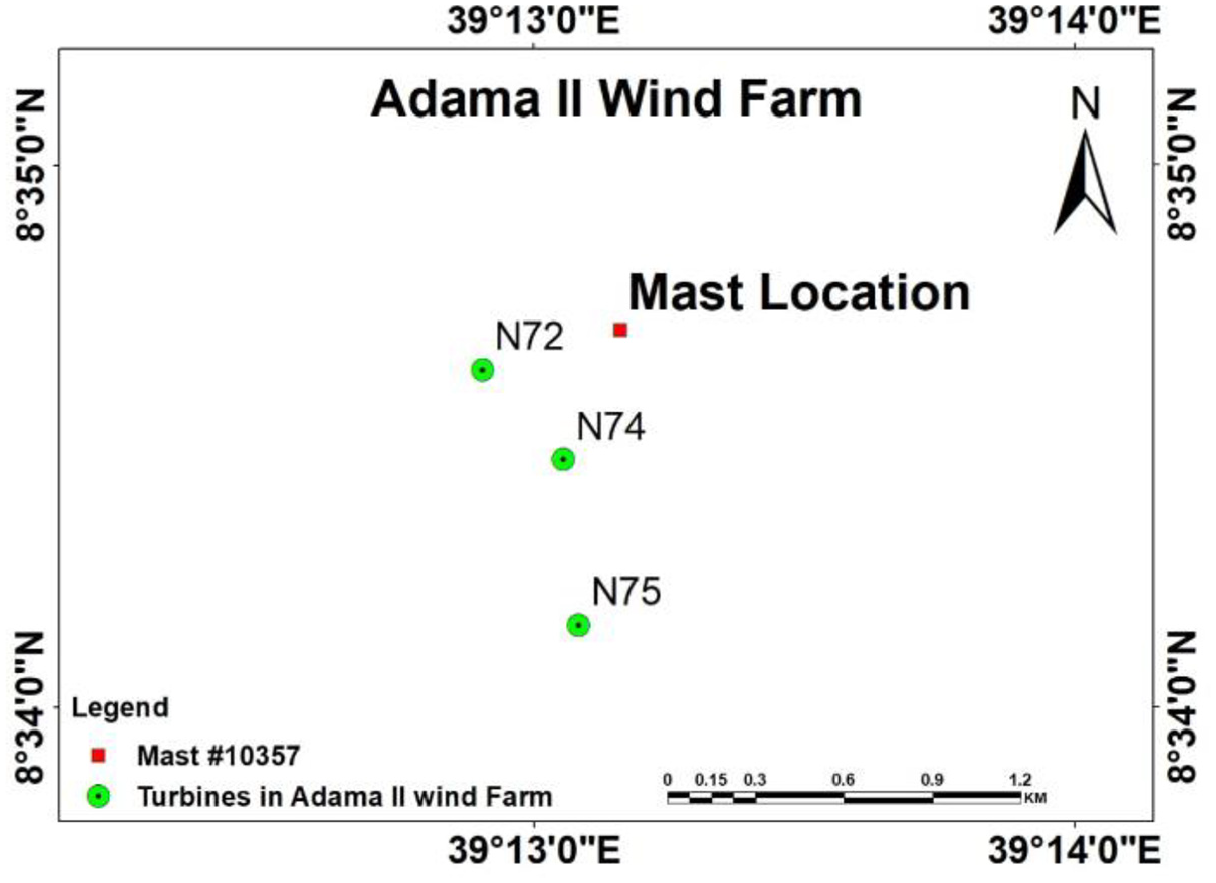
Location of Mast 10357#.
Long-term correction
There were 1164 wind speed records at 70 m which were lower than speeds at 10 m (−ve wind shear). After identifying and replacing them with the 10 m records, 30 years of MERRA-2 data was applied for long-term correction. The reason behind choosing this data is its better spatial and temporal resolution compared to NCEP/NCAR. The comparison of these two datasets are shown in Table 3.
Comparison of MERRA-2 and NCEP/NCAR Reanalysis Data.
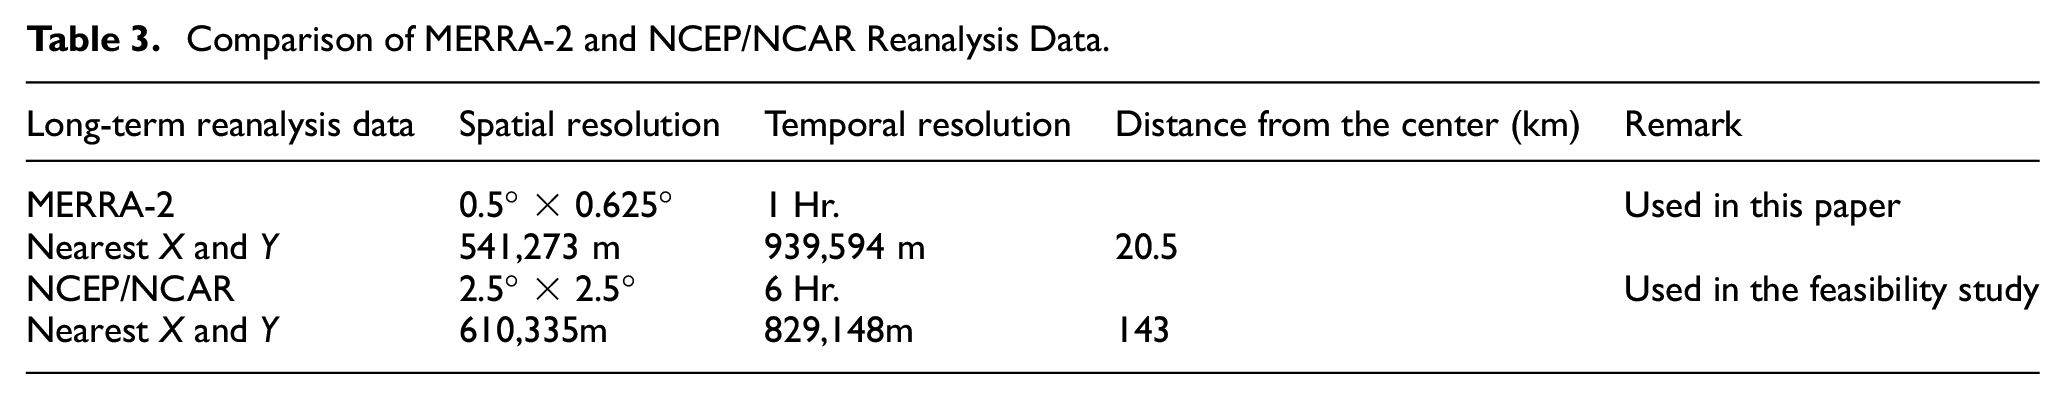
NCEP/NCAR showed a strong up-wind long-term speed trend for the period of 1980–2009 while the MERRA-2 showed a lower long-term wind speed trend (Liléo and Petrik, 2011). The report also showed a 16% improvement of MERRA-2 over NCAR/NCEP and properly representing the site-specific data. So, the hourly mean wind speed of 30 years long-term data used in this paper was 3.46 m/s.
To evaluate the performance of wind turbine generators, 2 years of 5-minute SCADA data were used. The wind index method is used for long-term correction because it is directly related to the energy production of a wind turbine (Thøgersen et al., 2007).


Where, MEP = Monthly Energy Production.
So we can get 12 estimates of AEP in a year, the average of these all will be the long-term corrected value of AEP (Lindvall et al., 2016).
Methods
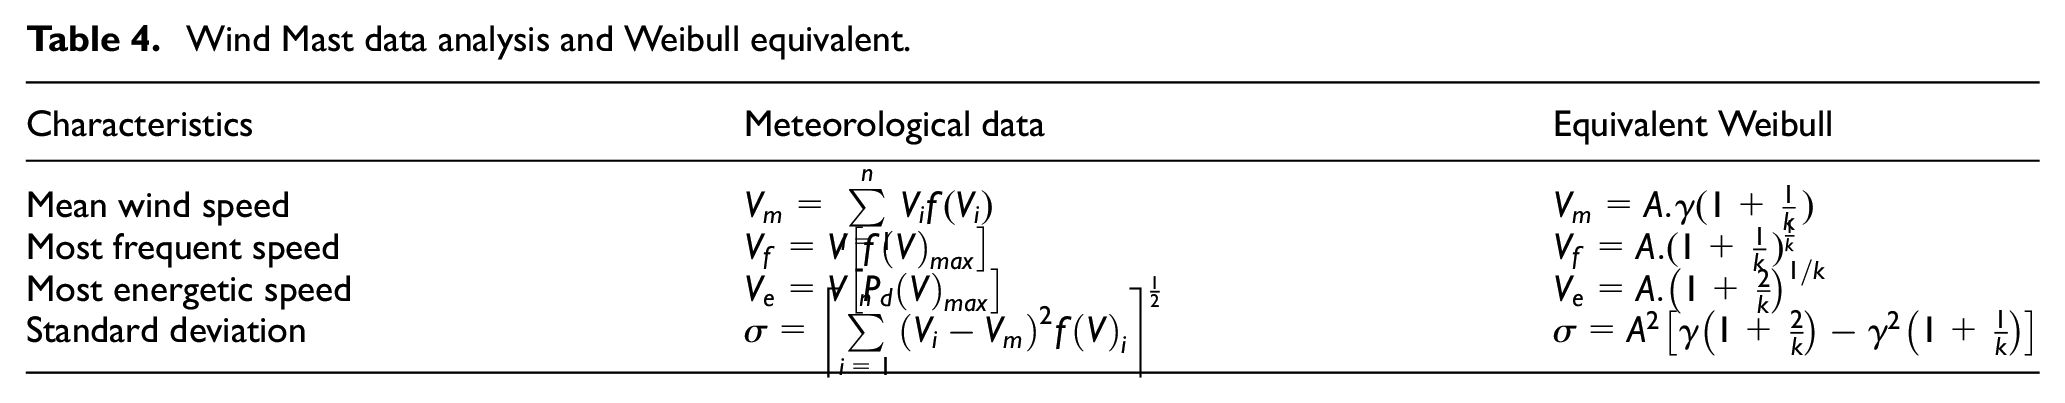
After the long-term adjustment, the mast data was input to WAsP 10 to reassess the site potential and the equations shown in Table 4 were used to obtain the characteristics of the site.
Wind Mast data analysis and Weibull equivalent.
The power production of wind turbine generators was also compared with the site predicted values in this paper and in the feasibility. To study the performance of the wind farm, the performance KPIs used here are: capacity factor, Annual Energy production, Availability, capacity factors, and they are defined by the following equations.
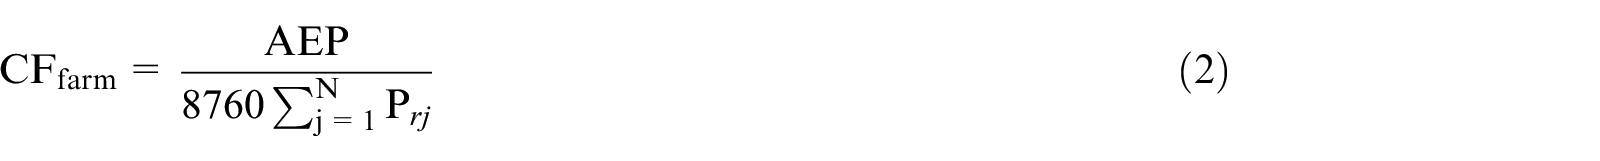
Where AEP is Annual Energy Production,
P rj, rated power of each turbine, and N is the number of turbines
The following equation shows that AEP is dependent on installed capacity (IEC TS 61400-26-2, 2014).
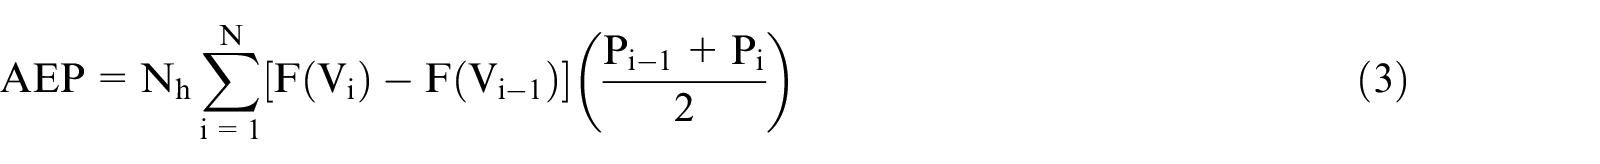
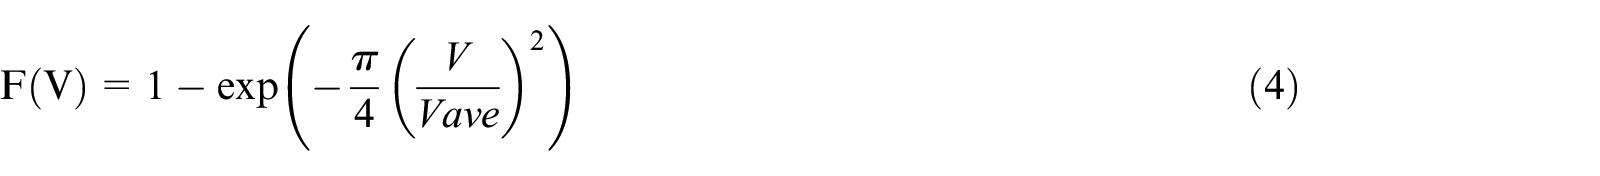
Where AEP is Annual Energy Production in MWh,
N h is the total number of hours in a year, 8760 hours,
F(v) is the Rayleigh frequency distribution function and
Pi is power reading from the power curve.
The summary of the methodology followed in this paper is shown in the Figure 3.
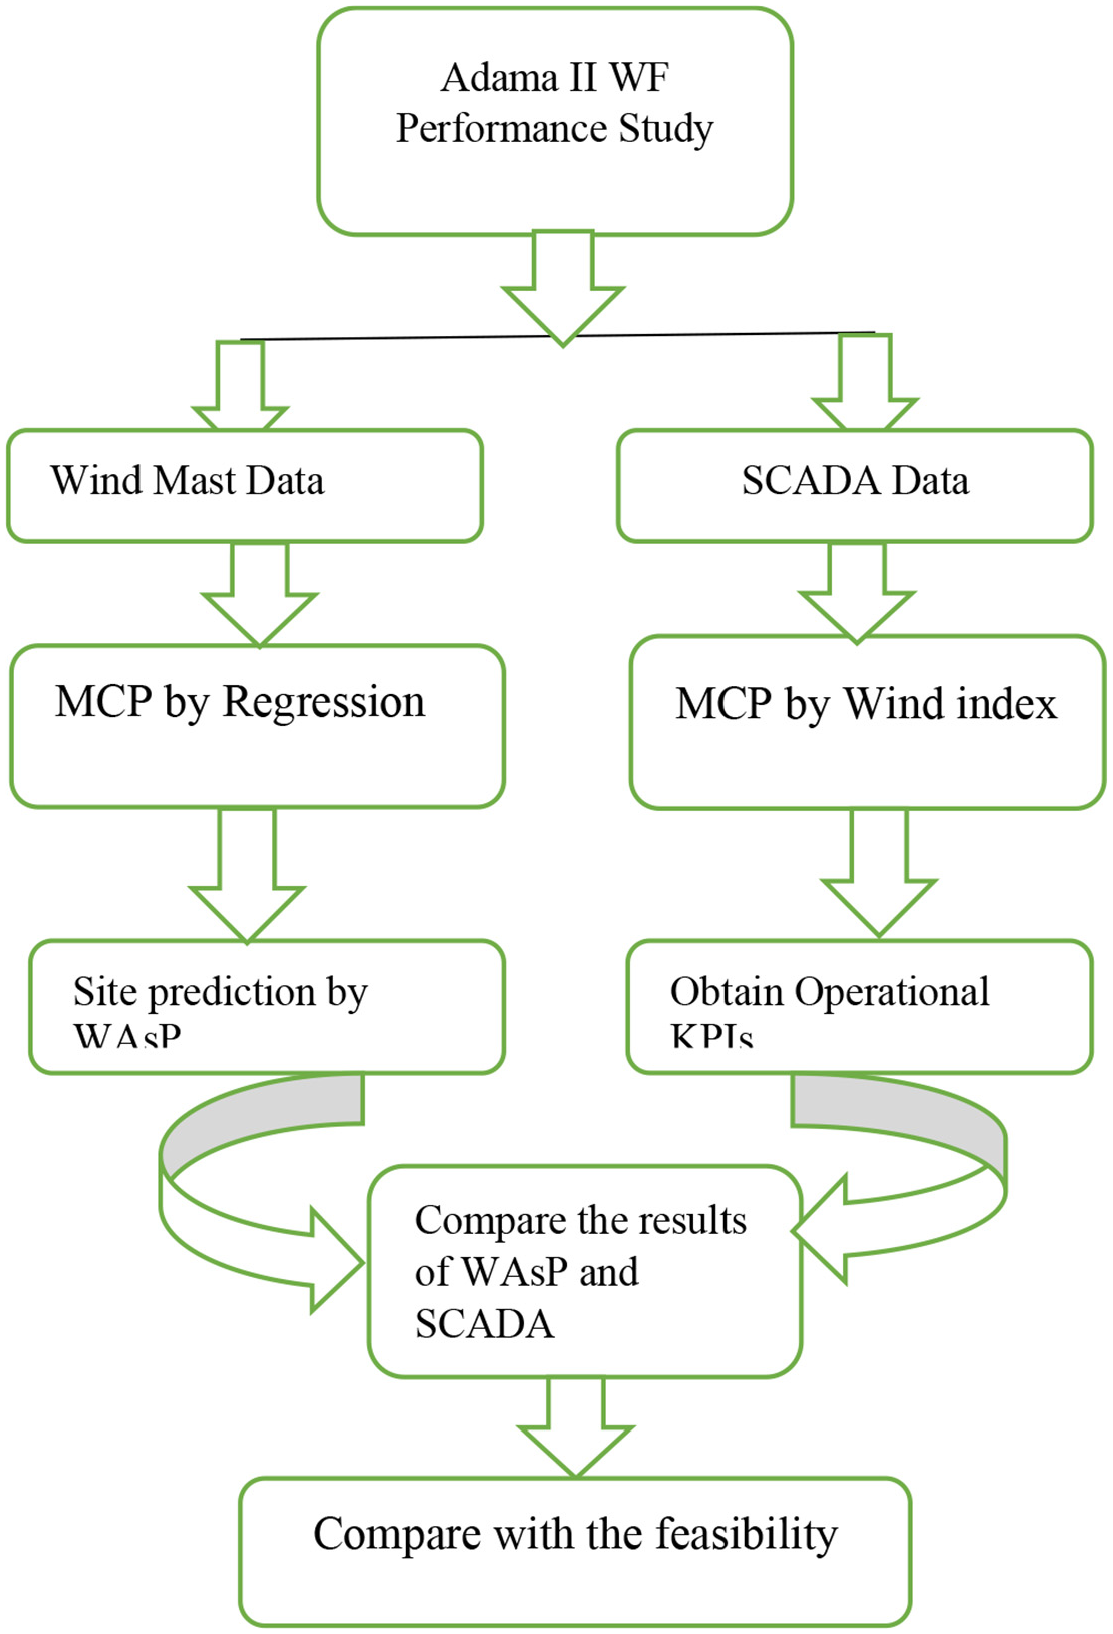
Flow diagram of the study.
Result and discussion
Long-term correction
The monthly correlation between MERRA-2 and mast 10357 at 10 m gave a correlation coefficient (R) of 0.8556, for the concurrent period of 2017. So, to correct the mast data with MERRA-2, a long-term correction coefficient is calculated and applied to each 10-minute data of the mast. The monthly correlation of wind speeds between the mast and the MERRA-2 in 2017 is given in Figure 4.
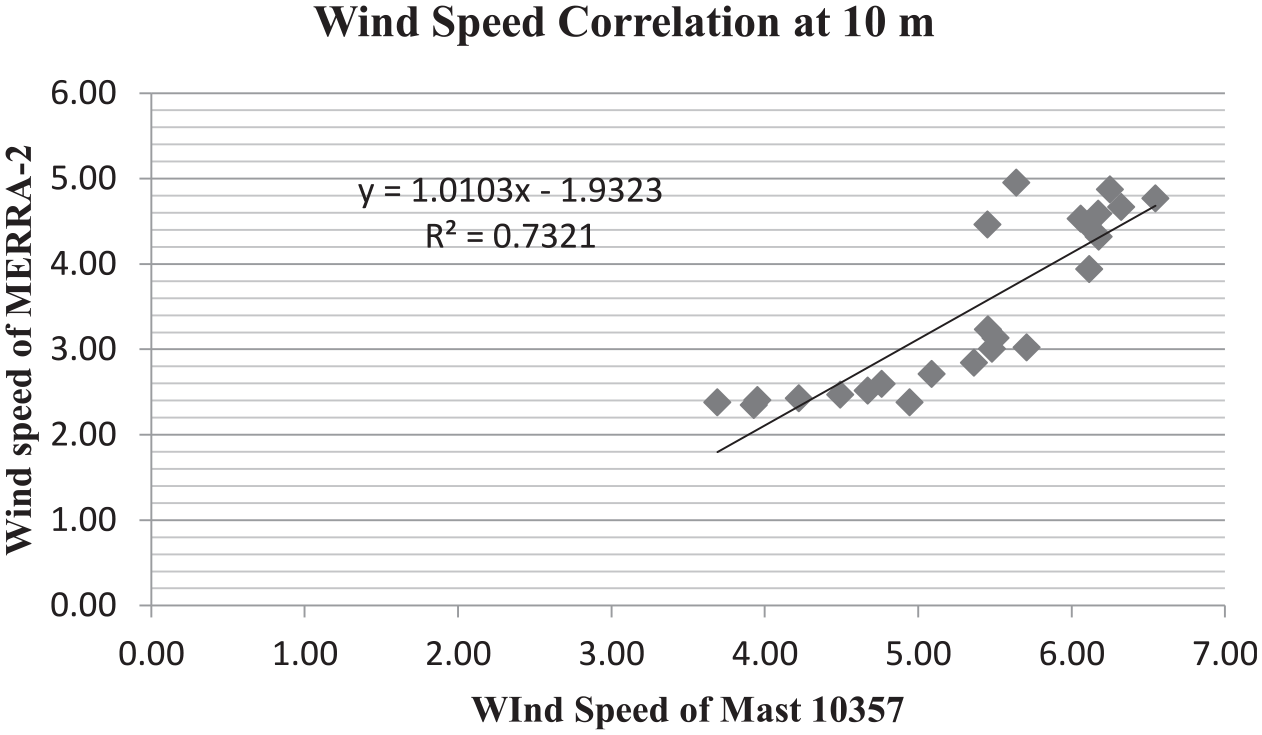
Monthly wind speed correlation at 10 m.
Clt = Mean wind speed of MERRA-2 (30 years)/Mean wind speed of MERRA-2 (in the year 2017)
Clt = 3.461/3.460 = 1.00028 which is equal to 1 so, we can use the mast data wind speed as a long-term corrected wind speed. So, the mean wind speed of the site were taken as 5.34 m/s and 7.68 m/s at 10 and 70 m respectively.
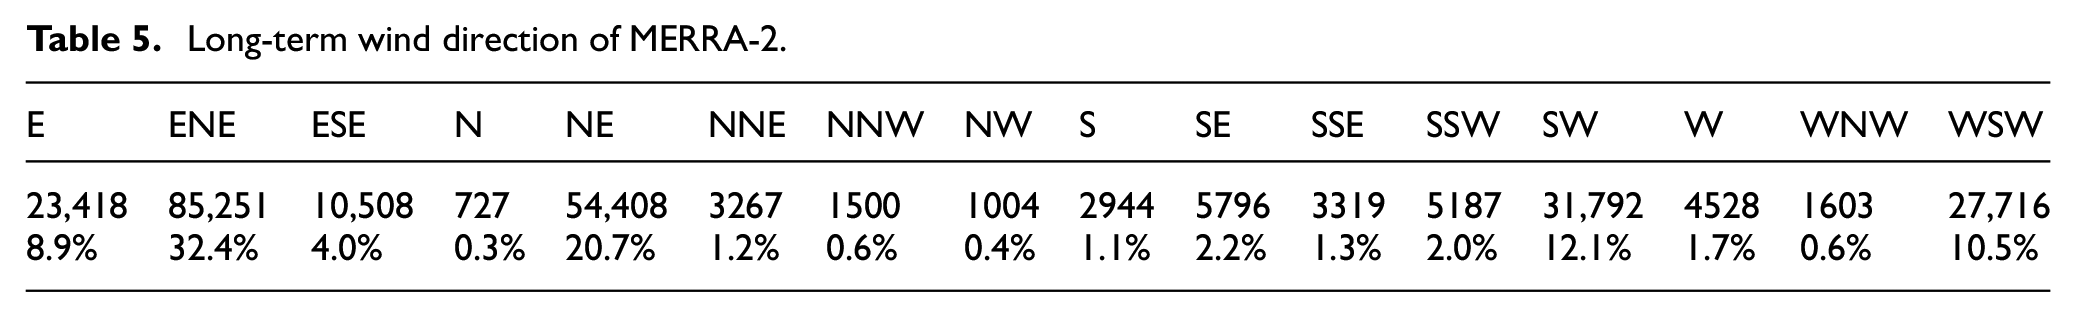
For long-term correction of wind direction at 10 m, 30 years wind direction of MERRA-2 data is obtained as shown in Table 5 with primary and secondary directions of ENE and NE (32.4% and 20.7%) respectively.
Long-term wind direction of MERRA-2.
The hourly wind rose of the MERRA-2 in 2017 is shown in Figure 5.
Rose plot of MERRA-2 at 10 m in 2017.
The wind direction of MERRA-2 shows that the prevailing and secondary wind directions are ENE and NE. The mean hourly wind direction in the 30 years was 118° and in 2017, it was 116°, so the long-term coefficient is equal to Cltd = 118/116 = 1.0172, applying this coefficient to the 10-minute direction data of Mast 10357 gives, the data shown in Table 6.
Wind direction of Mast 10357# at 10 m.

As shown in Table 6 primary and secondary wind directions are ENE and E with wind direction frequencies 40.1% and 12.1% respectively.
As there is no wind direction measurement in MERRA-2 data at 70 m, the monthly wind direction of the mast at 70 m was correlated with the long-term adjusted direction of the wind mast at 10 m. The correlation coefficient obtained is 0.9112, which shows a strong correlation. Applying MCP, the wind direction at 70 m is shown in Table 7.
Wind direction frequencies of the site at 70 m.
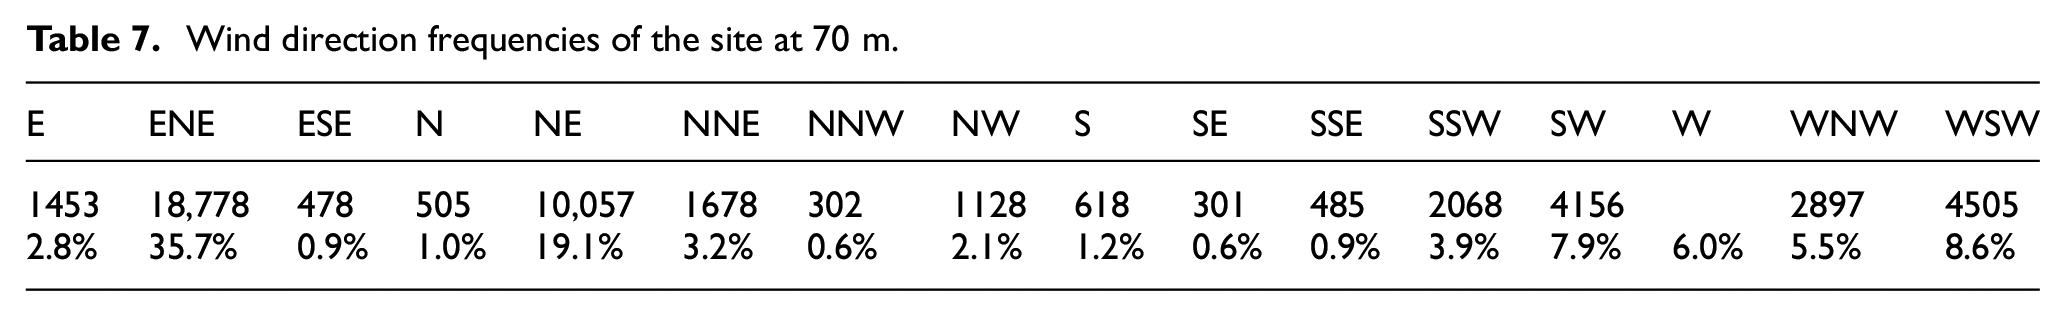
As shown in Table 7, the prevailing wind direction is found to be ENE with 35.7% and secondary wind direction is NE with 19.1% at 70 m.
Observed wind climate (OWC)
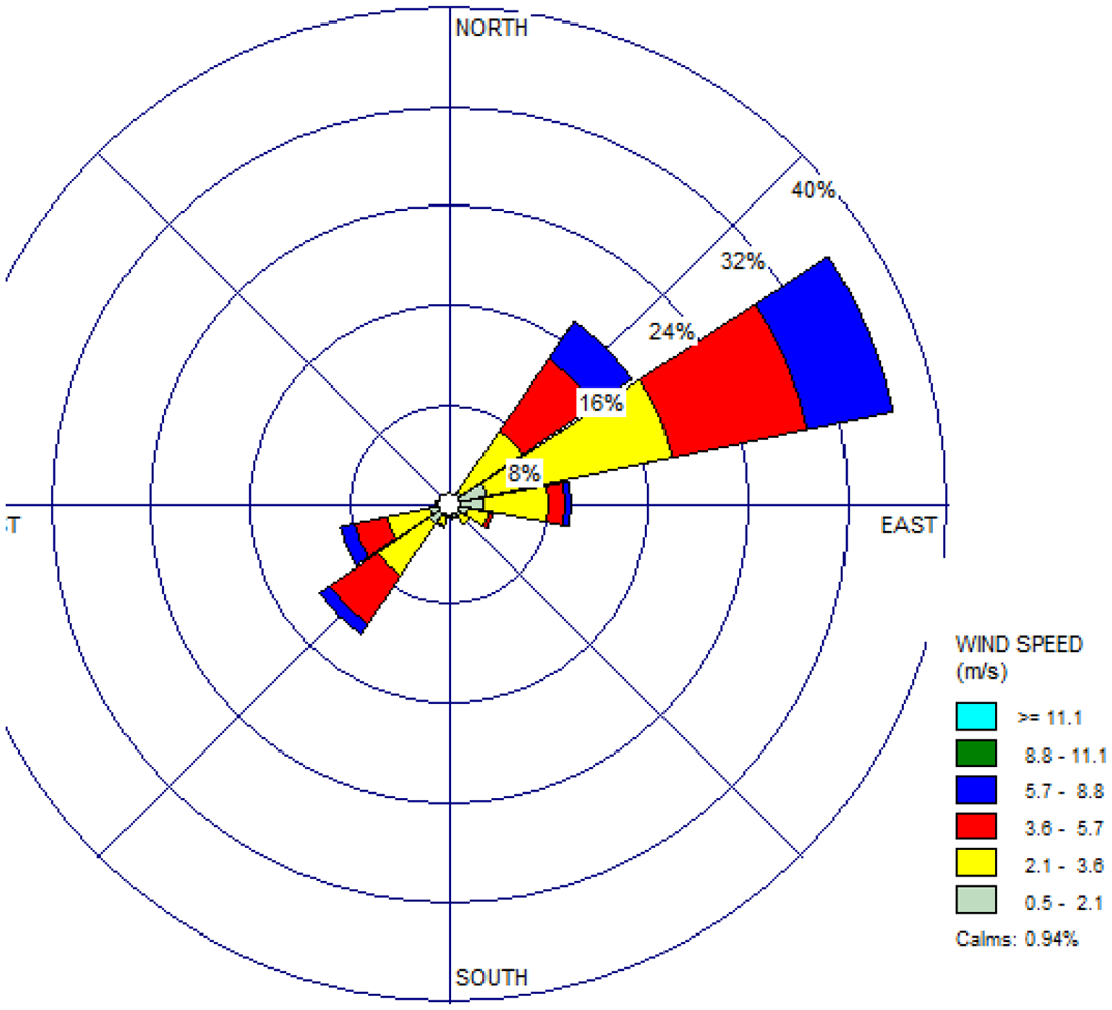
The observed wind climate of a site describes the site-specific wind climate and is the first step in wind resource assessment using WAsP. The input to this module is wind mast location and the measured wind data. Figure 6 shows the observed wind climate of the site.
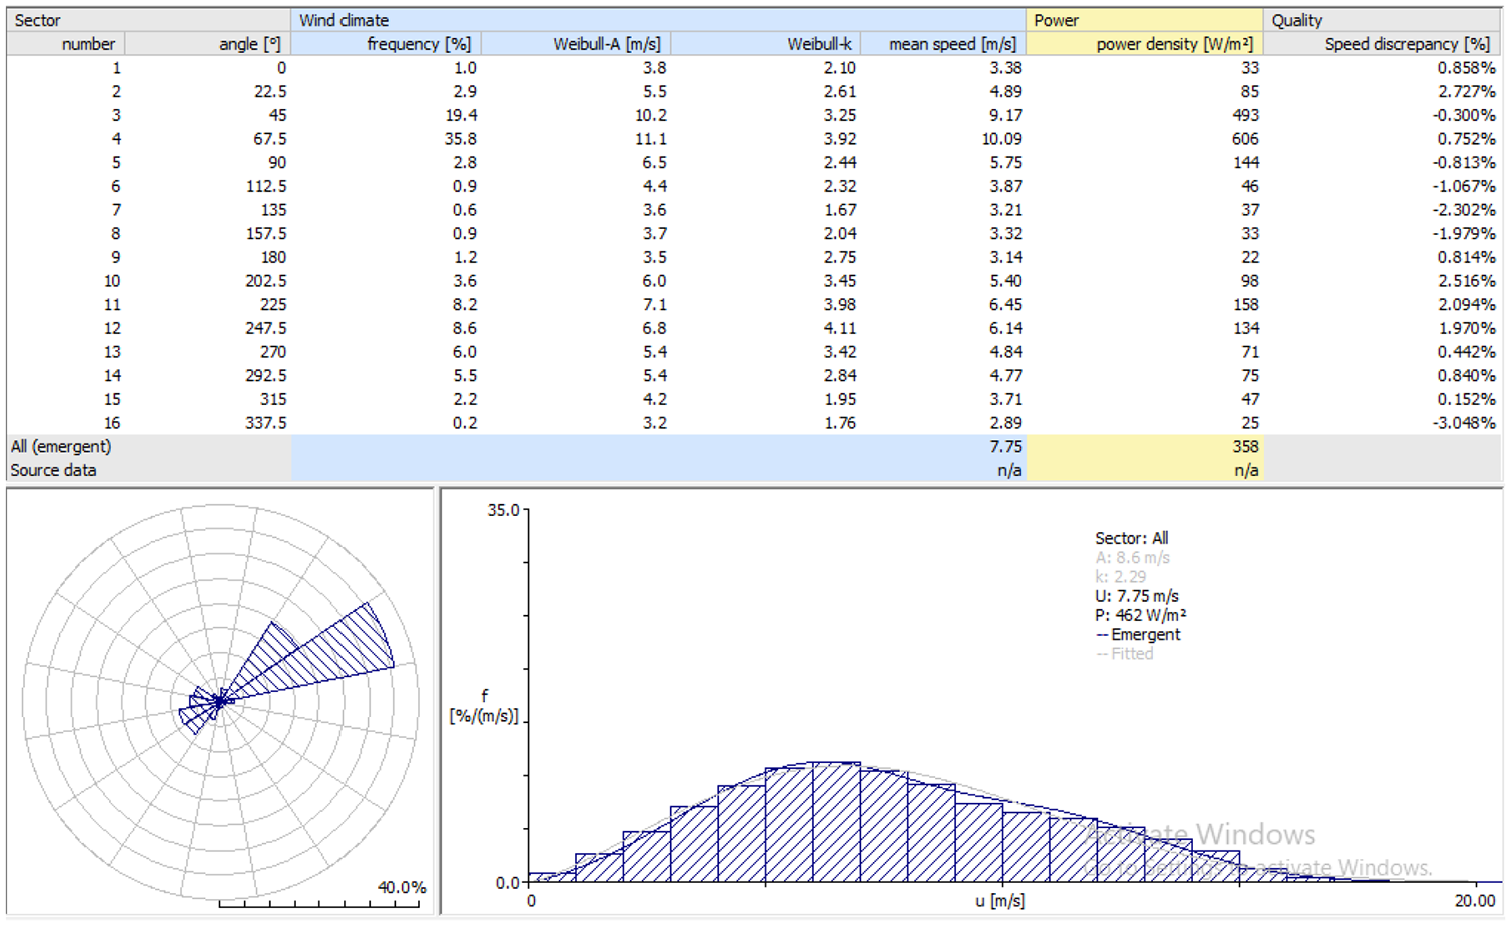
Observed wind climate of the site.
The results obtained from this analysis at a height of 70 m were mean wind speed of 7.75 m/s, and the values of shape and scale parameters of 2.29 and 8.6 m/s, respectively. The average power density was 462 W/m2. This proved that the annual wind speed and mean wind power density at 70 m from feasibility estimation were less by 18.8% and 27.1%. The primary and secondary wind directions were ENE with 35.7% and NE with 19.1% respectively.
The seasonal variation from the mast data can be seen in Table 8.
Seasonal wind resource variation at 70 m.

Table 8 shows that nighttime wind speeds were higher than daytime except in the summer. The winter season had a maximum mean speed of 10.2 m/s, and in the summer, it was 6 m/s. This means that the average value of wind speeds in winter was larger than the other three seasons. The average wind speed in autumn and spring were almost similar.
Figure 7 shows the hourly variation of mean wind speed by season. In all seasons, daytime wind speeds were lower than nighttime speeds. Winter has an ample amount of wind speed than the other seasons and it had lower wind speed during the day, reached a peak in the evening. And in the summer, low average wind speeds with no particular trend observed during hours of the day.

Seasonal wind speed variation (hourly).
Table 9 gives the wind characteristics of the Adama-II wind farm based on 2017 mast data. The bold entries here are needed to focus on site potential indicators (wind speed and wind power density) for wind class categorization.
Wind characteristics of Adama II site.

As per Table 9, the mean annual wind speed and most frequent wind speeds at the height of 70 m were 7.7 m/s and 6.6 m/s. The predicted annual average wind speed during the feasibility study was 9.55 m/s at the height of 70 m. Farm-level resource categorization depending on mean wind speed(u), most frequent speed (uf), cut-in speed(uc), rated speed(ur), and cut-out wind speed (uo) are given in Table 10.
Duration of wind speed distribution.
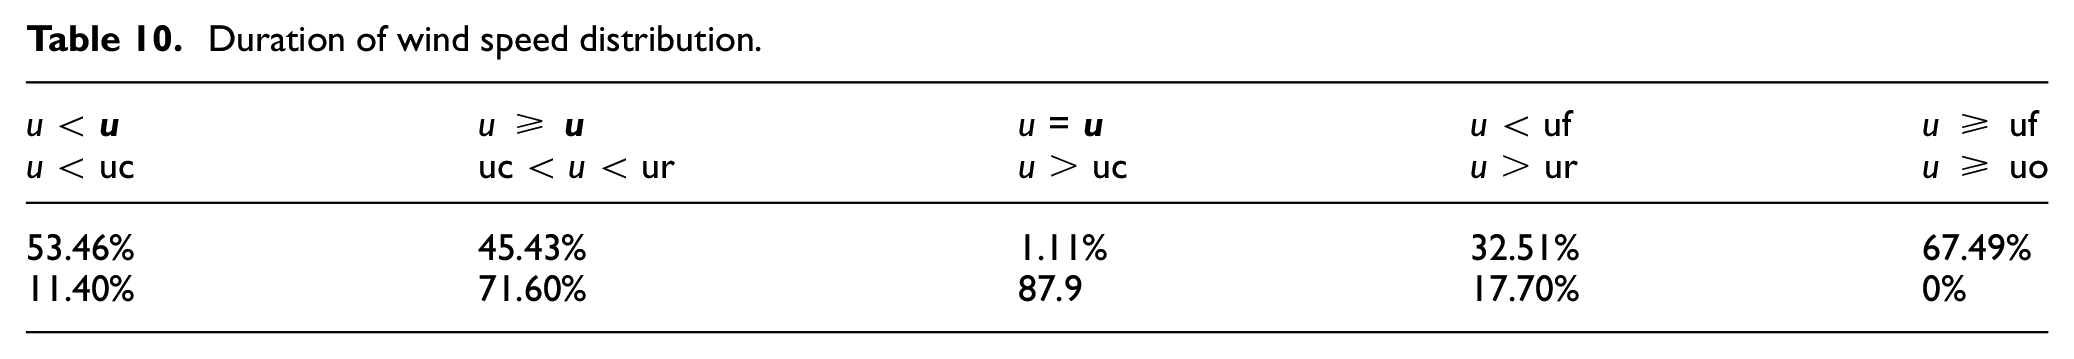
As per the table, 53.5% of the wind speeds were lower than the average value (7.7 m/s), which implies 46.5% of the wind speeds were greater than or equal to the mean value. 67.5% of the speeds are greater or equal to the most frequent wind speed which means that the resource availability in the power productive range was higher. It is also shown that 71.6% of the speeds were producing power since they were in between the cut-in and rated speed. There are also speeds beyond rated speed (17.7%). By relating the site’s wind potential with wind power classes, the wind farm falls in a wind power class of 4 because wind speed and wind power density at 50 m were 7.1 m/s, 333 W/m2, and at 30 m, 6.6 m/s, 267.6 W/m2. However, during the feasibility study, the wind farm was supposed to be of wind power class 6.
Wind atlas (generalized wind climate) of the area
Wind Atlas of the site describes the general wind climate of the area, and it is obtained by using the observed wind climate of a site and adding a roughness class. The wind farm is characterized by an open agricultural area with a roughness ranging from 0.03 to 0.04. So, five roughness classes are considered with a roughness length of (0.000, 0.033, 0.036, 0.038, 0.04) at the heights of 10, 30, 50, 70, and 100 m (Tadesse, 2014).
The general wind climate of the Adama area (GWC), Figure 8 shows that the mean wind speed at the height of 70 m is 7.3 m/s with a mean power density of 323 W/m2.
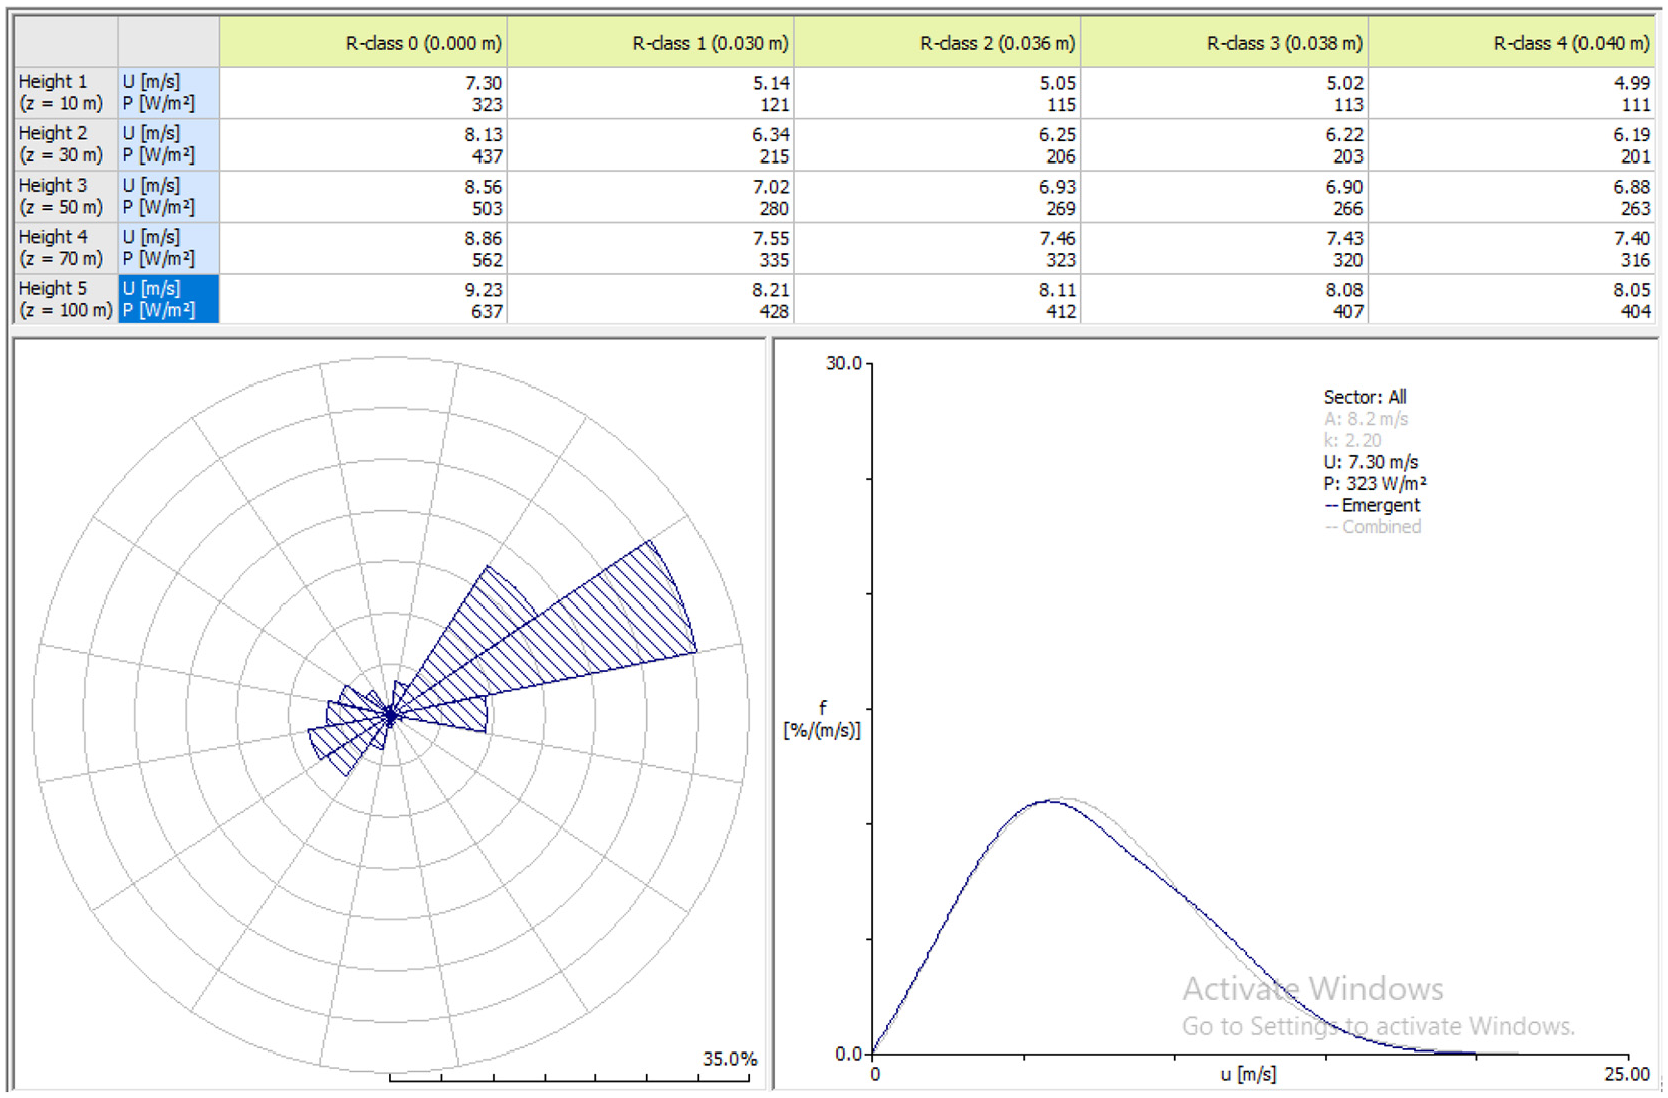
Generalized wind climate (wind atlas).
Figure 9 shows the sitting of all wind turbines in the wind farm site.
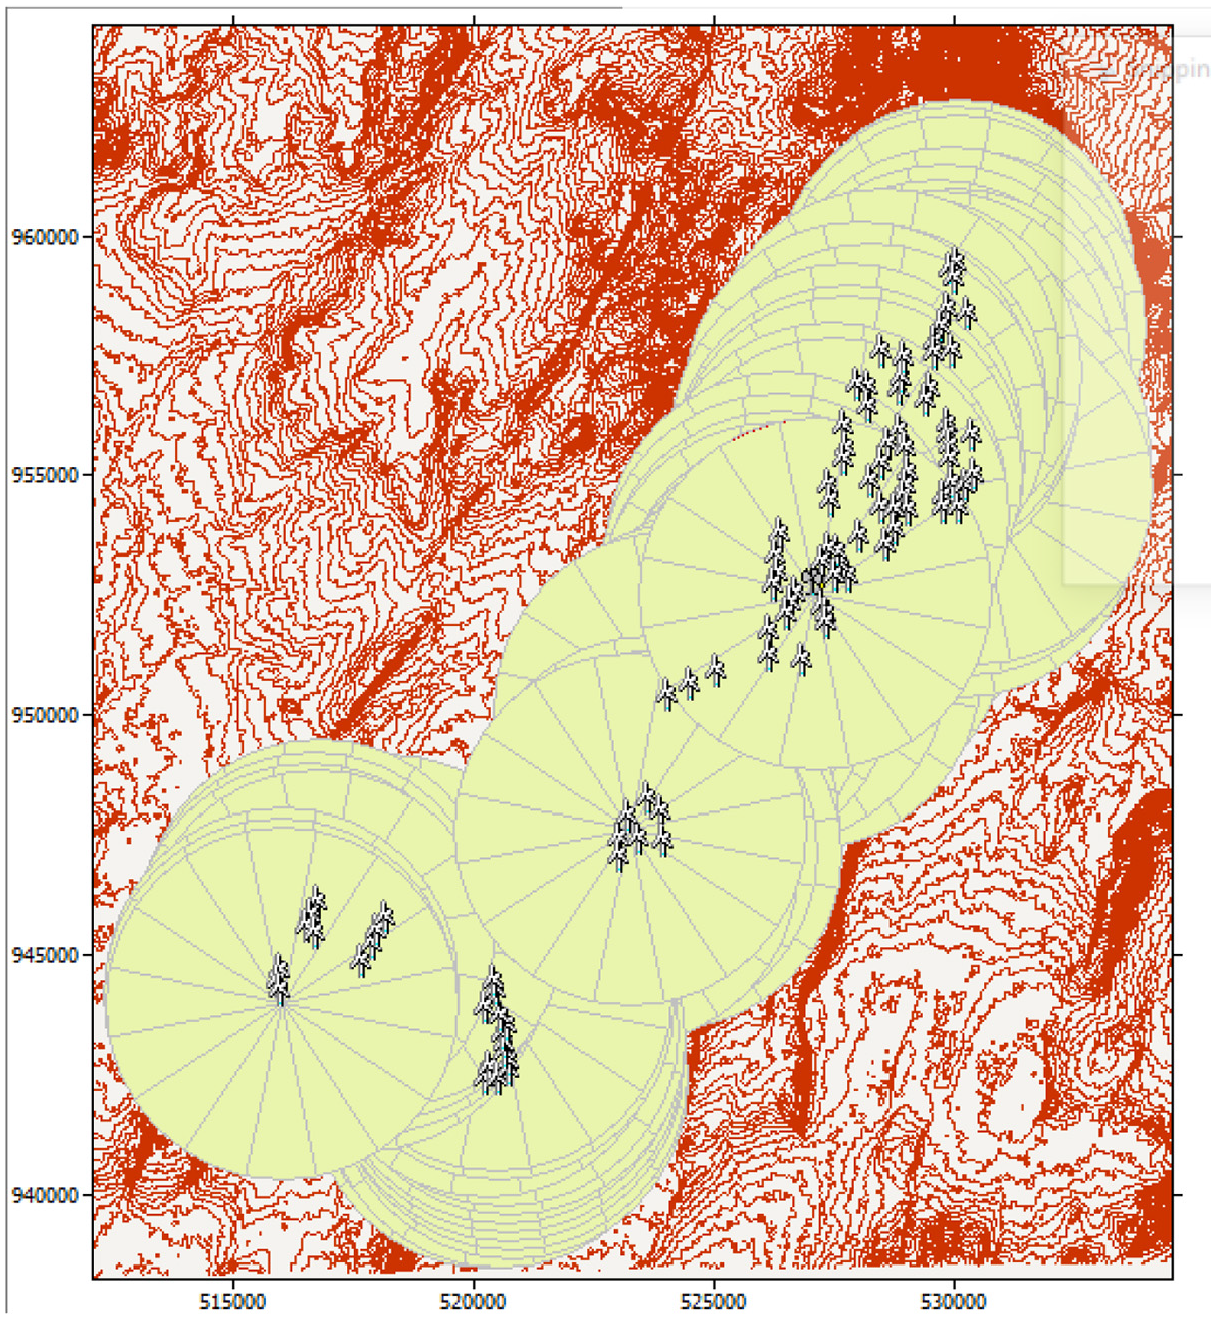
Wind turbine sites as proposed by the feasibility (Appendix 1 and 2).
As shown in Table 11, the gross annual energy production was 570 GWh with 6.21% of wake loss, with a mean speed of 8.47 m/s and the mean annual wind power density of 478 W/m2. However, the gross production obtained during the feasibility study was 730.833 (Hydro China Corporation, 2013) which results in a deviation of 22%.
Summary statistics of wind farm production estimation.

Power performance of wind turbine generators
Five-minute SCADA data of 2016 and 2017 were used for assessing the energy yield performance of each turbine. As per the determination of these parameters, the average values for wind speed varied from 6 to 8.1 m/s, and wind power from 300 to 500 kW. Moreover, the standard deviation of wind speed and power ranged from 2.8 to 3.2 m/s and 300 to 400 kW respectively. The range of the maximum wind speed and wind power is from 17 to 26.1 m/s and 1500 to 1581 kW respectively. These values are shown in the following box plots in Figures 10 and 11.
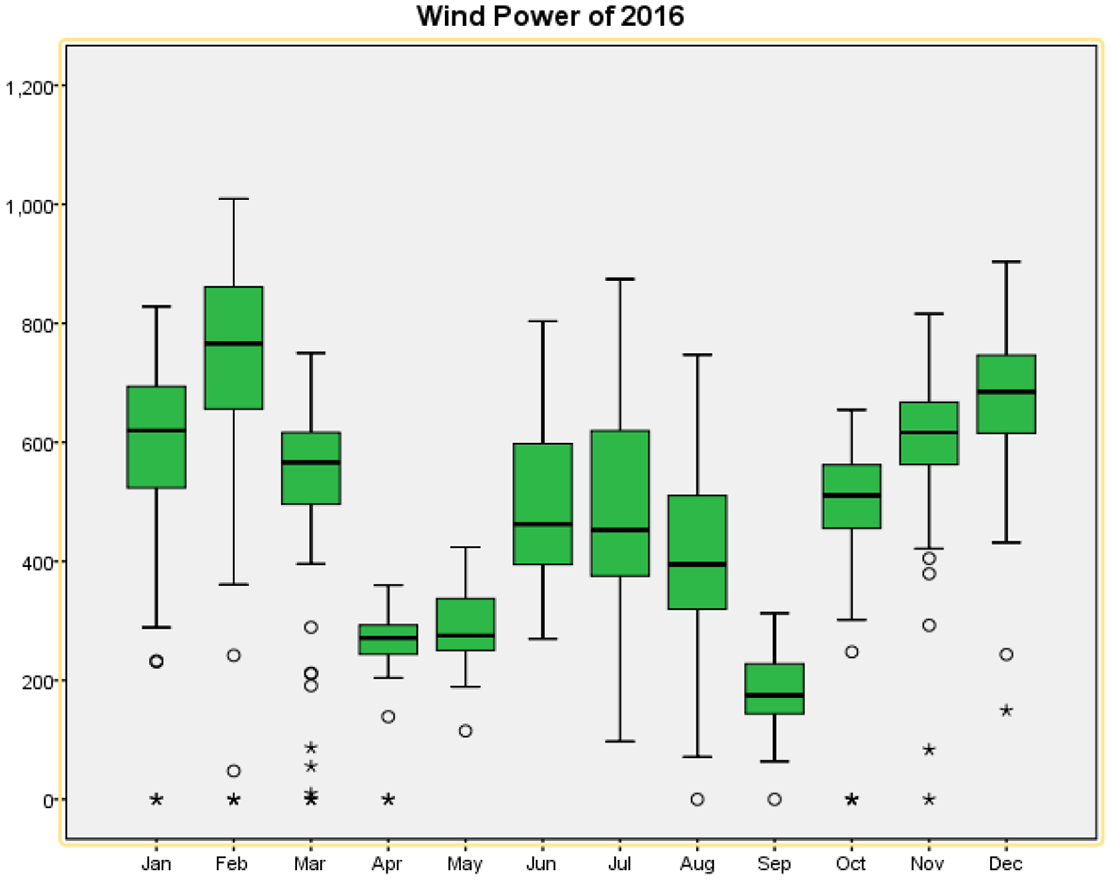
Monthly SCADA data of wind power (2016).
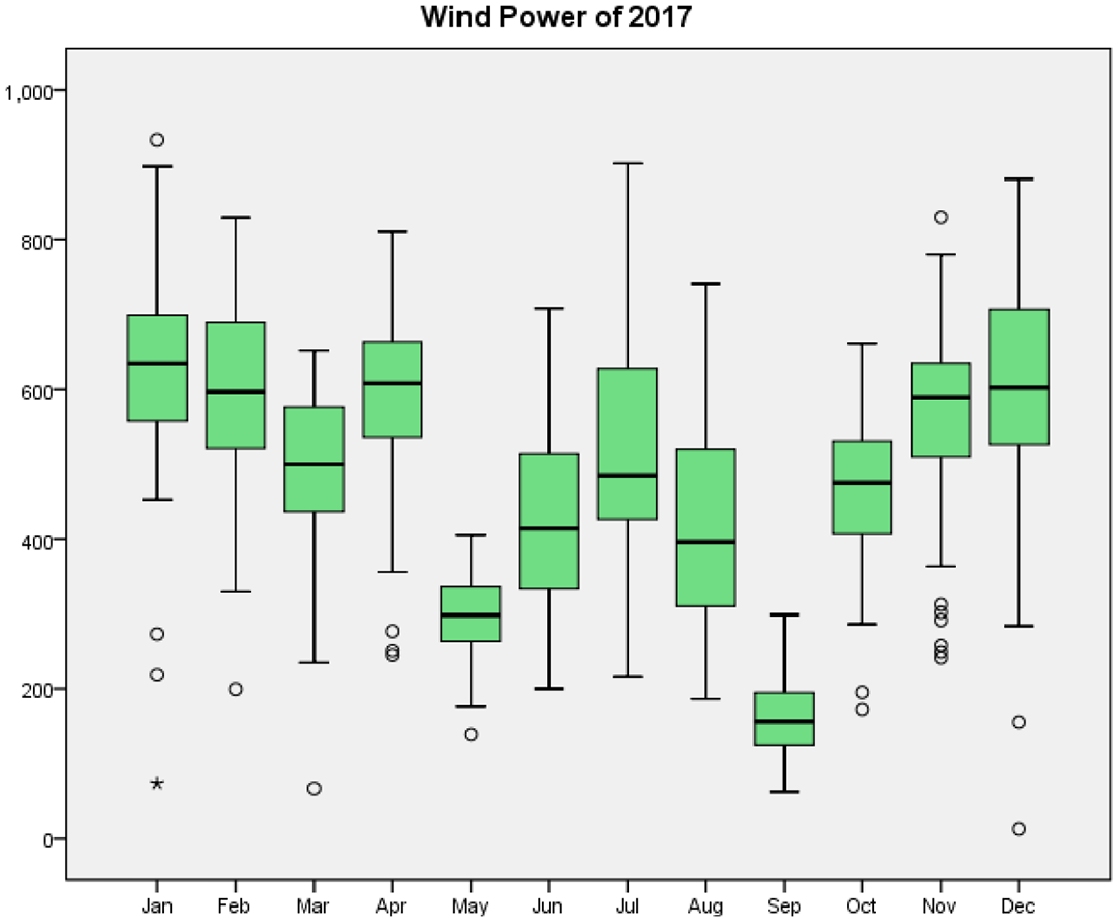
Monthly wind power production in 2017.
For evaluating the power performance of all turbines, monthly SCADA data of each turbine was considered.
As the main part of this performance study, the annual variation of performance indices for 2016 and 2017 were determined and shown in Table 12.
Annual variation of performance indices before long-term correction.
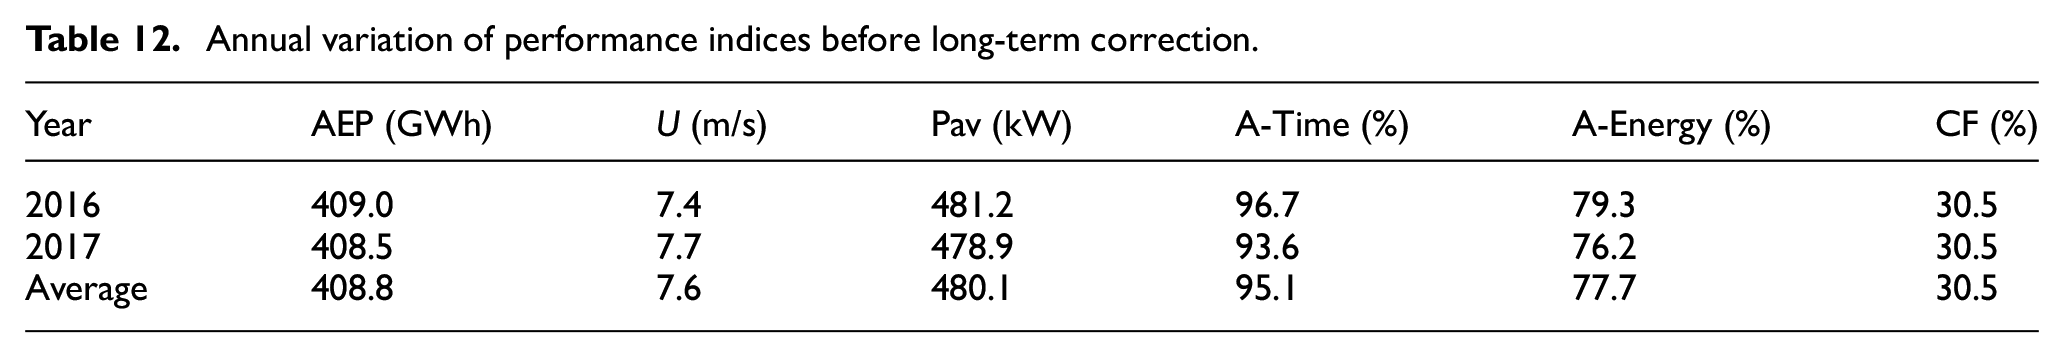
Where A-Time is Time based Availability or turbines’ availability and A-Energy, is energy-based Availability. Table 12 indicates that the time-based availability is 95.1% while energy production availability was 77.73%. This means that the turbines were available as per the warranty of the manufacturer. The average wind speed of the farm was 7.6 m/s. When this value was compared with the feasibility study’s annual wind speed (9.55 m/s), it showed a deviation of 20.4%. Annual Energy Production for the 2 years was 408.8 MWh. After applying the wind index on the monthly production, the long-term annual energy is given in the Table 13.
Long-term corrected AEP for 2016 and 2017 .
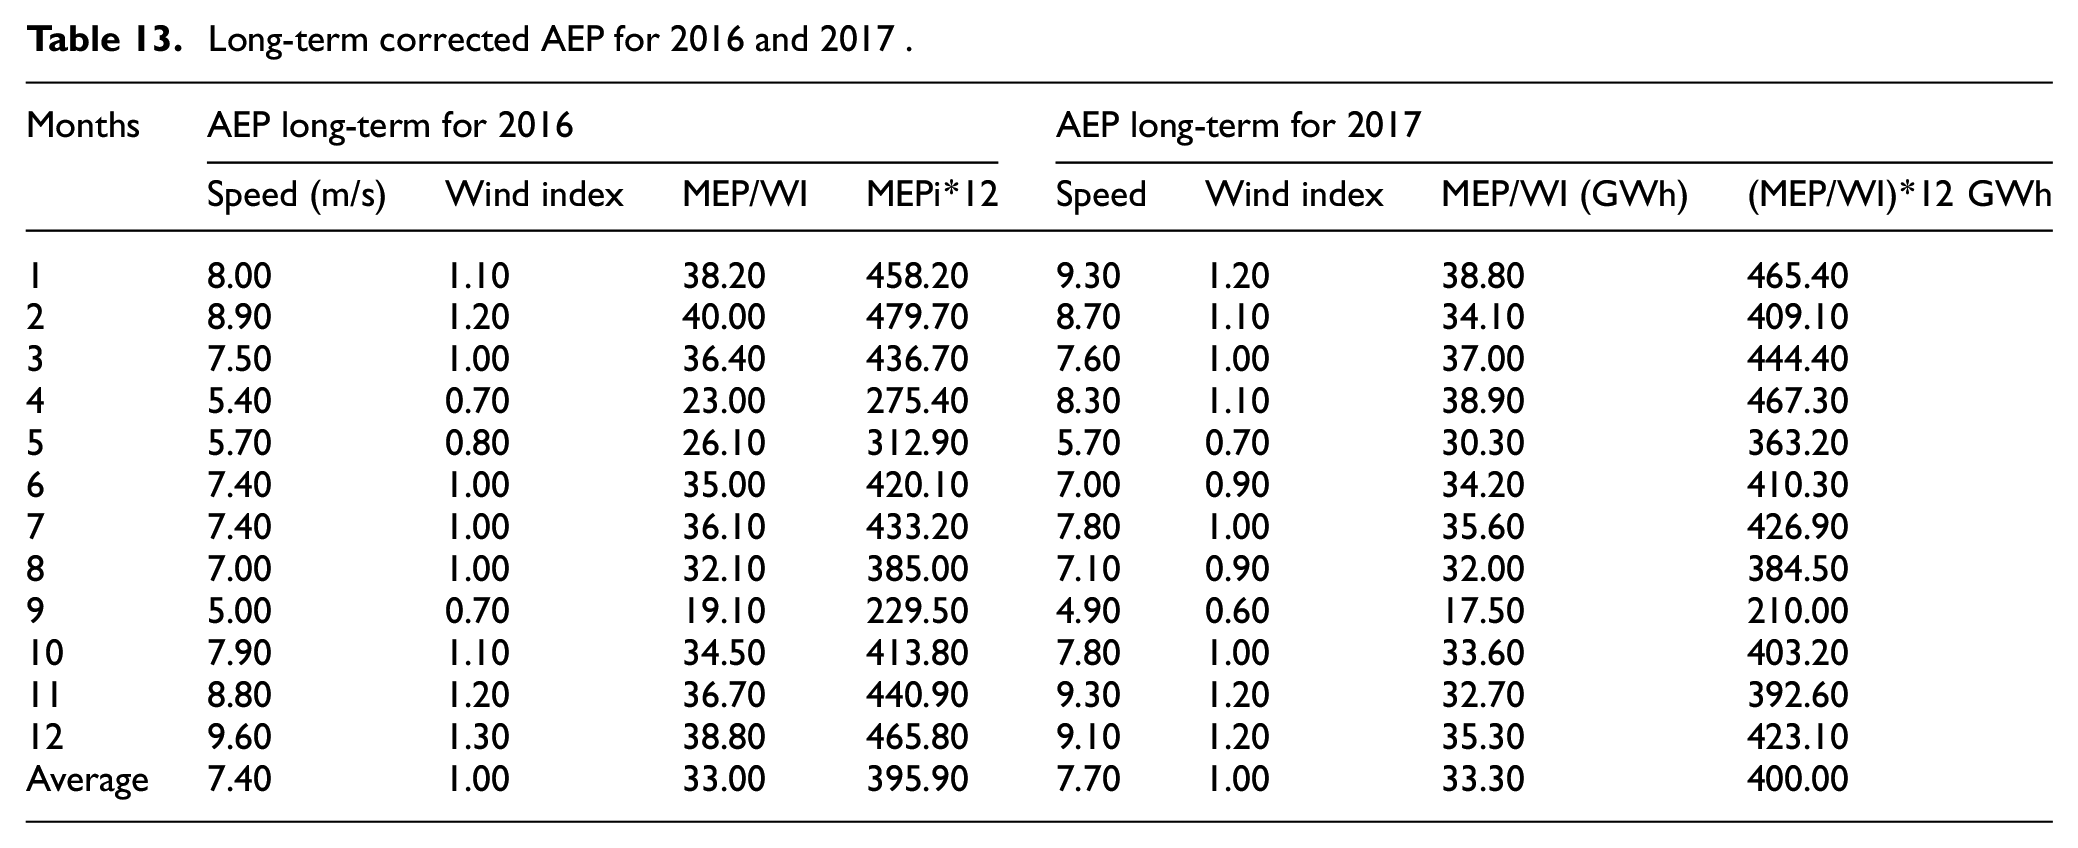
The long-term corrected AEP for 2016 and 2017 were 395.9 and 400 GWh, this gives the average of the 2 years to be 398 GWh.
Reasons of deviation from the feasibility study
The reason for the deviation in the wind resource estimation is the long-term correction data used in the feasibility study. Because the feasibility study used the NCEP/NCAR reanalysis data whose nearest point is 143 km from the center of the wind farm. However, in this paper, the long-term MERRA-2 reanalysis data used which, had better temporal and spatial resolution. The distance of the nearest grid point of this data sets from the center of the wind farm is 20.5 km. The other reason for the deviation is environmental dis en ability time, which was 971 hours in 2016 and 821 in 2017.
Conclusion
This study addressed the Adama II wind farm performance by reassessing the wind potential of the site and the energy production of wind turbine generators compared to the feasibility. Using 1-year mast data, the site’s mean annual wind speed at 70 m was found to be 7.75 m/s while, in the feasibility study, it was 9.55 m/s. The prevailing and secondary wind directions obtained were ENE by 35.7% and NE 19.1%. But in the feasibility study, these figures were ENE and E with a frequency of 35.3% and 17.3% at 70 m. From the energy performance evaluation aspect, 2 years of SCADA data were used. The gross annual energy predicted in the preconstruction of the wind farm here was 730.833 GWh but in this study, it was 570 GWh, which shows a deviation of 22%. The capacity factor determined here was 30.5%, but in the feasibility study, it was 35%. The average wind farm availability of turbines was 95.1%, and in the feasibility, it was 95%. The reason for the deviation was the long-term correction and environmental dis-en ability for the turbines to produce power. The weather influence considered in the feasibility was only 2% while in the two production years considered was , 10.2%.
Footnotes
Appendix
The software used to process the data.

| Software name | Version | Application in the process |
|---|---|---|
| ArcGIS | 10.7 | Mapping study area and contour map |
| Global Mapper | 2020 | Exporting contour into Wasp map file |
| Wasp map editor | 10 | Roughness mapping |
Declaration of conflicting interests
The author(s) declared no potential conflicts of interest with respect to the research, authorship, and/or publication of this article.
Funding
The author(s) disclosed receipt of the following financial support for the research, authorship, and/or publication of this article: The sponsor of this research was the Center of Excellence in Renewable Energy focusing on Wind and Solar Energy, (CoE in REWiSE) at EiT-M, Mekelle University funded by KfW of Germany through the Ministry of Science and Higher Education, Ethiopia.