
Abstract
Wind forecasting is a time series problem, can aide in estimating the annual energy production of potential wind farms. Seasonality and trend are the two significant components that characterize the wind time series data. Variability in trend and seasonal component affects the performance of most of the forecasting methods. Therefore, to simplify the wind forecasting technique, generally, nonlinear seasonal and trend components are eliminated from wind time series data. Accuracy depends on the application function that is applicable to eliminate the trend and seasonality. In this article, a hybrid approach for time series forecasting has been proposed. A clustering technique has been developed, which finds the clusters of time series data showing identical trend components. After finding the proper clusters of similar trend components, statistical methods, namely, autoregressive integrated moving average and generalized autoregressive score techniques, are applied to the individual cluster. In the end, resulting components are aggregated. The experiment shows that the cluster-based forecasting technique gives better performance as compared with existing statistical models.
Keywords
Introduction
Wind energy plays a significant role in the process of dealing global energy crisis. To make it a reliable source of energy, an accurate model for estimating power produced by wind power plants is required. The research reported in Thapar et al. (2011), Morshedizadeh et al. (2017), Wadhvani and Shukla (2018), and Dongre and Pateriya (2019) have concluded that there is a strong relationship between power generated by wind plant and wind speed of that site. An accurate model of wind speed prediction can improve the accuracy of power estimation. Prediction of wind speed at a particular site can be achieved through time series forecasting techniques. In these techniques, the existing time series data values are used to predict future values by extracting the hidden pattern of the given time series data. Various statistical models were introduced for wind speed forecasting like autoregressive moving average (ARMA) (Yang et al., 2015), autoregressive integrated moving average (ARIMA) (Torres et al., 2005), and generalized autoregressive score (GAS) (Creal et al., 2013). Usually, the time series data include the seasonal and trend components that may be homogeneous and heterogeneous in nature. In case, when the trend and seasonality components are homogeneous, the existing classical models (Kavasseri and Seetharaman, 2009; Lydia et al., 2015; Maatallah et al., 2015) are enough to model them, whereas in the presence of the heterogeneous trend and seasonality components, first these are eliminated by applying appropriated algorithms and then modeled. Here, elimination of the trend and seasonal components from the time series data may cause loss of some informative pattern present into the data. In order to make a reliable forecasting model, a method is required, which can model the time series data without eliminating the trend and seasonal component of data.
Statistical techniques are frequently used in practice as it produces forecasting results in lesser time. One of the limitations of these techniques is that they are not capable enough to handle heterogeneous time series data. In recent years, several hybrid methods are introduced to model the heterogeneous time series data accurately. Kushwah and Wadhvani (2019) have proposed the GAS and neural network–based hybrid modeling techniques for wind speed forecasting. The inclusion of a neural network in the existing GAS model had performed well with favorable levels of prediction errors. Inniss (2006) suggested that each time series data may have a nonlinear trend and seasonality pattern, which can be used to divide a heterogeneous wind speed data into homogeneous one. A trend component of wind time series shows the common tendency of the wind speed data to increase or decrease for the duration of a long period. In contrast, seasonality is the presence of periodic fluctuations in the time series data. Statistical methods are used to transform non-stationary time series into stationary, which convert nonlinear trend and seasonal component into linear ones. Kuznetsov and Mohri (2020) and Vilar et al. (2018) have proposed the methods in which heterogeneous wind speed data are divided into the homogeneous sample by the use of the clustering technique.
Clustering is an unsupervised learning method that divides the data points into the number of groups. In a literature, number of clustering methods are available that can be applied on non-sequential as well as sequential data points. Due to the difference in characteristics of non-sequential and sequential data, techniques applied to non-sequential data are not able to produce good results on time series data. Clustering techniques applied on non-sequential data produce a minimal number of cluster based on the distance metric for data values, for example, K-mean clustering algorithm is one of the methods which is used for determining the optimal number of clusters (Zhu et al., 2019). However, time series data have the characteristic of serial correlation between subsequent observations. The distance metric is not capable of merging similar data into groups without disturbing the serial correlation. Lim et al. (2018) have suggested that as time series data may have trend over time and exhibit seasonality, these characteristics can be used for identifying the similar structured of data values for generating the clusters.
This article begins by introducing the proposed clustering approaches for identifying the segments of time series data having identical trend shapes. Once the clusters of similar trends have been created, then statistical methods for time series forecasting, namely, ARIMA and GAS, have been used to model the time series data of each cluster. This is the hybrid approach of forecasting in which the final forecasted values are obtained by aggregating the results obtained by models developed on each cluster. Finally, the performance of statistical models, that is, ARIMA and GAS, and proposed hybrid models, that is, C-ARIMA and C-GAS, is measured using the criteria mean absolute error (MAE) and root mean square error (RMSE).
Time series data clustering
In general, the wind speed time series data have trend and seasonal components. A trend and seasonal analysis of wind time series data are used to extract the statistical characteristic over the period (Johnpaul et al., 2020). This work is focused on grouping out the segments of time series based on similar trend behavior. Statistic data values of any time series may show three types of trend characteristics, that is, increasing, decreasing, or equaling patterns. An individual segment of the series may have one or more than one different patterns. Based on the sequence of these patterns in the segments, clusters can be constructed (Wang et al., 2006).
Figure 1 shows a detailed description of the clustering approach, which is based on identifying similar trend components. The trend shows the general tendency of data values that may be increasing, decreasing, and equaling direction. Increasing, decreasing, and equaling sets are denoted by I, D, and E, respectively, and the segment is indicated by S. Suppose
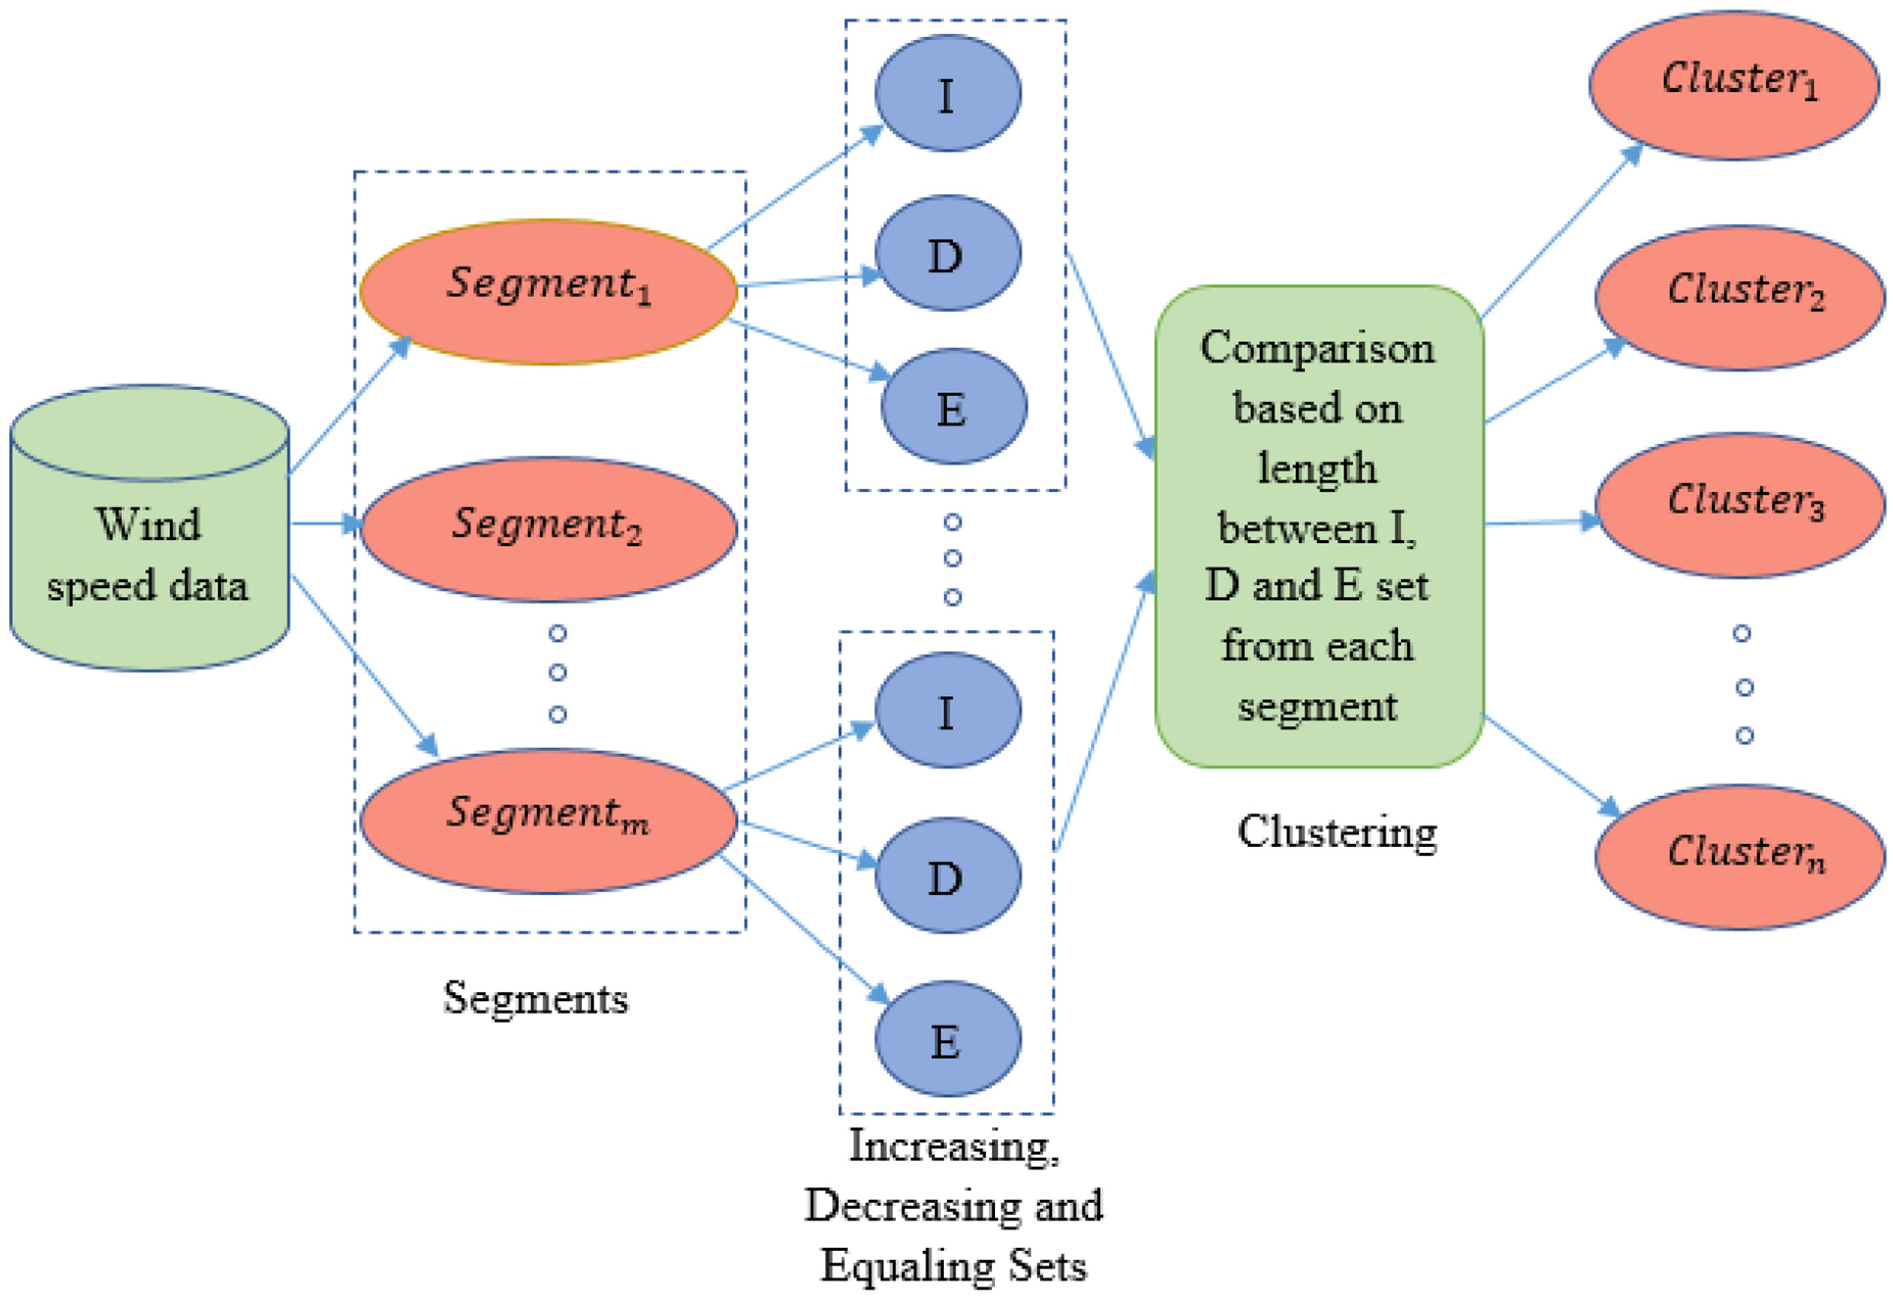
Clustering approach based on trend components.
Statistical models for wind speed forecasting
The time series data can be forecasted using the statistical models in terms of data, horizon, and accuracy. The forecasting of wind time series data is done using the wind direction, wind speed, air density, temperature, and so on. The forecasted wind time series data mainly include the estimated values of wind speed. The forecast horizon is defined as the time period for which the parameter is to be expected in the future, which usually ranges from short-term (day-ahead) to long-term (multiple day-ahead) forecast horizons. The forecasting accuracy is the efficiency measurement of the modeling technique, which can be evaluated using sufficient performance metrics. The forecasted accuracy is evaluated using the following statistical models: ARIMA and GAS.
ARIMA model
Ait Maatallah et al. (2015) have proposed the ARIMA model, which is used for time series forecasting. ARIMA model is a generalized form of ARMA model, which is used on time series data to predict the future values from past values in time series. ARIMA model can also be applied when the given time series is non-stationary. In this case, the differencing method can be used one or more times for removing the non-stationarity present into time series data. AR, MA, and I denoted the evolving variables which are used to regress on its own lagged, regression error term, and differencing (integrated) between current values and previous values, respectively. The mathematical form of the ARIMA (p, d, q) model can be represented as

where
GAS model
GAS model is a score driven model used for nonlinear time series data using the score function. GAS is an observation driven model due to which it is applied to asymmetric data, more complex dynamics data, and long-term data without future complexity (Creal et al., 2013; Harvey, 2013). The GAS model is used for wind time series that is capable of handling the varying density present into time series data. This model can be represented by conditional observation density

where
Proposed hybrid methodology
The dataset used in experiments has been taken from the NREL site (National Renewable Energy Laboratory (NREL), 2007). The resource file includes a number of parameters, that is, wind speed, wind power, air temperature, air density, and so on. This work is focused on univariate time series forecasting, that’s why only wind speed data have been considered for modeling. Figure 2 illustrates a detailed overview of the proposed model.
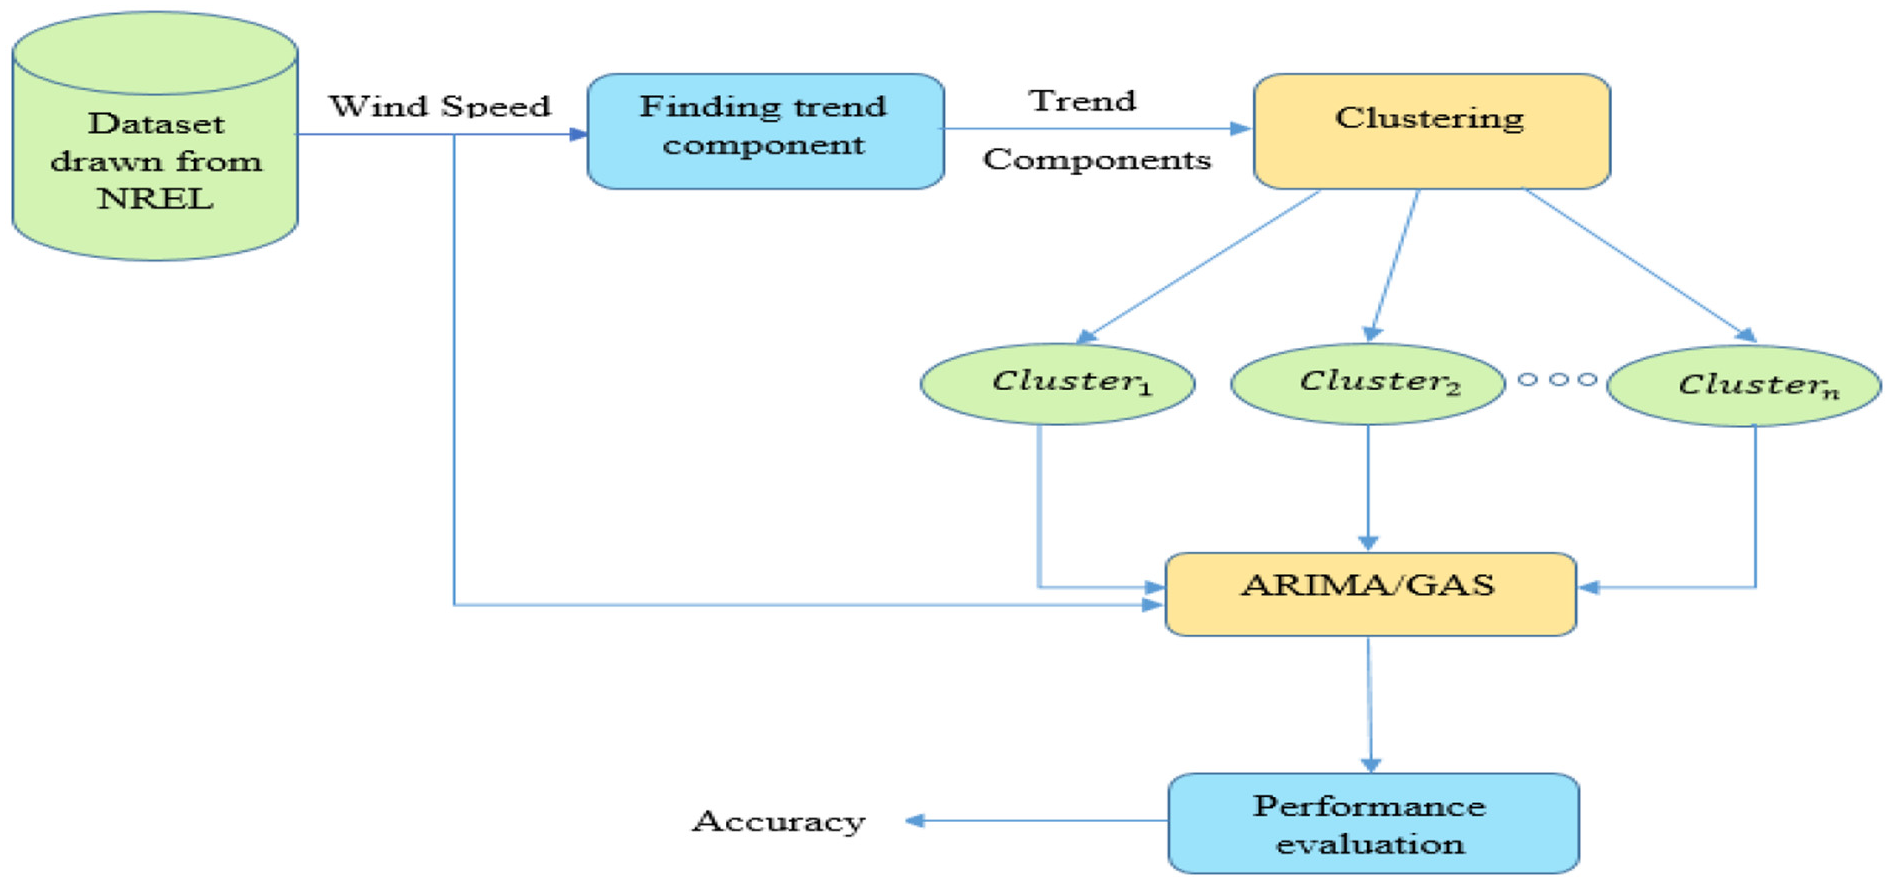
Proposed model for wind speed prediction.
The complete data are divided into training and testing pairs. The proposed methodology is the hybrid forecasting technique, which combines the clustering of time series data and statistical forecasting methods. Here, initially, the whole training data are divided into equal size segments. The size of the segment depends on the size of the completed data taken for modeling. After that proposed clustering method, as in section “Time series data clustering,” has been applied to form the clusters. As a result, a number of groups having a linear trend component in time series data have been formed. Since each cluster having a linear trend component, statistical time series forecasting methods, namely, ARIMA and GAS, have been applied to model the time series data.C-ARIMA (ARIMA model with clustering technique) and C-GAS (GAS model with clustering technique) names have been given to the hybrid approaches. In the first one, ARIMA statistical method has been applied after clustering. Similarly, in the second one, GAS statistical method has been applied after clustering. After developing the hybrid forecasting model on the training set, the performance of the models is evaluated by MAE and RMSE values on testing data. The complete process of the evaluation method has been discussed in section “Research design and analysis.”
Research design and analysis
The complete section presents the experiments conducted on a different dataset and then discusses the results achieved by experiments. The first section covered the detail of the datasets used for experimental purposes. The second section describes the metrics used for performance evaluation. The third section analyzes the results.
Dataset
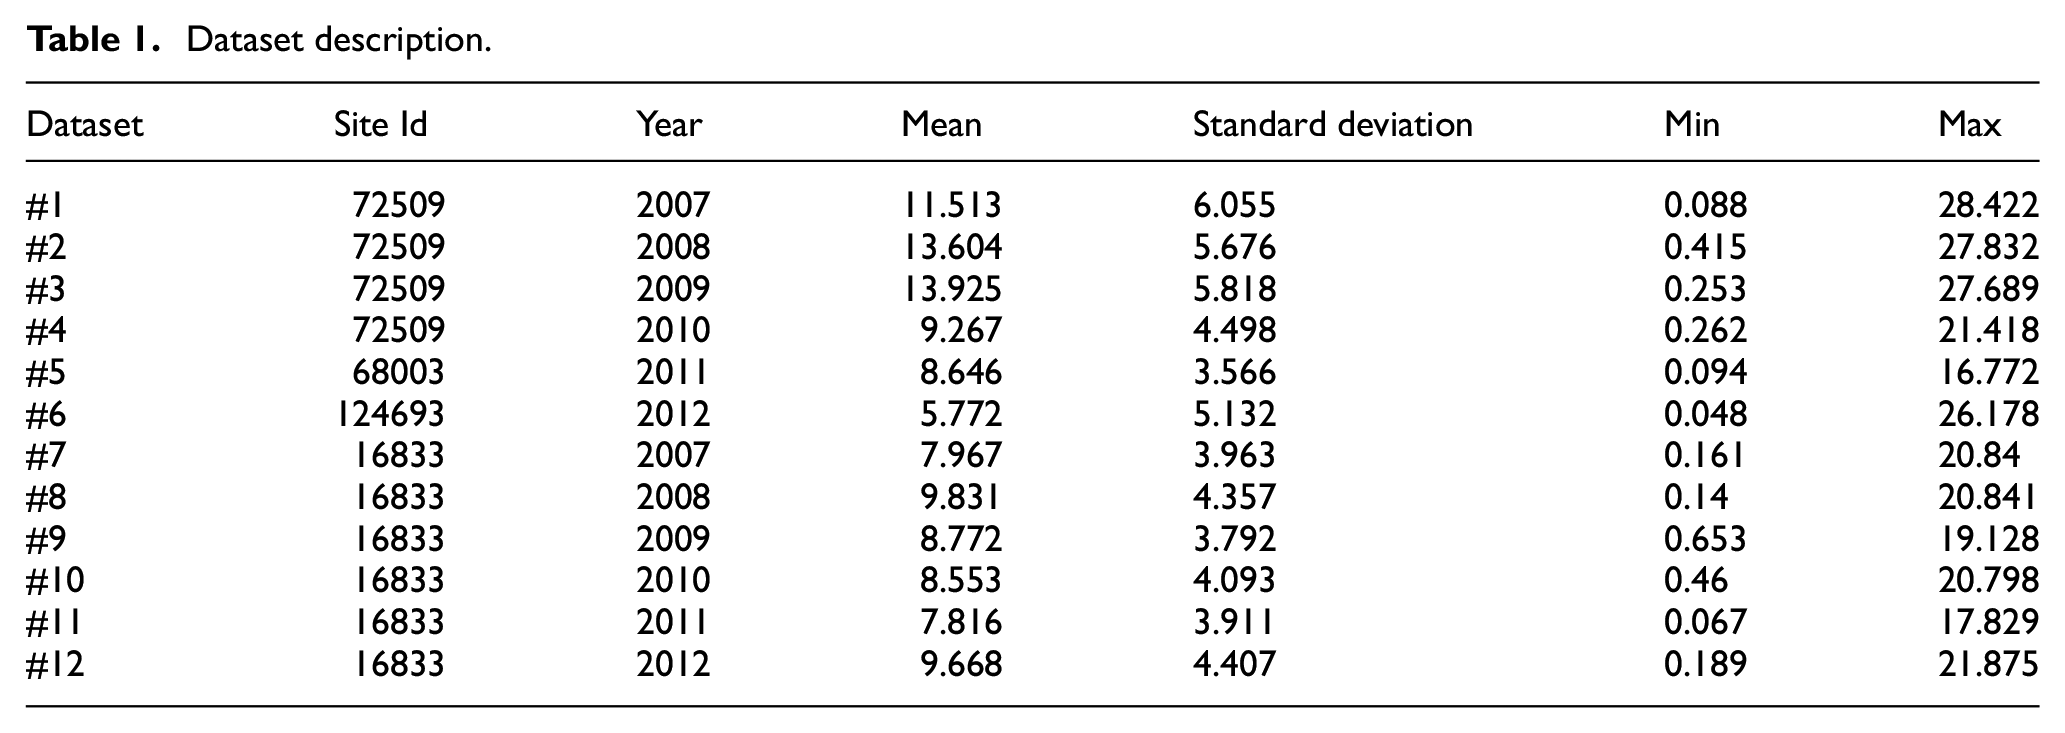
The datasets that have been used for the experimental purpose are drawn from NREL with site Id 72509, 16883, 68003, and 124693. The site Id 72509 having the geographical location with longitude
Dataset description.
Performance monitoring criteria
The performance of statistical and hybrid models is measured by the suitable criteria that assess the ability of the models. For our experimentation, MAE and RMSE are used to measure the performance of wind speed forecasting. The measuring criteria like MAE and RMSE are further represented as follows


here N is the total number of observations, y is input variable, and
Results analysis
In this research article, statistical models (ARIMA and GAS) and hybrid models (C-ARIMA and C-GAS) are applied to 12 different datasets that are drawn from the NREL site. Table 2 shows the prediction results of ARIMA models in terms of MAE and RMSE values. Similarly, Table 3 shows the prediction results of the GAS model.
MAE, RMSE values using the ARIMA and clustered ARIMA models.

MAE: mean absolute error; RMSE: root mean square error; ARIMA: autoregressive integrated moving average.
MAE, RMSE values using the GAS and clustered GAS models.
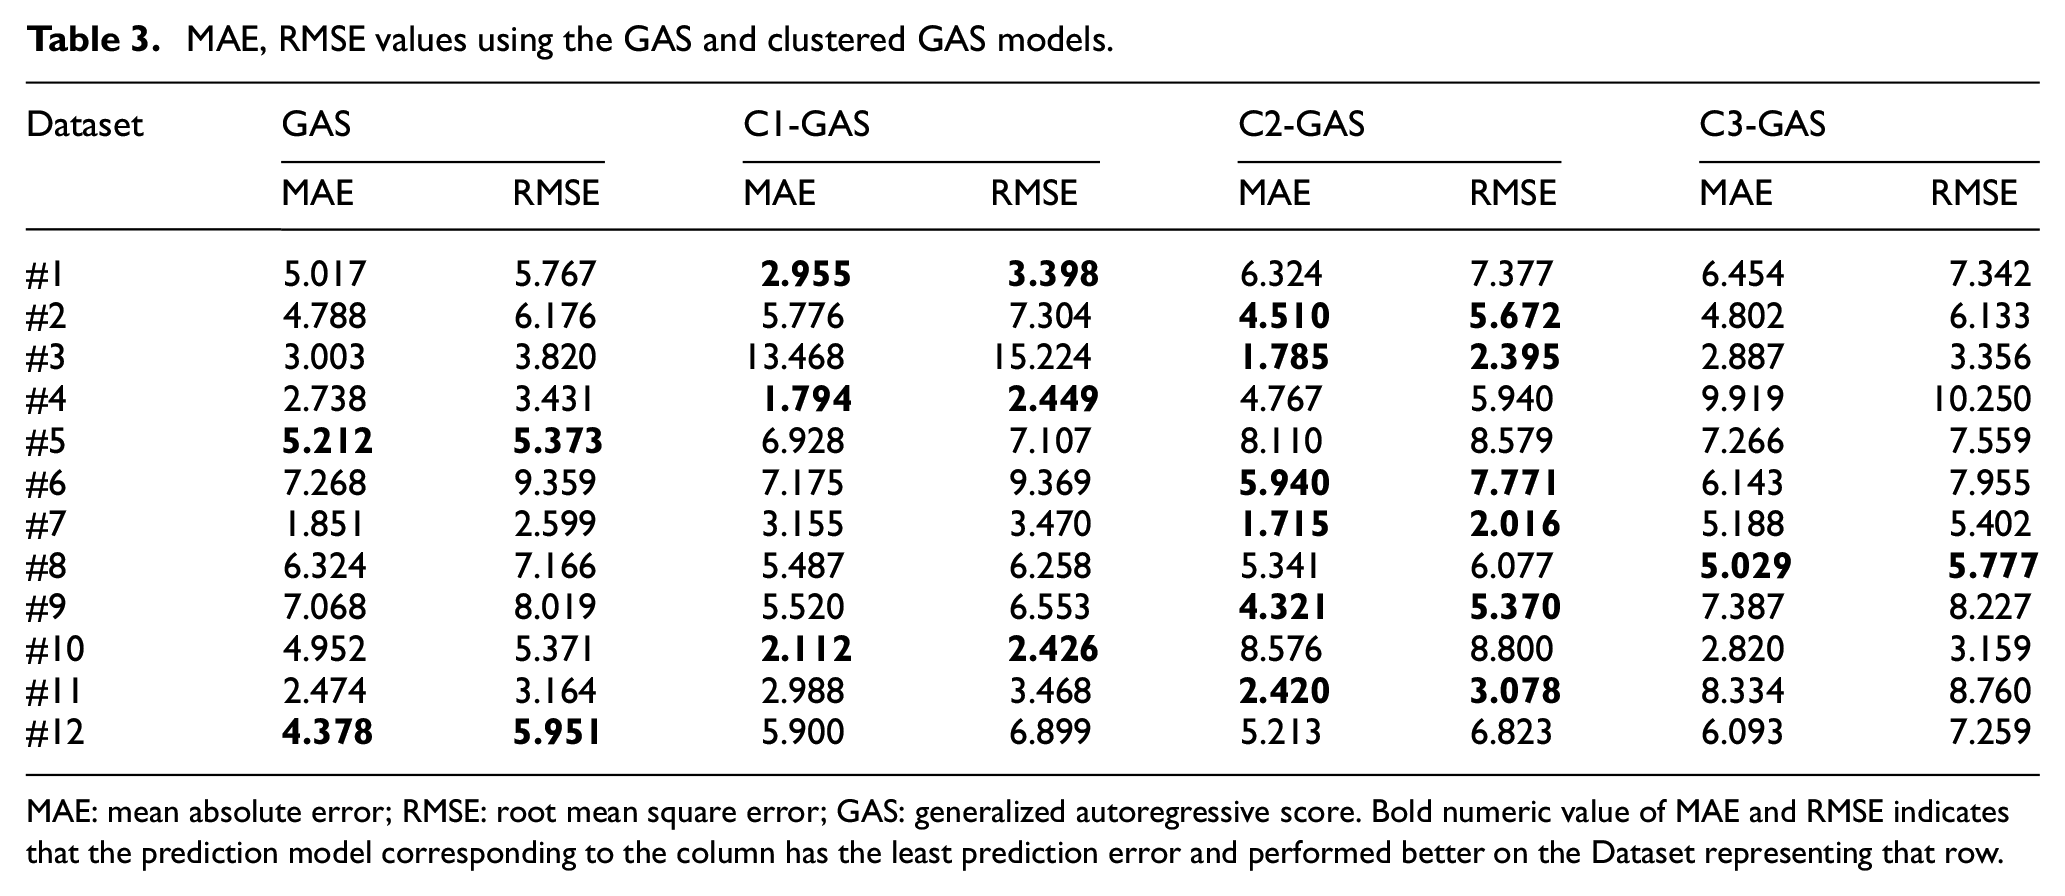
MAE: mean absolute error; RMSE: root mean square error; GAS: generalized autoregressive score. Bold numeric value of MAE and RMSE indicates that the prediction model corresponding to the column has the least prediction error and performed better on the Dataset representing that row.
Figure 3 demonstrates the wind speed prediction using ARIMA and GAS model, applied separately on Dataset #1. Here, the GAS model shows better accuracy in comparison to the ARIMA model. Figure 4 demonstrates the wind speed prediction using the ARIMA model, applied individually on each cluster of Dataset #1. The ARIMA model shows better accuracy on the cluster-1 as compared to other clusters. Similarly, Figure 5 demonstrates the wind speed prediction using the GAS model, applied individually on each cluster of Dataset #1.
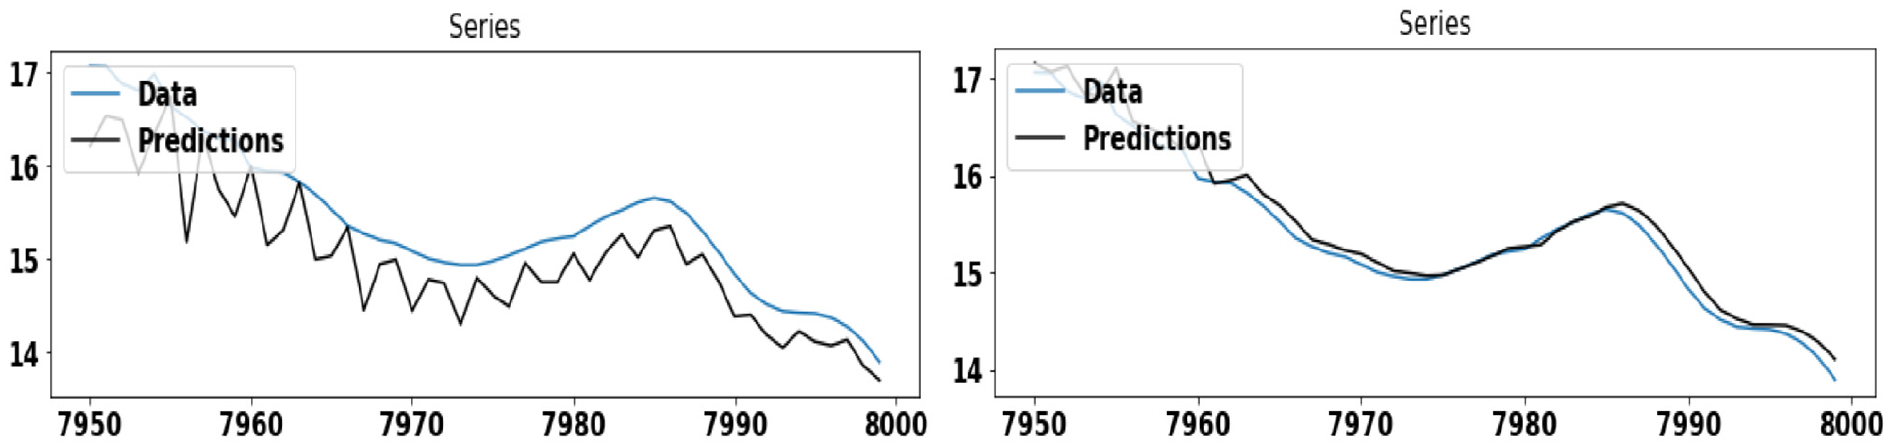
The figures in the left and right panel show the wind speed prediction using the ARIMA and GAS model, respectively, on Dataset #1.
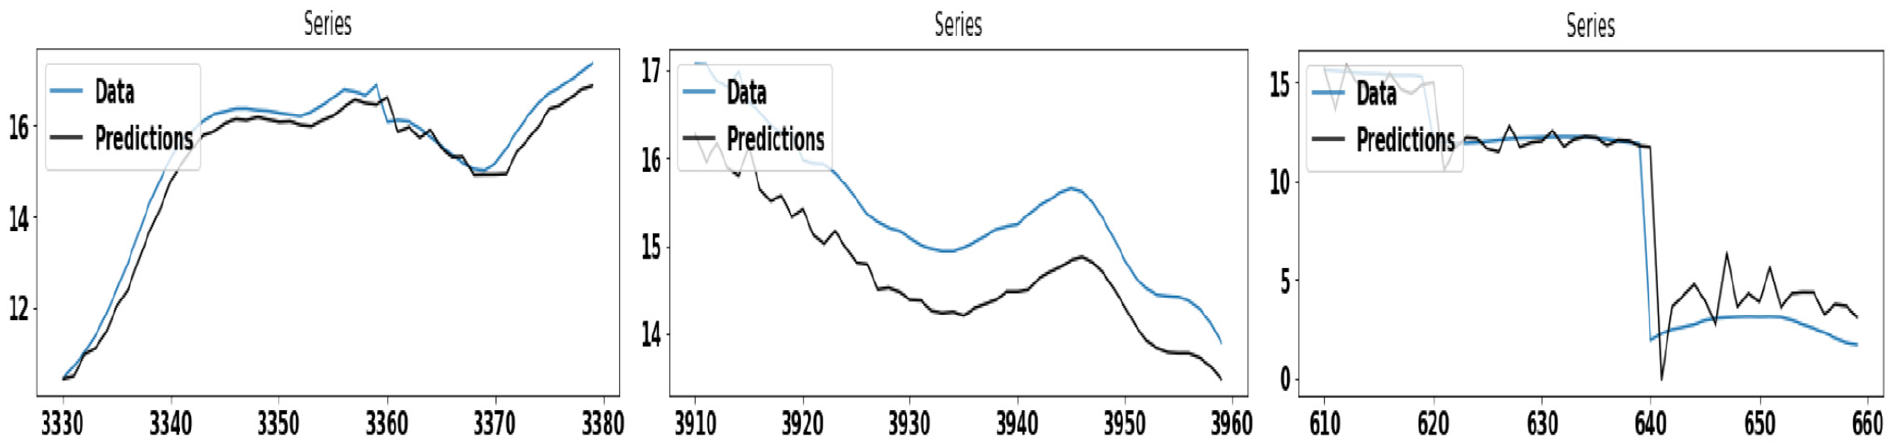
The figures in the left, middle, and right panel show the wind speed prediction using the ARIMA model for first, second, and third clusters, respectively, on Dataset #1.
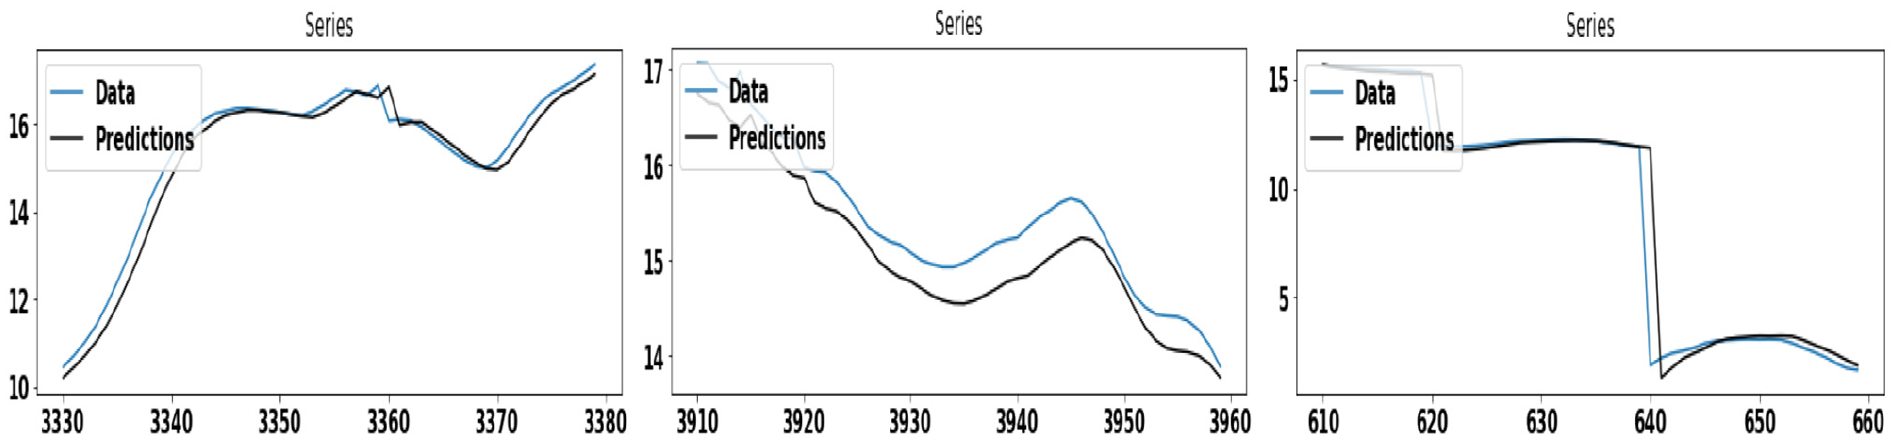
The figures in the left, middle, and right panel show the wind speed prediction using the GAS model for first, second, and third clusters, respectively, on Dataset #1.
Figure 6 demonstrates the wind speed prediction using ARIMA and GAS model, applied separately on Dataset #7. Here, the GAS model shows better accuracy in comparison to the ARIMA model. Figure 7 demonstrates the wind speed prediction using the ARIMA model, applied individually on each cluster of Dataset #7. The ARIMA model shows better accuracy on the cluster-2 as compared to other clusters. Similarly, Figure 8 demonstrates the wind speed prediction using the GAS model, applied individually on each cluster of Dataset #7.
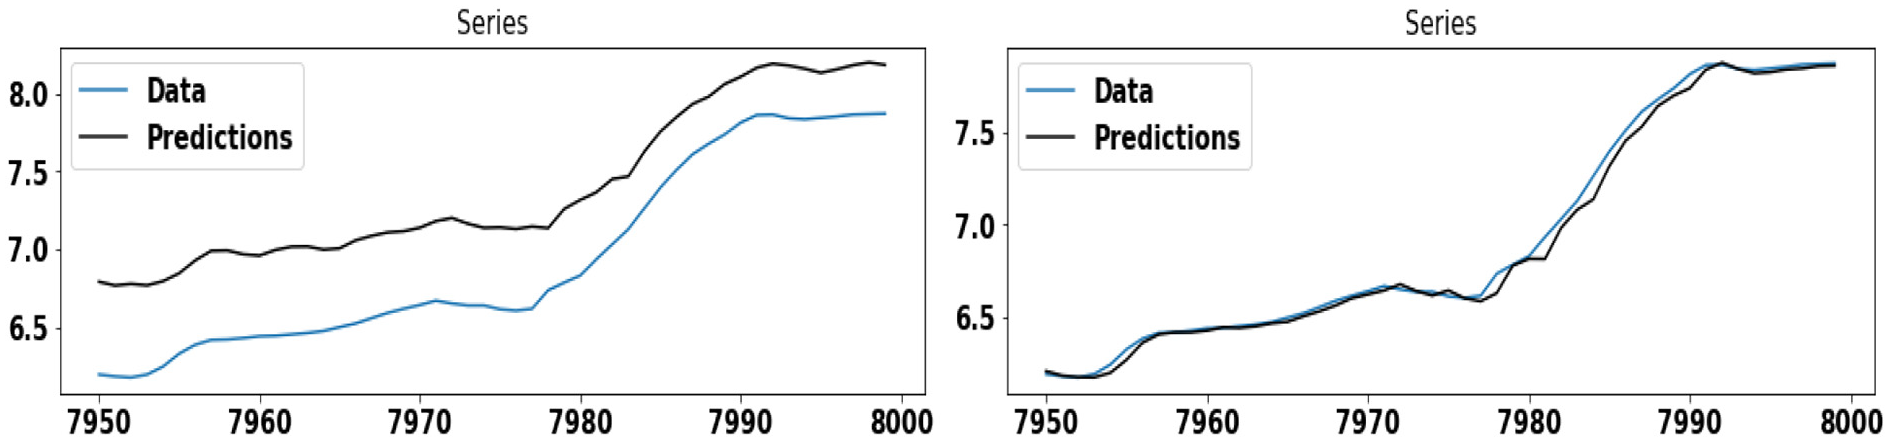
The figures in the left and right panel show the wind speed prediction using the ARIMA and GAS model, respectively, on Dataset #7.
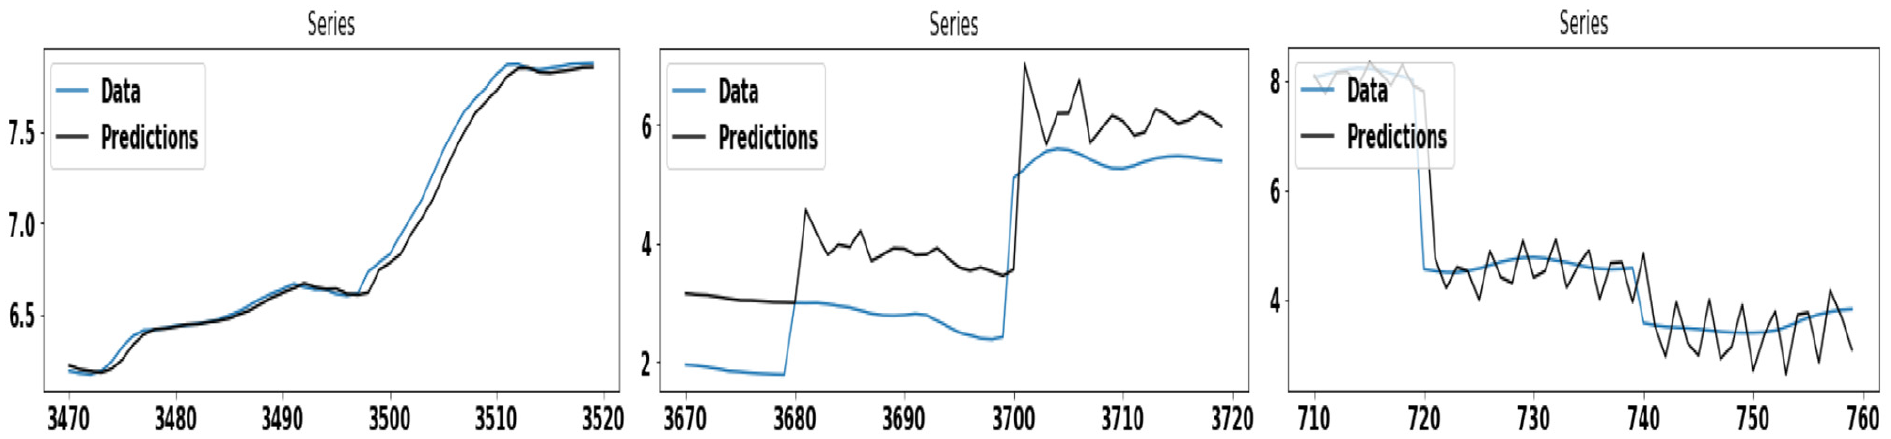
The figures in the left, middle, and right panel show the wind speed prediction using the ARIMA model for first, second, and third clusters, respectively, on Dataset #7.
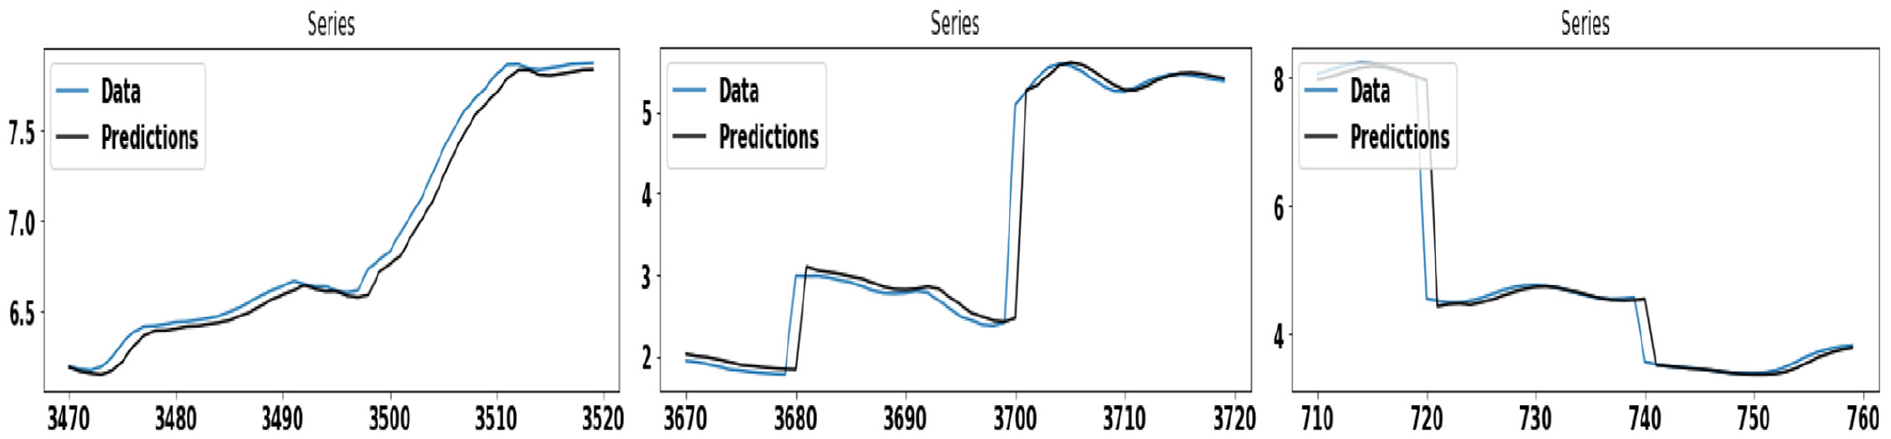
The figures in the left, middle, and right panel show the wind speed prediction using the GAS model for first, second, and third clusters, respectively, on Dataset #7.
Tables 2 and 3 demonstrate the experimental results in terms of MAE and RMSE values achieved for the ARIMA variants and the GAS variants, respectively. In the table, the minimum value of MAE and RMSE is preferred and indicates that the results outperform. As seen from Table 2, the proposed hybrid model (C1-ARIMA) outperforms over the ARIMA model. In terms of MAE and RMSE values, the C1-ARIMA-based model empirically developed on Dataset #7 obtains the result, 1.714 and 2.106, respectively. The table demonstrates that the clustering-based ARIMA model performs better most of the time as compared to the ARIMA model. As seen from Table 2, the proposed hybrid model (C2-GAS) outperforms over the ARIMA model. In terms of MAE and RMSE values, the C2-GAS-based model empirically developed on Dataset #7 obtains the result, 1.715 and 2.016, respectively. This table also demonstrates that the clustering-based GAS model performs better most of the time as compared to the GAS model. Overall, it can be concluded that the performance of the clustering-based hybrid models outperforms over the statistical models.
Conclusion
The existing classical models of wind forecasting like ARIMA and GAS are relatively easer; however, due to the complexity in data, these have considerable restrictions in terms of implementation. By minimizing the complexity in the time series data without compromising the loss of informative patterns, better model performance can be achieved. This article provides one such mechanism for generalizing our model with optimal performance. In experiments, it has been observed that the clustering-based hybrid model (C-ARIMA and C-GAS) performs better as compared to existing ARIMA and GAS models. Using the proposed hybrid method on wind forecasting, the article analyzes the trend characteristics of wind time series data and finds that a trend component of wind time series data has different shapes. When first, the time series data are grouped according to the shape of the trend component, and then the model is developed for each group using the existing technique of forecasting, the results excel accuracy. In order to achieve better generalization, the model has been developed on 12 different datasets drawn from the NREL site.
Footnotes
Declaration of conflicting interests
The author(s) declared no potential conflicts of interest with respect to the research, authorship, and/or publication of this article.
Funding
The author(s) received no financial support for the research, authorship, and/or publication of this article.