
Abstract
To meet 2050 decarbonization goals, Massachusetts will not be able to rely on carbon intensive energy sources (e.g. natural gas and gasoline) and hydrogen has been considered a replacement. To produce hydrogen without carbon emissions, renewable energy sources will be used to power electrolyzer stacks. However, renewable energy sources will also be in high demand for other energy sectors, such as automobiles and electrification. This paper estimates the amount of wind energy needed to replace natural gas with hydrogen and electrify automobiles. Comparisons are also made for a scenario in which heat pumps are used to replace natural gas. These energy sectors represent the bulk of energy consumed within Massachusetts and are of high interest to stakeholders globally. The analysis reveals the daunting amount of wind energy needed for replacement and that it is highly unlikely for hydrogen to replace natural gas in time to meet the state’s climate goals.
Introduction
Within Massachusetts, other states, and countries, natural gas (i.e. 70-90% methane) and gasoline are critical sources used for heating, electrical power generation, transportation, and other commercial and industrial processes. For most people, these fuels are an integral part of everyday life and are used to generate electricity in power plants and are essential for cooking, heating, and commuting. However, methane and gasoline are not considered sustainable fuels and generate significant greenhouse gas (GHG) emissions when sourced, processed, transported, or combusted. The Massachusetts fuel GHG emissions by sector is shown in Figure 1. Natural gas is a key component in the residential, commercial, and industrial sectors, and is used to produce two-thirds of electricity in Massachusetts, producing an annual CO2 equivalent emission of about 40 million metric tons (U.S. Energy Information Administration, 2022a; Department of Environmental Protection, 2022). However, this estimate is likely to be conservative as it does not account for gas leaks. Gasoline dominates the transportation sector, which is the highest sector for emissions with over 30 million metric tons of CO2 equivalent emitted annually (Department of Environmental Protection, 2022). CO2 equivalent is a metric used to compare the emissions from various greenhouse gases based on their global warming potential (GWP) (Eurostat Statistics Explained, 2017). Massachusetts has committed to achieving net- zero greenhouse gas emissions (after end use) by the year 2050 (Executive Office of Energy and Environmental Affairs and The Cadmus Group, 2020), and to do so Massachusetts cannot rely on natural gas and gasoline. Within the last several years, there has been increasing interest in using hydrogen to replace natural gas because when used within a fuel cell, hydrogen does not produce any carbon emissions. The electrification of vehicles has also gained popularity within the last two decades as a way to eliminate or reduce emissions caused by burning gasoline. The adoption of hydrogen and battery electric vehicles by consumers has been largely driven by cost reductions caused by recent improvements in battery, electric motor, and hydrogen fuel cell technology.
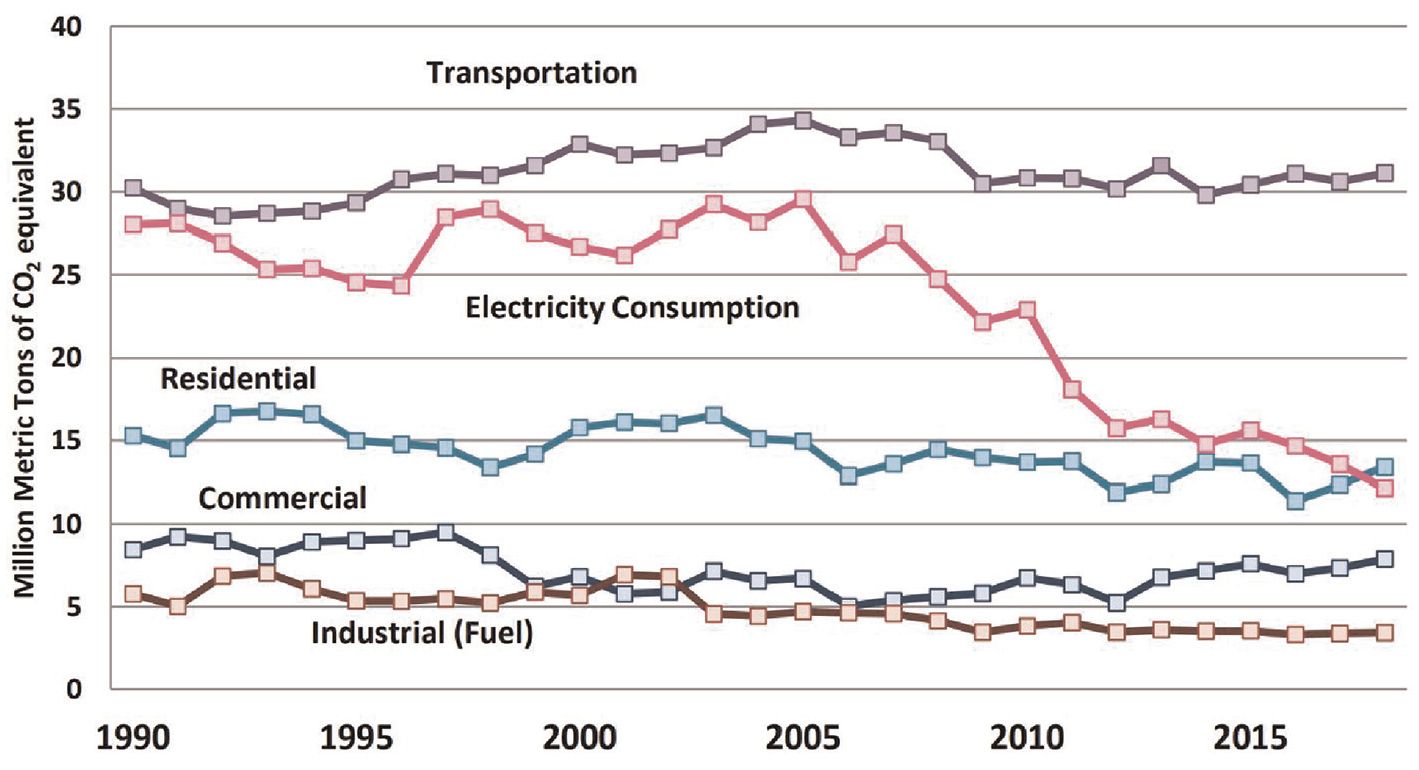
Massachusetts 1990–2018 fuel combustion GHG emissions by sector (Department of Environmental Protection, 2022).
There are several different methods of producing hydrogen. Some methods of hydrogen production are energy intensive and produce large amounts of carbon dioxide and/or non-CO2 GHG emissions (i.e. gray hydrogen), while other methods of hydrogen production are more costly and dependent on renewable energy sources (i.e. green hydrogen). Colors are assigned to the different methods of hydrogen production to distinguish them from one another. Figure 2 shows some of the different colors (i.e. green, blue, gray, pink, yellow) that are used to label hydrogen and their corresponding production methods.

Different colors of hydrogen based on their production methods (Petrofac, 2021).
Green hydrogen is generated through electrolysis of water, powered by renewable energy sources (i.e. solar, wind, or hydro power). In this method, a renewable-energy-activated electrolyzer electrochemically splits water into oxygen and hydrogen. The oxygen is either collected or released into the atmosphere and the hydrogen is stored either as a liquid (i.e. cooled to cryogenic temperatures) or a gas at high pressure. Stored hydrogen can then be transported via tanker trucks (liquid) or pipeline systems (gas).
Gray hydrogen is the most widely used form of hydrogen today, making up over 95% of the world’s hydrogen produced (Rapier, 2020) and costs approximately US $ 0.70–$2.20 per kilogram (Collins, 2021). This form of hydrogen is produced from natural gas (i.e. methane, CH4) via a nickel-catalyzed steam methane reforming (SMR) process, in which methane and steam react over nickel catalysts at a high temperature (i.e. 1000 K) to produce carbon monoxide and hydrogen. The carbon monoxide then reacts with steam to produce additional hydrogen and carbon dioxide via water gas shift reaction. The carbon dioxide generated in this process has little economic value. Therefore, absent of a carbon tax, there are no financial incentives not to release it into the atmosphere, contributing to GHG emissions. The total amount of carbon dioxide that is released to the atmosphere is approximately 9–12 tons for every ton of gray hydrogen produced (Watson and Judd, 2021).
Similar to gray hydrogen, blue hydrogen is also generated using natural gas resources through SMR with a byproduct of carbon dioxide. The difference between gray and blue hydrogen is that in the latter, the carbon dioxide is captured and stored as opposed to being released into the atmosphere. This process is called Carbon Capture Utilization and Storage (CCUS). Once carbon dioxide is captured, it can be compressed into a fluid and transported to a storage site or used in other processes such as enhanced oil recovery (EOR), synthetic fuels, and building aggregates (International Energy Agency, 2021). However, the addition of a carbon capture storage system to an existing natural gas power plant would raise the price of blue hydrogen to approximately $1.30-$2.90 per kilogram (Collins, 2021).
The study “How green is blue hydrogen” (Howarth and Jacobson, 2021) points out that even though blue hydrogen may seem like a “greener” alternative to gray hydrogen, there are still carbon and GHG emissions associated with its carbon capture and storage systems. Carbon dioxide equivalent emissions of blue hydrogen are only reduced by 9%–12% as compared to gray hydrogen because carbon capture systems are not 100% efficient in capturing carbon dioxide. To power the carbon capture system during the blue hydrogen production process, natural gas would need to be used and would inherently increase the emissions of fugitive methane. Compared on a mass-to-mass basis, methane is initially more than 100-times more impactful as a warming agent than carbon dioxide for the time both gases are in the atmosphere and causes 86-times the warming as carbon dioxide over an integrated 20-year time frame after initial emission of the two gases (Howarth and Jacobson, 2021). It is also important to note that in this study, 2.25 kWh/m3 of hydrogen was used as the required energy needed to drive the SMR process (Howarth and Jacobson, 2021). This value is a mean value of energy required for the SMR process. Therefore, the calculated values and percentages may be different from ones found in real world scenarios. However, this difference does not significantly alter the findings of this paper. The use of blue hydrogen does not currently provide the necessary carbon reduction needed to meet climate goals nor is it cost effective. Blue hydrogen cannot substantively contribute to carbon reduction unless new technologies emerge to make the capture and sequestration of carbon emissions from its production much more efficient and it costs substantially lower.
Renewable energy is defined as the energy production from non-carbon emitting natural sources that cannot be depleted (Shinn, 2018). The benefit of green hydrogen using renewable energy is that the overall process releases essentially zero GHG emissions into the atmosphere since the only byproduct of water electrolysis is oxygen. However, the primary challenge of green hydrogen production is cost, as the current price to produce green hydrogen is approximately $6.00 per kilogram (Watson and Judd, 2021). To widely utilize green hydrogen in the market, as identified in the report of “Path to Hydrogen Competitiveness,” the potential tipping price for green hydrogen needs to fall to approximately $2.00 per kilogram (Hydrogen Council, 2020).
To produce enough hydrogen for any large-scale applications, green hydrogen will need to be cost-competitive and currently there are no wide-scale renewable energy resources focused on hydrogen generation. Anticipated offshore wind installations on the East Coast, as well as additional solar photovoltaic installations, are expected to significantly increase the available clean electricity, making wide-scale hydrogen generation more viable. However, this capacity also will be required to replace existing fossil fuel power plants (now primarily based on natural gas) to generate electricity for direct use by customers. The Department of Energy (DOE) is working toward a goal of making the cost of green hydrogen close to $1 per kilogram with their Energy Earthshots Initiative by the year 2030 (Office of Energy and Efficiency & Renewable Energy, 2021b).
Green hydrogen has a wide variety of potential uses within a variety of industries including transportation, production of synthetic fuels, ammonia, fertilizer, metal production, industrial processes, heating, energy storage, and distributed power. It has been proposed to use hydrogen as a replacement for natural gas in the pipeline distribution networks for home and commercial heating in Massachusetts, throughout the United States, and abroad. One project at Keele University in the United Kingdom is known as “HyDeploy” (HyDeploy, 2021). In the study, the university showed that it is possible to insert a 20% hydrogen and 80% natural gas mixture by volume into the current natural gas pipeline system in the U.K. with little to no modifications. Companies in the U.S., such as National Grid, have developed projects similar to HyDeploy, where a smaller blend of hydrogen is supplied to the natural gas system, but on a much larger scale, heating hundreds of households (NationalGrid, 2021). An overview of hydrogen and a summary of the challenges and opportunities of implementing hydrogen within Massachusetts can be found in (Hammerstrom et al., 2022a).
In a related work from 2007, Kempton et al. (2007) compared the wind energy resource available within the entire Middle Atlantic Bight (MAB) in comparison to the energy demand of the adjacent states from Massachusetts to North Carolina. Their finding reveals that the average electricity wind power resource within the MAB exceeds the region’s summed power demand and that wind power can contribute to very significant CO2 emission reductions for the region. Since that publication, wind turbines have grown considerably in size and the capacity factors have also increased. In addition, electric vehicles, electrification using heat pumps, and hydrogen generation using renewables were not an important consideration at that time.
Another more recent study from NREL has investigated several multiple pathways to achieve a net-zero U.S. power grid by 2035. Within the study for all scenarios modeled, new clean energy technologies and deployments are needed at an unprecedented scale and rate to achieve 100% clean electricity by 2035. Wind and solar energy would provide 60%–80% of generation in the least-cost electricity mix leading to significant decarbonization, beneficial climate affects, and human health benefits. The analysis estimates that the U.S. will need between 779 GW and 1342 GW of installed wind energy, depending on the scenario (National Renewable Energy Laboratory, 2022; Denholm et al., 2022). These datasets imply that the amount of wind energy generation within the U.S. would need to be increased by approximately a factor of ten compared to the existing installments to achieve 100% clean electricity.
A study done by NREL assessed the offshore wind resource in the U.S. considering both fixed-bottom and floating wind turbines and concluded that there is over 4200 GW of achievable power generation to help meet U.S. electricity demands (Lopez et al., 2022). Another report from NREL predicts that full hydrogen consumption potential (the quantity of hydrogen that would be consumed to serve the total possible market for hydrogen without considering economics) in the U.S. could be produced from only 15% of the annual potential electricity (the total possible wind energy supply constrained by real-world geography and system performance) from onshore and offshore wind turbines assuming that other domestic uses of wind energy continue at 2017 levels (National Renewable Energy Laboratory, 2020). This study is unique compared to other previous studies (National Renewable Energy Laboratory, 2022; Denholm et al., 2022; Kempton et al., 2007; Lopez et al., 2022; National Renewable Energy Laboratory, 2020) because it includes more specific calculations related to green hydrogen replacement of natural gas consumption, heat pump replacement of natural gas furnaces and boilers, and quantifies the amount of wind turbines needed to power electric vehicles in Massachusetts. The framework analyzes the energy consumption of specific sector demands compared to wind energy capacity needs. Most previous studies analyze overall wind or renewable energy generation compared to total energy consumption over all sectors. The prior studies did not focus on what is required for gasoline replacement via battery electric vehicles or methane replacement via hydrogen or heat pumps for electrification. These topics are of high interest to stakeholders not only in Massachusetts, but both nationally and globally.
Before Massachusetts can reach its goal of net-zero greenhouse gas emissions by 2050, Governor Charlie Baker signed an act into law in 2021 which requires the Secretary of Energy and Environmental Affairs to set interim limits on GHG emissions for 2025 and 2030 (Executive Office of Energy and Environmental Affairs, 2022). These limits mainly focus on transportation, buildings, electricity, and non-energy and industrial sectors. The emissions limits both represent a 33% reduction from the 1990 level in 2025, and a 50% reduction in 2030, and serve as stepping stones to achieve the net-zero GHG emissions goal in Massachusetts by 2050 (Executive Office of Energy and Environmental Affairs and The Cadmus Group, 2020).
In light of potentially increased demand for and the level of interest in green hydrogen and electrification, this paper focuses on three fundamental questions. “How many wind turbines would be needed to generate the necessary green hydrogen required to replace the current natural gas consumption in Massachusetts?” A second question is: “How many wind turbines are required if the natural gas for the residential thermal sector is replaced with heat pumps?” Lastly, a third companion question addressed is: “How many wind turbines would be needed to replace the gasoline consumed by vehicles in Massachusetts with electricity for battery-electric vehicles?” Because natural gas is extensively used within the residential heating sector, a comparison is made for a scenario in which electric heat pumps are used to replace natural gas furnaces and boilers. This paper presents the first analysis of the relationship between the number of wind turbines that would be required to produce a given amount of hydrogen and electricity needed for a U.S. state, specifically Massachusetts. The analysis is also directly applicable to all other U.S. states as well as countries by simply changing the specific methane and gasoline consumption parameters for a specific region or country. The paper quantifies the need for additional renewable energy generation for green hydrogen production, as well as providing an analysis on the number of wind turbines needed to replace all gasoline vehicles with electric vehicles and natural gas furnaces and boilers in the residential sector with heat pumps within Massachusetts. Following, a discussion of the results, implications, and conclusions are presented that are critically important for future policy making and initiatives to enable the transition to a clean energy economy.
Hydrogen replacement of natural gas (data and methodology)
Within this analysis, it is assumed that green hydrogen is the only viable form of hydrogen for reductions in carbon emissions. It should be noted that while nuclear energy is part of Massachusetts’ energy profile, its potential impact on hydrogen production for GHG emission reduction is not considered here. To produce green hydrogen at wide-scale and replace methane consumption, there would need to be either dedicated renewable energy sources for green hydrogen production or an oversupply of renewable energy that exceeds demand. Wind energy is one of the most developed and cost-effective forms of renewable energy (Office of Energy and Efficiency & Renewable Energy, 2022a). Therefore, within this study the number of wind turbines that would be necessary to power the electrolyzer stacks needed to produce enough hydrogen to replace methane by energy content is determined.
The Commonwealth of Massachusetts’ annual natural gas consumption is used for the basis of this analysis, but the same methodology is applicable to other states, countries, or regions. The assumptions made and variables used in this study are as follows:
(1) The transportation and storage of hydrogen does not induce any energy losses.
(2) The change in lower heat value (LHV) of hydrogen due to pressure in the gas distribution network is negligible.
(3) The average offshore wind turbine power capacity is 12 MW with a capacity factor of 0.51 (Office of Energy and Efficiency & Renewable Energy, 2019; Center for Sustainable Systems, University of Michigan, 2021).
(4) The average onshore wind turbine power capacity is 3.5 MW with a capacity factor of 0.414 (Office of Energy and Efficiency & Renewable Energy, 2021a).
(5) Electrolyzer stacks can operate at 43 kWh/kg of hydrogen with an energy efficiency of 77% (Office of Energy and Efficiency & Renewable Energy, 2022b).
(6) The wind turbine downtime for maintenance or repair is not taken into consideration for either onshore or offshore turbines. A typical value of wind turbine availability is ∼97% for modern wind turbines.
When making assumptions within any analysis, limitations to its applicability exist and are now discussed. Hydrogen energy losses due to transportation and storage are very dependent on the pipelines, the transmission length, the operating pressure, and how the gas is stored (Assumption 1). Within this study it is assumed that there are no losses in replacing methane with hydrogen within the pipeline transmission and distribution network. Because hydrogen has a lower energy density per unit volume, more energy is required for compression of the gas and an additional volume of gas is required to be pumped to deliver an equivalent amount of thermal energy. Therefore, the amount of wind energy required for gas replacement will likely be higher than the estimates made within this study. The analysis is inherently conservative by assuming that no energy losses are made in hydrogen’s transportation. For the second assumption, hydrogen is produced onshore in Massachusetts, the delivery distance varies between 50 miles and 150 miles. According to a report published by European Commission, the energy loss (or pressure loss) between the sites of production and consumption is negligible, less than $ 0.1/kg (European Commission, 2021), compared to the cost of hydrogen itself (DOE target $2/kg). For the wind turbine assumptions (3–4), capacity factors depend on the turbine location and design. The values chosen represent average capacity factors and power rating values based on available data. Electrolyzer stack performance depends on the type of technology implemented (Assumption 5). The assumption is based on the best available technology today, but this efficiency may change in the future. All wind turbines will experience some downtime for maintenance (Assumption 6). However, the turbine model chosen, its reliability, and operating conditions will all affect how much downtime the turbines experience and therefore a typical industry availability was chosen.
It is important to note that the technology performance assumptions above are intended to be optimistic by the authors’ intent. To consider whether hydrogen could be a viable replacement for natural gas to meet Massachusetts’ climate goals, we intentionally use assumptions that favor its potential use. Thereby, the estimates of the number of turbine required to (a) generate the necessary green hydrogen required to replace the current natural gas consumption and (b) replace the gasoline consumed by vehicles with electricity for battery-electric vehicles, will be conservative estimates. The actual number of turbines required will be higher than what is calculated by this analysis. However, even by using these assumptions, the results will illuminate the significant challenges present in achieving net-zero emission goals for Massachusetts and other states or countries.
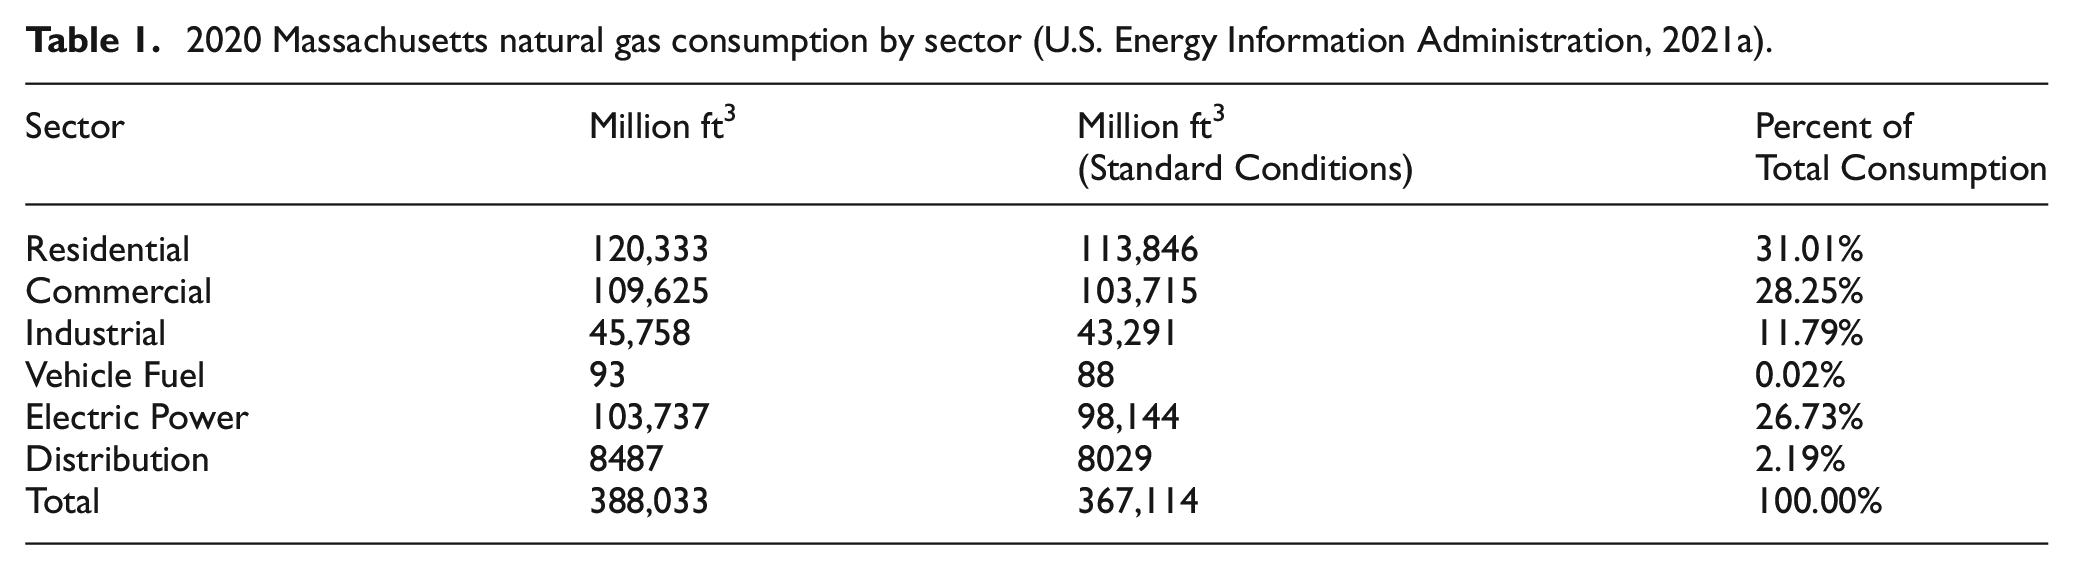
Massachusetts’ natural gas consumption by sector for the year 2020 is shown in Table 1. The volume of natural gas for each sector was adjusted using the ideal gas law under a constant pressure of 1 bar and a change in temperature from 15.55°C (the temperature at which this consumption is recorded) to 0°C to show volume under standard conditions (0°C and 1 bar). For the residential heating sector Massachusetts consumed approximately 113,846 million ft3 of natural gas (U.S. Energy Information Administration, 2021a).
2020 Massachusetts natural gas consumption by sector (U.S. Energy Information Administration, 2021a).
Hydrogen replacement of natural gas (calculations)
As shown in Table 2, with the LHV of natural gas, 983 BTU/ft3, the total amount of natural gas energy Massachusetts used in 2020 for the residential sector is calculated to be

Energy source properties used (The Engineering ToolBox, 2022).
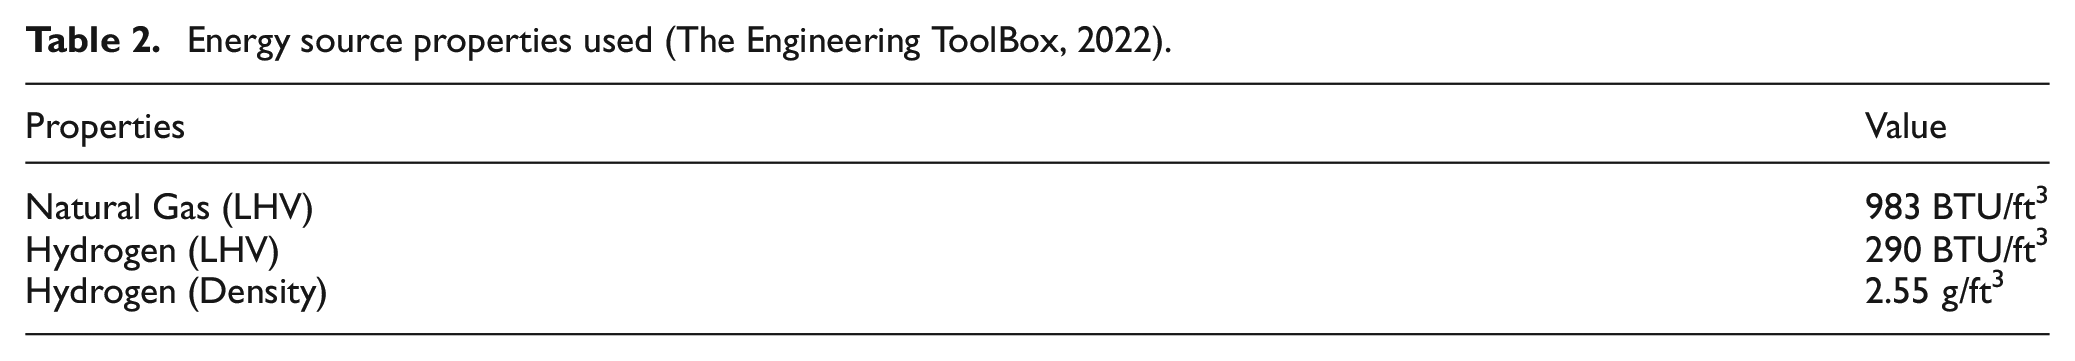
Converting the amount of energy in BTU to kilograms of hydrogen is as follows,

where the LHV of hydrogen is 290 BTU/ft3 and the mass density of hydrogen is 2.55 g/ft3 at temperature of 0°C and a pressure of 1 bar (The Engineering ToolBox, 2022). From the calculations shown in equations (1) and (2), 9.84 × 10⁸ kg of hydrogen are needed to replace natural gas in the residential heating sector. To produce the same amount of green hydrogen, electrolyzer stacks powered by a renewable energy source would be needed. According to DOE’s 2020 electrolyzer stack targets, for every kilogram of hydrogen produced 43 kWh are necessary assuming a 77% efficiency rating (Office of Energy and Efficiency & Renewable Energy, 2022b).

Assuming the annual energy demand for natural gas is constant and there are no losses due to long term storage or transportation, the energy needed annually for hydrogen production in the residential heating sector is 42.31

It is also assumed that the average offshore wind turbine has a power rating of 12 MW with a capacity factor of 0.51 (Office of Energy and Efficiency & Renewable Energy, 2019; Center for Sustainable Systems, University of Michigan, 2021). With these ratings, an offshore wind turbine’s annual energy output would be approximately 53.61 × 10⁶ kWh/year.

Assuming no power transmission losses, the amount of energy needed to power the electrolyzer stacks can be divided by the yearly energy output of the onshore and offshore wind turbines to estimate the number of wind turbines required to produce the necessary amount of hydrogen to replace methane.
Onshore:

Offshore:

Therefore, 3,334 onshore wind turbines or 789 offshore wind turbines are needed to produce the hydrogen required to replace natural gas in the residential heating sector.
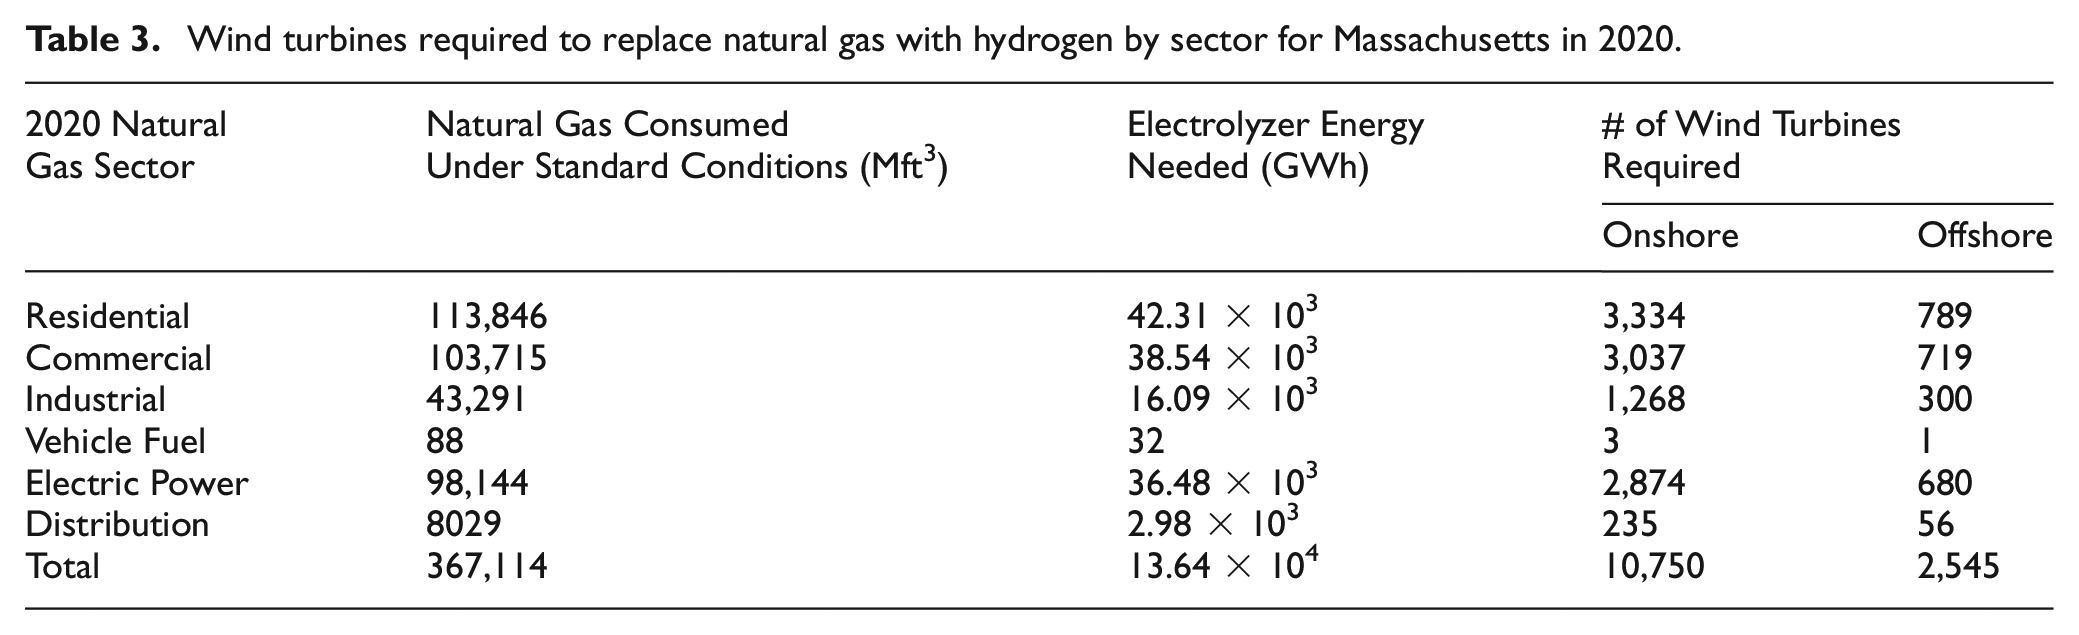
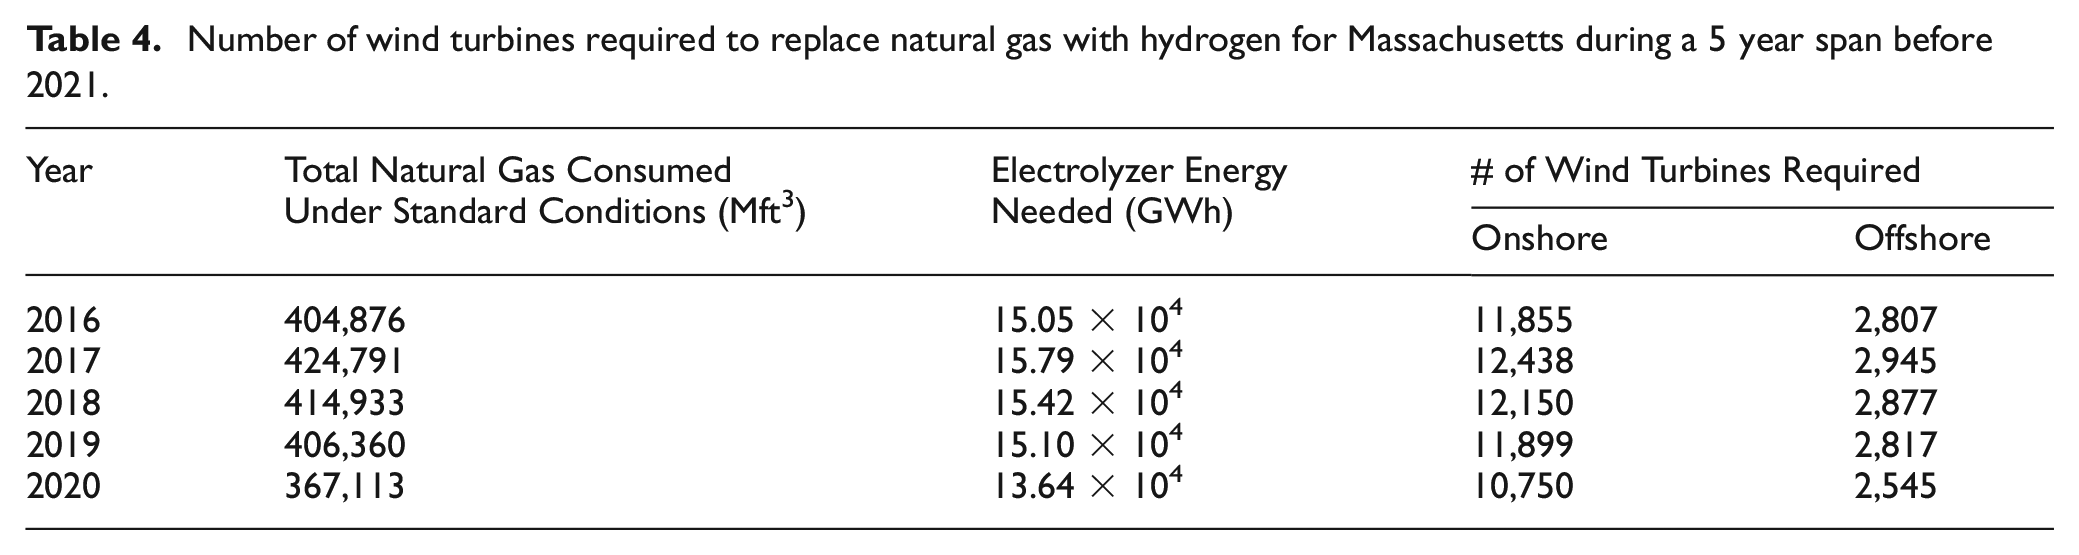
The values presented in Figure 3 and Table 3 use the same methodology for the hydrogen needed to replace natural gas in every energy sector within Massachusetts (using 2020 consumption levels). The energy needed for electrolyzer stacks to produce this quantity of green hydrogen would require 10,750 onshore wind turbines or 2,545 offshore wind turbines. A similar analysis can be performed for previous years and these results are shown in Figure 4 and summarized in Table 4.
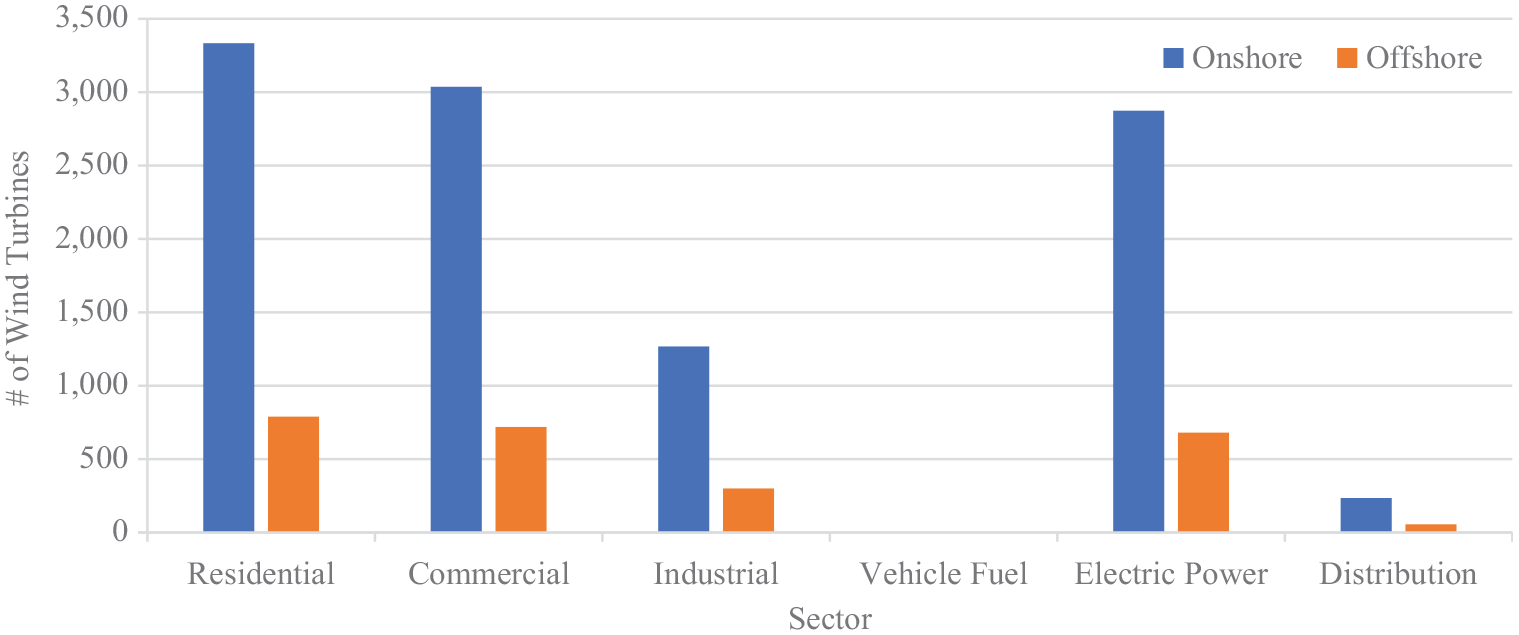
Wind turbines required to replace natural gas with hydrogen by sector for Massachusetts in 2020.
Wind turbines required to replace natural gas with hydrogen by sector for Massachusetts in 2020.

Number of wind turbines required to replace natural gas with hydrogen for all energy sectors in Massachusetts.
Number of wind turbines required to replace natural gas with hydrogen for Massachusetts during a 5 year span before 2021.
Wind power procurements of renewable energy sources by Massachusetts
To understand the implications of these calculations, they must be put in the context of the current status of Massachusetts’ plans to procure renewable clean energy sources. On August 8, 2016, Massachusetts procured 1,604 MW of offshore wind installations from two companies (Vineyard Wind, 800 MW; SouthCoast Wind (formerly Mayflower Wind), 804 MW). In 2021 an additional 1,632 MW of procurements (Avangrid Renewables, 1,232 MW; SouthCoast Wind, 400 MW) were added, totaling 3,236 MW of future installed capacity (Mass.gov, 2021). The various wind installments will be located approximately 15 mi south of the islands of Martha’s Vineyard and Nantucket as shown in Figure 5 (Mass.gov, 2021).
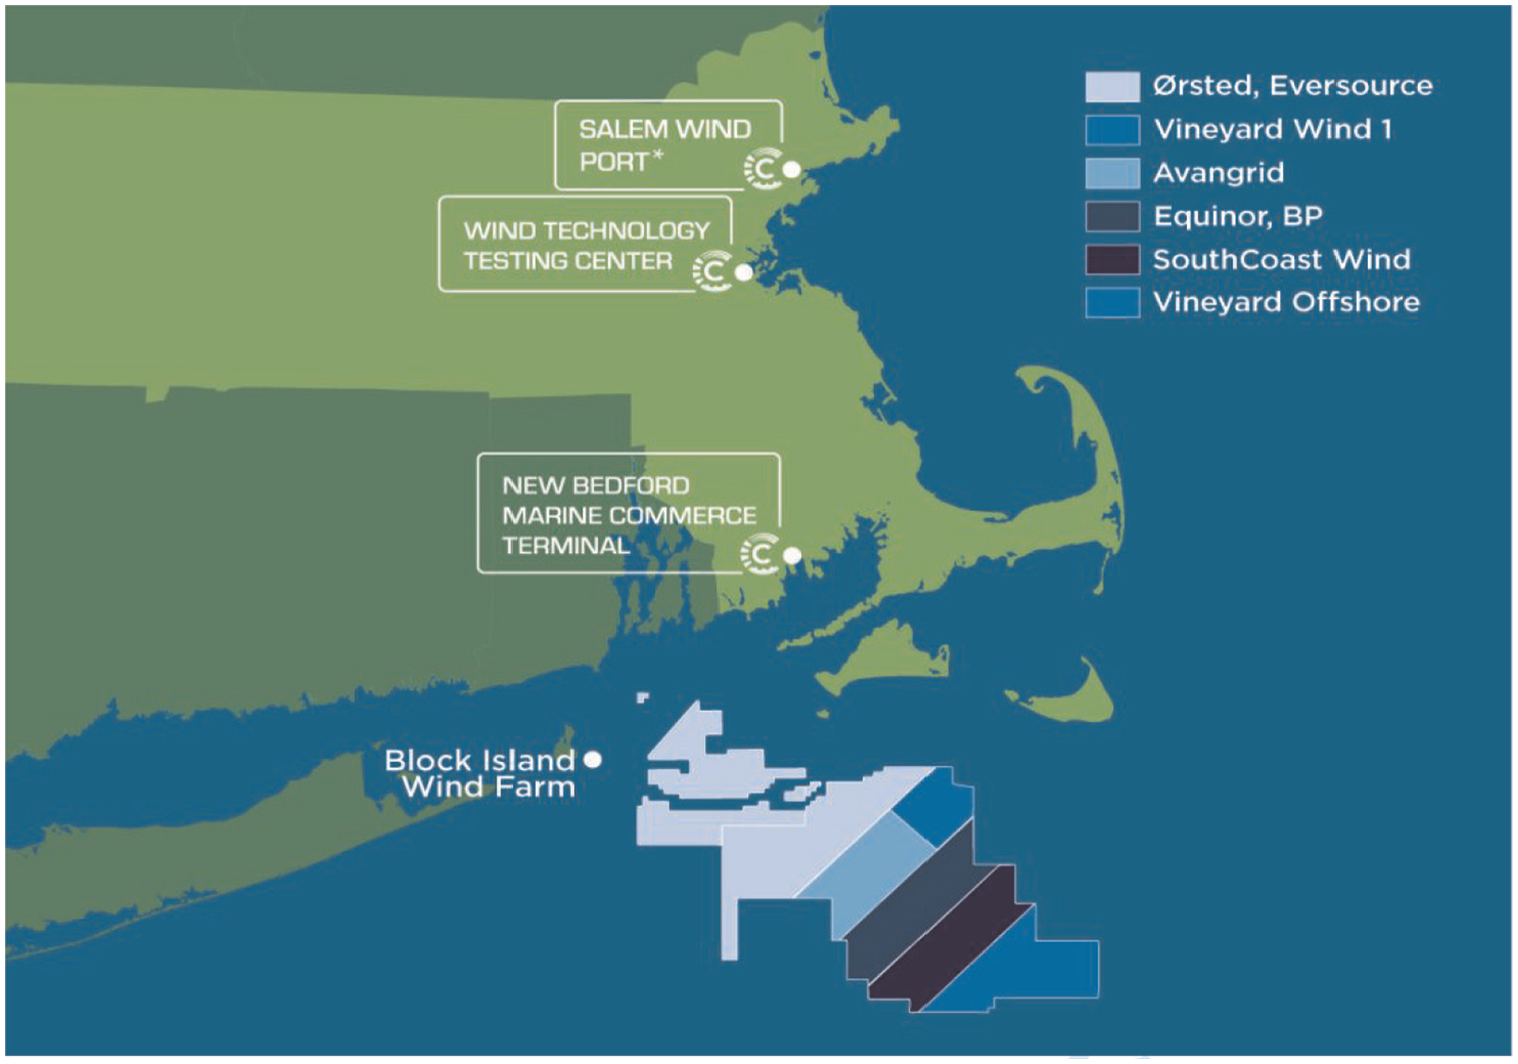
Planned Massachusetts offshore wind projects (Massachusetts Clean Energy Center, 2021).
Assuming an offshore wind capacity factor of 0.51, the procured 3,236 MW of offshore energy will provide an annual energy output of 14,457 GWh (14.457
Heat pump replacement of natural gas for the residential sector (data and methodology)
Natural gas is an important fuel for home heating in Massachusetts and globally. However, the shift from carbon-based fuels to renewable energy sources will require a change in the way Massachusetts homes are heated in the future. The use of heat pumps has gained popularity in recent years as they do not directly burn conventional fuels within a furnace or boiler such as natural gas or oil; instead they use electricity to transfer heat to either the home or outside depending on the season (U.S. Department of Energy, 2022a). The following analysis compares the energy usage of traditional natural gas furnaces and boilers with that of heat pumps and determines the equivalent amount of electrical energy required for wind turbines to satisfy current home heating requirements in Massachusetts.
Heat pump efficiency is measured differently than furnace or boiler efficiency. There are two important metrics that define heat pump efficiencies: SEER (Seasonal Energy Efficiency Rating) and HSPF (Heating Seasonal Performance Ratio). SEER compares the total amount of heat removed from a home during cooling with the electrical energy consumed by the heat pump during that time frame. Similarly, HSPF compares the total amount of heat added to the home during heating with the electrical energy consumed by the heat pump during that time frame (Carrier, 2022; Energy star, 2022a). Both ratings are measured in BTU/Wh. The DOE has set standards for minimum SEER and HSPF depending on geographic region. Figure 6 shows the minimum allowable SEER and HSPF in the northern part of the U.S. for 2023 and beyond and are 14 and 8.8, respectively (U.S. Energy Information Administration, 2022b). Since this specific analysis is concerned with home heating, only HSPF will be considered.
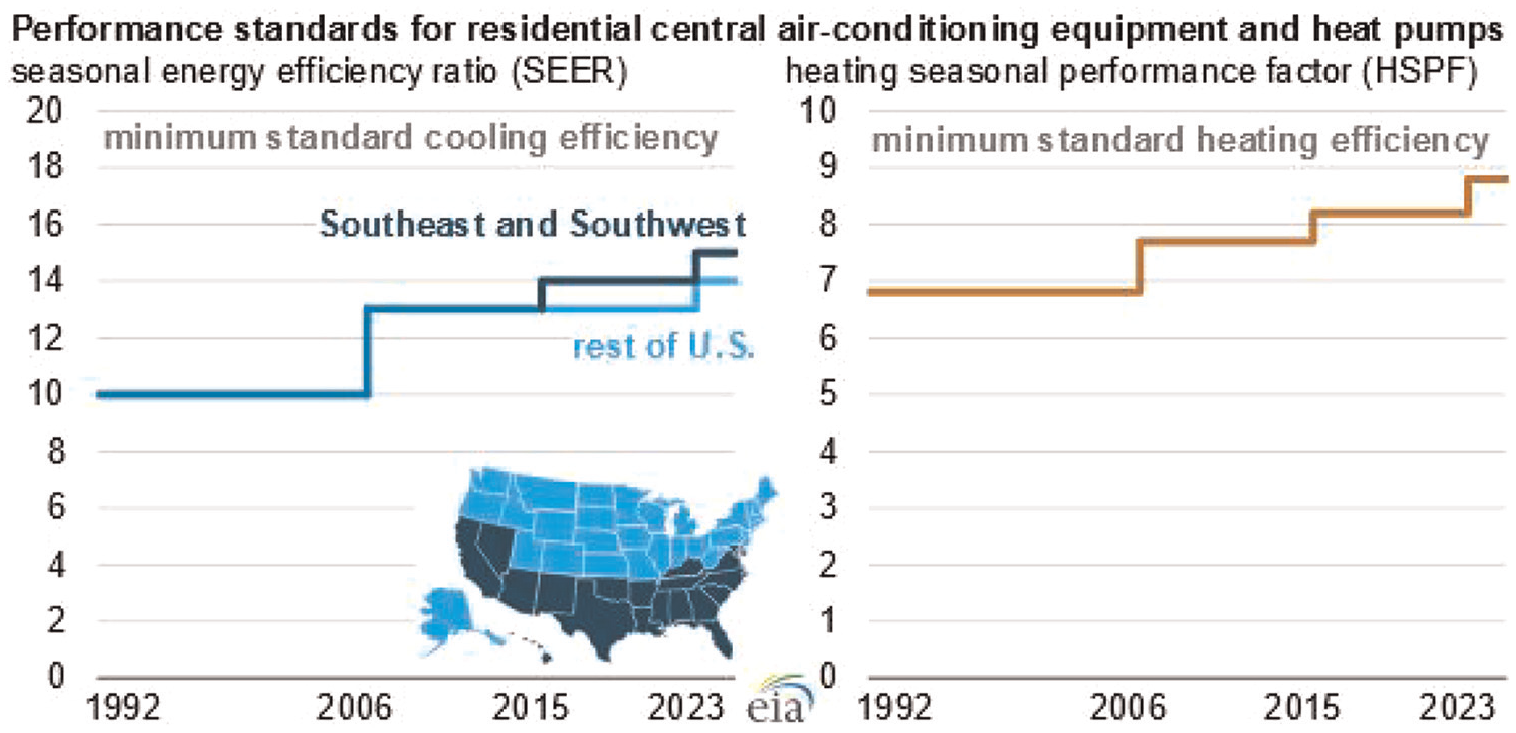
National performance requirements for heat pumps (U.S. Energy Information Administration, 2022b).
Heat pump replacement of natural gas for the residential sector (calculations)
The analysis considers the energy consumption of natural gas within the residential sector only in the state of Massachusetts. Assumptions that were previously made for the natural gas section of this paper pertaining to wind turbines are made here, in addition to the following:
(1) All natural gas consumed by the residential sector is used for home heating.
(2) The average efficiency of a natural gas furnace or boiler is 95.7% (Energy star, 2022b).
(3) Only the most common heat pumps are considered: ducted air-source heat pumps (U.S. Department of Energy, 2022b).
(4) The average HSPF of a heat pump is 8.8.
(5) Electrical power transmission losses between the wind turbines and homes are not considered.
The natural gas consumption for the residential sector is predominantly used for home heating and follows the values specified in Figure 6. Therefore, the assumption is made that all natural gas for residences is used for home heating (Assumption 1). The average efficiency of natural gas furnaces and average HSPF of heat pumps are taken from the best available data on current technology, as well as the most common kind of heat pump used in residences (Assumptions 2–4). Use of other technology at different efficiencies would affect the results of the study. Including the losses introduced by power transmission would also affect the results, but due to the complex nature of the power transmission network (e.g. AC or DC, transmission length, voltage levels, region, etc.) those losses are not considered within this analysis. These electrical power losses may be on order of ∼6% (Oak Ridge National Laboratory, 2015) and therefore the number of wind turbines needed to supply the electrical power for the heat pumps is likely to be underestimated by this analysis. However, electrical power transmission losses would also affect the gross energy needed to power electrolyzers depending on where they are located relative to wind turbines. Since the transmission distances for the heat pumps and electrolyzers are not known, the electrical transmission losses are neglected (Assumption 5).
In 2020 Massachusetts homes consumed about

If natural gas furnaces or boilers are replaced with heat pumps, those heat pumps would need to generate the equivalent amount of thermal energy of

The amount of electrical energy needed for heat pumps to deliver the equivalent thermal energy can be found using this efficiency.

The same wind turbine assumptions are made from the previous analysis and thereby the number of wind turbines needed to electrify the residential heating sector using heat pumps is determined.
Onshore:

Offshore:

Therefore, approximately 959 onshore wind turbines or 227 offshore wind turbines are needed to produce the amount of electricity necessary to replace natural gas furnaces or boilers with heat pumps in the residential sector for Massachusetts.
Electric vehicles replacement of gasoline vehicles (data and methodology)
Consumption of gasoline has been critical for transportation and is an important source of CO2 emissions. In 2020, there were over 2 million passenger vehicles in Massachusetts (U.S. Department of Transportation, 2020). Most passenger vehicles today rely on gasoline as opposed to natural gas or battery-stored electricity. The combustion of fossil fuels in the transportation sector in Massachusetts accounted for 43% of state-wide GHG emissions in 2019 (MassDEP Emissions Inventories, 2022). Passenger vehicles (cars, sport utility vehicles, and small trucks) were the source of 58% of the transportation sector’s GHG emissions in 2017 (Transportation Sector Report, 2020). To meet Massachusetts’ goal of achieving net-zero greenhouse gas emissions by the year 2050 it will be necessary to transform how energy is utilized for the transportation sector and identify the amount of electricity needed to replace gasoline and electrify motor vehicles. Therefore, it is worth analyzing the number of wind turbines necessary to provide the equivalent electrical energy needed for electric vehicles (EVs) that is commensurate to the existing gasoline consumption and current driving habits in Massachusetts.
The amount of electrical energy required to replace gasoline vehicles is dependent on numerous variables and assumptions. Therefore two different approaches are used to estimate the required energy required for EVs. The first approach considers the number of gasoline-powered passenger vehicles in Massachusetts, their average thermal efficiency, and how much energy they require based on the energy content of gasoline. Those numbers are then used to draw a comparison to the average efficiency of EVs. The second approach considers the yearly number of miles driven by passenger vehicles in Massachusetts as well as the average kWh/mile value for the most recent class of EVs. Similar assumptions that were previously made for the natural gas section of this paper pertaining to wind turbines are also made here. For both approaches, electrical power transmission is assumed to be lossless between the wind turbines and EVs’ charging stations. Both of these different analyses are shown to produce similar estimates.
Electric vehicles replacement of gasoline vehicles (calculations)
Electric vehicle approach #1
The first approach is based on the gasoline consumption in the state of Massachusetts used for passenger vehicles. The following assumptions are made:
(1) Passenger vehicles account for 92% of the gasoline consumption (U.S. Energy Information Administration, 2022c).
(2) The average efficiency of a gasoline engine is 20.5% (U.S. Department of Energy, 2022c).
(3) The average roundtrip (charge & discharge) efficiency of an EV is 89%, including regenerative braking (U.S. Department of Energy, 2022d).
Gasoline consumption estimates as well as the average efficiencies of both gasoline engine vehicles and electric vehicles are based on the best available data for each type of vehicle (Assumptions 1–3). It should be noted that in the future, changes in the assumed gasoline consumption behavior or improvements in energy efficiency will affect the results of the analysis described below and will reduce the number of wind turbine required for gasoline powered automobiles or EV transportation.
In 2021 the U.S. consumed approximately 350,567,100 gal of motor gasoline daily (U.S. Energy Information Administration, 2021b). Of that total, Massachusetts consumed approximately 5785,000 gal daily (U.S. Energy Information Administration, 2021b). However, only about 92% of gasoline is used for passenger vehicles. Therefore in 1 year, the total consumption is

Using the lower heating value (LHV) of gasoline on a volume basis (U.S. Department of Energy Office of Energy Efficiency & Renewable Energy, 2022a) as well as the efficiency of gasoline engines, the total amount of mechanical energy used by the passenger transportation sector in 2021 was

It is appropriate to use the lower heating value of gasoline because the combustion products are released into the environment. None of the water vapor is being condensed back to the pre-combustion state where that heat could be utilized (U.S. Department of Energy Office of Energy Efficiency & Renewable Energy, 2022a). If gasoline vehicles are replaced with EVs, those electrified vehicles would need to generate an equivalent amount of mechanical energy. However, since EVs’ have an efficiency of ∼89%, the amount of electrical energy needs to factor this in. The amount of electrical energy needed for EVs can be found using this efficiency.

The same wind turbine assumptions are made from the previous analysis.
Onshore:

Offshore:

According to the first approach, 1,179 onshore wind turbines or 280 offshore wind turbines would be needed to produce the amount of electricity necessary to replace gasoline powered automobiles in the passenger transportation sector for Massachusetts.
Electric vehicle approach #2
The second approach considers the miles driven by passenger EVs and the average amount of energy needed to drive per mile. The following assumptions are made:
(1) The total vehicle miles driven in 1 year are all considered to be done by passenger EVs.
(2) The average energy required to drive 1 mi is 0.251 kWh (U.S. Department of Energy Office of Energy Efficiency & Renewable Energy, 2022b).
The total number of miles driven and the average energy required to drive 1 mi are based on the best data currently available (Assumptions 1–2).
In 2019 Massachusetts drivers drove approximately 64,890 million miles (U.S. Department of Transportation, 2019). If all passenger vehicles are replaced by EVs, the approximate annual energy needed to supply all EVs can be calculated using recent EV data (U.S. Department of Energy Office of Energy Efficiency & Renewable Energy, 2022b). An average of the current 10 best EV efficiencies is taken as a baseline.

The same wind turbine assumptions are made from the previous analysis.
Onshore:

Offshore:

According to the second approach, 1284 onshore wind turbines or 304 offshore wind turbines are needed to produce the amount of electricity necessary to replace gasoline powered automobiles in the passenger transportation sector for Massachusetts.
If the results from the first and second approaches are averaged, the results indicate that 1,232 onshore wind turbines or 292 offshore wind turbines would be needed to produce the amount of electricity necessary to replace gasoline powered automobiles in the passenger transportation sector for Massachusetts.
Analysis
Hydrogen and the electrification of vehicles are both being presented as having the potential to significantly reduce Massachusetts’ reliance on carbon intensive fuels such as natural gas and gasoline to achieve net-zero emissions. However, the amount of dedicated renewable energy, and specifically wind energy, needed to power the electrolyzers required for the production of enough hydrogen to replace natural gas is staggering. Complete replacement of all natural gas used in Massachusetts with hydrogen would require the entire annual energy output of 10,750 onshore wind turbines or 2,545 offshore wind turbines. To replace gasoline vehicles with electric vehicles there would need to be 1,232 onshore wind turbines or 292 offshore wind turbines. The necessary electricity required for EVs is reasonably close to the current wind energy procurements in Massachusetts. In total 11,982 onshore wind turbines or 2,837 offshore wind turbines would be needed to replace natural gas with hydrogen and most of the gasoline used in Massachusetts, which is shown in Table 5. These numbers demonstrate the enormity of the challenge to install enough renewable clean energy resources to complete a transition to a new clean energy economy by mid-century.
Replacement of natural gas and gasoline with onshore and offshore wind turbines.

Massachusetts has committed to install 3,236 MW (∼3.2 GW) of offshore wind energy (Mass.gov, 2021), totaling an annual energy output of 14,457 GWh (14.457

Annual wind energy needed for conversion of natural gas and gasoline compared to current offshore wind procurements in Massachusetts (# of 12 MW offshore wind turbines shown in brackets).
For the Residential Sector, it is also possible to evaluate how different thermal heating options compare. To compare the energy resources needed for different heating options, the equivalent natural gas energy is compared to the (a) energy needed to replace methane with hydrogen and (b) energy required to deliver commensurate thermal heat energy using electric heat pumps. These results are summarized in Figure 8. The electricity needed to replace methane in the residential sector with electric heat pumps represents ∼84% of the current Massachusetts offshore wind procurements. If homes in Massachusetts were heated with green hydrogen produced from wind farms, approximately 3.5 times more electricity (or the number of wind turbines) would be needed compared to heating homes using heat pumps.
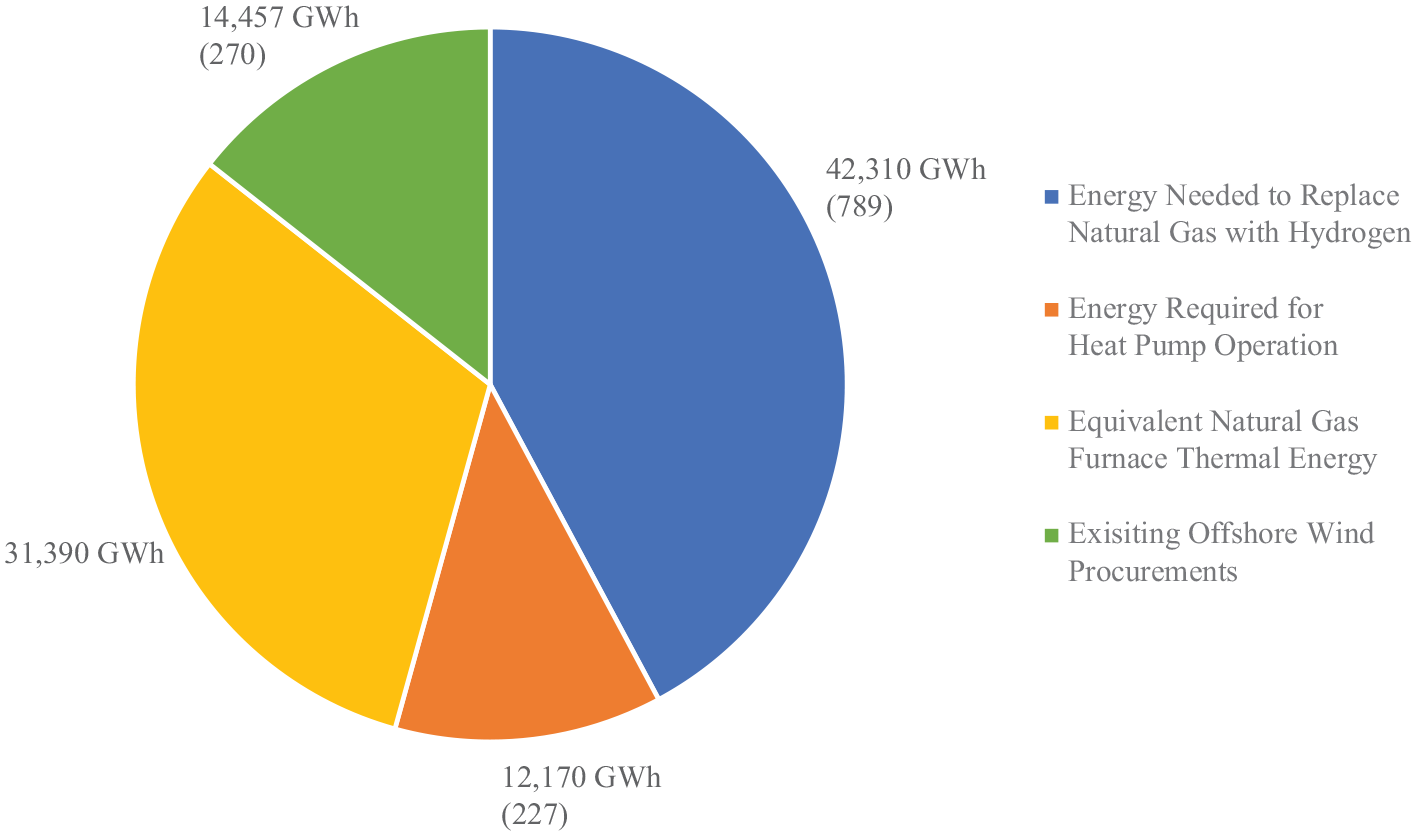
Annual wind energy needed for electric heat pumps and hydrogen generation compared to the 2020 natural gas residential sector consumption and the current offshore wind procurements in MA (# of 12 MW offshore wind turbines shown in brackets). The natural gas commercial, industrial, vehicle fuel, electric power, and distribution sectors are not included.
Massachusetts’ decarbonization roadmap indicates that a large decrease in greenhouse gas emissions will be required to meet the state’s climate goals, with the largest contributors being from buildings, electricity generation, and transportation. To reach the goal of deep decarbonization, an integrated and cross-sector approach will need to be taken (Executive Office of Energy and Environmental Affairs and The Cadmus Group, 2020). Current wind procurements cover just over 10% of the energy required to generate the equivalent amount of hydrogen needed to replace natural gas. The SouthCoast Wind project does not expect to complete the project and deliver clean energy until the end of the 2020s. The Vineyard Wind project is currently under construction with no posted date of completion. The Commonwealth Wind project is not expected to become operational until 2027 at the earliest. Considering the current development and installation progress as well as the legislative and logistical hurdles, it seems highly unlikely that the required offshore wind build out will be constructed to supply sufficient hydrogen to replace natural gas in the required timeframe. Additionally, the current procurements do not meet the needs for electrification of EVs and replacement of natural gas using hydrogen. Current procurements would need to be approximately 10 times larger to meet these demands. This estimate includes replacement of all natural gas sectors, however, it does not consider the replacement of other carbon intensive fuels for heating (e.g. wood, oil and propane), or trucking, aviation, or shipping that would require additional wind energy beyond these estimates. Likewise, the current procurements do not meet the needs for electrification of heat pumps (i.e. replacing natural gas in the Residential sector) and EVs by a factor of approximately two times. It’s important to note that this estimate does not consider the replacement of other carbon intensive fuels for heating, or trucking, aviation, shipping, or the other natural gas industry sectors (i.e. Commercial, Industrial, Vehicle Fuel, Electric Power, and Distribution) that would all require additional wind energy beyond these estimates. By these estimates, Massachusetts’ current rate of transition to renewable energy installed capacity is likely far too low to meet the state’s 2050 net-zero carbon emission goal.
A very recent study done in England predicts that it will take 4700 years to install enough onshore wind turbines to support the UK’s 2050 net-zero target due to current planning rules (Bloomberg, 2023). The results of that study are consistent with the findings in this paper. The results presented herein reveal that to achieve the climate emission goals within Massachusetts, additional wind and other renewable energy procurements need to be made in larger-scale and at a faster pace than what is currently planned.
Massachusetts cannot rely solely on decreasing emissions in the transportation and residential heating sectors and will need to stay committed in decreasing emissions in all sectors to achieve net-zero emissions by 2050. To help meet net-zero emissions Massachusetts will need to focus on improving efficiency for energy consuming devices and in renewable energy sources, diversification of renewable energy as well as importation of clean energy, and increasing the rate of renewable energy installations.
For decarbonization to take place there are numerous challenges to both the adoption of hydrogen and for electrification that should at least be mentioned. For example, production of green hydrogen is currently not cost competitive compared to gasoline or methane on an energy basis, transportation and storage can be a challenge, hydrogen causes embrittlement in some types of steel pipes and is susceptible to leaking, pipe replacement or retrofitting is not a straightforward process, and hydrogen suffers from public acceptance issues associated with its safety. A more detailed review of the challenges and opportunities of implementing hydrogen within Massachusetts can be found in (Hammerstrom et al., 2022a, 2022b). Likewise, electrification of our society faces other issues including: limited availability of renewable energy resources, the lack of charging stations for automobiles, an insufficient electrical transmission and distribution infrastructure to accommodate increased electrical load, permitting restrictions of new power lines, and public acceptance of heat pumps and EVs.
The data presented here are the best estimates of energy supply and demand data for Massachusetts. There are some uncertainties associated with the assumptions made within the analysis. On the supply side, assumptions such as capacity factors, number of turbines actually installed, and turbine reliability are assumed reasonable estimates. Unforeseen events and differences in turbine manufacturer specifications can slightly alter these figures and hence the results of this study. On the demand side, all data used is existing data from the state of Massachusetts or federal agencies such as the amount of natural gas consumed, amount of gasoline consumed, and number of cars on the road. Even though the analysis is dependent on assumed values and subject to some level of uncertainty, the outcomes and interpretation of the results are clear as presented in the following section.
Conclusion
An analysis was performed to estimate how many wind turbines would be needed to (1) generate the necessary green hydrogen required to replace the current natural gas consumption in Massachusetts and (2) replace the gasoline consumed by vehicles in Massachusetts with electricity for battery-electric vehicles. Comparisons are also made to identify the energy requirements for scenarios in which hydrogen or electric heat pumps are used to replace natural gas usage in furnaces and boilers. Although the analyses presented apply to Massachusetts, they are also applicable to other states, countries, and regions by simply changing the inputs and variables. The results are based on general assumptions and reveal that the number of wind turbines or renewable energy required for green hydrogen generation and replacement of natural gas is staggering. Based on the findings of this analysis, some enlightening conclusions can be drawn:
(1) Direct use of renewable electricity for heat and power should be a first consideration, when possible and economical, rather than using renewable energy to generate green hydrogen fuel or for storage because of round trip efficiency losses.
(2) In order to generate enough green hydrogen to replace natural gas consumption in Massachusetts by using wind turbines, the state will need to install approximately 94 offshore wind turbines (12 MW) per year through 2050.
(3) Massachusetts’ current rate of transition to renewable energy installed capacity is likely far too low to meet the state’s 2050 net-zero carbon emission goal. To achieve the climate emission goals within Massachusetts, additional wind and other renewable energy procurements need to be made in larger-scale and at a faster pace than what is currently planned.
(4) It is likely that Massachusetts will need to rely on and/or import renewable energy (wind, solar, and hydro power) from other states and Canada to achieve net-zero carbon emission goals by 2050. Achieving net-zero emissions will likely require a multifaceted energy approach beyond just offshore wind energy.
(5) To achieve net-zero carbon goals more rapidly, technological advances are needed to improve hydrogen production efficiency and utilization, battery and/or energy storage efficiency, as well as wind turbine capacity factors and efficiency.
(6) Because of intermittency and to ensure grid resiliency, the number of wind turbines will likely need to be larger than the numbers listed in the preceding tables so that a safety factor can be included. Large-scale energy storage will likely be needed to supplement energy from wind turbines during times of peak loads (e.g. during cold snaps and heat waves).
(7) The number of wind turbines listed in the preceding tables could be reduced by expanding the adoption of other renewables (i.e. solar, hydro power, and net-zero biofuels) and increasing efficiency across all energy sectors. Reduction of energy consumption, through improvements in renewable energy efficiency within the state, would help to expedite achievement of net-zero carbon goals.
(8) The natural gas or hydrogen quantities, and resulting number of wind turbines needed for the state, could be reduced if the thermal heating sector were electrified by using heat pumps instead of burning natural gas, propane, oil, or even hydrogen where possible because of efficiency improvements.
(9) If all gasoline powered vehicles were electrified and natural gas consumption was replaced via electrification, the number of renewable power sources (e.g. wind turbines) and the amount of electricity would have to be significantly increased well beyond the existing wind energy procurements and the electrical grid would need to be greatly bolstered.
Footnotes
Declaration of conflicting interests
The author(s) declared no potential conflicts of interest with respect to the research, authorship, and/or publication of this article.
Funding
The author(s) disclosed receipt of the following financial support for the research, authorship, and/or publication of this article: This material is based upon work supported partly by the National Science Foundation under Award Number 1916715, Phase II IUCRC at UMass Lowell: Center for Wind Energy Science, Technology and Research (WindSTAR) and the Associated Industries of Massachusetts (AIM) Foundation. Any opinions, findings, and conclusions or recommendations expressed in this material are those of the authors and do not necessarily reflect the views of the NSF or AIM Foundation.