
Abstract
This study presents the optimization of a small horizontal axis wind turbine blade at a low wind speed of 6 m/s. A MATLAB code employing Blade Element Momentum Theory (BEMT) was developed to optimize the chord length and twist angle. The optimized design was further analyzed and validated using QBlade software and ANSYS® 2022R1. The study considered two airfoils SG6041 and NACA4711 under Reynolds numbers of 1,000,000 and 100,000, respectively. The blades SG6041 and NACA4711 were divided into 10 and 20 segments for detailed analysis, resulting in power coefficients of 0.455 for SG6041 and 0.521 for NACA4711. The consistent results across MATLAB, QBlade, and ANSYS confirm the accuracy of the BEMT-based optimization process. The rotor achieved optimal performance at Tip speed ratios of 8.5 for SG6041 and 7.5 for NACA4711. Results demonstrated a high correlation between the power coefficients for QBlade and CFD simulations, with only a 1% variation for NACA4711 and 1.78% for SG6041. This study highlights a systematic approach for small wind turbine blade optimization, particularly at low wind speeds. Hence, it can be deemed that this approach is among the most crucial techniques for constructing and optimizing the blades and rotors of micro-wind turbines.
Keywords
Introduction
Increasing awareness regarding our requirements and priorities could lead to the exploration of alternative energy sources, such as “the wind.” Wind energy possesses a greater abundance than other forms of renewable energy. Furthermore, wind energy is widely recognized as one of the most rapidly expanding renewable sources within the energy sector, owing to its long and significant history of application (Koç et al., 2016a). The wind turbine blades are the most essential part of the process of converting wind energy. Their primary function is to convert the kinetic energy of the wind into mechanical energy until its conversion by generators into electrical energy (Chaudhuri et al., 2022). Optimal energy extraction from the wind is based on the blade’s aerodynamic design. Blade geometry optimization parameters are crucial because, once optimized, smaller blades would produce significantly more power than larger blades that are less optimized (Kale and Varma, 2014; Singh and Ahmed, 2013)..
Many research papers on the design of micro wind turbines (Chaudhary and Roy, 2015; Singh and Ahmed, 2013) and performance optimization (Hassanzadeh et al., 2016; Scappatici et al., 2016) have been published. Chaudhary and Roy (Chaudhary and Roy, 2015) conducted the design and performance optimization of a horizontal axis WT with a compact footprint. The investigation focused on the airfoil SG6043, and the optimization process was executed by adjusting the chord and twist distributions of the blade. Murshed et al. (2019) assert that the turbine blades were designed to apply wind energy through the operation of lift-and-drag forces. The ability of this phenomenon to occur is ascribed to the airfoil configuration of the turbine blades, which bears resemblance to the aerodynamic design employed in aircraft to produce lift. By converting wind energy into turbine blades, two aerodynamic forces are generated. The motion of an object in a fluid medium is influenced by two fundamental forces: the drag force

The functional correlation between the mechanical power obtained from a wind turbine and the corresponding wind speed can be visually represented through a graphical representation commonly referred to as a power curve (Geng and Yang, 2014). Figure 1 is an idealized version of a power curve for a wind turbine. The parameters that define the operational boundaries of a wind turbine are delineated by the cut-in and cut-out velocities.

The power curve of a wind turbine in an idealized method (Geng and Yang, 2014).
Some of the studies such as Maizi et al. (2018) employed computational fluid dynamics (CFD) to determine the optimal Tip Speed Ratio (TSR) for the Horizontal Axis Wind Turbine (HAWT) Nrel. Kaya et al. (2018) applied computational fluid dynamics (CFD) to optimize the aerodynamic performance of a 0.9 m HAWT blade. Parezanovic et al. (2006) used Xfoil software and CFD to optimize the blade airfoil of a wind turbine by selecting three distinct varieties. The researchers computed and contrasted the lift and drag coefficients in their investigation with the empirical findings. On the other hand, the QBlade software was applied in numerous scholarly articles (Altmimi et al., 2022) to optimize and analyzes the performance of small horizontal axis wind turbines. The software analyzes the wind turbine blades using the Blade Element Momentum Theory (BEM). This is accomplished by calculating the lift and drag coefficients, which are obtained by segmenting the blades into ten ascending parts. A different approach was adopted by other scholars (Koç et al., 2016b) wherein they conducted a comparative analysis of Computational Fluid Dynamics (CFD), as opposed to Blade Element MomentuM (BEM), on a small-scale horizontal axis wind turbine.
From the literature mentioned previously, it is evident that the optimization methods were implemented using the CFD, Xfoil, and QBlade software, with an emphasis on adherence to the Betz limit. No optimization process has been conducted to our knowledge that utilizes a unique Matlab code as a reference in conjunction with QBlade software to devise an optimization strategy for achieving the highest possible
This study estimates the aerodynamic performance of a horizontal wind turbine with a 2 and 3.4 m rotor diameter for SG6041 and NACA4711 airfoils respectively using Matlab code, QBlade V0.963, and Ansys-Fluent 2022 R1. The turbine is initially designed and its aerodynamic performance is determined using the QBlade software under a General Public License. A 3D model of the turbine is created using Solidworks 2022. The aerodynamic performance is determined using Computational Fluid Dynamics (CFD) methods, particularly the Fluent commercial programmer. The power curve and torque curve of the turbine derived from the 3D CFD findings are compared with the results from QBlade. The above airfoils were selected for the construction of a compact horizontal-axis wind turbine intended for use in places with low wind speeds. To achieve rapid start-up, a high power coefficient, and optimal power production in low wind speed conditions, a wind speed of 6 m/s was selected as the designated wind speed, while a TSR of 7 was chosen for the design.
Design and analysis of wind turbine blade
The process of manufacturing a wind turbine blade includes, among its most complex and crucial stages, the design of the blade’s shape. To begin with, the selection of pitch-regulated turbines was predicated on the configuration of a solitary airfoil (SG6041) and NACA4711. These airfoils have been applied to micro-wind turbine blades and is well-established and tested. Numerous theories have been developed in order to forecast aerodynamic performance and determine the optimal chord length and twist angle distribution (Alaskari et al., 2019; Alkhabbaz et al., 2021). Betz devised the most basic representation of the ideal concept for the design of wind turbine blades (Gupta and Subbarao, 2021). To achieve the most efficient aerodynamic configuration of the blade, the blade element momentum theory (BEM) (Bai and Wang, 2016) was implemented. A new Matlab code is constructed in accordance with the BEM theory (Noronha and Krishna, 2020). Subsequently, all the parameters are transmitted to the QBlade program in order to determine the chord length, twist angle, and blade performance using the BEM approach. Then all the data is exported to an Excel sheet to build a 3D design as an IGES shape to prepare for analyses by Ansys fluent 2022R1. These program are applied to generate a new design featuring the optimal
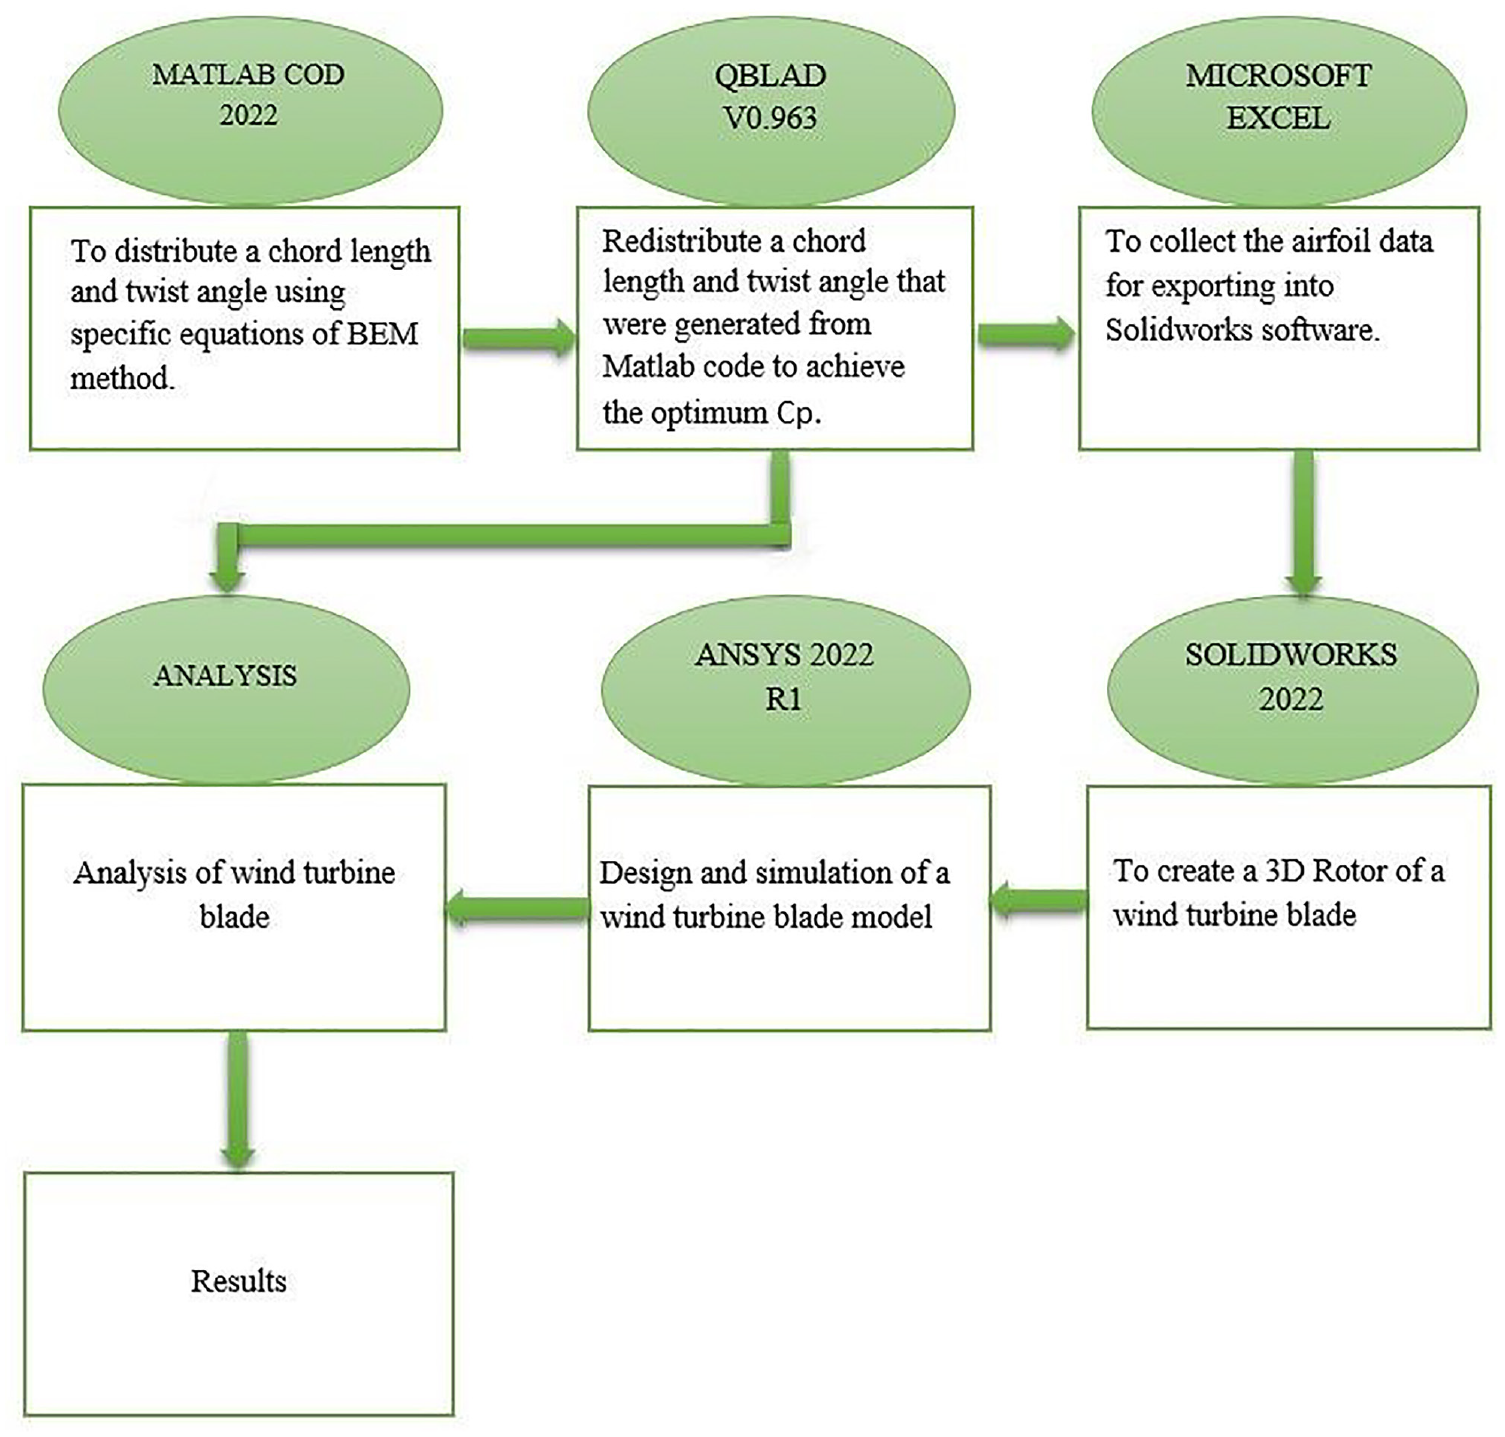
The primary procedures for optimizing small wind turbines.
The governing equations for optimizing the wind turbine blade
Based on the Blade Element Theory that evaluates the aerodynamic forces generated by an airfoil by describing the specific aerodynamic events occurring at each section of the blade. It is also used to calculate the aerodynamic coefficients at various sections along the blade (Abdullah et al., 2023), and then solve the equations through an iterative process.
The equation (1) provides the value of the wind turbine power output (PT).

It can be used to calculate the power coefficient, where
The equation (2) is applied to calculate the angular velocity, ω, of a rotor blade, taking into account the design wind speed, tip speed ratio, and rotor blade length.

The variable λ, are used to describe the tip speed ratio (TSR).
Equation (3) is used to determine the local TSR, denoted as λ, r, for each blade’s element. This equation takes into consideration the design TSR, blade length, and the local radius, in addition to the blade length.

Therefore, equation (4) provides the mathematical form for the Reynolds number (Re) of airflow over an airfoil.


The idea of blade element momentum (BEM) continues to be the fundamental analytical method that underpins the majority of wind turbine analysis codes. In this theory, two iterative variables are referred to as axial (a) and radial (a′) induction factors. Each of the variables can be defined in accordance with the requirements that are listed below (Umar et al., 2022).


The inflow angle is represented by

Where


Figure 3 illustrates the velocity component in the rotor’s plane and all the aerodynamic stresses for each blade element. Through the preliminary estimation of the axial (

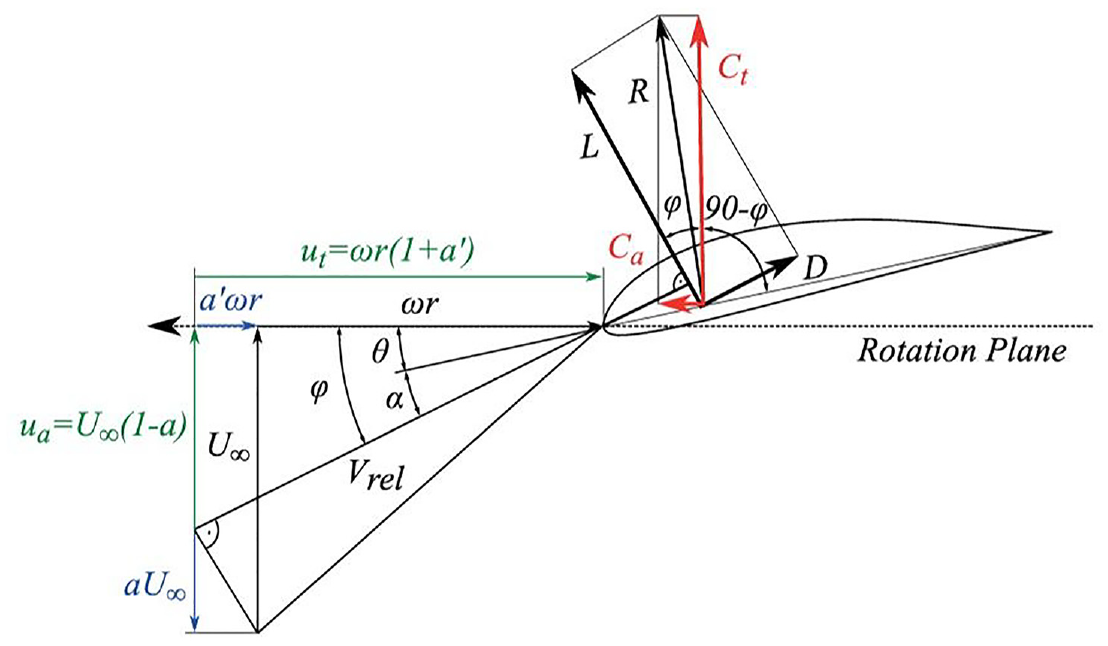
Analysis of blade geometry for a horizontal axis wind turbine (Mühle, 2018).
Calculate the angle of attack (α) between the airfoil chord line and wind speed using the following equation:

As a result, equations (13) and (14) were used to determine the best possible distribution of the chord length (c) and twist angle (θ) over the rotor blade span.


Prandtl devised a technique to estimate the impact of radial flow near the blade tip. This method is highly accurate for turbines with two or more blades operating at high tip speed ratio (TSR) (Okda, 2015).

When designing an ideal rotor, consideration is given to the effect of wake rotation on the blades. Wake rotation is factored into the blade shape optimization for an ideal rotor, with the exception of drag (

Blade analysis using Matlab code
A novel code was formulated utilizing MATLAB software, drawing inspiration from the Betz concept, in order to compute the chord length (
Redistribution of the chord length and twist angle
Below is a summary of the calculations for the optimal distribution of chord length and twist angle along the blade, following the outlined procedures:
Identify the various parameters of the airfoil, including the blade diameter (R), tip speed ratio (λ), and number of blades (B).
Select the aerodynamic conditions, such as angle of attack (α), when
Determine the local tip speed ratio
From the equation (5), determine the angle of relative wind (
Find the twist angle (θ) by using equation (13).
Determine the Airfoil’s Chord Distribution by applying the formula:

7. For the flow solution, it is essential to guess the initial value for the axial indicated factor (a) is set to 0, whereas the tangential indicated factor is set to
8. Break the blade into N segments, often ranging from 10 to 20. Apply the Blade Element Theory to approximate the geometry of the firth blade ((i firth element), which has a midway radius of
9. Find the updated values for a and a′ assuming the tip loss factor (F) equals one.
10. Through a systematic comparison of the current and previous values of a and a′, and by iterating the process until they reach the desired precision, the convergence of the values confirms the validity of the results based on established theory (BEMT).
Table 1 provides information about the characteristics of the rotor blades, NACA4711 and SG6041.
Specifications of the rotor blades.

NACA4711 airfoils
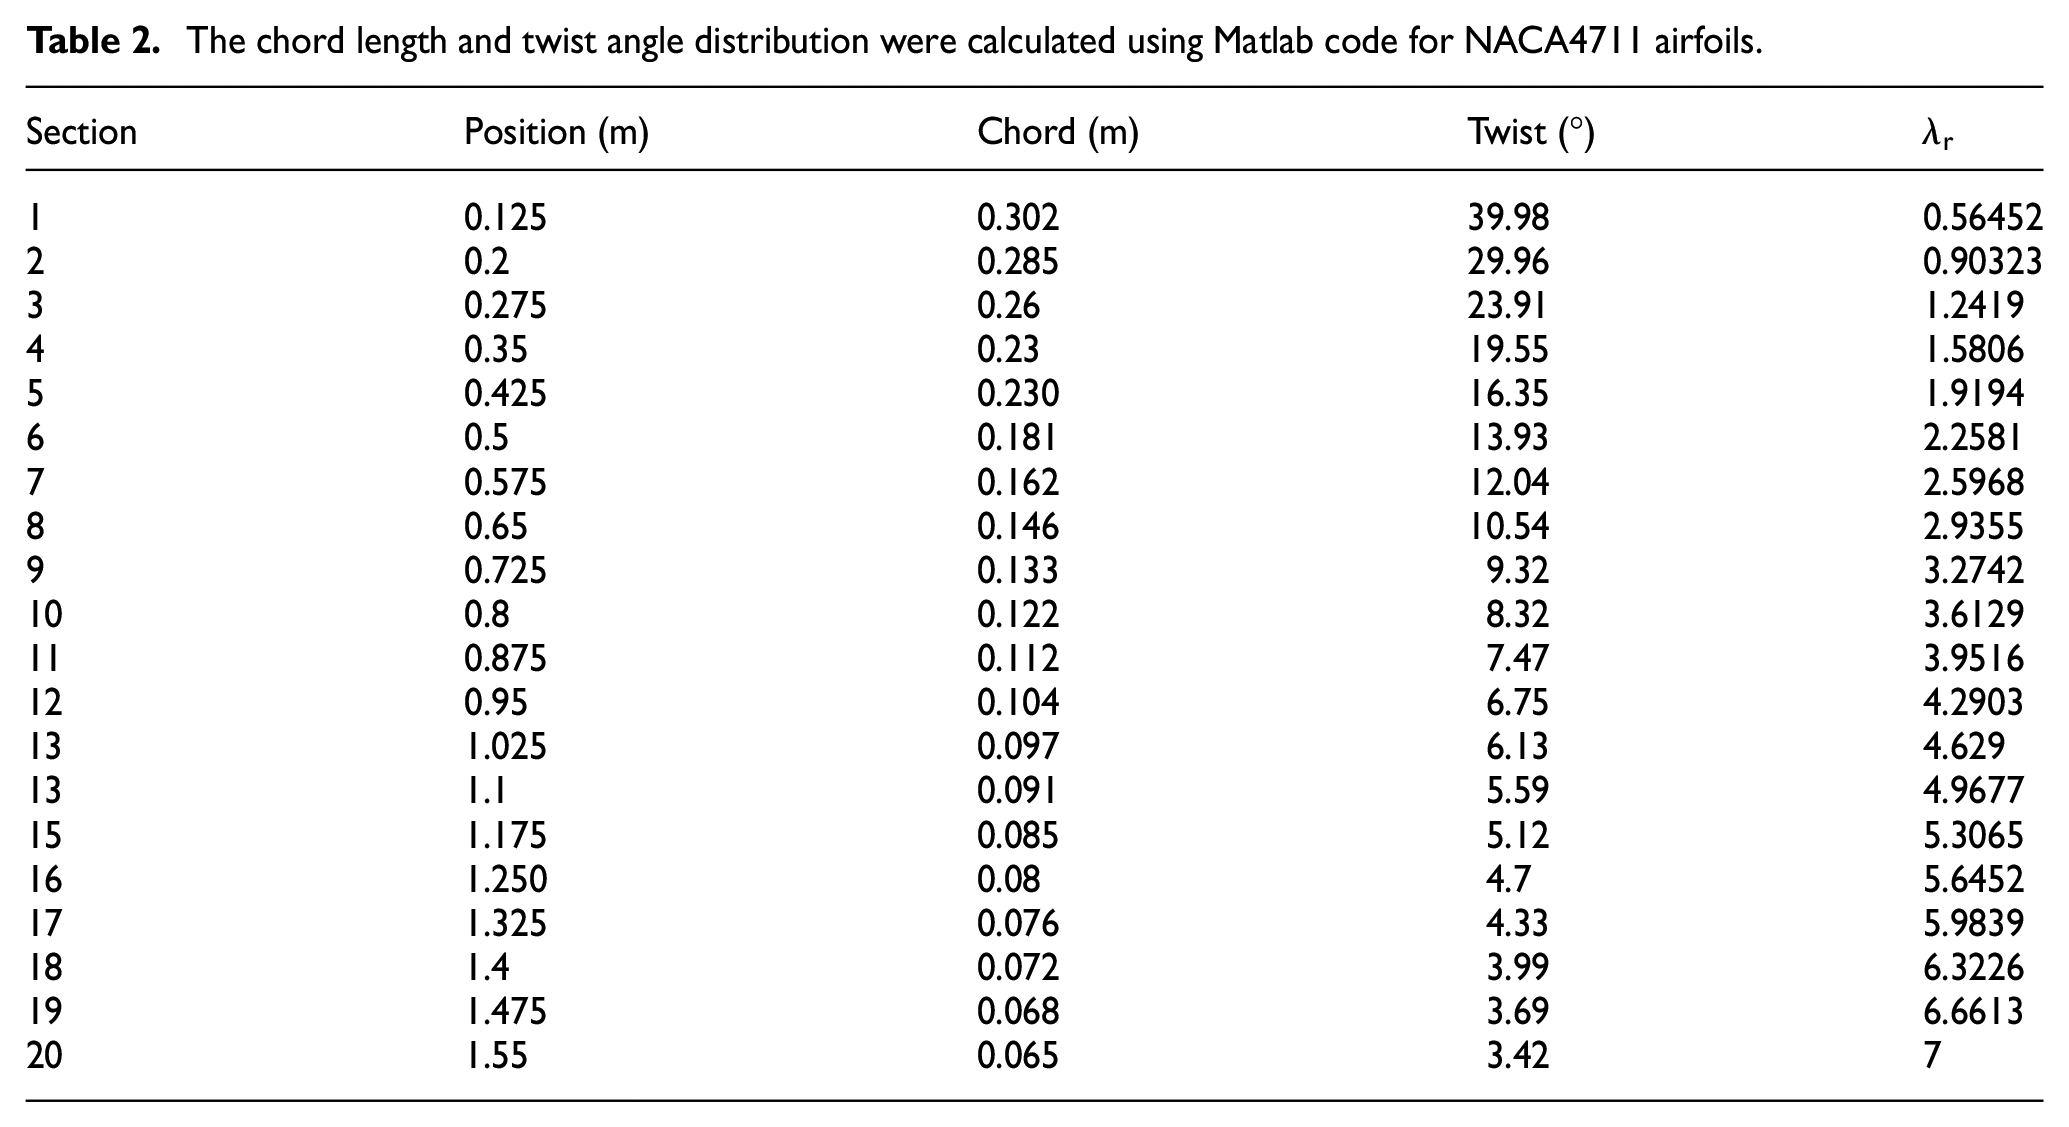
The primary objective of the wind turbine blade optimization procedure is to identify the most optimal design that will yield the highest power output. The (BEMT) was employed to determine the optimal dimensions of the blade, including the chord length and the twist angle. Typically, the design was started by selecting twenty equidistant parts. All of the parameters that have been optimized for the rotor blades of the wind turbine are listed in Table 2.
The chord length and twist angle distribution were calculated using Matlab code for NACA4711 airfoils.
SG6041 airfoil
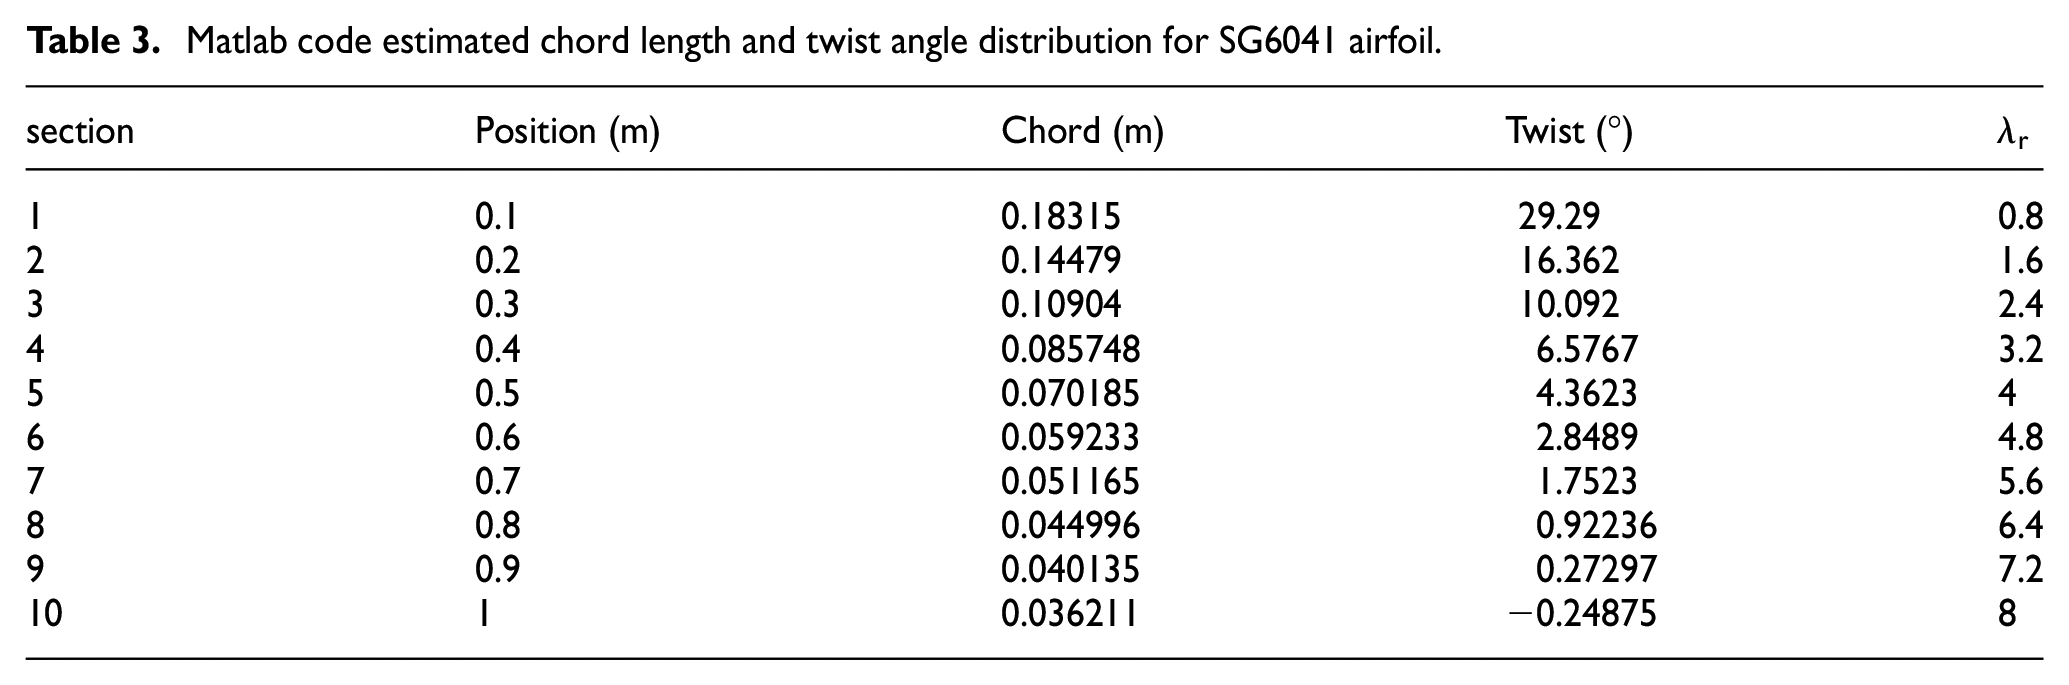
The Matlab code with a radius of 1 m is performed to design the three-dimensional blade with the optimum characteristics to represent the initial step for optimizing the wind turbine blade. Table 3 provides a comprehensive breakdown of the ten sections for the wind turbine blade using Matlab software.
Matlab code estimated chord length and twist angle distribution for SG6041 airfoil.
Blade analysis using QBlade software
The initial procedure involves converting the blade parameters, including chord length (c) and twist angle, which were obtained from Matlab code into the QBlade software. Subsequently, the software generates the virtual blade in accordance with the specified parameters. This approach produced the most optimum power coefficient value, even though the previous optimization of the blade.
NACA4711 airfoil
Twenty distinct segments for the 1.55-m-diameter wind turbine blade have been created. The primary phase of the procedure can be initiated at a distance of 0.075 m. According to the data presented in Figure 4, it can be observed that the blade sections ranging from 0 to 1.55 correspond to the root of the blade, with an angle of 26.1761°. In contrast, the remaining sections exhibit a gradual change in angle, ranging from 20.7396° to 2.46711°. This design allows each section to effectively face the wind direction, thereby optimizing the lifting force and achieving an ideal tip speed ratio (TSR) for the blade. Blade sections numbered 2 through 22 are responsible for using energy from the wind and transforming it into mechanical energy. Figure 5 demonstrates the comparison between the previous model and the enhanced wind turbine blades model utilizing the airfoil type (NACA4711). It illustrates the modifications made in the chord length and twist angle to achieve the ideal design of the wind turbine blade.

The optimized twist angle and chord length for NACA4711 using QBlade software.

The old rotor model (a), the rotor model with Matlab optimized (b), the rotor design with QBlade optimized (c).
The blades in Figure 5(b) and (c) were observed to be broader than blade a, particularly at the blade root. This is a result of the high chord length values that were a direct result of the smaller Tip Speed Ratio value. The blade becomes narrower from the tip to the root as the chord length distribution along the blade span increases.
SG6041 airfoil
The 1-m-diameter wind turbine blade is illustrated in Figure 6 with 10 distinct segments. The fundamental phase of the procedure can be initiated at a distance of 0.1 m.

The optimized twist angle and chord length for SG6041 using QBlade software.
A comparison is made between the previous design of a wind turbine blade and the optimized version, which utilizes the SG6041 airfoil type, as depicted in Figure 7. It is evident how improvements to the chord and twist angle were carefully made to achieve an optimal design. The outcomes generated by using QBlade exhibited a high level of resolution overall.

The old rotor model (a), the rotor model with Matlab optimized (b), and the rotor design with QBlade optimized (c).
Blade analysis using CFD (Ansys Fluent 2022 R1)
To carry out the computational fluid dynamics (CFD) and structural analysis of the small horizontal axis wind turbine, the methodology of this study included some important procedures.
Production of geometry.
Boundary conditions.
Mesh generation.
Pre-post-processing structural analysis.
Geometry and domain creation
The blade was created by exporting the three-dimensional coordinates of each part to a “.csv” file, using the resulting QBlade geometry as a basis. An Excel spreadsheet was utilized to generate comprehensive airfoil data for the purpose of exporting it to the subsequent stage. The blade’s 3-D surface modeling was conducted using SolidWorks based on the data supplied by Qblade v0.963 software. A 3D representation of the wind turbine rotor is illustrated in Figure 8 by using the lofting feature. The 3-D blade has been converted to the IGS format, a widely accepted file format for importing into ANSYS 2022 R1.

The geometry of the wind turbine blade before and after optimization process from top to bottom: (a) baseline NACA4711, (b) optimized NACA4711, (c) baseline SG6041, and (d) optimized SG6041airfoil.
Boundary conditions
The boundary conditions were defined with a velocity inlet set to 6 m/s for HAW. To simplify the computations, it was common to use a single blade in a 120° radial stream tube domain section with periodic faces to represent the three blades of the wind turbine model, which was symmetrical about its center of rotation.
Five times the length of the blade positioned upstream of the rotor blade as the velocity inlet and 10 times the blade length located downstream as the pressure outlet at atmospheric pressure (Gaheen et al., 2021).
The turbine’s rotational speed was set to 265 rpm for the NACA4711 airfoil and 450 rpm for the SG6041 airfoil. Figure 9 depicts the rotor blade domain for the wind turbine before and after optimization method.

Rotor blade domain and boundary conditions before and after optimization process: (a) baseline NACA4711, (b) optimized NACA4711, (c) baseline SG6041, and (d) optimized SG6041 airfoil.
Mesh generation
The generation of a grid is a time-consuming aspect of computational fluid dynamics (CFD) simulation, and the quality of the grid directly impacts the analysis. Mesh can be structured, unstructured, or hybrid. To achieve acceptable results, fine meshing of the flow domain is essential. This study focuses on velocity, velocity streamlines, pressure distribution, and torque, requiring fine meshing near blades. Regions away from the blade require coarser cells to generate a high number of nodes and cells, requiring higher computational resources. Local mesh parameters like tip section, leading-edge trailing edge, blade surface, match control, and inflation are used to enhance the accuracy and quality of the mesh, especially in the area surrounding the blade.
The default meshes supplied by ANSYS CFD have been employed in this investigation, and the meshing strategy has been modified to guarantee localized size control in the vicinity of various engineering entities. By dividing the product of the dimensionless wall distance and the friction velocity by the kinematic viscosity of the fluid, the value of y+ is less than 5 for both airfoils (old and new). The mesh used in the CFD modeling and distribution of blade y+ is illustrated in Figure 10. In the vicinity of walls, the value of y+ can be used to direct the choice of the optimal mesh resolution. It is critical to mention that the geometry employed in this analysis has been optimized in order to achieve a trade-off between precision and computational speed. Fourteen layers of inflation were applied in this analysis. Upon numerous iterations of meshing, the geometry was acquired from many meshes. The geometry of NACA4711 and SG6041airfoils before and after optimization process have been refined to a mesh consisting of approximately (a) 12,844,649, (b) 9,602,005, (c)13,782,038 and (d) 6,241,402 elements, respectively. The initial layer has a height of 1 × 10⁻⁴ m, a growth rate of 1.15, and 14 inflation layers. The density and kinematic viscosity of air were determined to be 1.23 kg/m3 and 1.785 × 10⁻⁵ kg/m-s, respectively. This is regarded as exceptionally excellent for generating a solution with adequate precision. Hence, it generated a high-quality mesh before the setup process with a focus on ensuring adequate resolution near the blade tips. Figure 11 shows the mesh distribution over the blade surface, highlighting the refinement applied near critical aerodynamic features.

3D domain with several geometric faces: (a) baseline NACA4711, (b) optimized NACA4711, (c) baseline SG6041, and (d) optimized SG6041airfoil.

Mesh distribution and refinement around the blade before and after optimization process: (a) baseline NACA4711, (b) optimized NACA4711, (c) baseline SG6041, and (d) optimized SG6041 airfoil.
A numerical simulation has been carried out to assess the performance of the blades. The Ansys Fluent version 2022 R1 software was applied, employing the turbulence model K-ε SST and incorporating a curvature correction for the Reynolds-average Navier-Stokes (RANS) equation in the CFD analysis. Furthermore, second-order upwind space-based discretization has been implemented.
Result and discussion
Matlab result
NACA4711 airfoil
The chord length at the base of the blade begins at 0.302 m and decreases to 0.065 m. The bottom section of the blade generates a lower amount of power compared to the middle and upper sections. However, it is responsible for supplying the necessary torque to initiate the turbine’s operation. Figure 12(a) illustrates the Chord length distribution analysis along the wind turbine blade.

Chord length (a) and Twist angle (b) distribution analysis using Matlab code for NACA4711.
The twist angle of an airfoil reaches a maximum value of 39.98° at the wall and starts to decrease as it arrives at the tip, where it reaches 3.42°. This distribution is non-linear as illustrated in Figure 12(b). The reduction in twist variation is due to the significant difference in local speed between the slow near the root and rapid near the tip.
SG6041 airfoil
The chord and twist angle distribution along the wind turbine blade is shown in Figure 13(a) and (b), which were generated using the Matlab software. The twist angle of an airfoil peaks at 29.29° at the wall and decreases to −0.24875° at the tip. Also, the decreased variance in twist can be explained by the fact that the local velocity is very slow around the base and exceedingly high toward the tip region. Furthermore, the chord length at the blade base is 0.302 m and reduces to 0.065 m. This occurs because the bottom section of the blade creates a lower amount of power in contrast to the middle and top regions of the blade; yet, it does supply the necessary torque that is required to start the turbine.

Chord length (a) and Twist angle (b) distribution analysis using Matlab code for (SG6041 airfoil).
QBlade results
NACA4711 airfoil
The power coefficient (
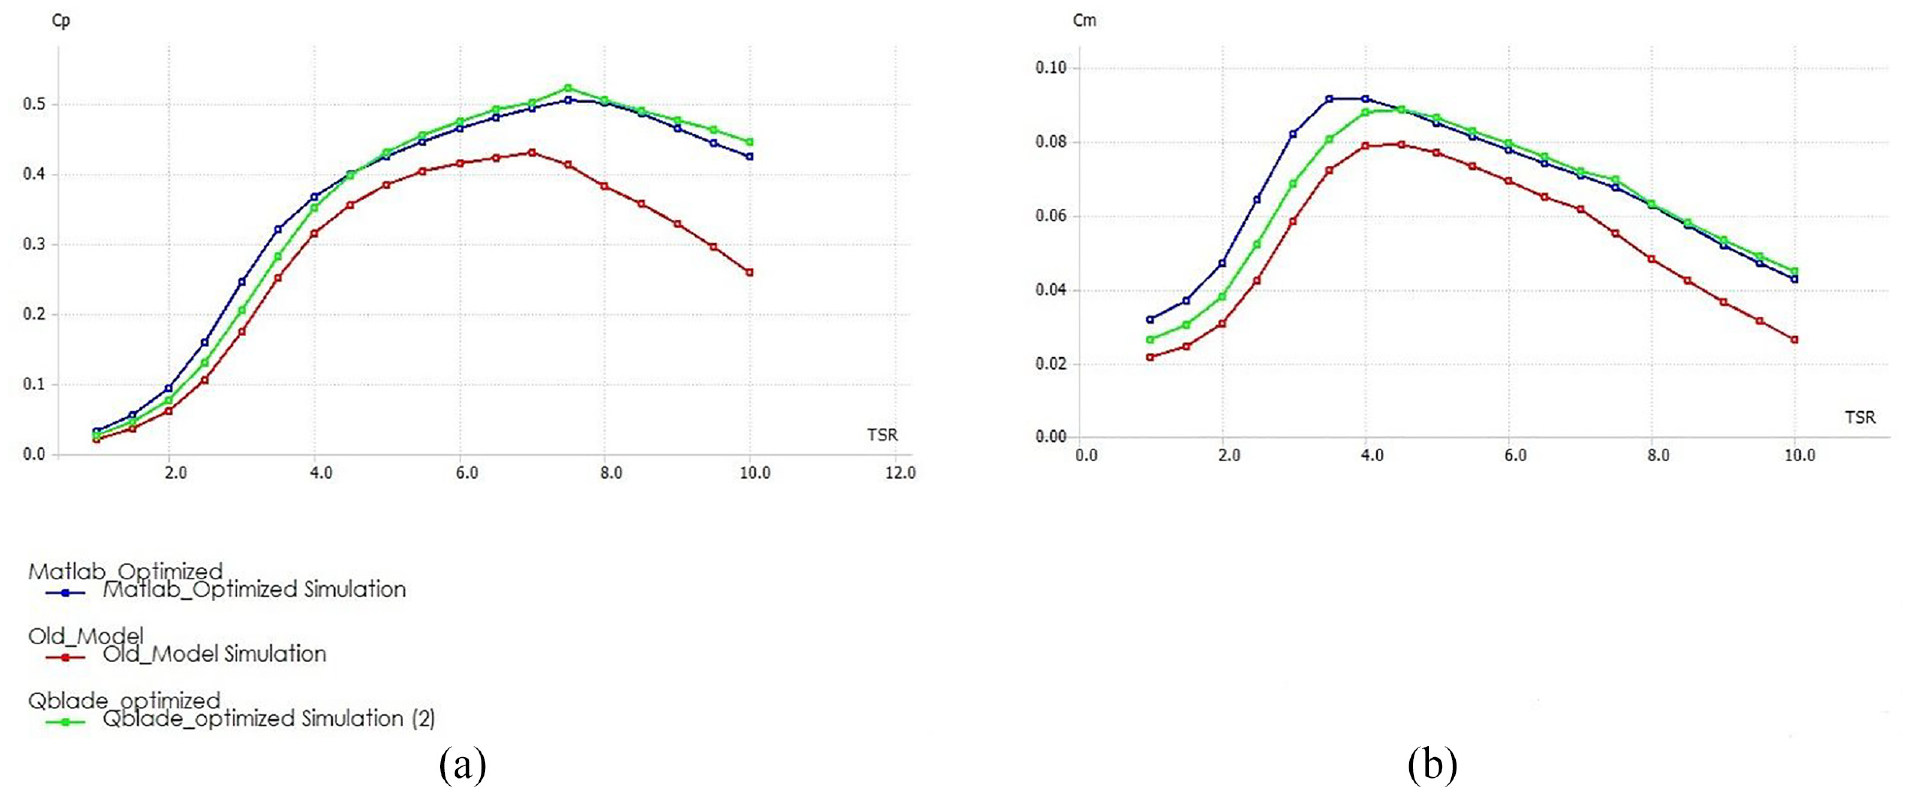
Comparative analysis between QBlade and MATLAB for the power coefficient (a) and Torque coefficient (b) with old model.
It is clear that the optimized thrust coefficient was greater than the without optimized one at low wind speeds and a low tip-speed ratio TSR. Therefore, achieving this higher
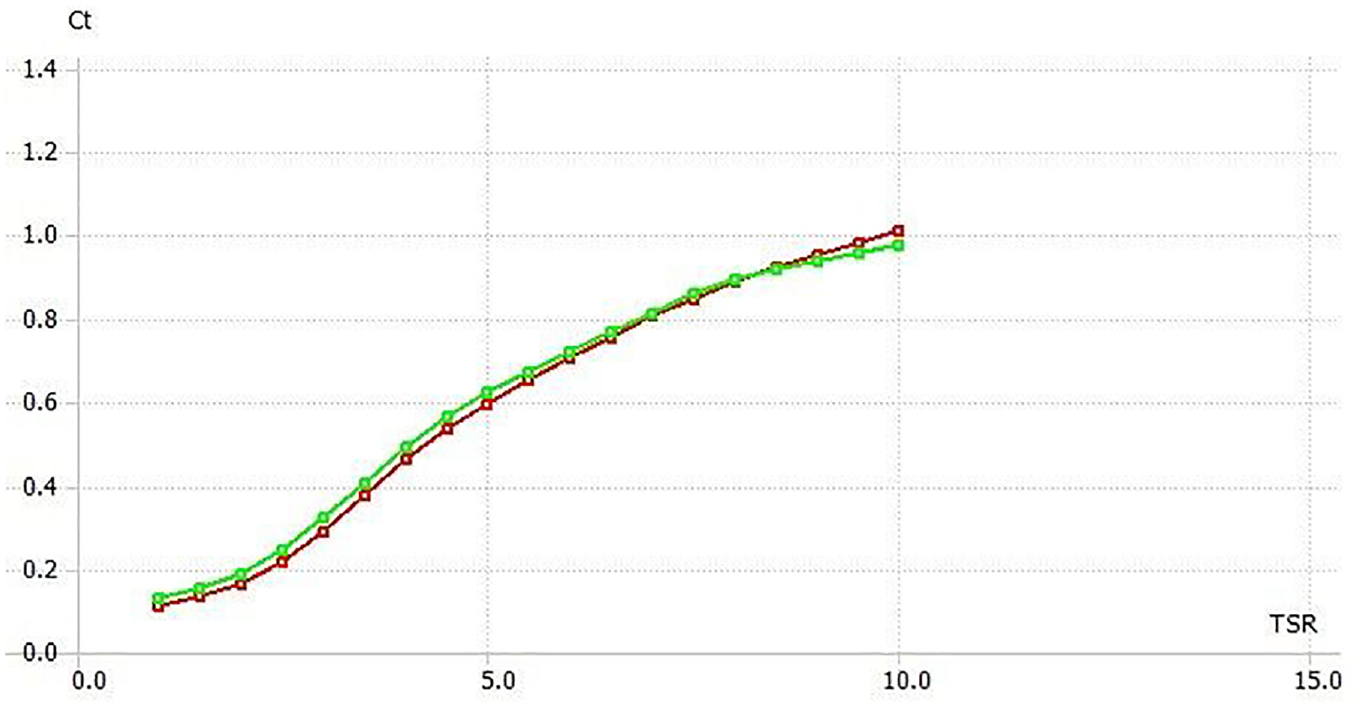
Comparative analysis between the old model and optimized design for the Ct curve (NACA4711 airfoil).
The power coefficient (
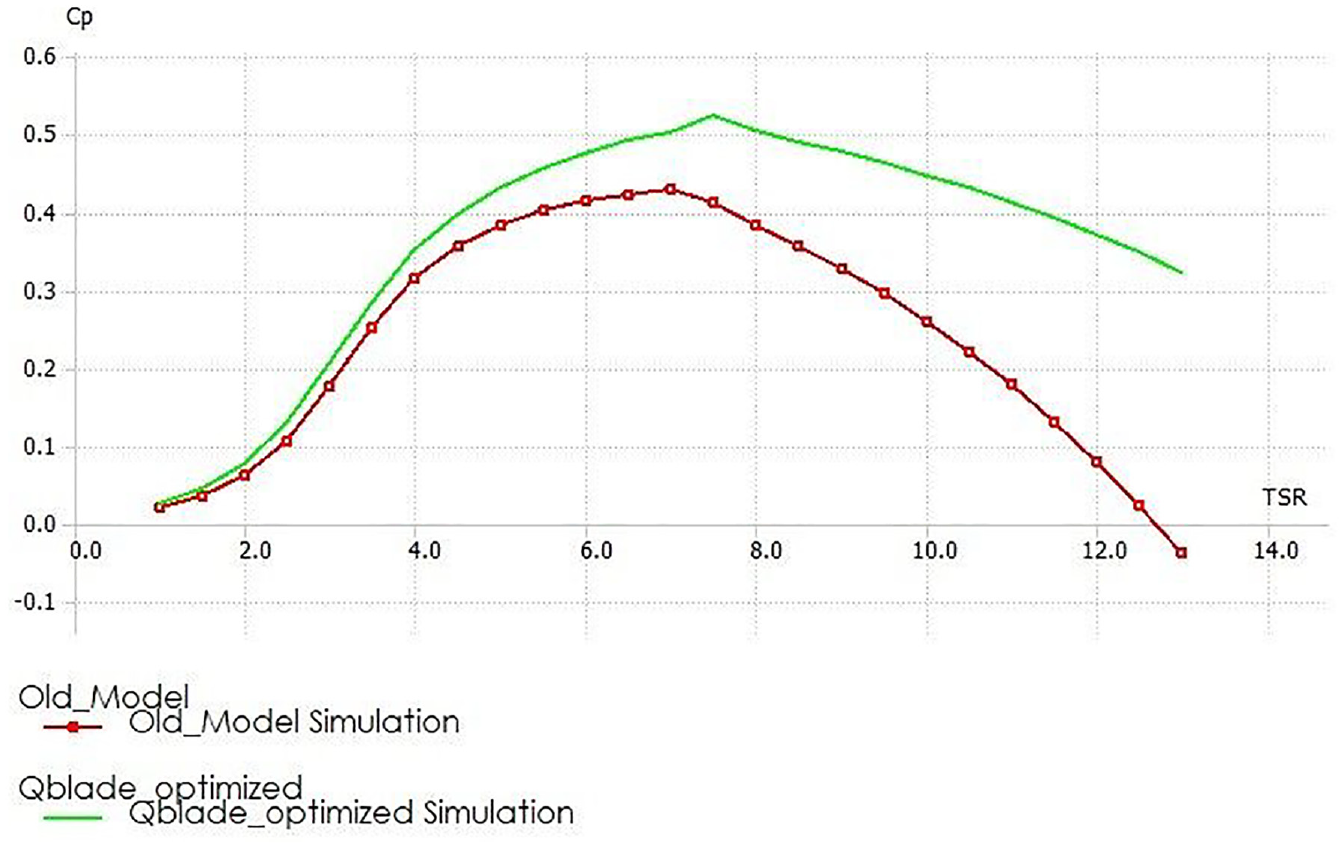
Power coefficient before and after optimization process.
The power value for the baseline airfoil was 491 W when the rotation speed was 235 rpm and the wind speed was 6 m/s at 7 tip speed ratio. On the other hand, the power value after optimization was 567.4 W and 265 rotation speed, with 7.5 TSR. Figure 17 displays the power and torque versus TSR before and after the optimization process for NACA4711 using QBlade software.
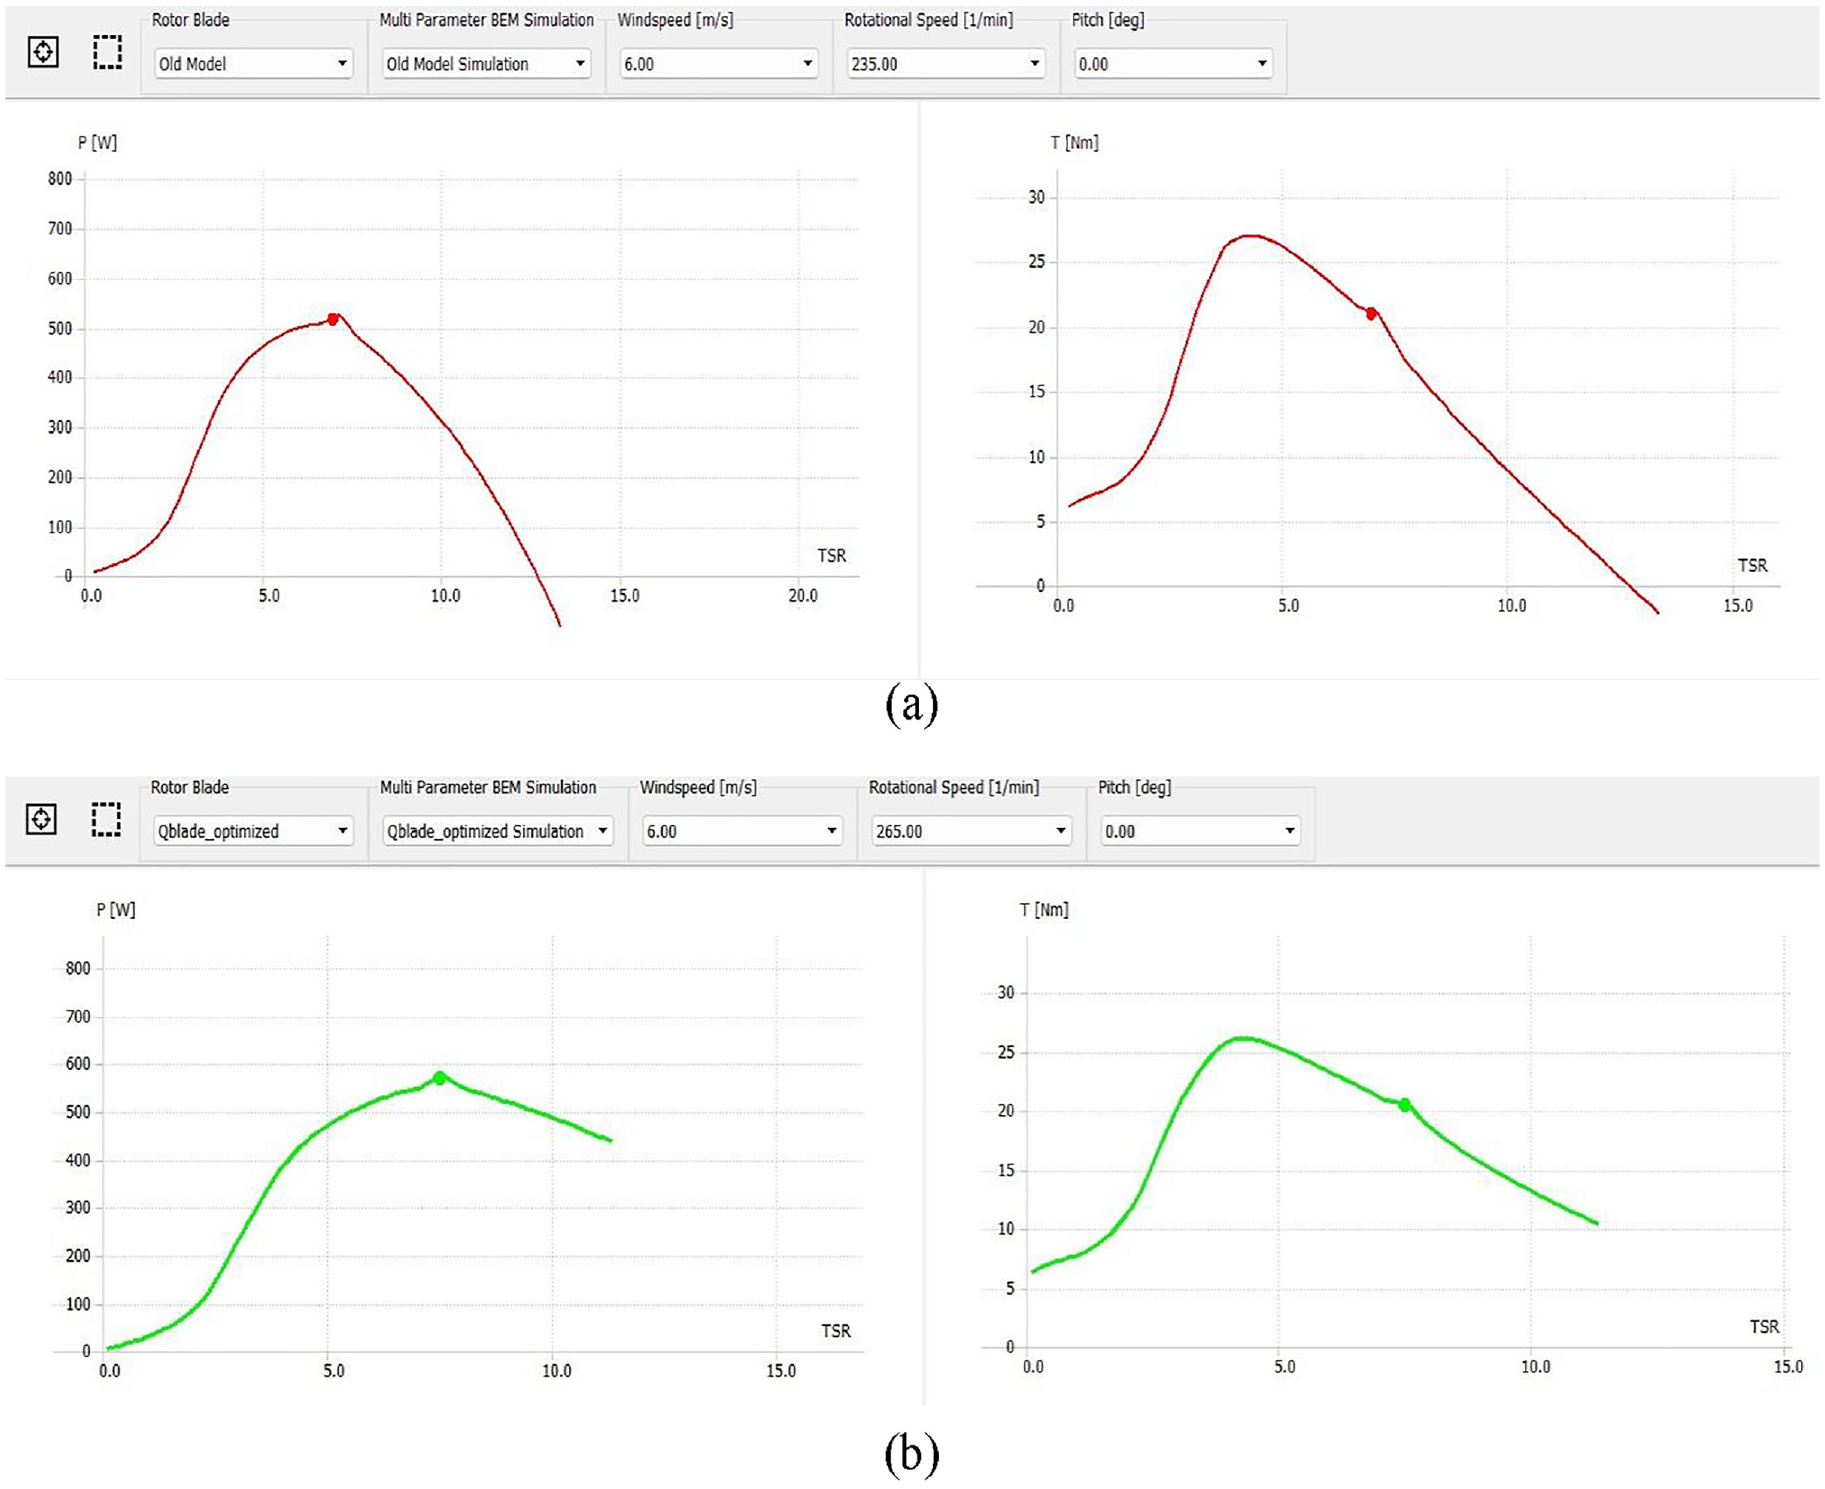
Maximum power curve and torque value with TSR in QBlade: (a) baseline NACA4711 and (b) optimized NACA4711.
SG6041 airfoil
Again when using QBlade software to analyze the SG6041 airfoil, the result was found a significant degree of similarity between these two programs. Figure 18 illustrates the curves’ behavior. It is easy to observe the difference between the thrust and power coefficient for the previous and new study. Figures 18 and 19 showed

Comparative analysis of the power coefficient and torque coefficient both before and after the optimization process between QBlade and MATLAB with the old model.

Comparative analysis between the old model and optimized design for the Ct curve (SG6041 airfoil).
The values of the power coefficient are higher after optimization compared to before which is 0.35. The rotor blade achieves its ideal efficiency by improving its twist angle and chord length, leading to an increased
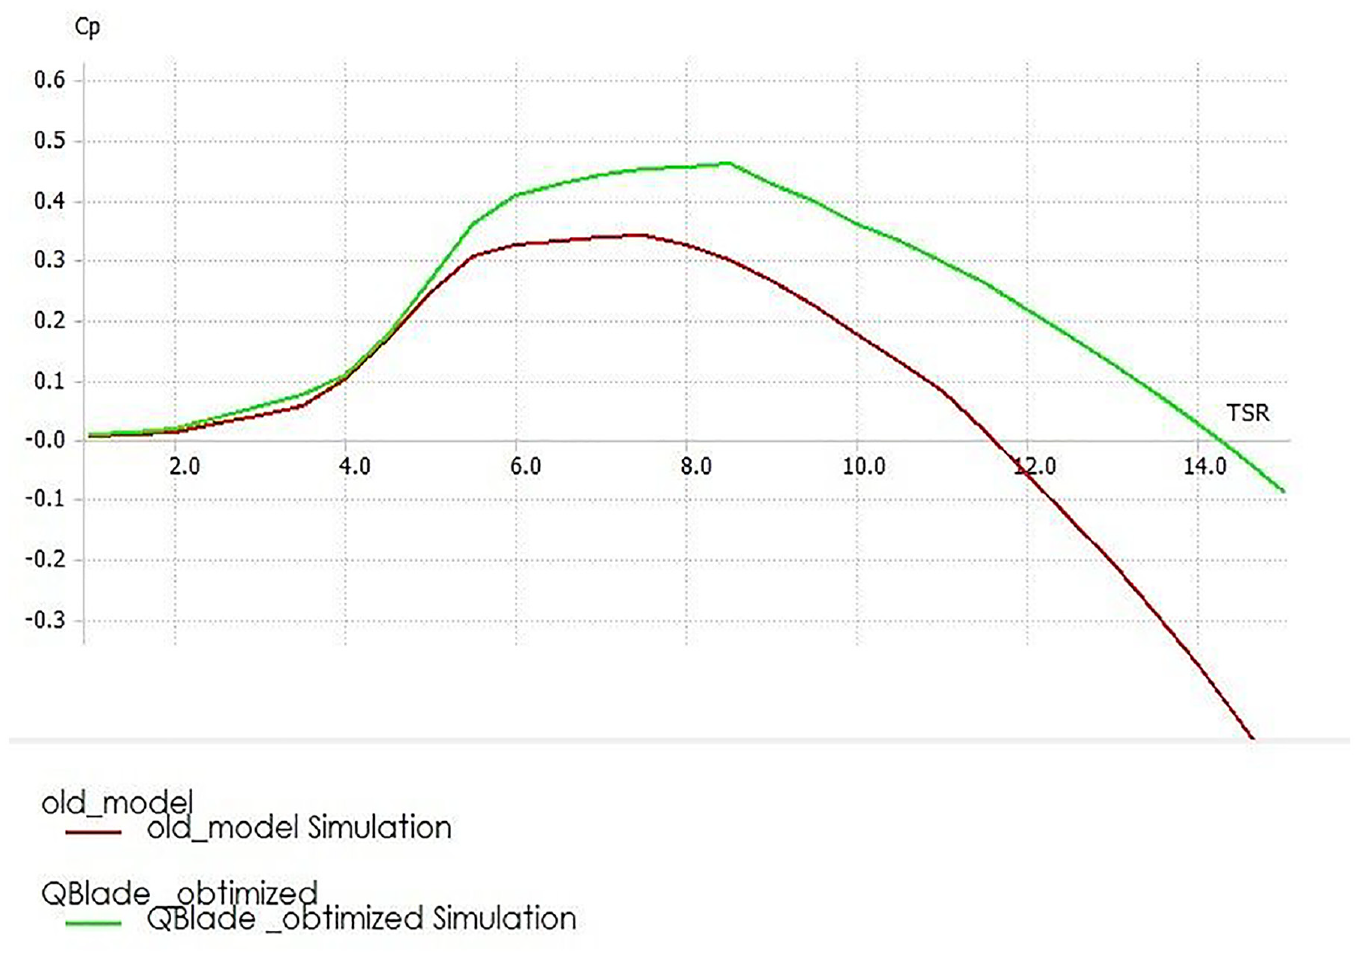
power coefficient before and after optimization process for SG6041 airfoil.
The power output for the baseline airfoil was 170 W at a rotation speed of 365 rpm and a wind speed of 6 m/s, corresponding to a tip speed ratio of 7. Conversely, the optimized power value was 226.6 W, with a tip speed ratio of 8.5 and a rotational speed of 450 rpm. These modifications made in the design of the blade were significant in achieving the ideal power of the wind turbine blade. Figure 21 illustrates the maximum output power of the blade before and after the optimization process.
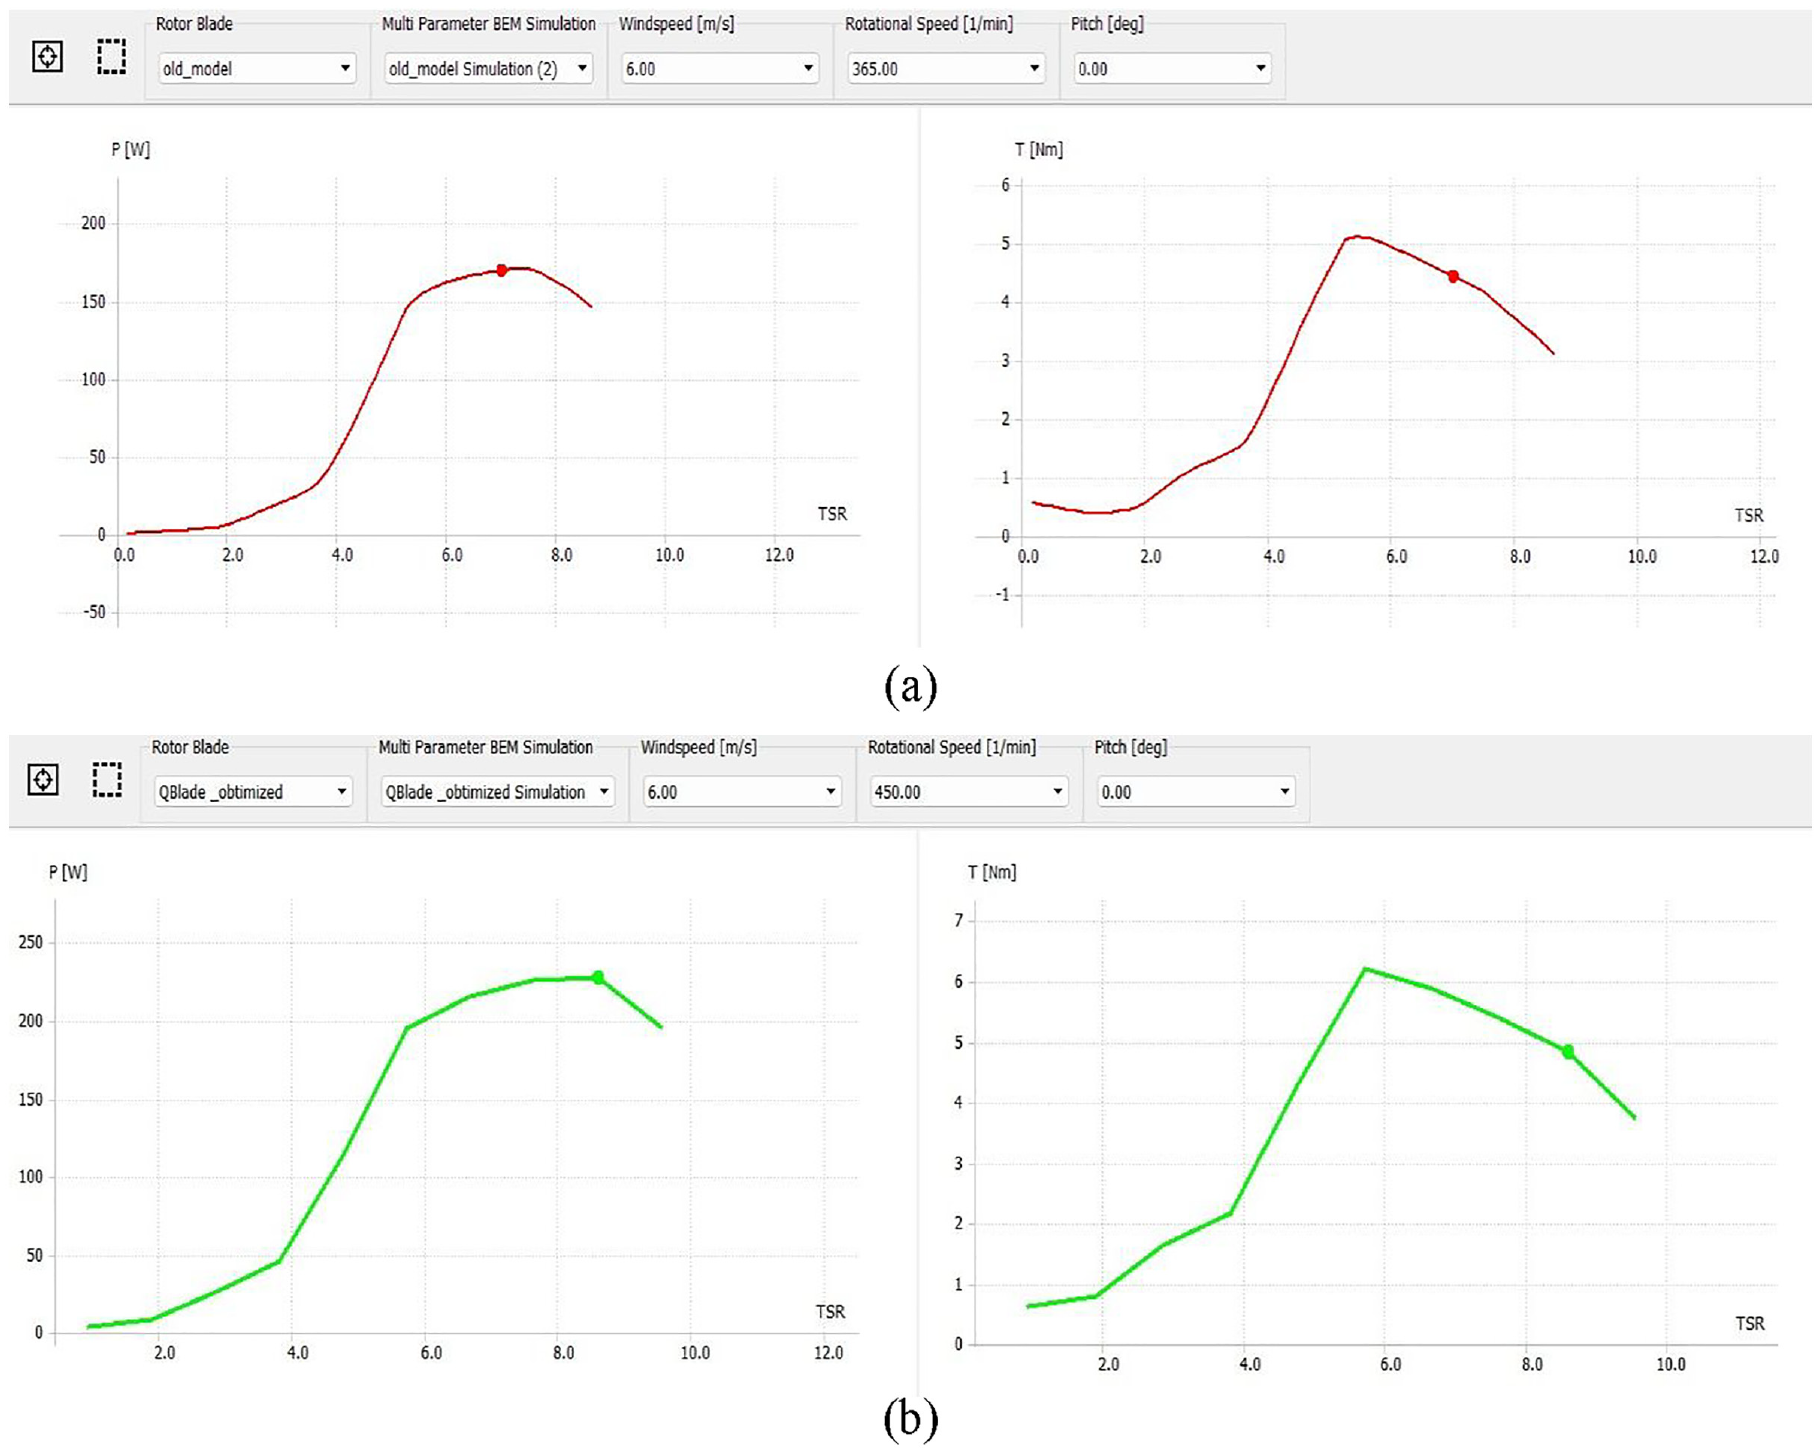
Maximum power curve and torque value with TSR in QBlade: (a) baseline SG604 and (b) optimized SG6041.
CFD result
Wind blade velocity
ANSYS Fluent analysis showed that the maximum velocity at the blade’s tip is higher than at the root, and axial velocity varied along the entire length of the blade; this is what the traditional wind turbine theory pointed out. Figure 22 illustrates that the local wind turbine blade velocity increases uniformly with radius because of the rotation of the blades. Furthermore, the legend bar showed a significant increase in air velocity, especially in optimized wind blades, and turbulence was noted around the blade’s tip. The cause is the blade’s rotational velocity, which satisfies the mass momentum principles of energy conservation.

Blade velocity analysis before and after optimization method: (a) baseline NACA4711, (b) optimized NACA4711, (c) baseline SG6041, and (d) optimized SG6041airfoil.
Wind velocity streamlines
The colorful lines illustrate the streamline flow, which indicates the direction and speed of the wind interacting with the turbine blade at any given moment. The consistent and uninterrupted streamlines in this case indicate that the flow is laminar, or non-turbulent. The wind velocity streamline illustrates the fluid domain velocity surrounding the three blades of the wind turbine. As shown in Figure 23, the optimized model (b and d) exhibits a reduction in the intensity of these vortices compared with the non-optimized one (a and c), which implies that the aerodynamic efficiency has been enhanced by minimizing energy losses in the wake. Notably, the legend bar in this figure shows a color progression beginning with blue, representing the minimum velocity, and concluding with red. Ultimately, there is a distinct acceleration of flow surrounding the wake, as indicated by the red color for the optimized models. All of these characteristics are consistent with the momentum and mass conservation theories.

Blade velocity streamlines before and after optimization technique: (a) baseline NACA4711, (b) optimized NACA4711, (c) baseline SG6041, and (d) optimized SG6041airfoil.
Pressure distribution
The pressure distribution throughout the blade’s surface is non-uniform. The pressure distribution on the blade surface, illustrated in Figure 24, indicates that the optimized blade produces greater pressure differentials between the suction and pressure sides as shown in the legend bar, especially near the blade root. This results in increased lift forces and, therefore, a greater power coefficient. The pressure gradient near the blade tips mitigates produced drag and enhances aerodynamic efficiency. Consequently, the optimized airfoils resulted in higher aerodynamic properties for the blade design of the wind turbine.

Pressure distribution before and after optimization method both NACA4711 and SG6041 airfoils: (a) baseline NACA4711, (b) optimized NACA4711, (c) baseline SG6041, and (d) optimized SG6041.
Pressure contours
Figure 25 illustrates the simulation results of the pressure on the upper and lower surfaces of both the baseline and optimized airfoils at a wind speed of 6 m/s at the blade tip. A substantial low-pressure zone exists around the upper surface of the airfoil. This is logical due to the cambered NACA 4711 and SG6041 airfoils. Figure 25(b) and (d) illustrates that the optimized airfoil exhibited greater negative pressure on its upper surface compared to the old airfoil, resulting in increased lift for the optimized design. As a result, the airfoil was effectively elevated perpendicular to the incoming flow stream. The optimized airfoils yielded superior aerodynamic characteristics for the wind turbine blade design.

Pressure contour observation before and after optimization method: (a) baseline NACA4711, (b) optimized NACA4711, (c) baseline SG6041, and (d) optimized SG6041 airfoil.
Comparing the optimized and non-optimized models shows a significant improvement in flow characteristics. The optimized design reduces the extent of flow separation near the trailing edge, resulting in more efficient energy conversion. The vortex shedding in the wake of the turbine is also reduced, indicating less energy loss and improved overall performance. These improvements are reflected in the higher power coefficient for the NACA4711 and, SG6041 airfoil compared to the non-optimized blade.
Torque calculation
The torque value for SG6041 optimized was 1.57633 for one blade and 4.73 for three blades while the torque for NACA4711 optimized was

Computation of torque in the CFD calculator before and after optimization process: (a) baseline NACA4711, (b) optimized NACA4711, (c) baseline SG6041, and (d) optimized SG6041airfoil.
The values of the power coefficient are as follows:
For NACA4711 airfoil.
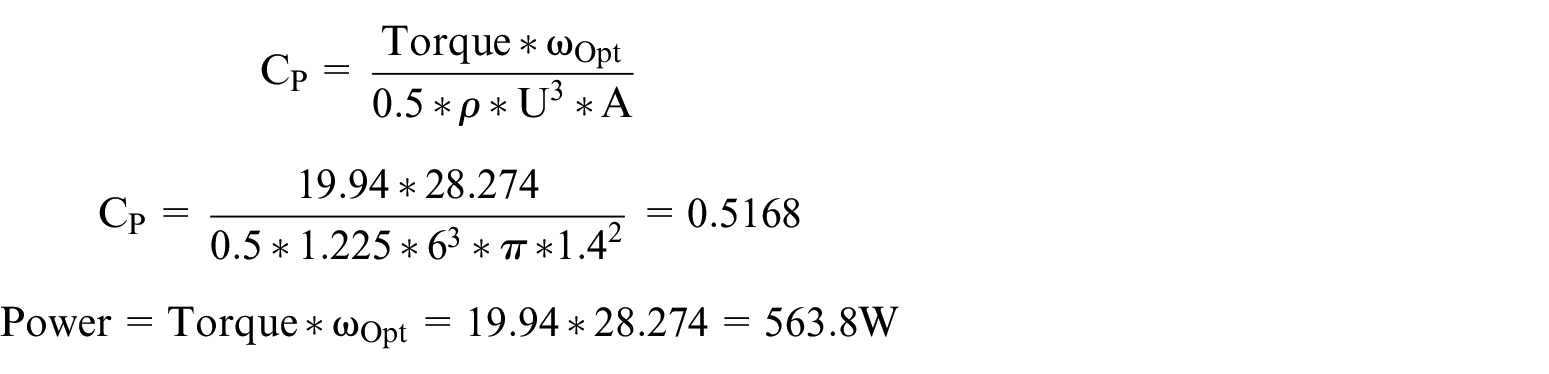
Similarly
The Power coefficient, for SG6041 airfoils

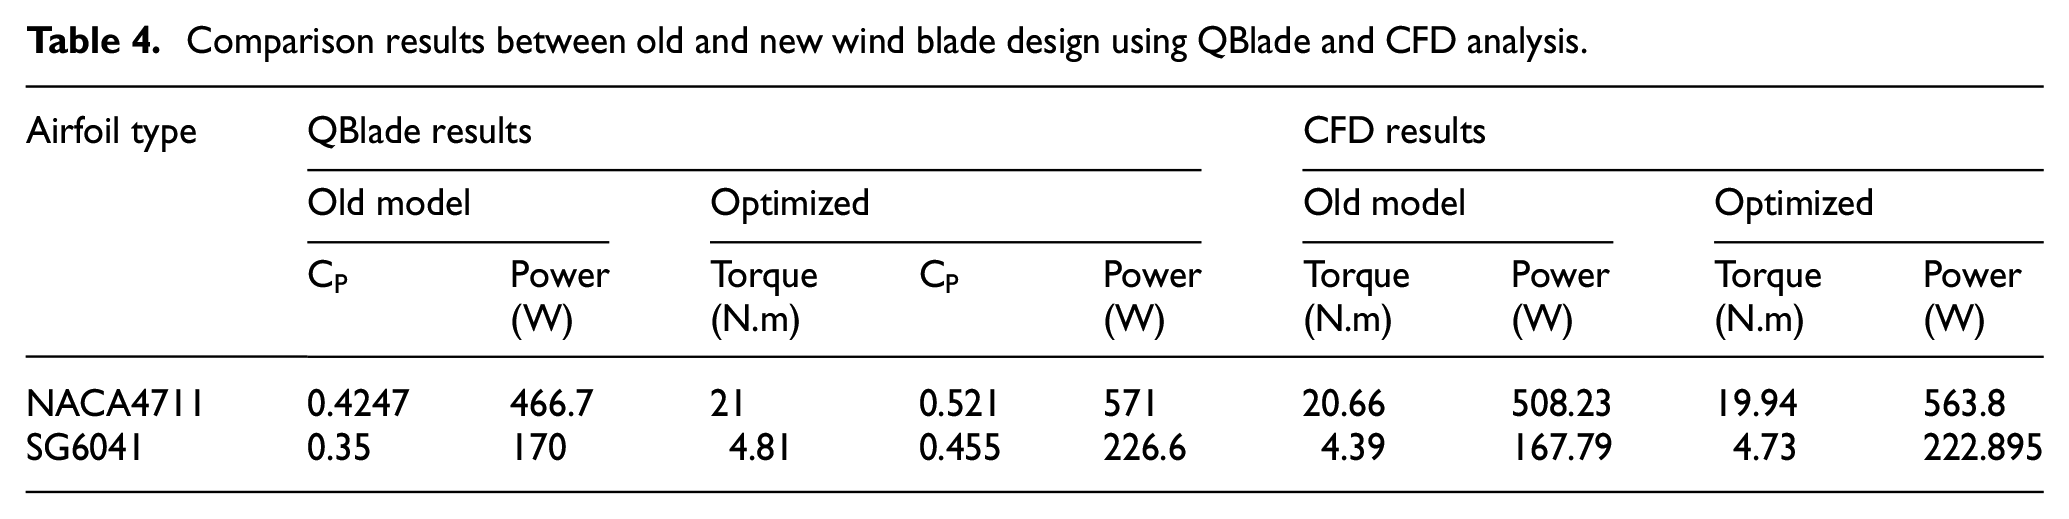
Our results have been compared to those derived from previous theoretical works in order to validate the proposed approach, and they have been determined to be in strong agreement. The present and compared projects were conducted under comparable circumstances. In the simulation work conducted by Altmimi et al. (2022) and Mühle (2018). Table 4 displays the comparison results in terms of power coefficient, output power, and torque. The data presented above indicate that
Comparison results between old and new wind blade design using QBlade and CFD analysis.
Comparison between software tools
Several potential sources of error were identified in the analysis. First, the discretization of the wind turbine blade into 10 and 20 segments may introduce inaccuracies in capturing the full aerodynamic behavior. Mesh resolution in ANSYS was refined, but coarser meshes can result in discretization errors. Additionally, modeling assumptions made in Blade Element Momentum Theory (BEMT) simplify the flow field around the blade, potentially reducing accuracy.
To quantify the numerical error, a mesh convergence study was performed, and results were compared across MATLAB, QBlade, and ANSYS simulations. The relative error between the power coefficients calculated in ANSYS and QBlade was found to be within 1% for NACA4711 and 1.78% for SG6041. This suggests that while the tools produced consistent results, finer meshing and increased segmentation of the blade could reduce discrepancies further.
Conclusions and remarks
This study report provides a comprehensive analysis and improvement of the performance and behavior of a small horizontal-axis wind turbine blade that has previously been optimized and published. The wind turbine blade was simulated using MATLAB® 2020 and the QBlade software v0.963 under certain operational circumstances.SG6041 and NACA4711 have been selected for use at a different values of Reynolds number. 10 and 20 distinct parts were extracted from the length of the blade for SG6041 and the 4711NACA airfoil respectively. The rotor achieved its best performance when the tip speed ratio was 7.5 for the 4711NACA airfoil and 8.5 for SG6041. Upon comparing the QBlade and CFD results, it was determined that the QBlade results closely resemble the CFD results. The variation percentage between this two software for HAWT configuration is less than 2%. The results obtained from utilizing Matlab, QBlade, and CFD exhibited a high degree of resolution. Hence, it can be deemed that this approach is among the most crucial techniques for constructing and optimizing the blades and rotors of various wind turbines.
Footnotes
Acknowledgements
The authors express their gratitude to the Department of Mechanical Engineering at the College of Engineering at Urmia University for their support in the provision of all new software, including Ansys, Solidworks, Matlab, and Qblade, for the analysis of the wind turbine blade.
Declaration of conflicting interests
The author(s) declared no potential conflicts of interest with respect to the research, authorship, and/or publication of this article.
Funding
The author(s) received no financial support for the research, authorship, and/or publication of this article.